Review

Patterned Photoalignment in Thin Films: Physics and Applications

1
School of Physics and Optoelectronic Engineering, Foshan University, Foshan 528325, China
2
Department of Theoretical Physics, Moscow Region State University, 141014 Mytishi, Russia
3
Nanjing Nanhui Intelligent Optical Sensing and Manipulation Research Institute Co. Ltd., Nanjing 210093, China
4
Department of Medical Physics and Informatics, Bashkir State Medical University, 450008 Ufa, Russia
5
School of Instrumentation and Optoelectronic Engineering, Beihang University, Beijing 100191, China
*
Author to whom correspondence should be addressed.
Crystals 2021, 11(2), 84; https://doi.org/10.3390/cryst11020084
Submission received: 5 January 2021 / Revised: 15 January 2021 / Accepted: 20 January 2021 / Published: 21 January 2021

Abstract

:
Photoalignment of liquid crystals by using azo dye molecules is a commonly proposed alternative to traditional rubbing alignment methods. Photoalignment mechanism can be well described in terms of rotational diffusion of azo dye molecules exposed by ultraviolet polarized light. A specific feature of the irradiated light is the intensity dependent change of azimuthal anchoring of liquid crystals. While there are various mechanisms of azo dye photoalignment, photo-reorientation occurs when dye molecules orient themselves perpendicular to the polarization of incident light. In this review, we describe both recent achievements in applications of photoaligned liquid crystal cells and its simulation. A variety of display and photonic devices with azo dye aligned nematic and ferroelectric liquid crystals are presented: q-plates, optically rewritable flexible e-paper (monochromatic and color), and Dammann gratings. Some theoretical aspects of the alignment process and display simulation are also considered.

1. Introduction

Enormous nonlinearities in liquid crystals (LCs) have sparked intense efforts on a wide range of nonlinear optical phenomena. New materials, structures, and phenomena are setting new milestones, record-breaking performance characteristics, and interesting fundamental issues in material or optical physics, which are being constantly uncovered [1,2,3]. Advanced alignment techniques of LCs can be useful in fabrication of modern optical devices [3,4].
Anisotropic interaction between liquid crystal and the aligning surface determines the direction of the easy alignment axis of LC on the aligning surface. Director of LC coincides with the direction of the easy axis if the director is not affected by any elastic torque. The easy axis is given by azimuthal φ and polar θ angles. Alignment strength is related to anchoring energy. The anchoring energy comprises two contributions, which are related to the director tilt in the azimuthal plane (azimuthal anchoring energy, Wφ) and the tilt in the polar plane (polar anchoring energy, Wθ). As it turned out, Wφ can be controlled by polarized ultraviolet light if one of the substrates is spin-coated by azo dye [5]. One of the crucial technological problems is to get uniform planar or tilted alignment of LCs with the required pretilt angle and anchoring energy and high alignment stability. One of the promising non-contact alignment methods, photoalignment, can utilize the polarized light to generate anisotropy on the substrate surface, which overcomes undesired effects [6,7].
At present, surface treatment can be carried out with several approaches: rubbing with polyimide compounds [8], photoalignment [9], reactive monomers [10,11], and silicon oxide evaporation [12]. High alignment quality and defect-free alignment surfaces make the photoalignment technology attractive for further investigation [13].
Photoalignment technology provides effective control of main anchoring parameters: easy alignment axis, pretilt angle, and anchoring energy [14]. Consider main advantages of photoalignment over the rubbing technology. First, non-contact technology does not produce electrostatic charges or mechanical defects on the substrates. Secondly, elimination of undesired defects enables researchers to develop advanced photonic applications of liquid crystals, which are impossible with the rubbing technique.
The range of potential applications of photoalignment can be extended to many photonic devices and display technologies. Highlighting the main trends of this development was impossible in our previous review article [15]. In this review, we focus on potential applications of patterned photoalignment, which were mainly suggested by the group of the Hong Kong University of Science and Technology. In particular, we focused on our previous theoretical achievements of the diffusion mechanism of photoalignment, which are described in Section 2. In Section 3, we consider fundamentals of patterned photoalignment to q-plates and devices with reconfigurable optical paths. In Section 4, we consider applications of photoalignment to e-paper displays (monochromatic and color) and Dammann gratings, which has wide applications in optical information systems. Section 5 makes some concluding comments.

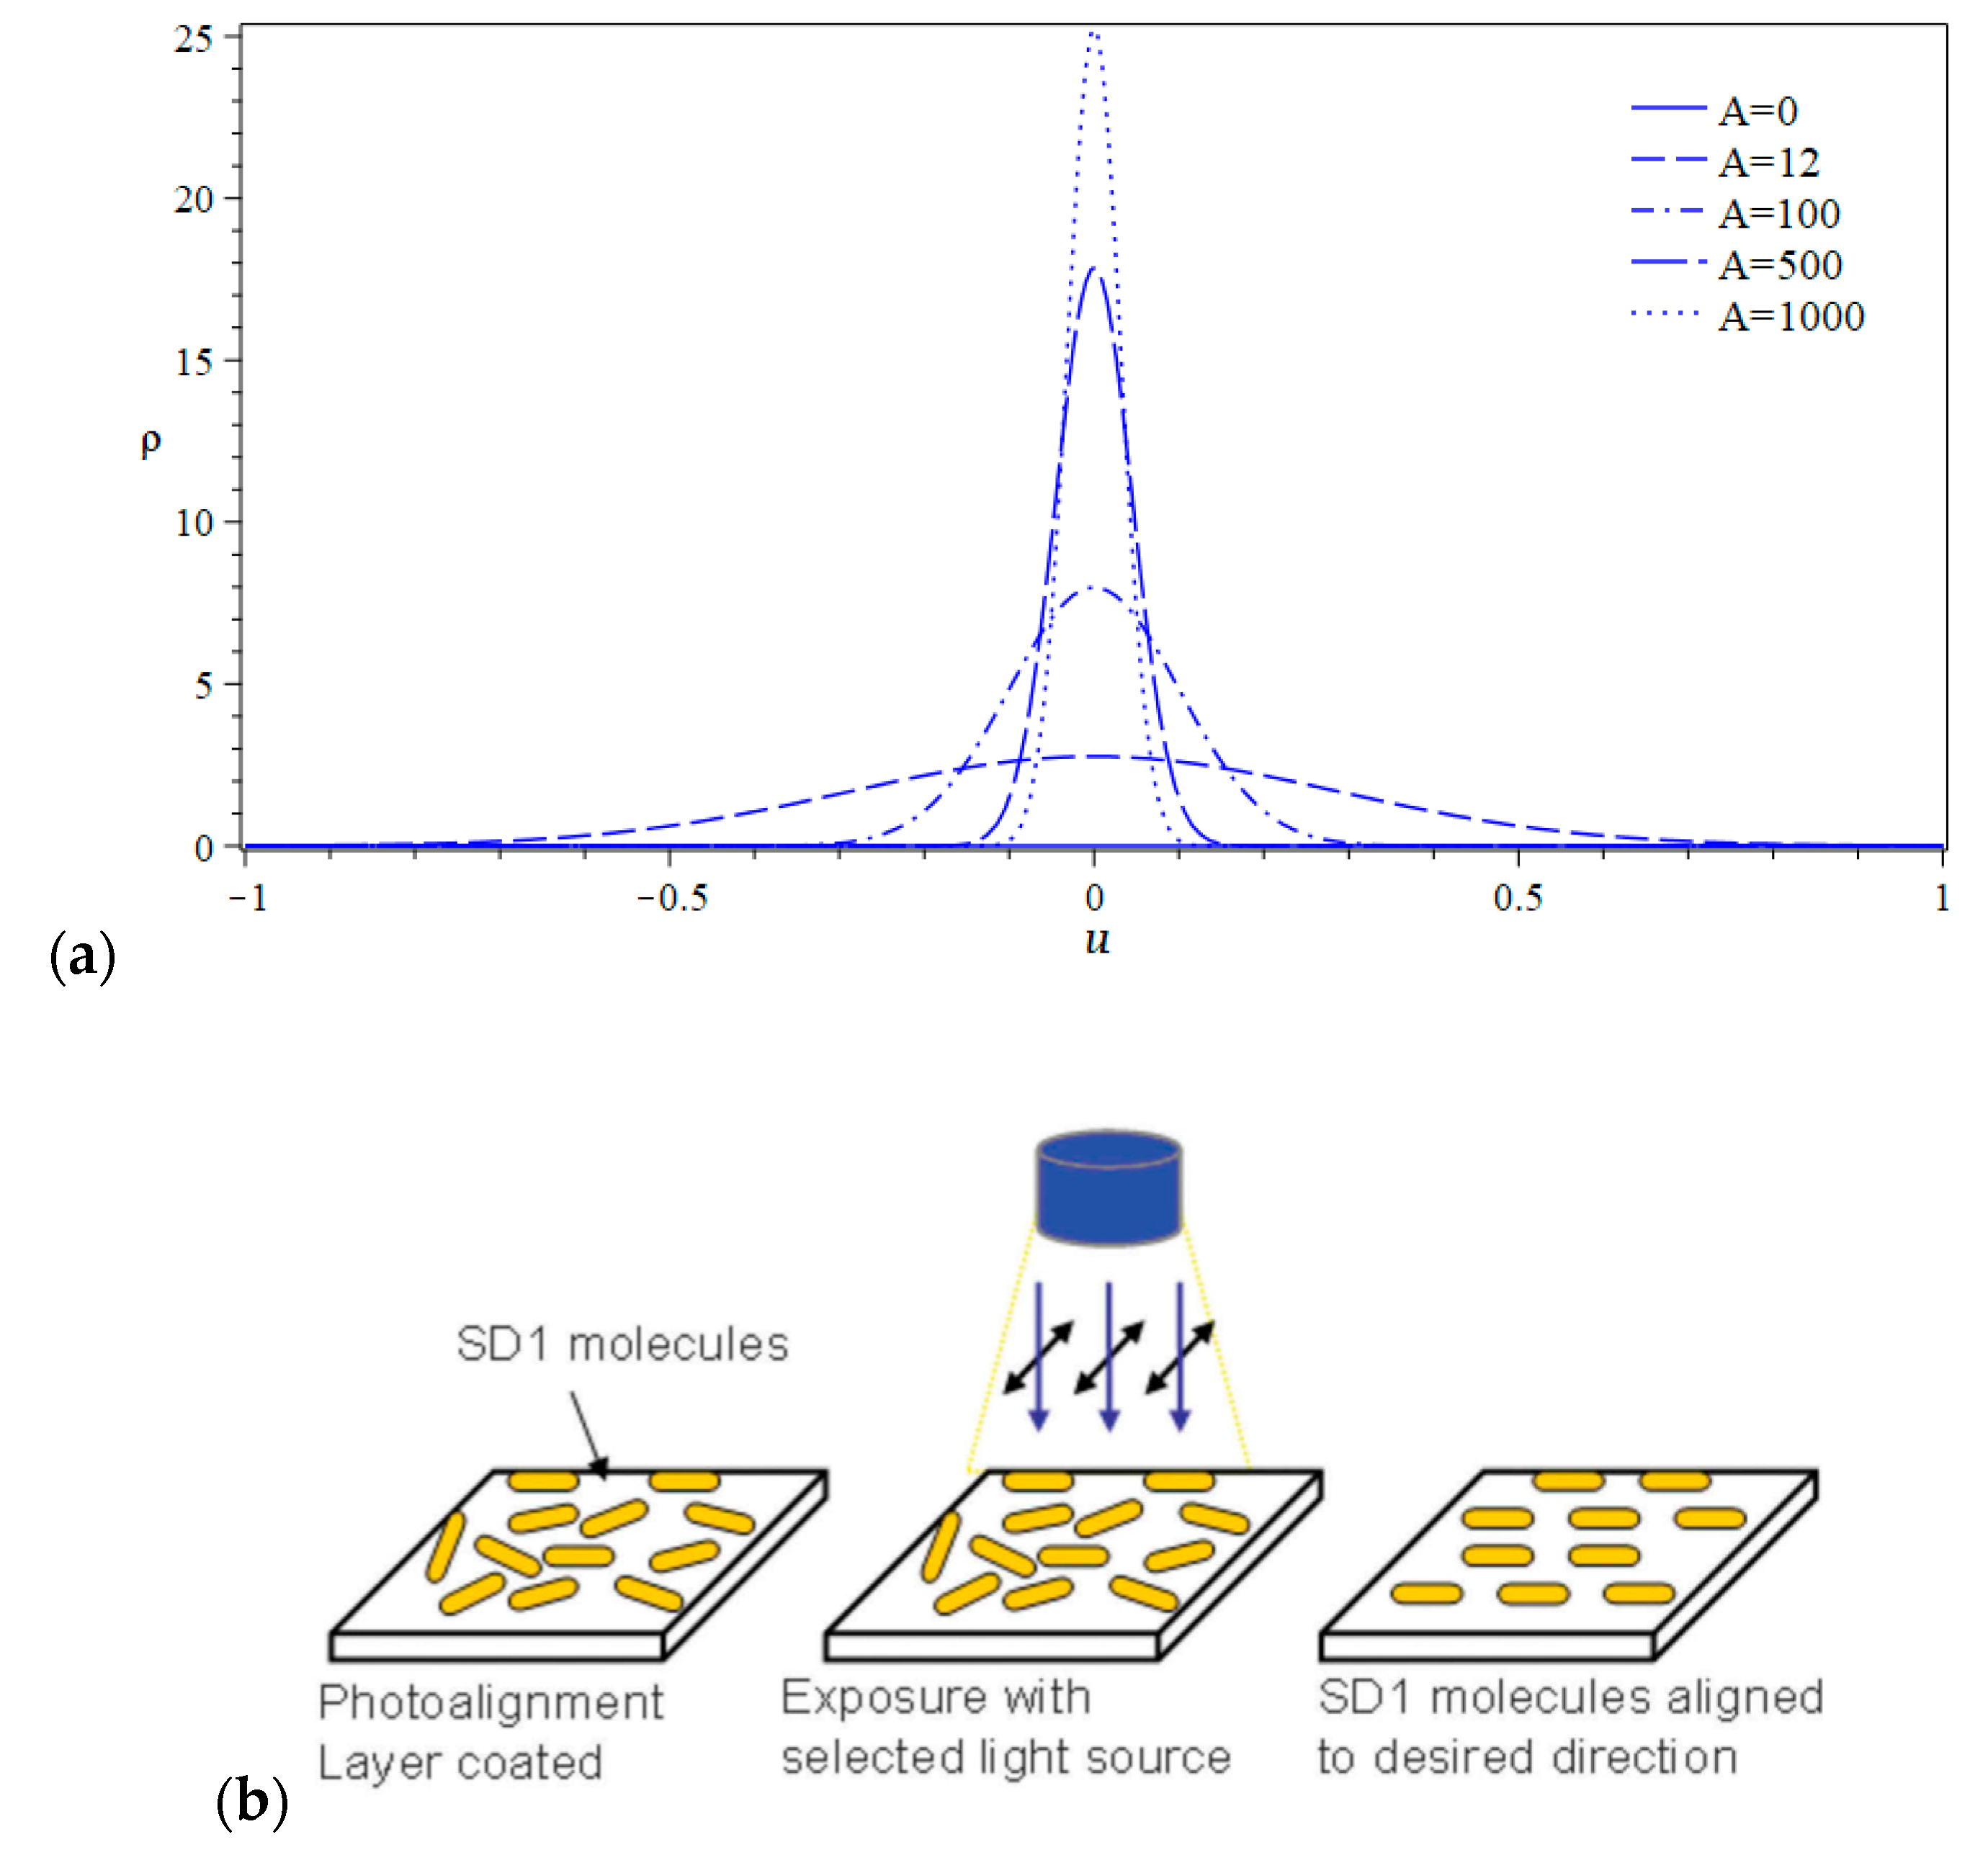
2. Diffusion Mechanism of Photoalignment

Assume that azo dye molecules are in thermal equilibrium, and the incident ultraviolet (UV) light makes them twist, then the potential energy has the form U = Φ k T , where T is the absolute temperature, k is the Boltzmann constant, and Φ is the relative potential energy. As the starting point to describe the orientational diffusion, the Boltzmann–Smoluchowski equation can be used. This equation describes optical Kerr effect in initially isotropic liquids or rotating diffusion of solutions of rod-like macromolecules [16,17]. If azo dye molecules are considered as rod-like structures with cylindrical symmetry, then only one independent coordinate is needed to determine the diffusion process. Let the polar angle θ (angle between the molecular absorption oscillator and the polarization plane of the incident light) be the independent coordinate. Then, the potential energy of the activating light will also be the function of angle θ, i.e., Φ = Φ ( θ ) . Here, the potential energy plays the role of a certain potential, which tends to make azo dye molecules to rotate because of the exposed light with intensity I. Consequently, equation of orientational diffusion can be written as follows [18]:
2 Φ θ 2 + θ ( f Φ θ ) = 1 D f t , Φ = A 2 cos 2 θ , A = α τ I V M k T ,
where τ is the relaxation time, i.e., time of “cooling” of azo dye molecule and its surroundings; α (cm−1) is the absorption coefficient; f is the probability density function, which describes the twist of molecules in a certain plane; D is the diffusion coefficient; and VM is the molecular volume of azo dye. Note that parameter A is directly proportional to the light intensity, i.e., one can different values of A to characterize the light intensity. Complex nature of molecular kinetics and intermolecular interactions make theoretical estimation of τ impossible. It can only be experimentally measured.
It should be remarked that the proportionality between the potential energy Φ k T and the light intensity I must be assumed. Meanwhile, the light intensity is determined by the number of the absorbed photons by the azo dye molecule.
Depending on the sign of A, molecular orientation occurs either at the angle θ = π/2 (A > 0) or θ = 0, π (A < 0). Azo dye molecules absorb luminous energy during the relaxation time τ, which exceeds the potential barrier between its two orientational states.
Assuming azimuthal symmetry of the azo dye molecular orientation, the probability density function can be written as follows:
f = f ( θ , t ) = 1 2 ρ ( u . t ) , u = cos θ
The meaning of function f ( θ , t ) is the description of movement of molecules. After elementary mathematical manipulations, one can get the distribution function ρ ( u ) for the saturated solution, i.e., t . Theoretical estimations show that for A 1 , function ρ ( u ) tends to the normal distribution, which is depicted in Figure 1a. Schematic representation of the photoalignment technique for different light intensities is shown in Figure 1b.
The relative order parameter can be estimated for the case when A 1 and A 1 . It turns out that the order parameter s is directly proportional to the light intensity I. All analytical evaluations were experimentally verified. The idea of the experiment was that the photoinduced phase retardation is proportional to the anisotropy of the azo dye polarizability. Thus, measurement of the phase retardation can be compared with its numerical evaluation.
Thus, the discussed model can effectively describe the formation of photoinduced alignment of azo dye layers. However, the diffusion mechanism does not involve any photochemical or structural transformation of azo dye molecules. Below, we describe application of this technique for fabrication of optical elements.

3. Patterned Alignment
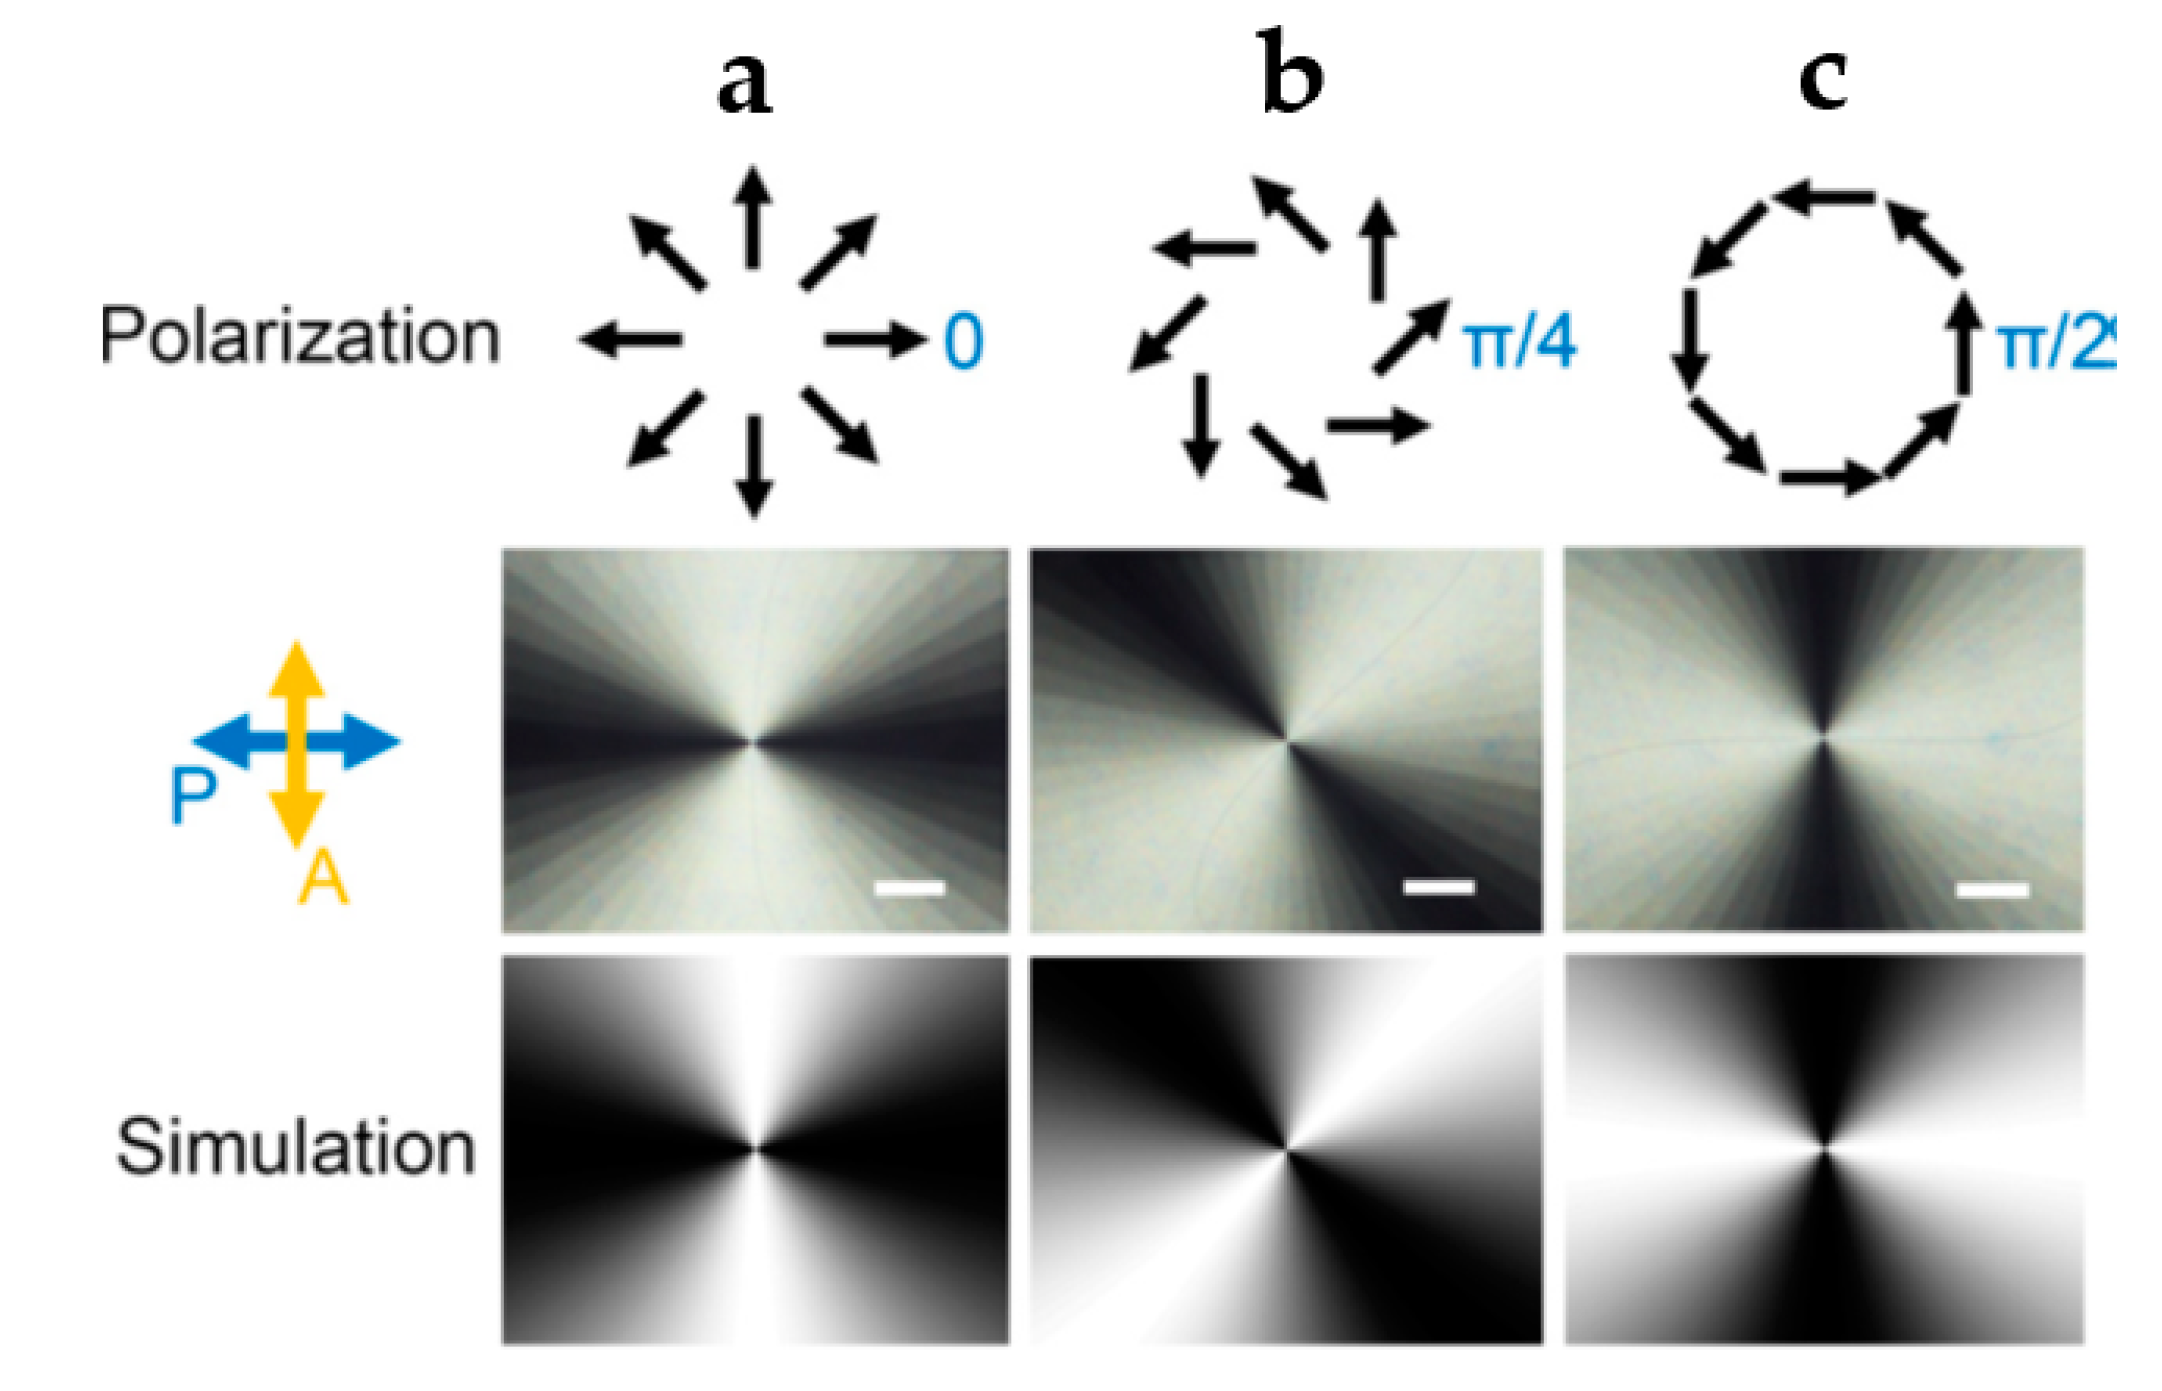
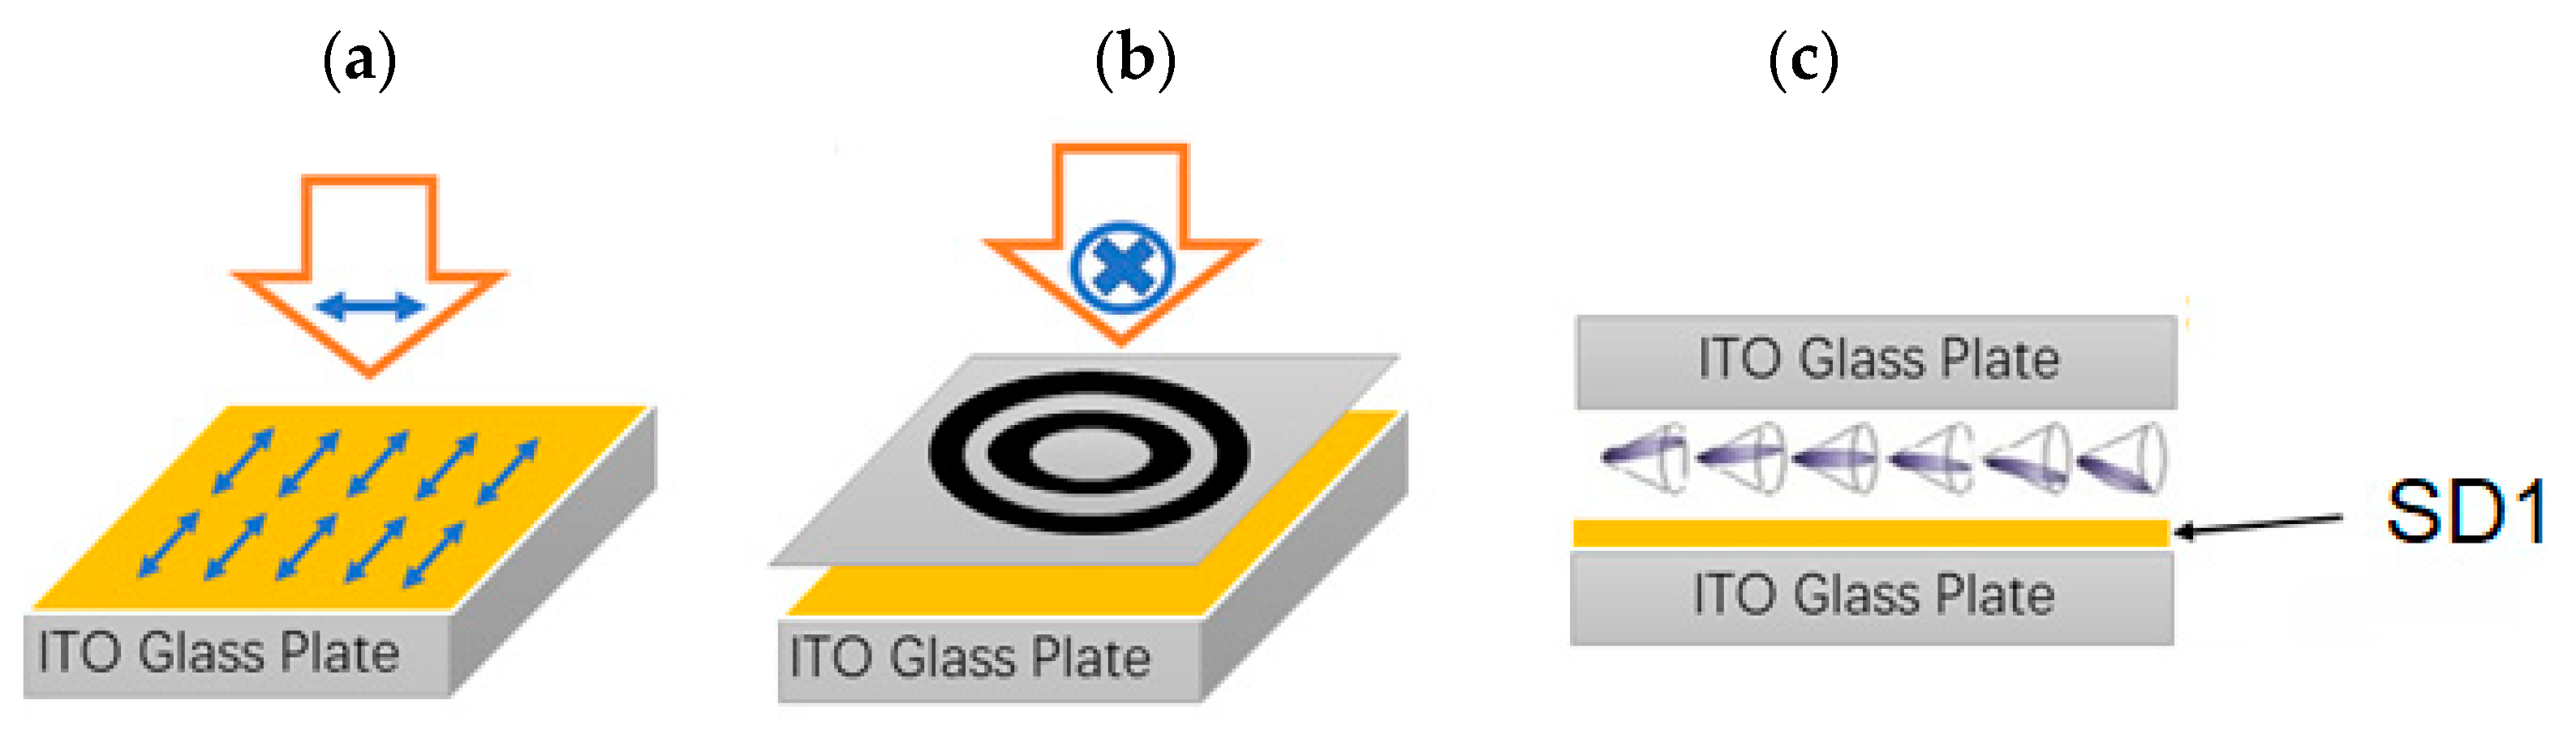
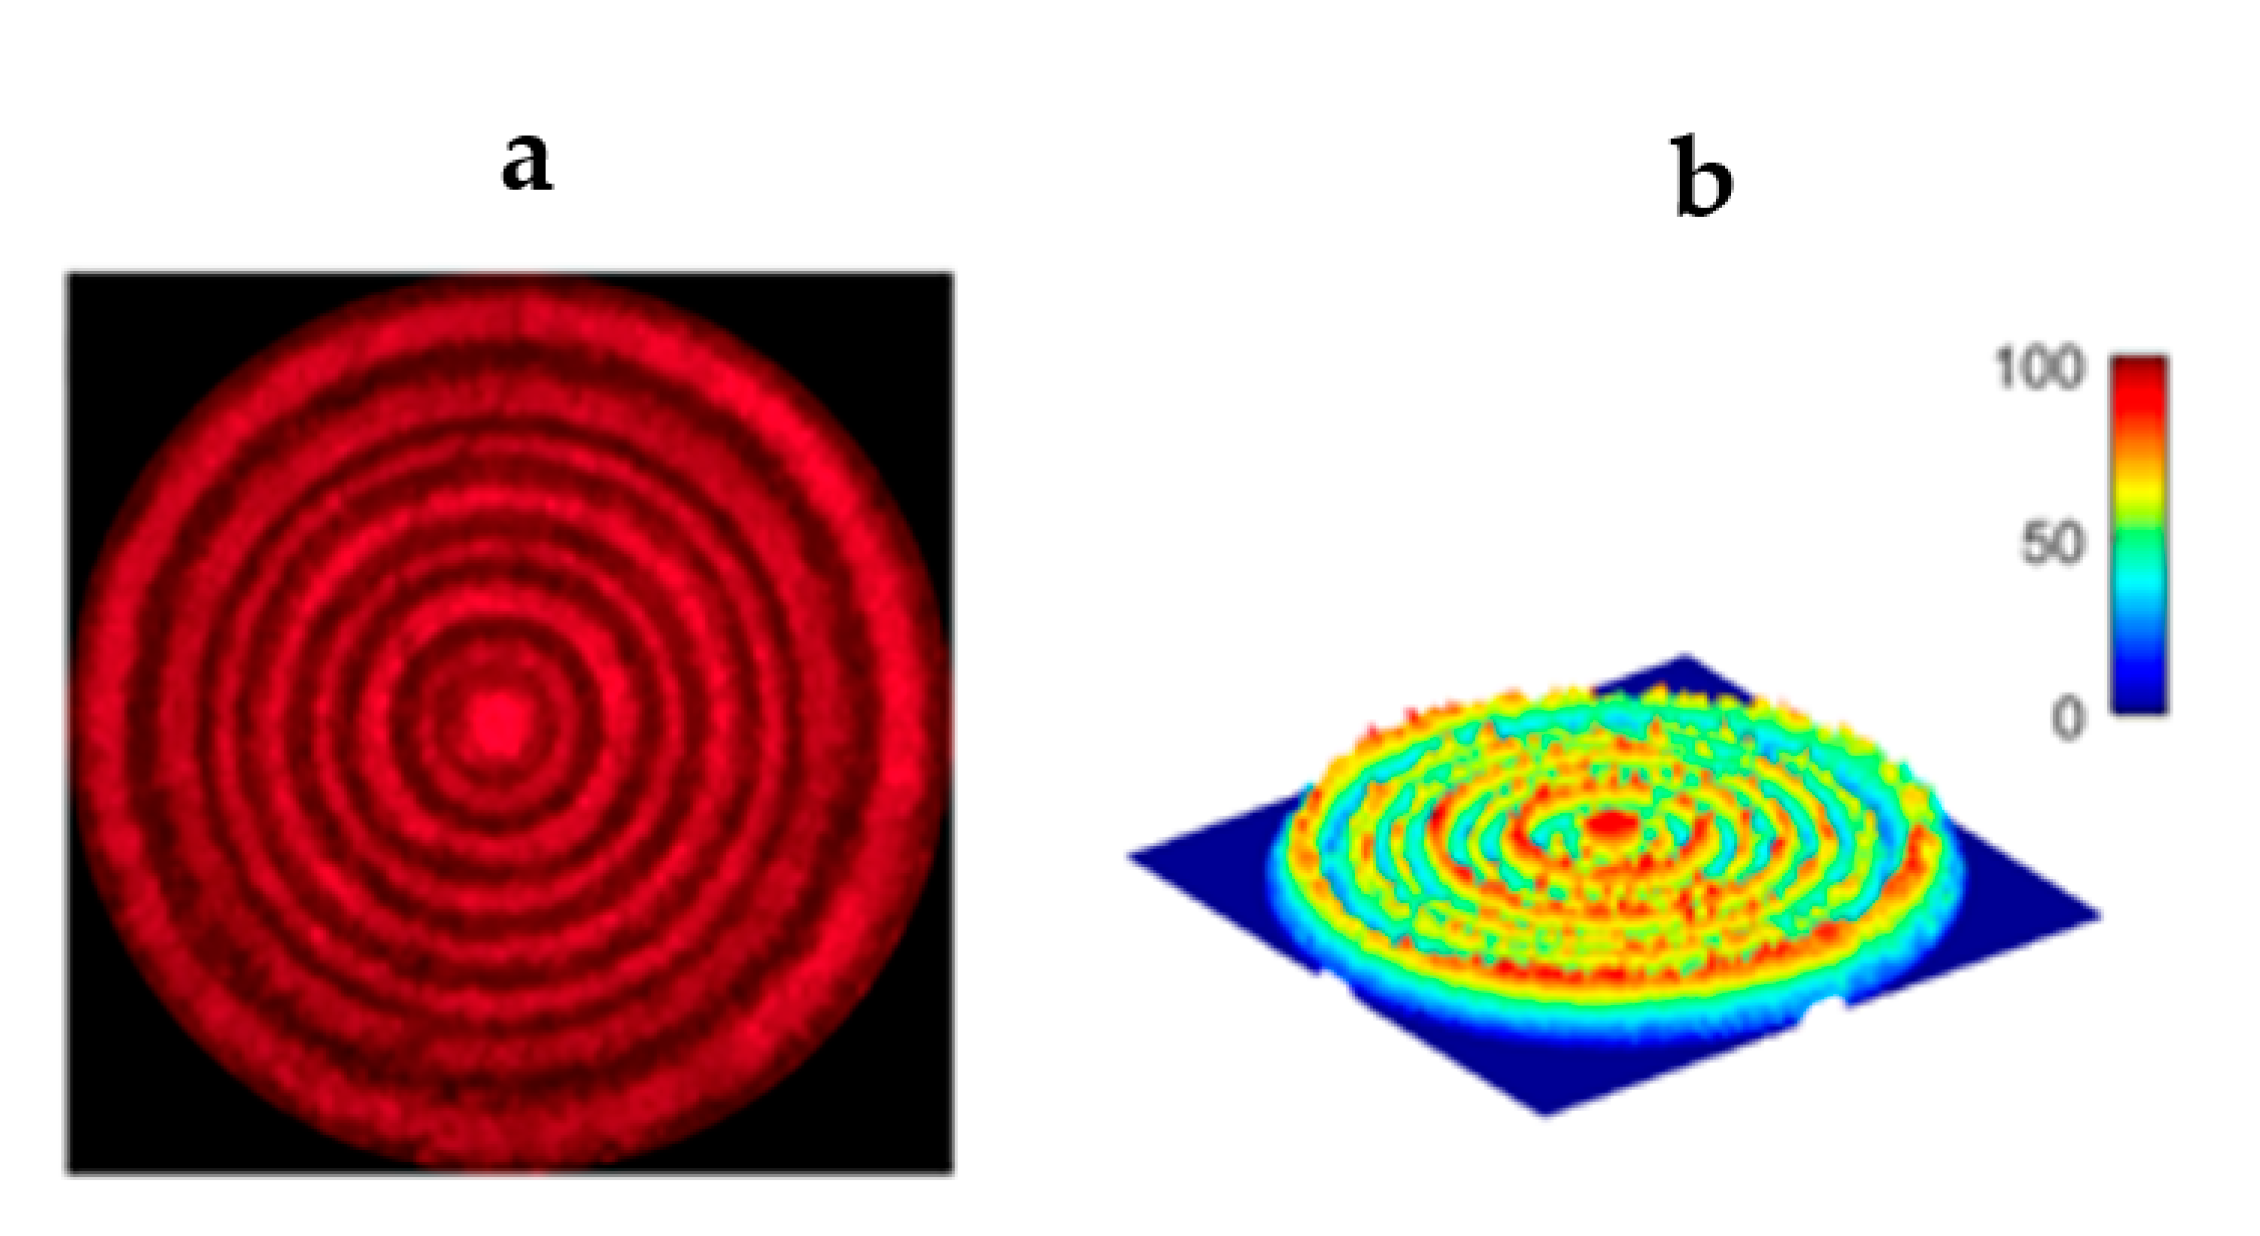
3.1. LC Q-plates

Vector beams (VBs) are characterized by spatially variant polarization states, which have been widely applied in laser processing, laser manipulation, microscopy, and nonlinear spectroscopy. In comparison with homogeneously polarized beams, VBs have high level of polarization symmetry, which can give rise to unique high numerical-aperture focusing properties [19]. In particular, VB with radial polarization can be focused on a small area with strong and localized longitudinal electric field component. This opens the potential to obtain high-resolution images.
It is known that when a radially polarized beam enters axially symmetric metal/dielectric structures, high-energy surface plasmons are excited. Consequently, optimal plasmonic focusing can be achieved [20].
Below in this paragraph, we focus on LC polarization converters and the corresponding vector-photoaligned q-plates, which are suitable for arbitrary VB generation [21]. Q-plates can be fabricated with structured metamaterials, with elements based on geometric phase holograms [22] or with LC materials [23]. Q-plates with LC materials have the possibility to tune the retardance and be operative at different wavelengths.
The converters represent twisted nematic (TN) cells with one uniformly aligned substrate, while the other is characterized by space variant alignment states. A dynamic micro-lithography system [24] can be used to make photoalignment. This approach enables us to fabricate various types of polarization converters. In addition to traditional radially/azimuthally polarized light, high-order and multi-ringed VBs and even VB arrays with different orders can be generated. This converter can be used as polarization mask to make photoalignment and to obtain a q-plate [25].
Polarization distribution φ of VB can be described as follows:
φ ( θ , r ) = P × θ + φ 0
where θ and r are the azimuthal and radial coordinates, respectively; P is the polarization order (number of polarization rotations per circle); and φ0 is the initial polarization direction for θ = 0.
For a TN cell with the twist angle Φ, the polarization guiding effect is valid for Φ 2 π Δ n d / λ (Mauguin condition), where Δ n is the birefringence of LC, d is the thickness of LC layer, and λ is the wavelength of the irradiated light [26]. According to this condition, linearly polarized incident light with the polarization plane either parallel or perpendicular to the LC director on the front substrate will be rotated by angle Φ. The output polarization will be determined by using local director orientation on the rear substrate. Consequently, through the design of the director alignment on the rear substrate according to Equation (1), and keeping uniform alignment on the front substrate, corresponding VBs can be converted.
The designed space-variant LC orientations can be obtained by using photopatterning with dynamic micro-lithography [27]. Polarization-sensitive and rewritable sulphonic azo dye SD1 (Dai-Nippon Ink and Chemicals Inc., Tokyo, Japan) can be used for the alignment of LCs. After exposing the surface coated with the azo dye film, its molecules tend to twist long axes of LCs. The designed space-variant orientations were recorded on SD1 by using the multi-step partially overlapping exposure process. Excellent image output capability of the technique enables arbitrary LC orientations to be easily generated. Figure 2 shows typical cases for φ 0 = 0 , (b) φ 0 = π / 4 , and (c) φ 0 = π / 2 , and π/2 (top row). Such polarization converters can be viewed under a microscope with crossed polarizers, and the captured micrographs are depicted in the middle row. Fan-like images with dark and bright areas correspond to the output polarization state perpendicular and parallel to the analyzer axis, respectively. The obtained results are consistent with theoretical simulations, which were obtained from the Jones matrix formalism [26].
The described structure of LC polarization converter is capable of generating arbitrary set VBs. This technique is suitable for joint use of polarization-sensitive alignment and dynamic micro-lithography system. Such combination enables development of various LC polarization converters and resultant radially/azimuthally polarized light, high-order and multi-ringed VBs, and VB array with different orders. The fabricated converters should be used after the polarization masks make vector photoalignment. It makes volume duplication of the converters and fabrication of q-plates more practical.

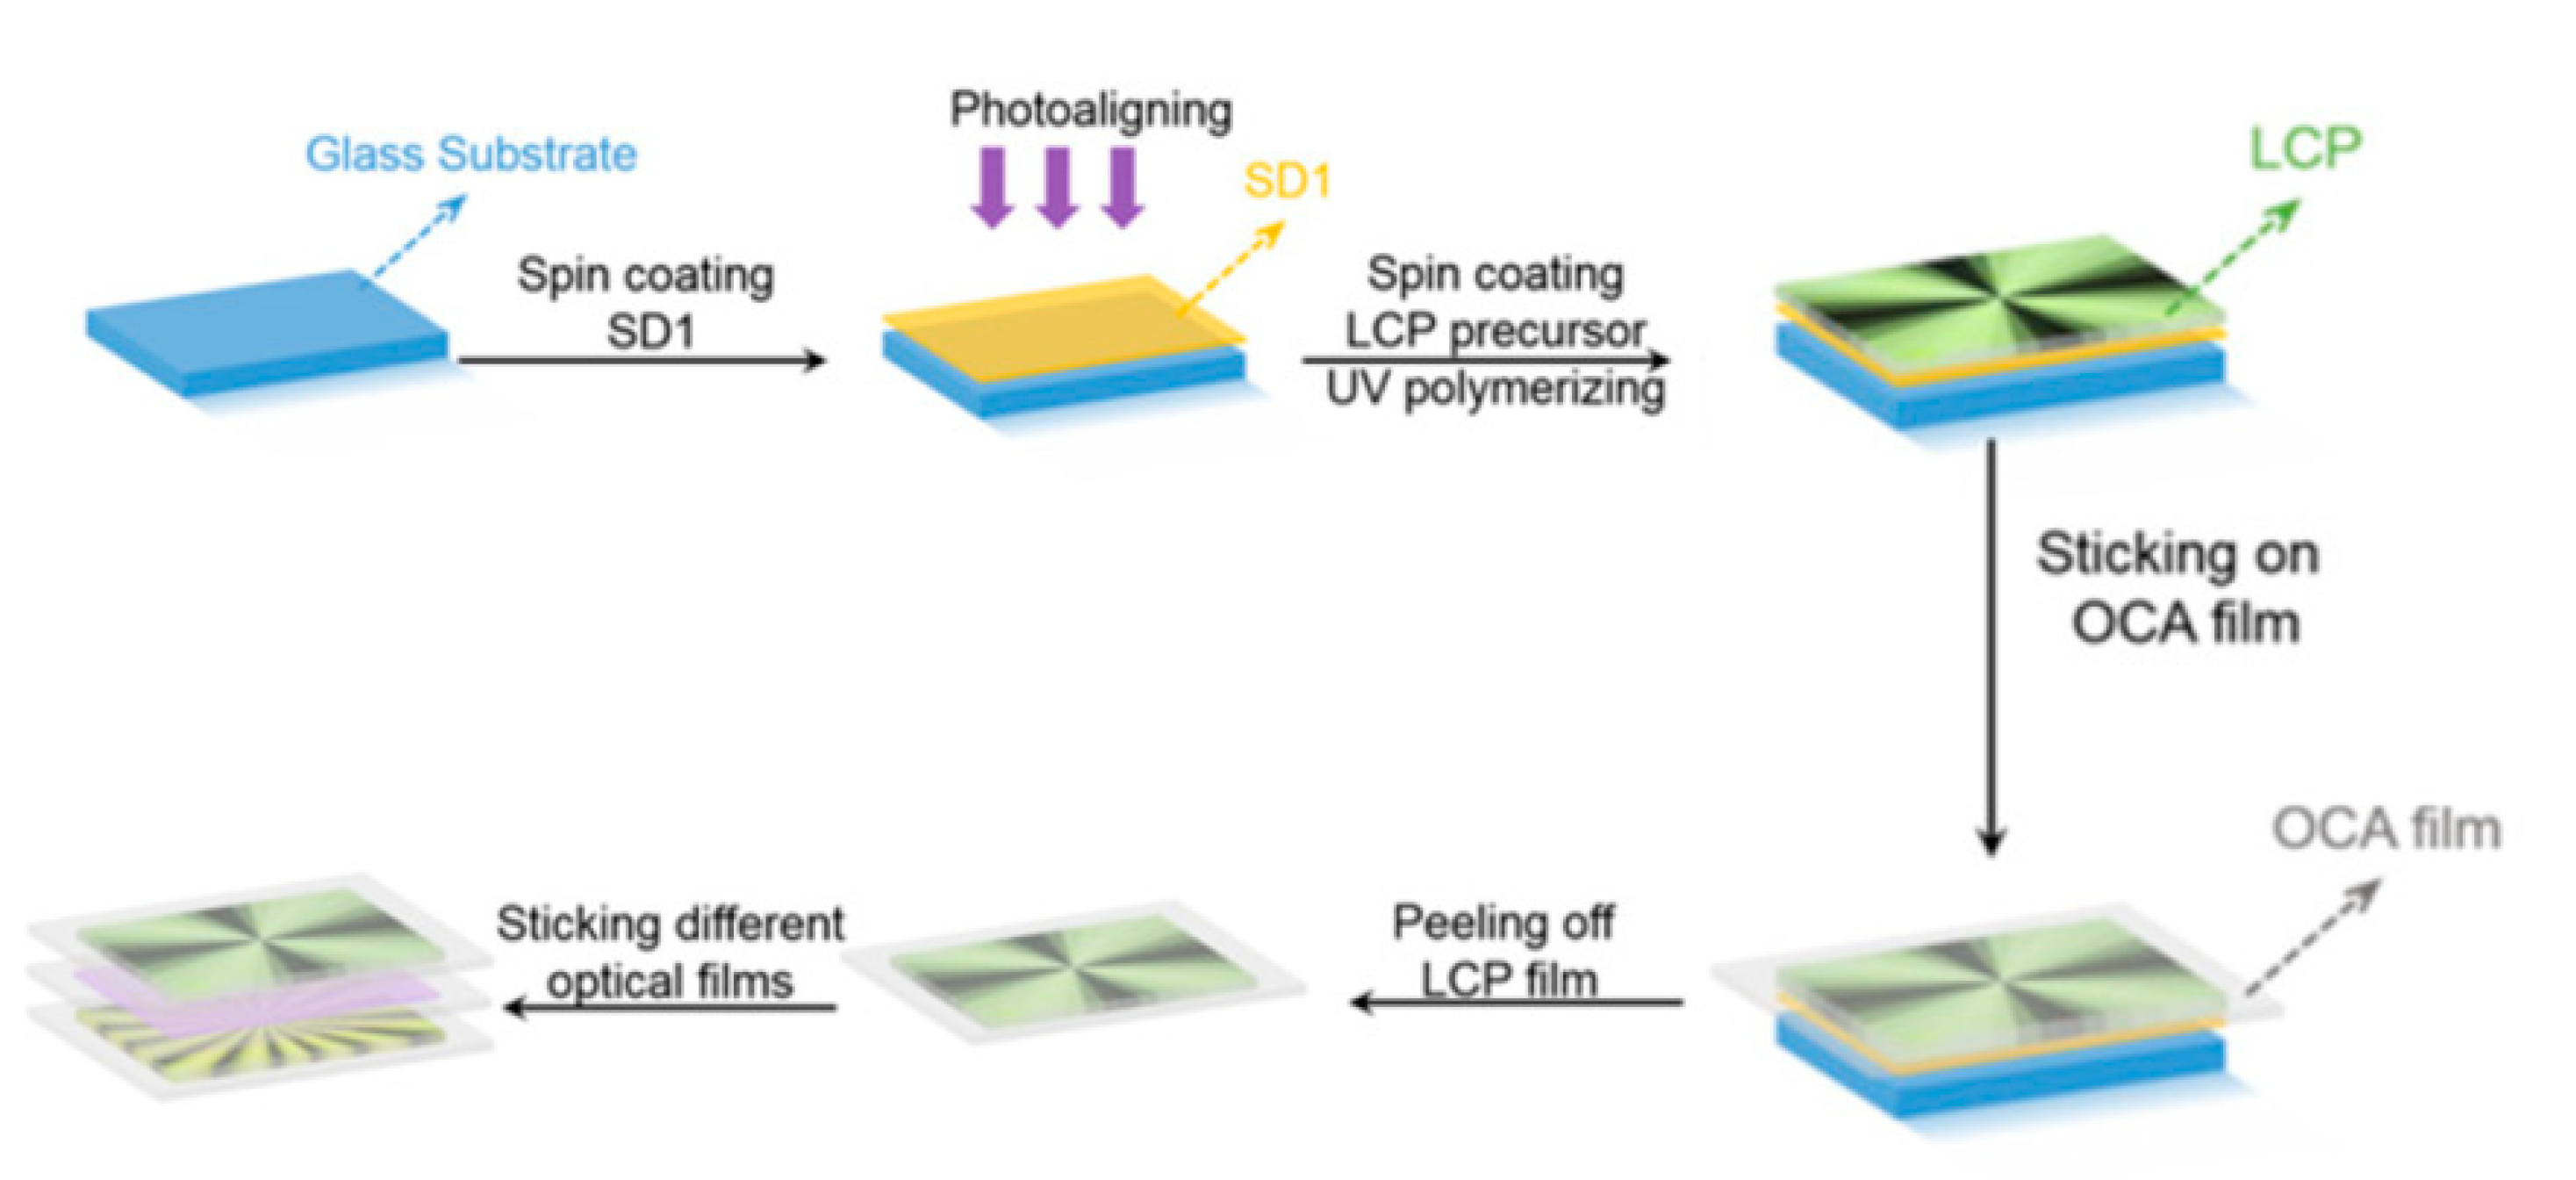
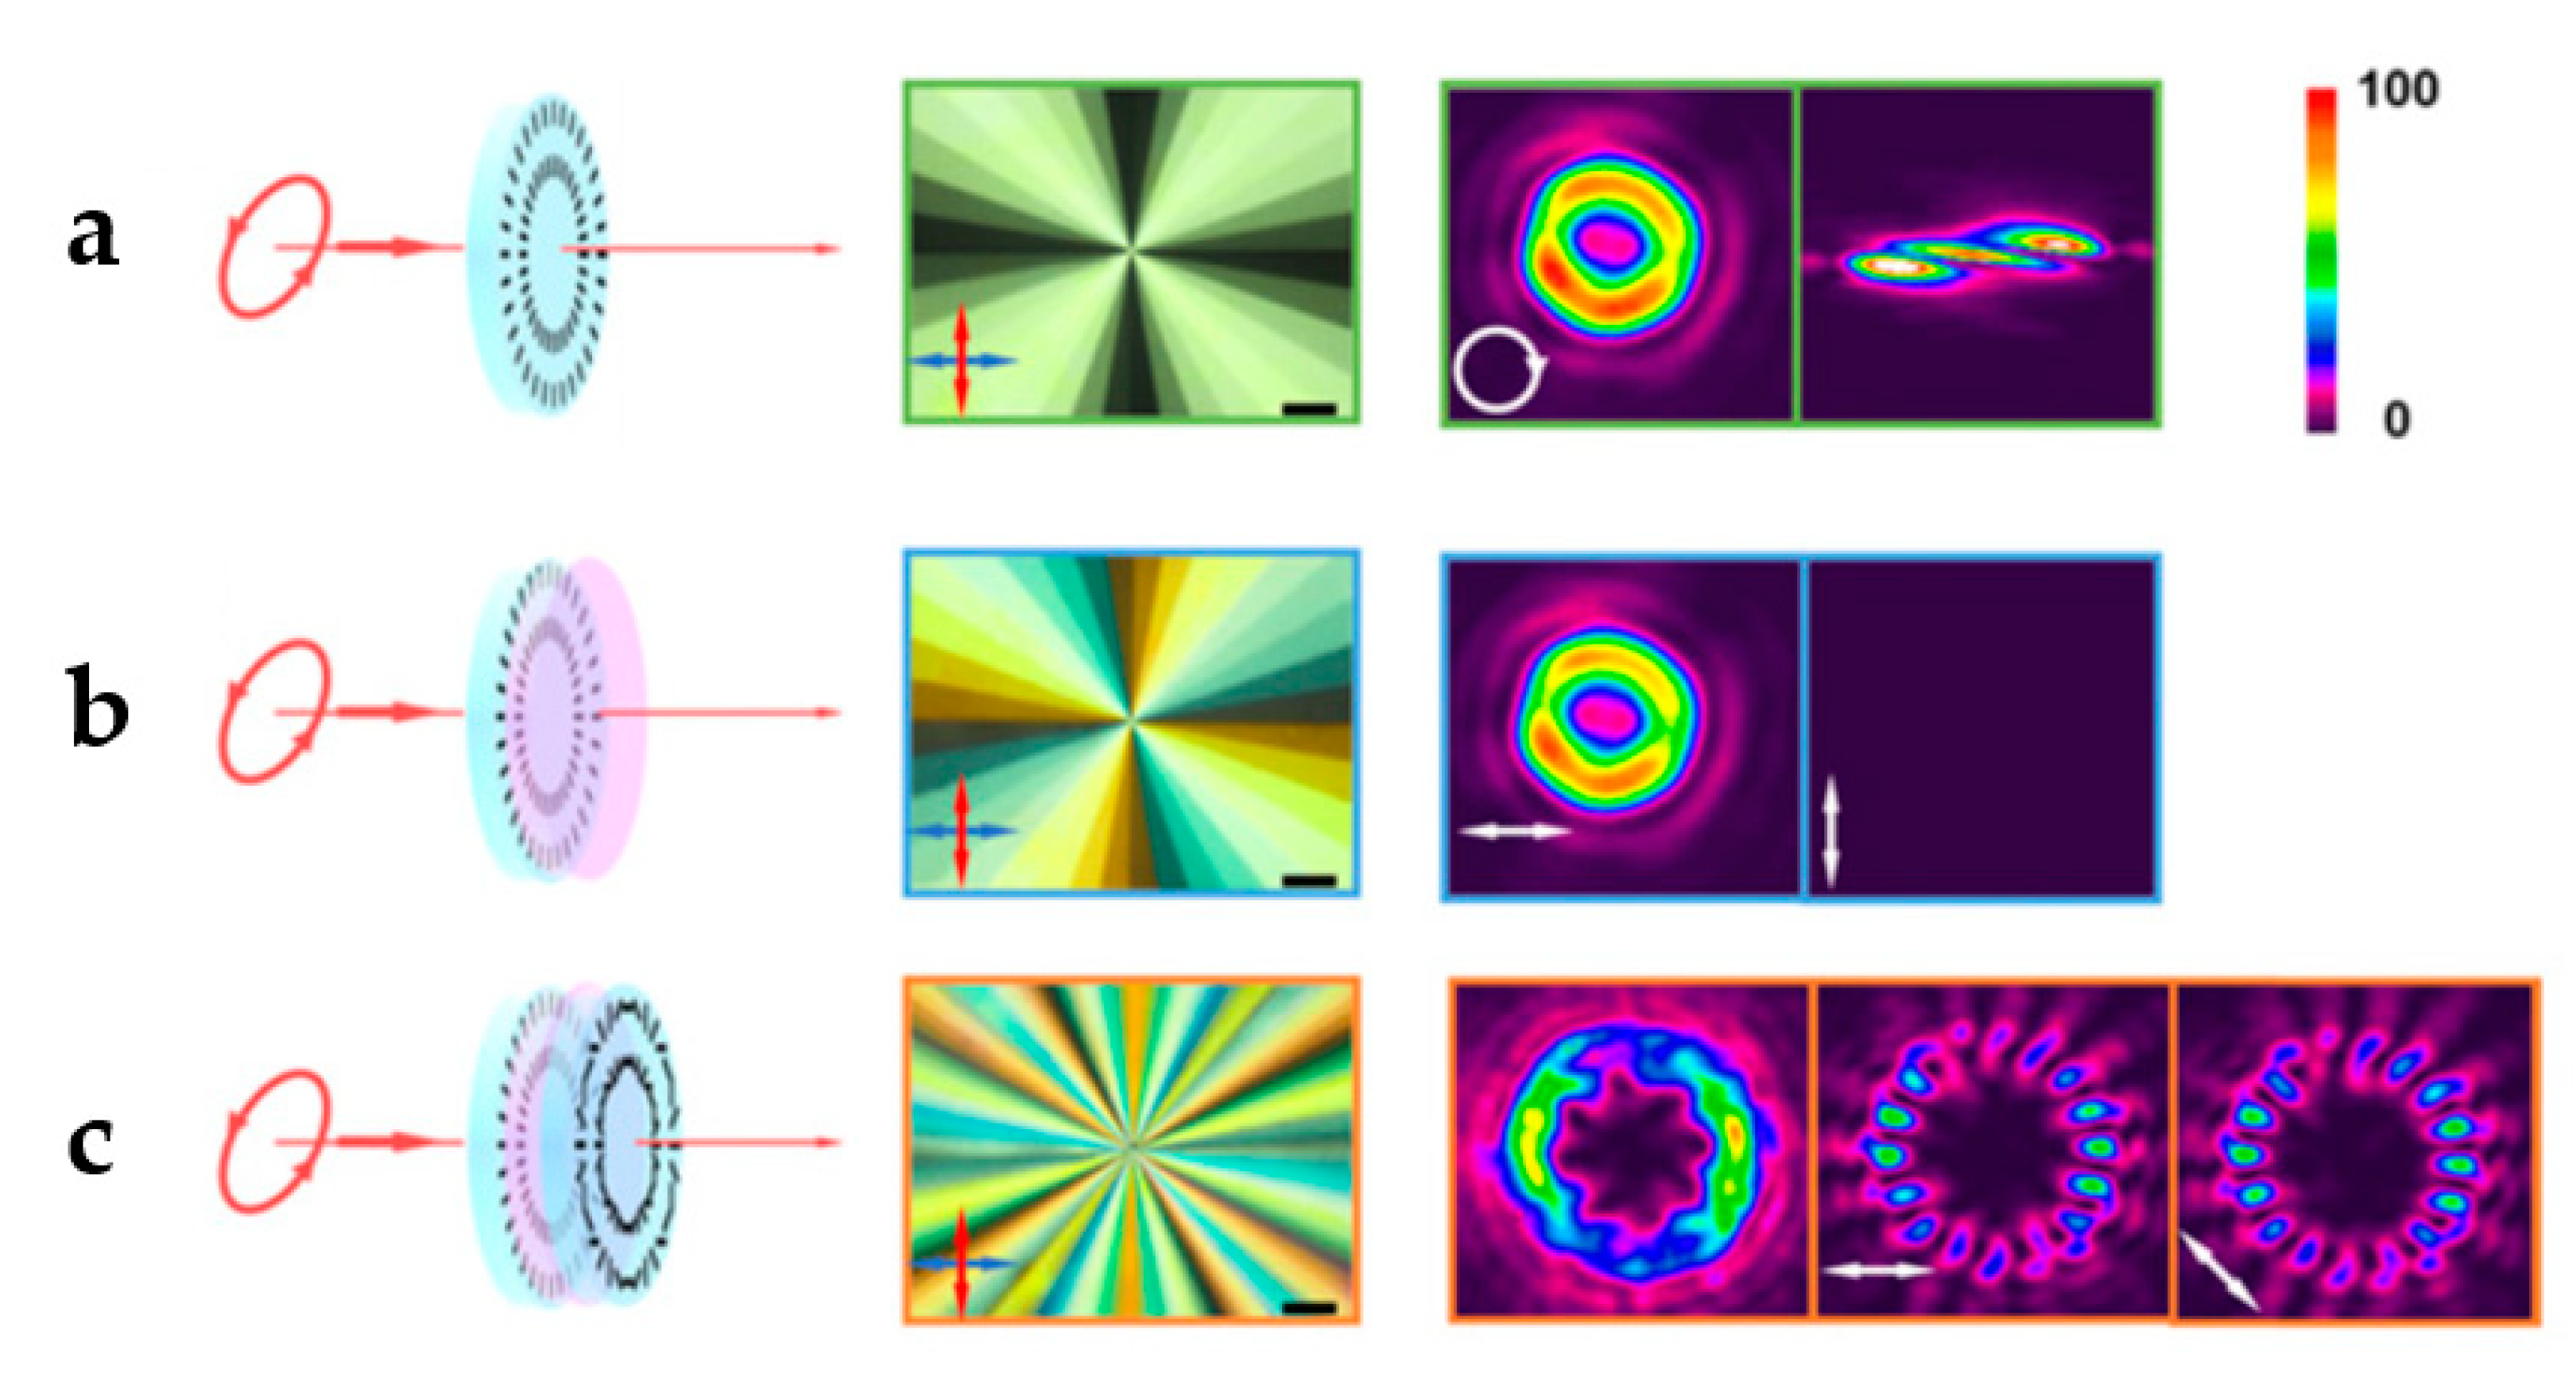
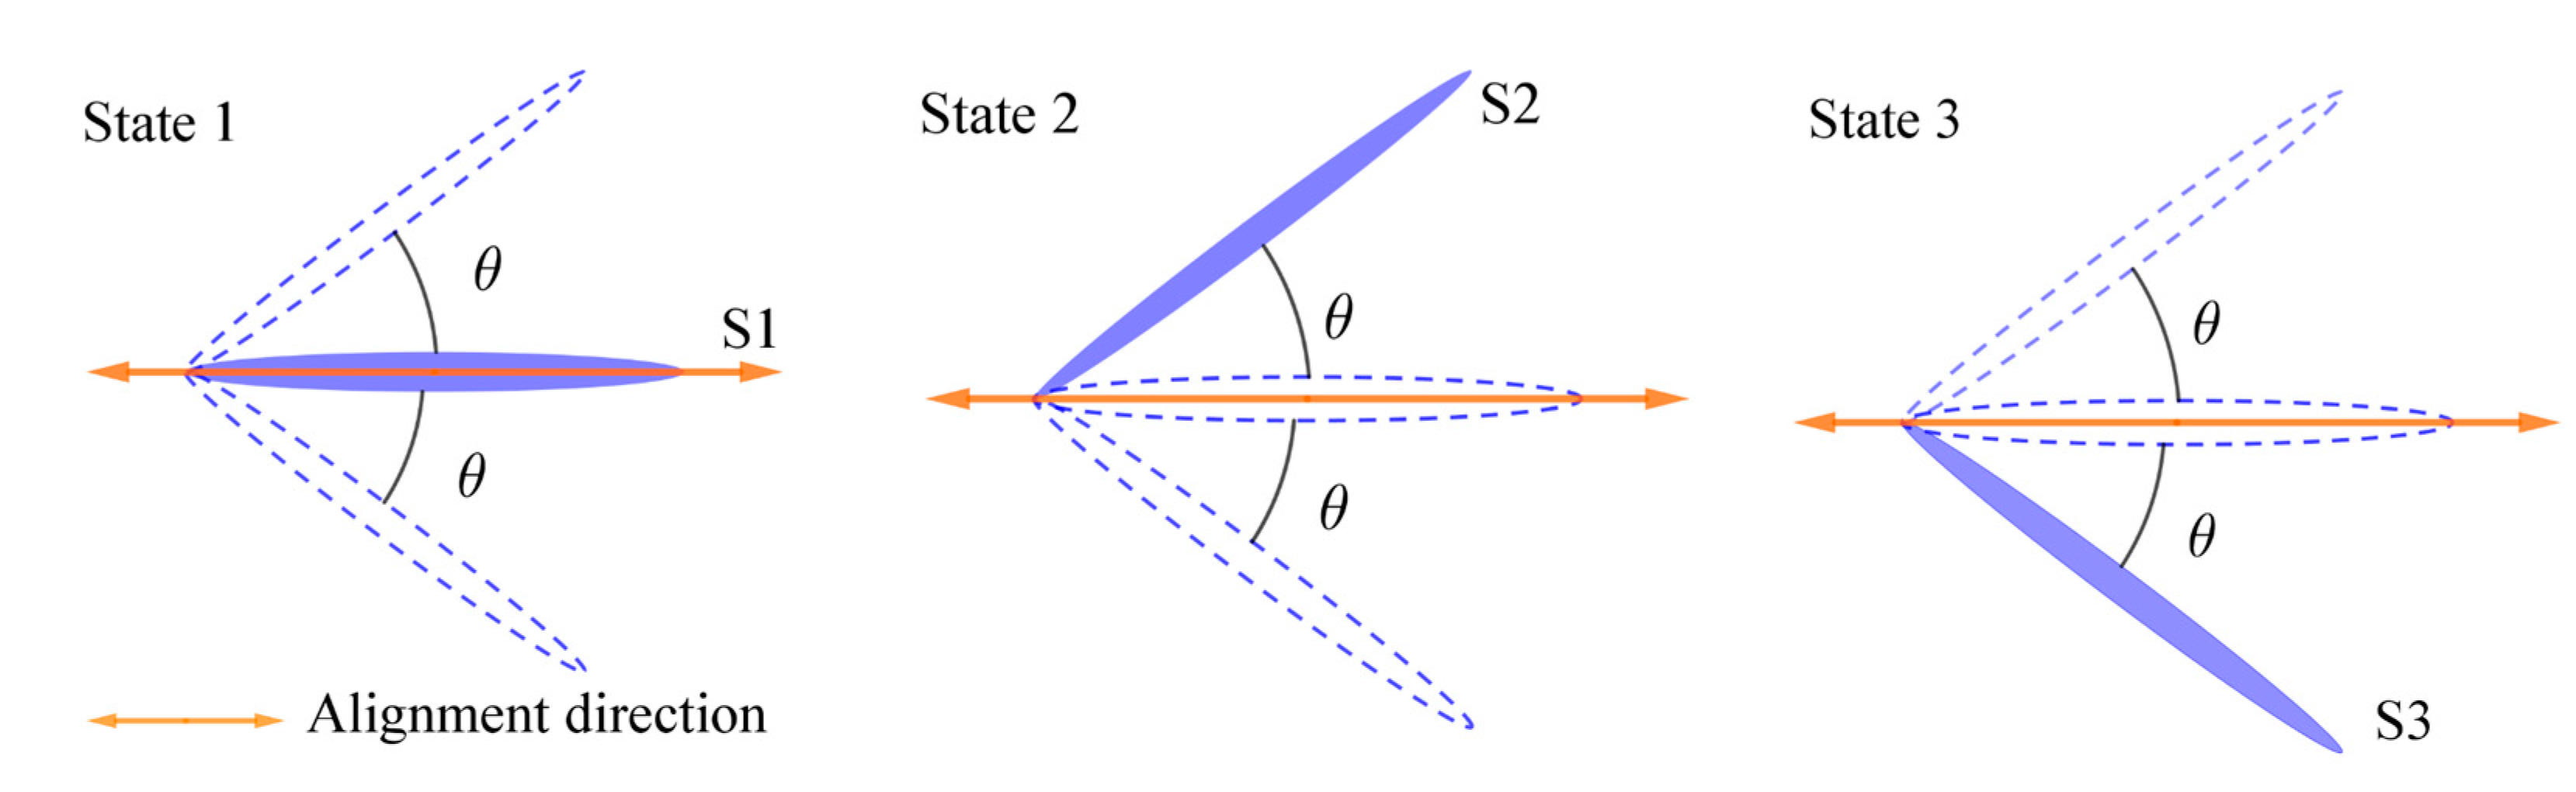
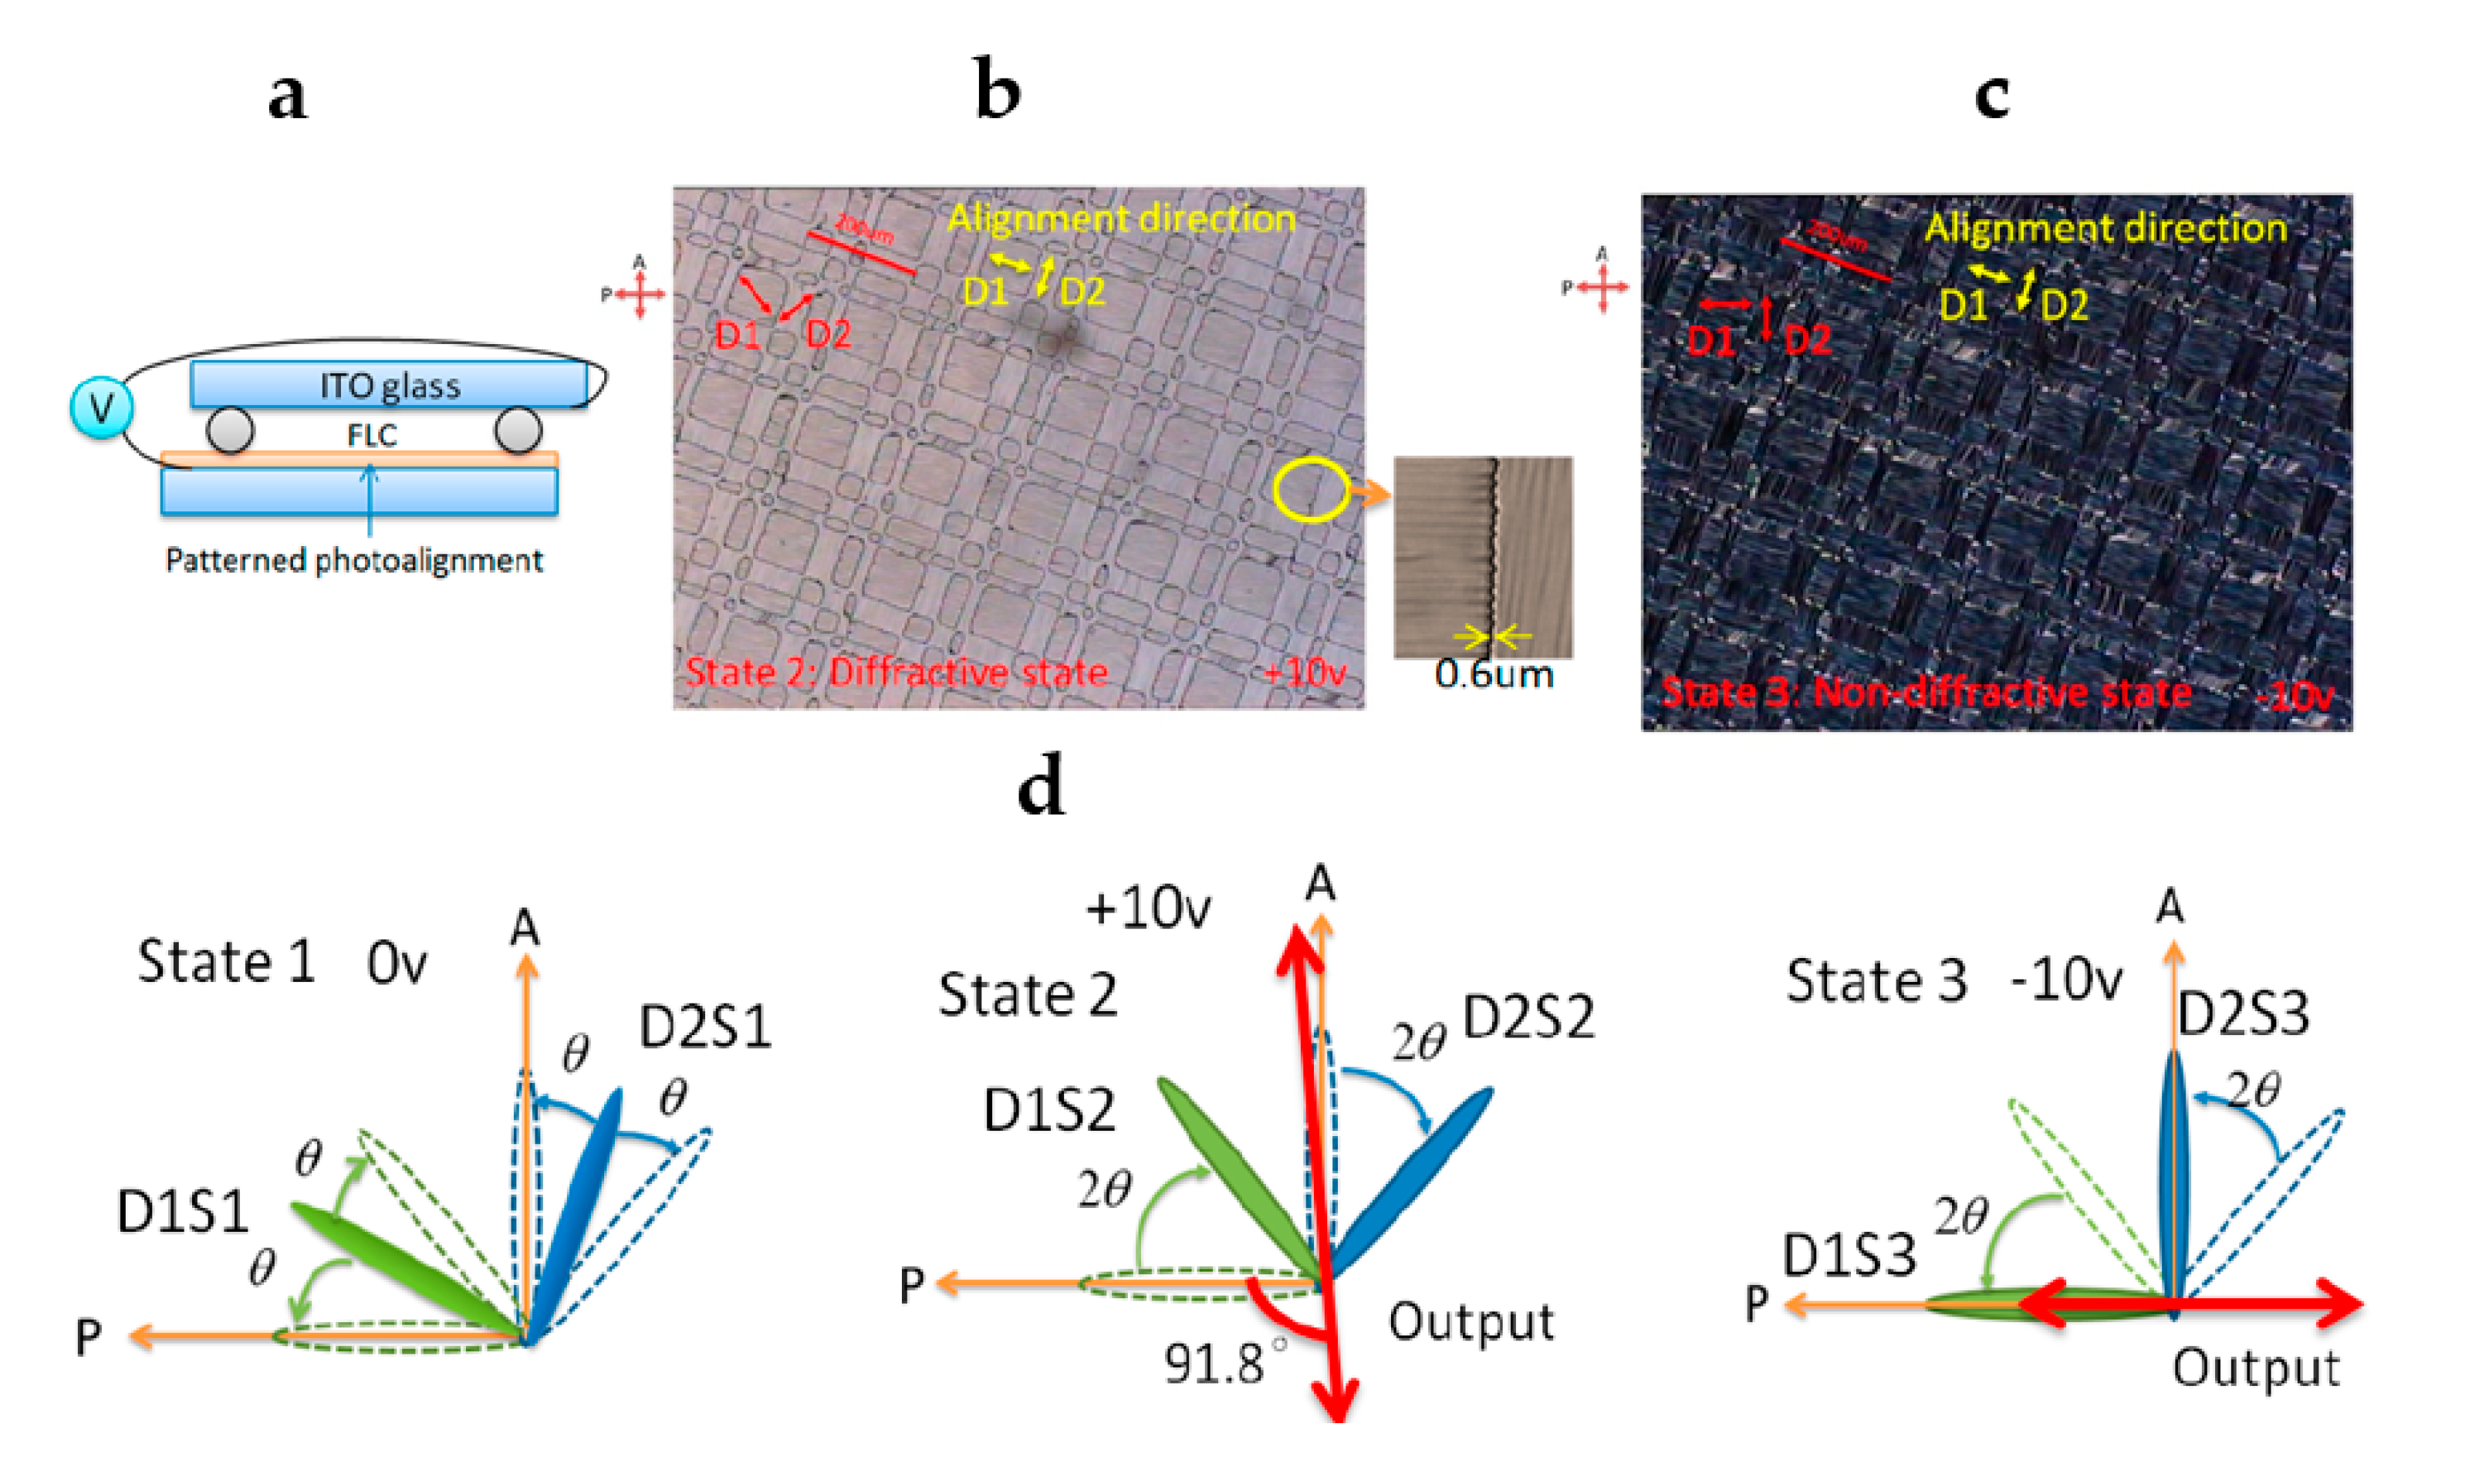
3.2. Reconfigurable Optical Paths

Optical path includes a plurality of heavy and bulky reconfigurable optical elements, which fulfil certain functions (e.g., imaging, optical measurement, and manipulation of wavefront). Components for conventional optical path must be easily reconfigured. Integrated optics devices should be compact, but usually suffer from limited reconfigurability due to factory settings. If this inherent problem can be solved, an efficient way will be beneficial for fabrication of virtual/augmented reality displays, i.e., optical communication systems. One possible way to solve this problem is to replace bulky optical elements with functional thin films. The newly developed module can be based on stacking thin films, which will provide the desired optical path.
A promising candidate for fabrication of such optical films are liquid crystal polymers (LCPs) [28]. Earlier studies evidence that either photoalignment [29] can be used to stabilize optical axis of LCP or photomask pattern in LCPs [28,30]. All these facts enable one to control optical wavefront with various approaches.
In this section, we highlight the main aspects in preparation of photoaligned LCP films with both homogeneous and spatially variant optical axes. Then, they are stacked together to generate vector vortex beams (VVBs), which is featured by the cylindrically variant polarization and spiral wavefront [31,32]. By changing and rearranging the separate films, the polarization order and topological charge of generated VVBs are controlled independently.
In order to generate vector vortex beams, two q-plates and a quarter-wave plate (QWP) are required [33]. Q-plate is a transmissive half-wave plate with a specific optical axis orientation, given by the expression α ( r , φ ) = q φ + α 0 , where r is the radius, q is the topological charge, φ is the azimuthal angle, and α 0 is the initial angle when φ = 0. A q-plate can convert circularly polarized light into optical vortex (topological charge m = 2q) and convert linearly polarized light into a vector beam. Here, the first q-plate (α1, q1) is used to generate optical vortex, the QWP is utilized to convert circular polarization to linear polarization, and the second q-plate (α2, q2) is necessary to generate vector beams. Topological charge and polarization order of resultant VVB are decoupled and can be modulated by selecting different q-plates separately.
Fabrication process of LCP q-plate and assembling of different optical films are illustrated in Figure 3. Photoalignment agent (sulfonic azo dye SD1) must be initially spin-coated onto a glass substrate and then heated at 100 °C for 10 min. This heating process is necessary to remove the excess of the solvent. Subsequently, the alignment layer was photo patterned via a multi-step, partly overlapping exposure. After all these manipulations, LCP precursor was spin-coated onto the alignment layer. The thickness of LCP layer was optimized to ≈1.6 μm to fulfill the half-wave condition for 633 nm. Further heating over 80 °C provides residual solvent evaporation. Polymerization of LCP was achieved under the LED (365 nm, 13 mW/cm2, 2 min). Optically clear adhesive film (OCA, 8173D, 3M, USA) was attached to the top of LCP to remove the film from the glass substrate. Thus, a self-standing flexible functional LCP film can be fabricated. Finally, one can assemble one q-plate and one QWP to form the optical path for VVB conversion [34].
Consider an example with q-plates for q1 = 1, q2 = 4, and α01 = α02 = 0. Let left circularly polarized Gaussian beam (633 nm) be used as the irradiated light. The micrograph in Figure 4 pictures inhomogeneous orientation of LC director, which is translated to variation of intensity under the polarizing optical microscope. The output light beam with the phase singularity of the optical vortex was captured by charge-coupled device. To verify its topological charge, we used a cylindrical lens to implement astigmatic transformation [35], and the converted pattern is also given. Two dark stripes can be clearly observed, suggesting optical vortex with m = 2. Polarization state of the generated optical vortex was reversed to right circular polarization. Subsequently, we noted an LCP QWP with its fast axis orientated at −45° with respect to the vertical axis of the first q-plate. Consequently, the transmitted beam was converted to linear polarized light. A way to control the polarization state of light is to use a polarizer (Figure 4b), which can reveal horizontally linearly polarized optical vortex. The transmitted light by the second stacked q-plate, the VVB, can be generated and analyzed with different polarizer orientations, as shown in Figure 4c. Sixteen lobes were observed, which rotated with the analyzer, being consistent with the properties of vector beam with polarization order P = 2, q2 = 8.
Patterned adhesive film of LCP provides the possibility to create adjustable optical paths. Topological charge and polarization order of the generated vector vortex beams can be controlled independently by stacking and reordering different optical films with the repeated adhesive ability. Such optical system has low weight and volume. In addition, cheap fabrication process offers many potential applications.

4. Applications of Photoalignment in Device Development

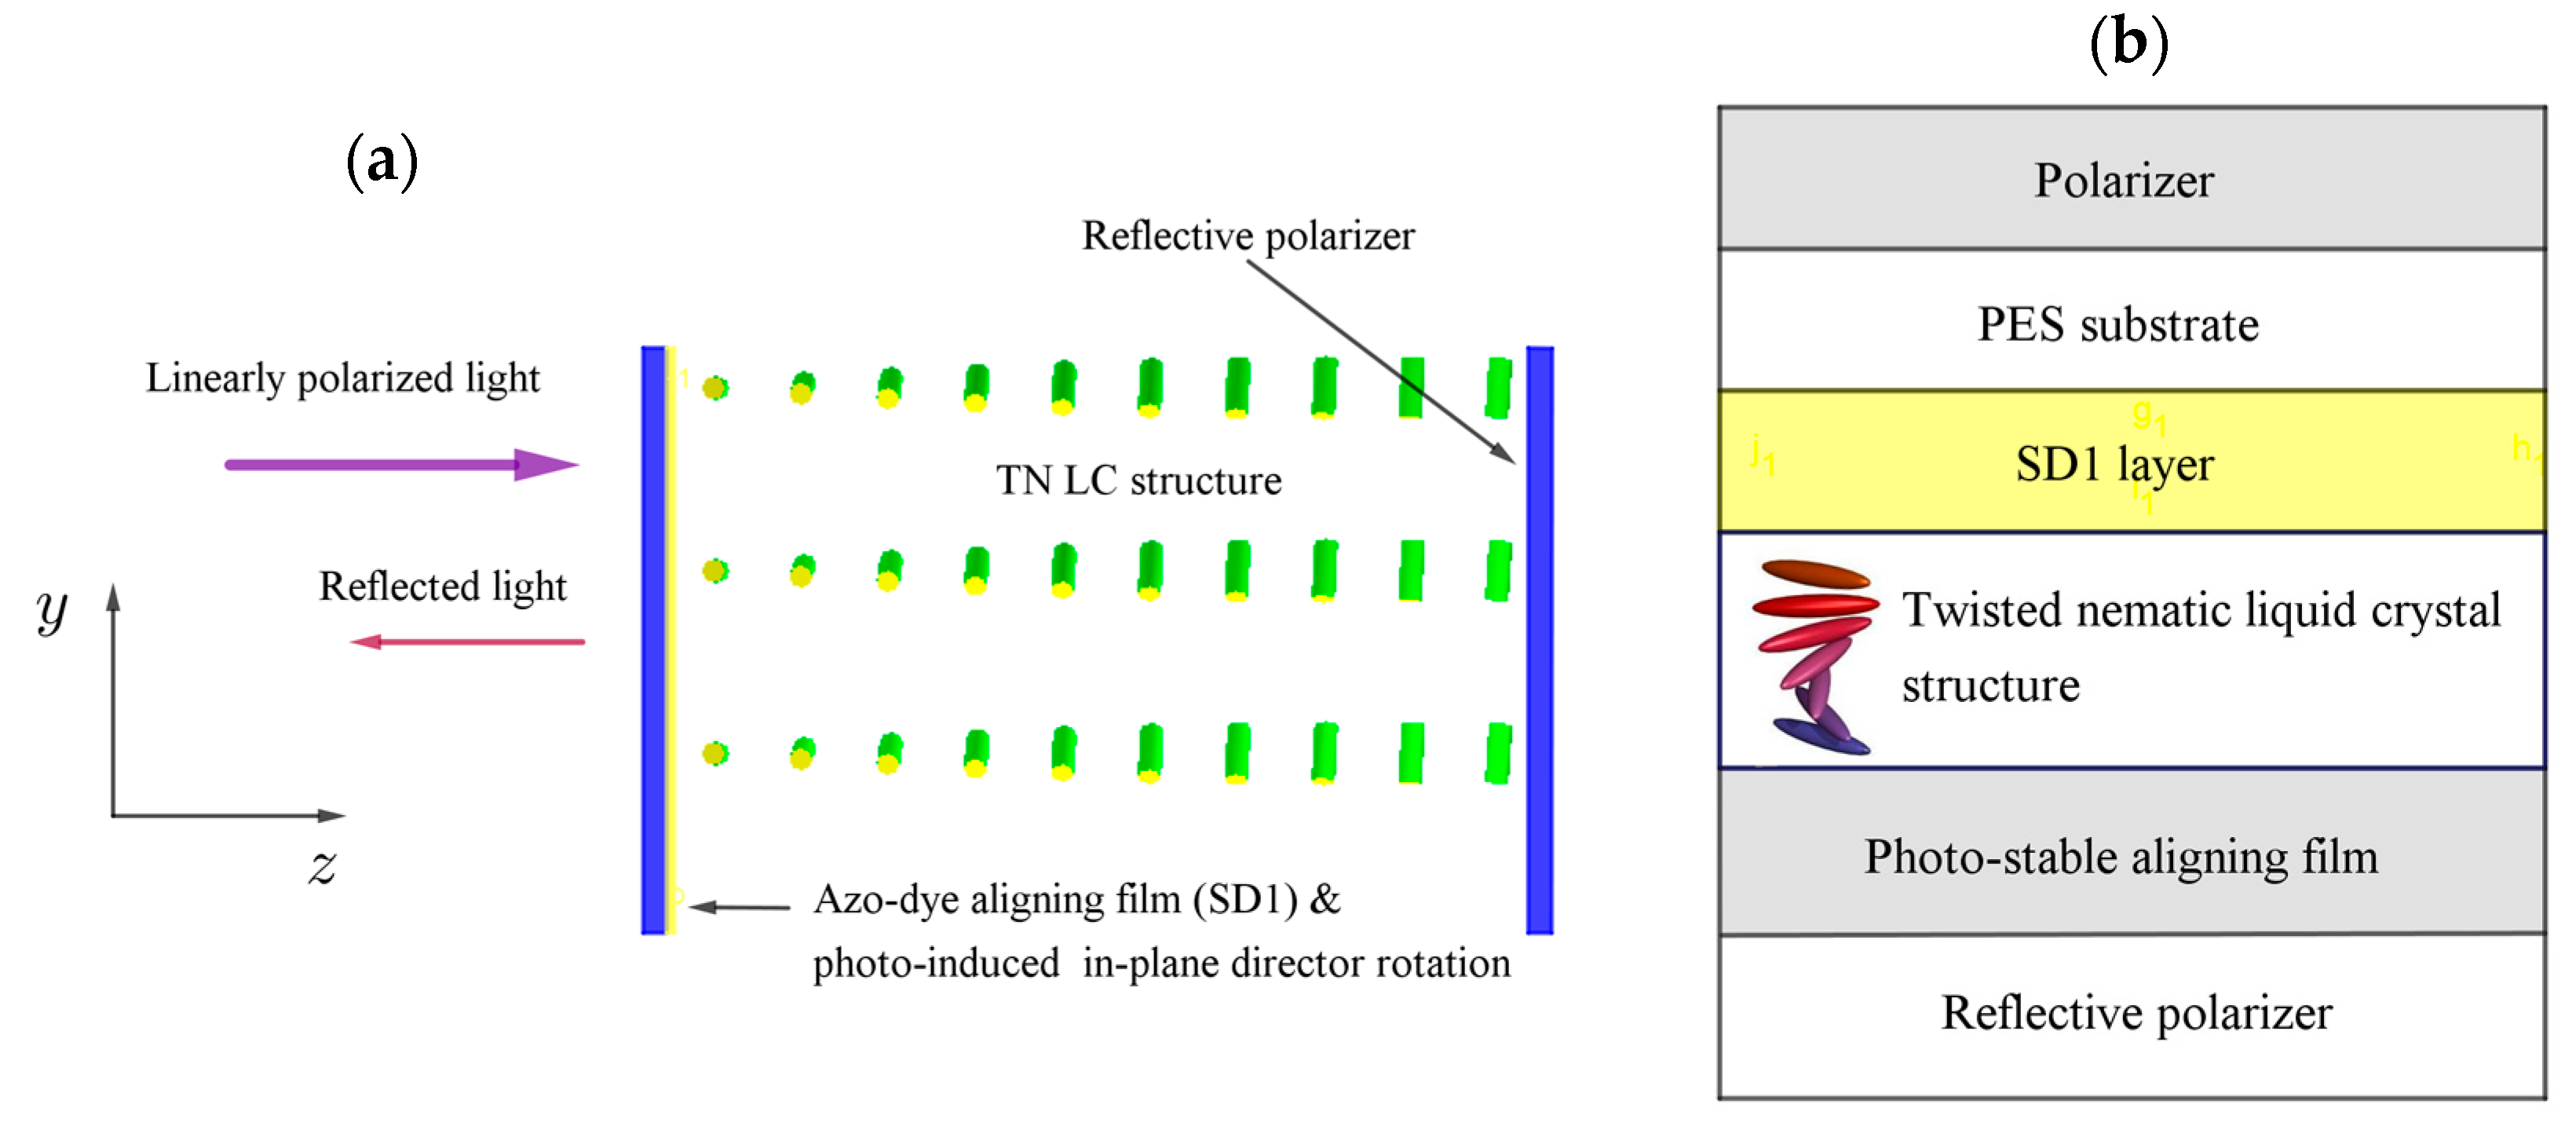
4.1. Simulation-Based Performance of Optically Rewritable e-paper

Optical properties of LCs can be easily tuned if its layer is placed in electrical or magnetic field. The corresponding response to external fields definitely leads to reflective or transmittive characteristics of the display. However, what if the intensity of the irradiated light will change the anchoring properties of the TN film? If so, it enables us to produce light-generated images, which is the concept of optically rewritable electronic paper (ORW e-paper). There exist many other reflective e-paper-developing technologies, where high white state reflectance (%) is critical. For example, electrophoretic (E-Ink, ≈40%), electrowetting (Liquavista, ≈50%), cholesteric liquid crystal (Kent Displays Inc., ≈30%), electrochromic (NTerra Inc., ≈45%, DIC, ≈65%), micro-electromechanical interference (Qualcomm Inc., ≈25%), and liquid powder (Bridgestone, ≈40%). Nonetheless, reflective characteristics of the mentioned technologies are lower than those of a white paper sheet (over 80%) [36].
Below, we describe potential characteristics of e-paper, which were obtained by using the software MOUSE-LCD (developed by the Hong Kong University of Science and Technology and the Saratov State University) [37,38,39], which enables us to elaborate different cell structures, boundary conditions, and LC compounds. In particular, by changing boundary conditions on SD1-coated substrate, a 2D image can be simulated. In order to compute reflective characteristics and contrast ratio, 8 × 8 transfer matrix approach can be used.
Geometric representation of the TN cell with a reflective polarizer film is shown in Figure 5a. Some technological aspects in fabrication of such cells are discussed in [40,41,42]. High optical performance in the reflective mode can be achieved if the phase retardation is Δnd, where Δn is the birefringence and d is the cell gap. As was mentioned above, flexible (polyethersulfone, PES) substrates are indispensable in the ORW concept. Consideration of flat surfaces significantly simplifies the corresponding computations.
A schematic cross-sectional view showing a reflective-type liquid crystal display device is depicted in Figure 5b. In an attempt to obtain more realistic results, it was necessary to consider dispersion effects. The following elastic moduli were used: K1 = 1.3 × 10⁻⁶, K2 = 6.5 × 10⁻⁷, K3 = 1.95 × 10⁻⁶ dyn in our computations. All these parameters enabled us to calculate the static director distribution in the LC layer by numerical integration of the Euler equation.
When the incident polarized light beam propagates through the azo dye layer, its photoactive molecules change the alignment direction on the top substrate (see Section 2). Consequently, the twist angle can be changed from 0 to π/2 (or 90°), and grey levels can be continuously generated.
The obtained dependence of the normalized reflectance versus the twist angle indicates its saturation trend (Figure 6). The build-in features of MOUSE-LCD enabled us to generate an image that would appear on the e-paper with the chosen parameters of nematic LC. Table 1 shows that the maximum reflectance gradually approached when the twist angle was π/2. Meanwhile, it will be more instructive to suppose that the twist angle is 80° (to emphasize the performance characteristics of e-paper when the incident polarized light will not perfectly rotate azo dye molecule). The simulated image in the insert of Figure 6 showed a very close background color to the result of the experimental studies [40,44].
The achieved values of the normalized reflectance coefficients ranged from ≈0.03 to 0.43, which is higher or comparable with other commercial technologies. The obtained value of the contrast ratio achieved 10:1, which is also consistent with other studies. A significant advantage of ORW e-paper is that it does not require formation of static charges and electrodes. Our calculations also indicate that angular dependence of the reflectance coefficient is homogeneous within a wide range of viewing angles.

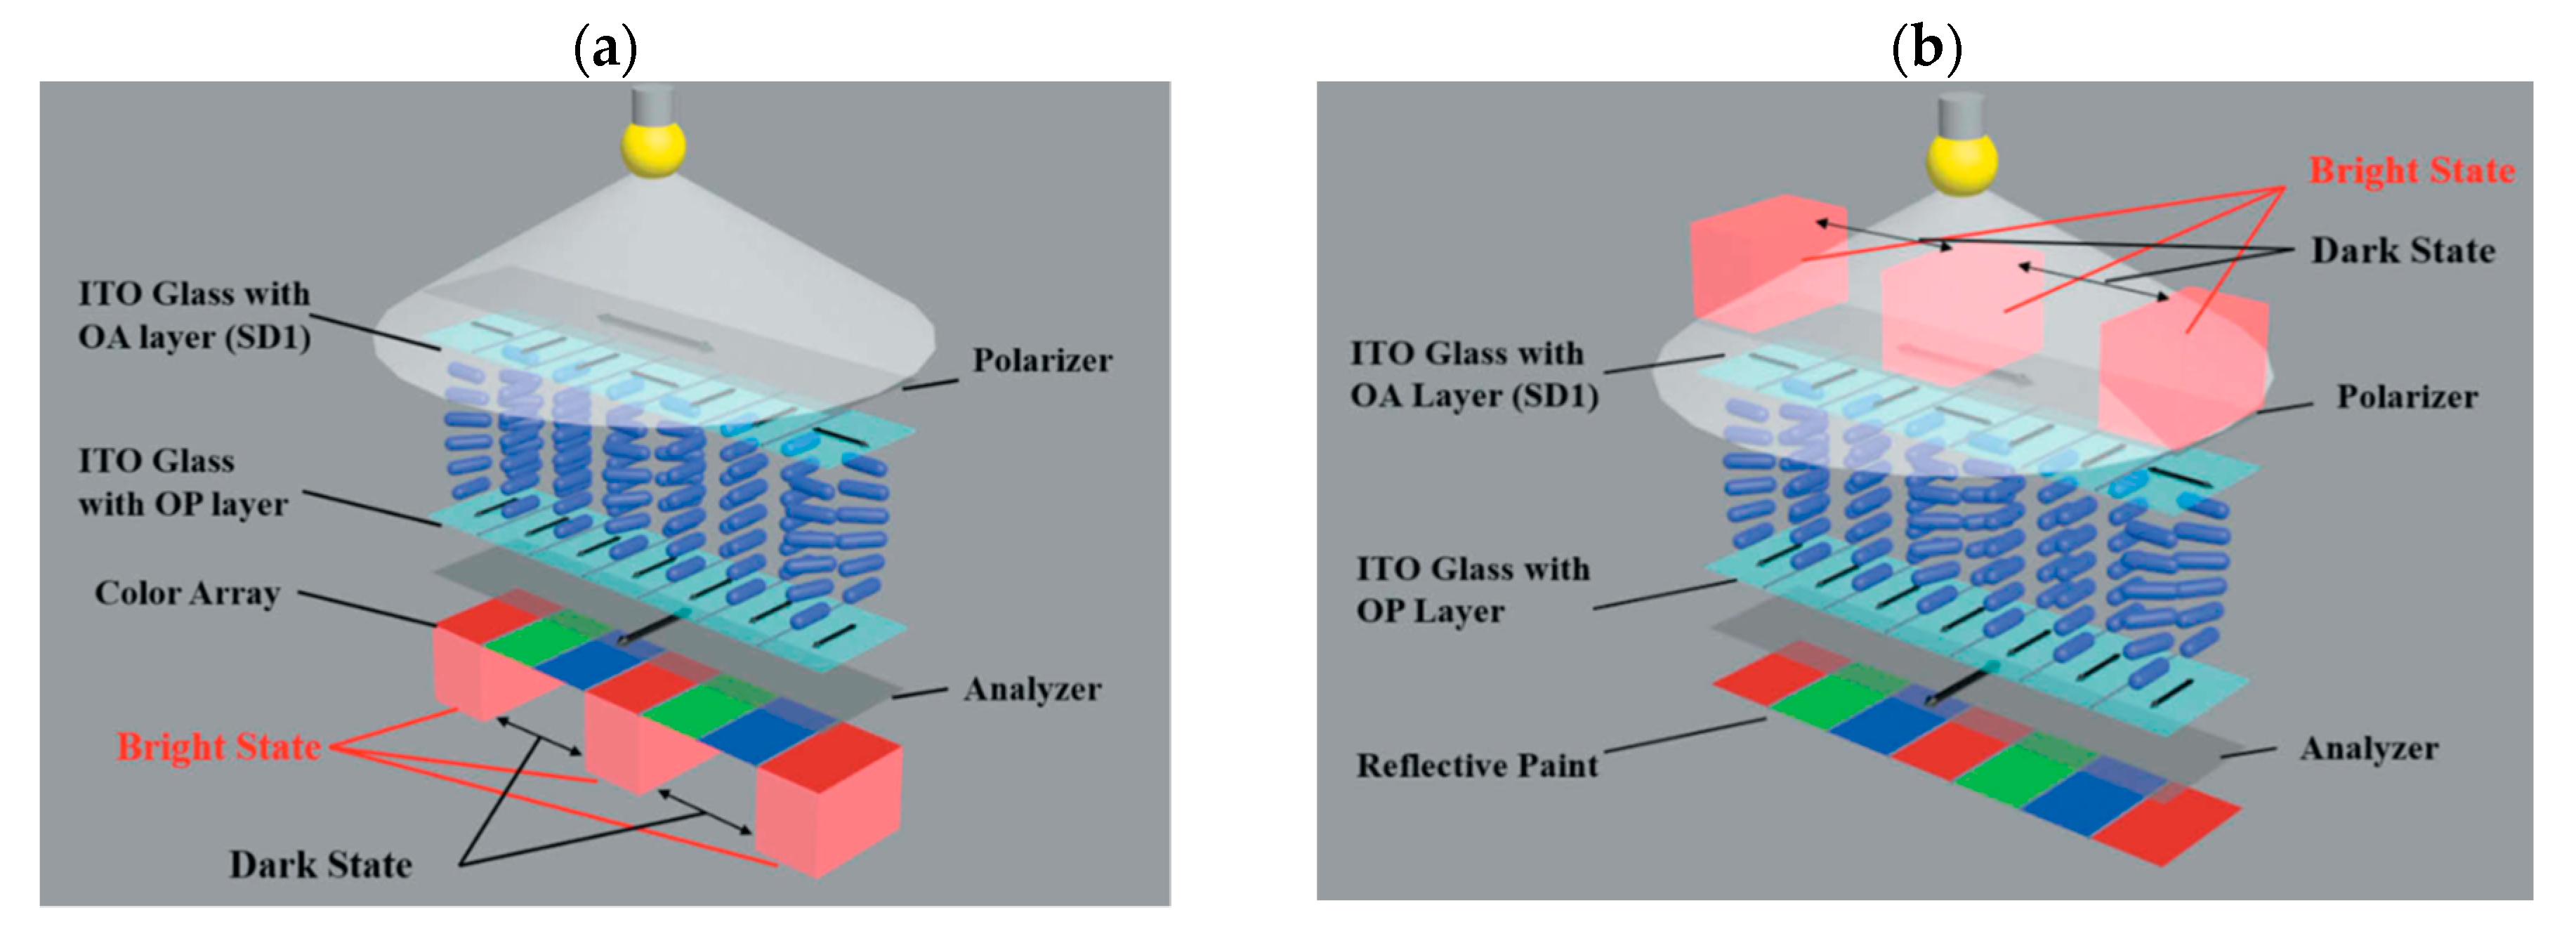
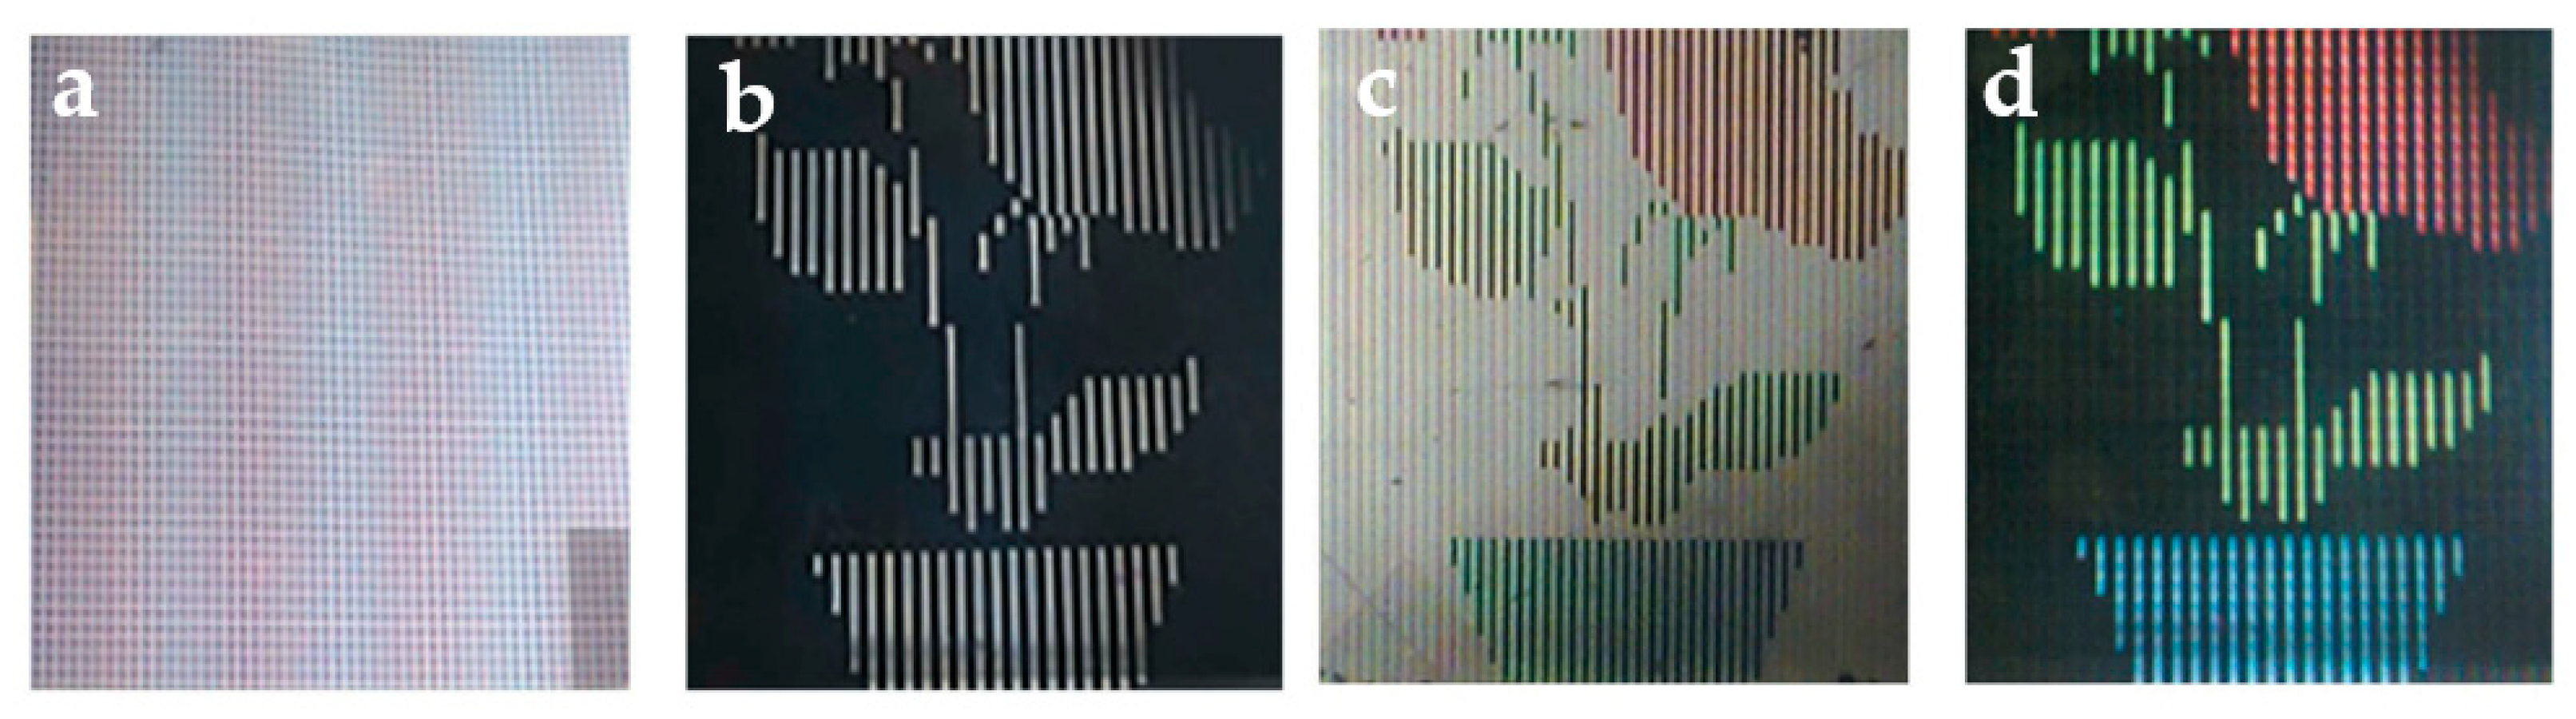
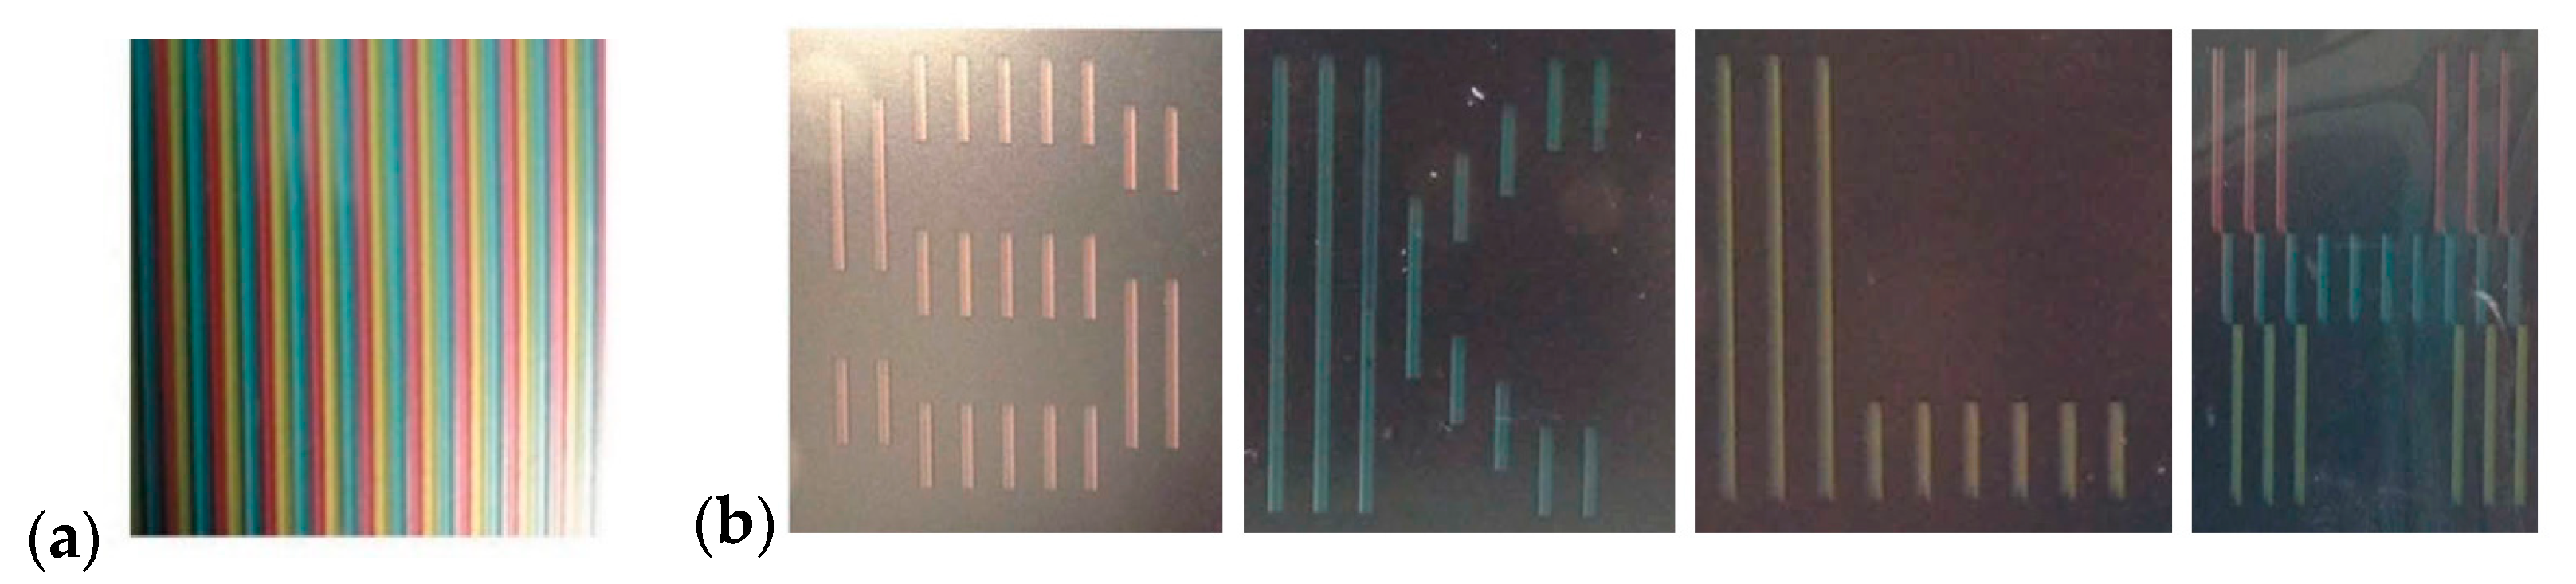
4.2. Optically Driven Color LC Displays

In spite of the conventional LC displays with backlight to obtain different combinations of three primary colors (red, green, and blue), optically driven LC displays do not have backlight. When some areas of the display are in a bright state, it means that the director of LCs changes by π/2 with respect to the alignment direction provided by optically active layer. If other areas have dark states, it means that the director is twisted by an angle smaller than π/2 (Figure 7a). It is important to align the position of twist and planar domains carefully with color arrays. On the basis of the rewritability of optically active alignment layer, image can be easily rewritten with the patterned image mask under polarized light. This method can be applied to transmittive display with transparent polarizer or reflective display with mirror or reflective polarizer below the color filter.
Reflective painted background coating serves as a patterned color array and reflector to create colored display cell. Consider, e.g., red color transmitting through twist regions (bright state) is reflected back from the reflective paint, as pictured in Figure 7b. Other colors can also be obtained with the same approach.
One apparent way to generate colors in optically driven LCD is to use color filter. The image demonstrated in Figure 8a shows patterned (gridded map) color filter. The flower image depicted in Figure 8b was obtained without color filter. Here, the easy axis of LC for the optically active alignment layer changed under the exposure light, displaying the flower pattern in black and white colors. When a color filter and a transparent polarizer were added to the device, it enabled the light to go through the display (Figure 8c). If the reflective polarizer is placed behind the front surface of the display, the light will go passes through the display and will be reflected back, but will not leave the device. The corresponding image of reflective mode is shown in Figure 8d.
Another method to assemble reflective color optically driven LCDs is to use reflective paint as patterned color array. Consider patterned reflective paint, which was assembled to obtained different colors, as shown in Figure 9a. Furthermore, three characters, namely, “S”, “K”, and “L”, depicting red, blue, and green colors, respectively, are shown in Figure 9b. Letter “H” includes red, blue, and green colors (Figure 9b).
Application of color filters can be successfully used in fabrication of optically driven color displays. Method of reflective paint application is simple and effective, and it does not require any other reflectors. The methods that we considered were tested with color optically driven LCD demos exhibiting 21% National Television Standards Committee (NTSC) color standard. It is believed that all these findings can improve optically driven display performance and will trigger applications in flexible full-color display devices.

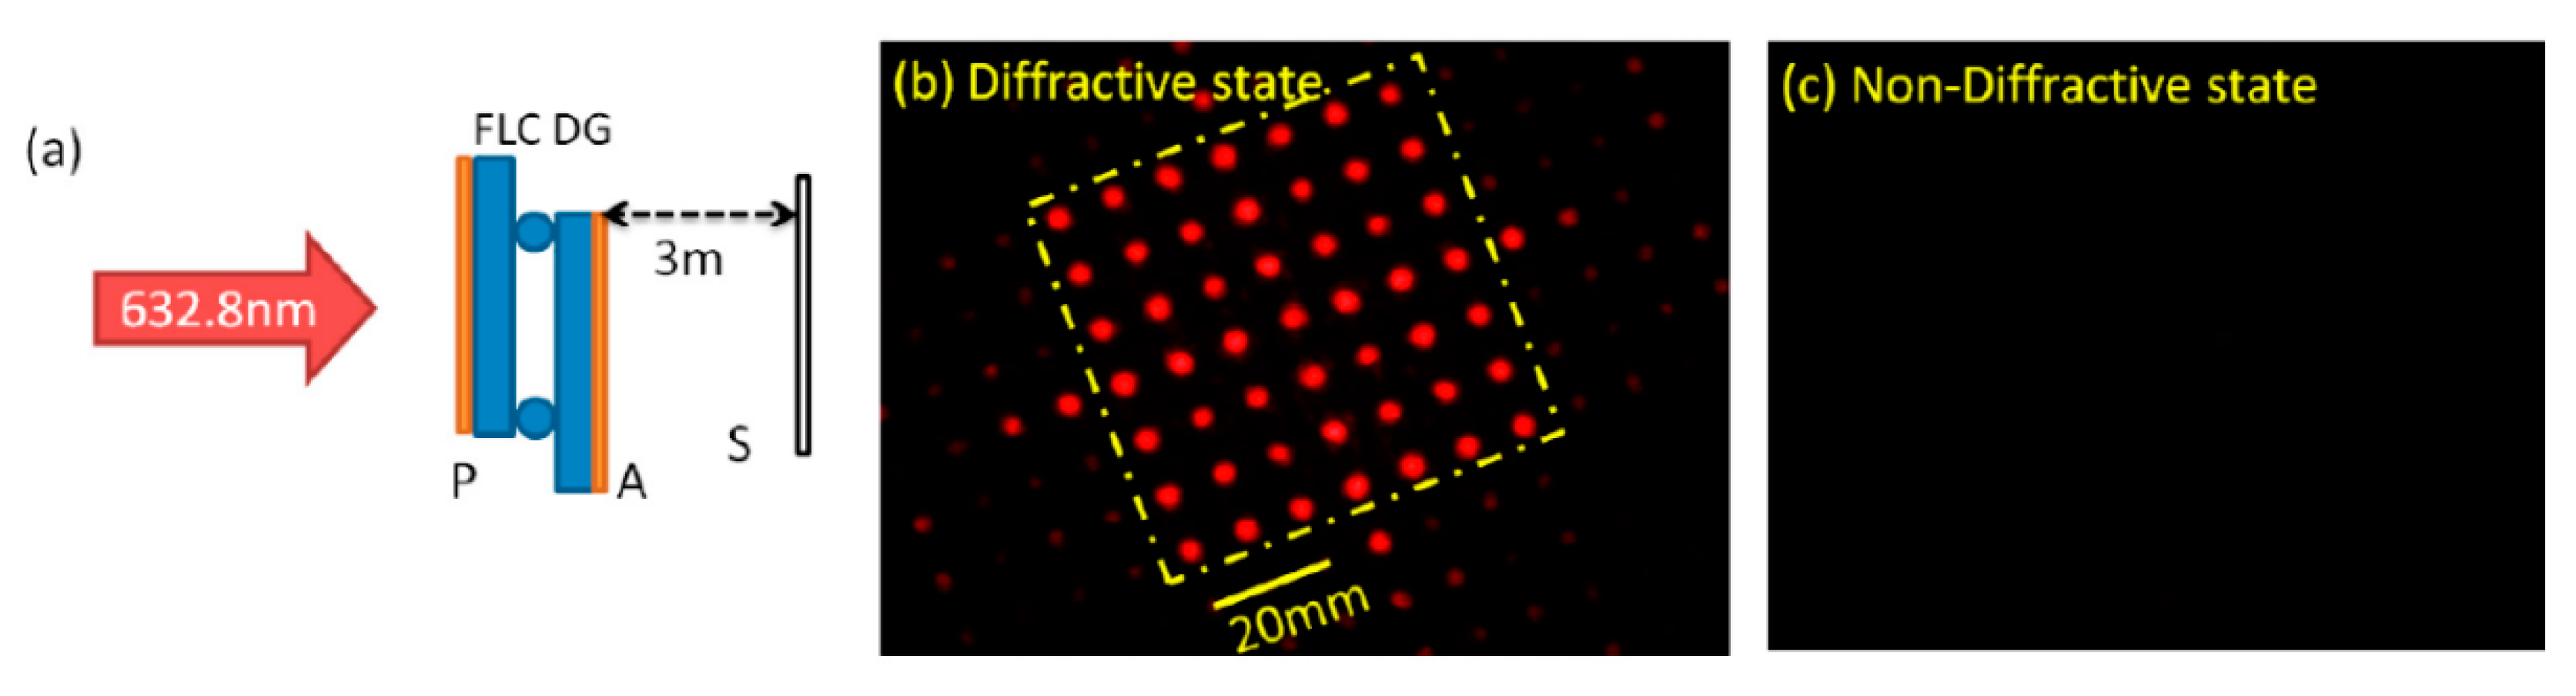
4.3. Dammann Gratings

Potential applications of diffractive elements with high-performance optical characteristics (excellent performance and compact size) are of growing interest among many researchers [46,47,48,49] because they provide an effective method for design and fabrication of compact and fast-switchable diffractive optical elements.
Dammann gratings (DGs) are binary phase gratings that are used to produce one- or two-dimensional array of equal-intensity light spots. The idea behind the DGs is to obtain multiple images from one input object for optical lithography [50]. After this original publication in 1971, many other interesting applications have been proposed, e.g., laser beam summation [51], optical interconnections [52], 3D optical imaging [53], 3D lattice structure generation [54], and optical communication [55].
Circular Dammann gratings (CDGs), which generate concentric and equal-intensity rings, have many applications in image coding [56,57], beam shaping [58], vortex manipulation [59,60] and precise measurements [61,62]. Much effort has been expended to enhance the efficiency and the uniformity of CDGs by profile optimization [63,64,65]. However, realization of tunable CDGs has been accomplished only in recent years.
Modification of the grating structure enables us to observe array of diffractive orders with different vortex phase distributions. In order fabricate such DGs, a conventional method can be used—mask preparation by using electron beam (or laser), etching substrate with plasma, reactive ion, or wet chemical. The advantage of this fabrication method is high resolution up to sub-micrometers, but the disadvantage is that the grating is fixed with no tunability and the fabrication process is tedious.
In order to obtain high switching time, researchers suggested the use of electrically suppressed helix (ESH) mode of ferroelectric liquid crystals (FLCs) [66]. Consider the details of ESH mode, which is characterized by good alignment quality and fast response time at low driving voltages. The working principle of the ESH FLC is illustrated in Figure 10. When the voltage is not applied to the cell, the FLC helix is aligned along direction S1. Consequently, the molecules will form helical structure, which is represented by State 1.
When electric field (>0.5 V/μm) is applied to the FLC cell, the helical structure becomes suppressed, and FLC molecules will switch around the cone surface, as shown in Figure 10 (States 2 and 3). Different switching directions are explained by the polarity of the electric field. Axes S2 and S3 can be considered as the slow optical axis of the FLC-based wave-plate [67]. Angle θ is the tilt angle, which is determined by the FLC compound.
In order to observe ESH FLC mode, polarizer (P) and analyzer (a) are set on the two sides of the FLC cell. In our design, the polarizer (P) and analyzer (A) are oriented along directions, which characterize State 3 (two possible orientations). According to the configuration represented by State 3, the transmitted light by the first polarizer will have the polarization plane parallel to the optical axis of the FLC waveplate. It means that polarization plane will not be changed after the FLC DG, as shown in Figure 11d. All light will be blocked by the analyzer. Thus, State 3 shows a non-diffractive (dark) state. This phenomenon can be observed in Figure 11c, where the two domains are in the dark state.
Consider the output of State 2. The angle between the molecules and the polarizer direction is π/4. The phase retardation of the FLC waveplate is close to be half-wave condition, which will rotate the polarization plane by π/2 (Figure 11d). In this case, light will be transmitted through the analyzer. This can be verified by the micrograph shown in Figure 11b, where all domains are bright.
In order to demonstrate the performance of the DG, the optical setup, which is depicted in Figure 12a, can be used. A light beam from a He–Ne laser with the wavelength of 632.8 nm was used to transmit the light through the assembled FLC DG, as pictured in Figure 11. Electric field between the indium tin oxide coated substrates was controlled by the signal generator.
Upon reversing the electric field polarity between +10 V and −10 V, the grating can be switched between diffractive and non-diffractive states. The projected diffraction spots (Figure 12b,c) can be observed on the screen (S) behind the DG. It can be seen from Figure 12b that the diffractive state of the DG projected 7×7 orders (dashed yellow square). The measured diffraction efficiency was 75.4%.
Circular DGs (CDGs) have also been extensively studied [54,60,68]. Circular structure of the substrate can be achieved if a two-step photoalignment technique is applied [69]. Application of FLCs as functional materials of the CDG enables achievement of submillisecond electro-optic response.
A two-step exposure technique was used to assemble binary eight-order FLC CDG with perpendicular alignment of even and odd zones. For the CDG with multi-level or even continuous modulation, it can be achieved by multiple step exposure process, since the resolution of FLC photoalignment is in the sub-micron scale [70]. To transfer the CDG pattern to the alignment layer of FLC, a two-step exposure process must be implemented with the azo dye as the aligning layer. The aligning layer provides the alignment of FLC helix perpendicular to the polarization plane of the incident light (Figure 13a). Linearly polarized UV light with uniform intensity (central wavelength is 365 nm and I = 5.5 mW/cm2) generates the first alignment direction (Figure 13a). Then, the alignment direction of SD1 must be rotated by π/2 to create other perpendicularly aligned domains on the same substrate (see Figure 13b). The illuminated substrate can be utilized to assemble cell with asymmetric configuration, in which surface aligning layer is only on one substrate, as shown in Figure 13c [71].
Then, the FLC material FD4004N (DIC, Japan) was filled into the prepared cell. The FLC material FD4004N had the following phase transition scheme: SmC* → SmA → N* → Iso at the temperatures of 72 °C, 85 °C, and 105 °C, respectively. The FLC helix pitch, spontaneous polarization, and the tilt angle were equal to P0 =350 nm, PS ≈ 61 nC/cm2, and tilt angle θ ≈ 22.05°, respectively, at room temperature. In order to control the cell gap and maintain the optimized contrast between odd and even zones, we used 9 µm thick spacers between the substrates. Given the fact that the exposure dosage determined the photoinduced anchoring of SD1 layer, the exposure time was optimized for alignment quality [5]. Considering the thickness and the elastic property of FLC material, the UV dosage of 10 J/cm2 was irradiated for creating the optimal aligning condition. In this case, a proper balance was achieved between the anchoring energy of alignment layer and elastic energy of the helix in cells with thickness much larger than helical pitch. The fabricated device had perpendicular helix axes in the adjacent areas.
When the half-wave condition was satisfied, π-phase shift occurred for the light propagating between odd and even domains. All these conditions enabled observation far-field diffraction patterns exhibiting equal-intensity rings (see Figure 14a). Diffraction intensity profile up to the eighth order can be acquired by photodetector, and the corresponding result is shown in Figure 14b.
Circular DG can produce equal-intensity nested diffraction rings. Accordingly, our further discussion is given in terms of diffraction efficiency (a value that expresses the extent to which energy can be obtained from diffracted light with respect to the energy of the incident light) and uniformity. Given that the half-wave condition is satisfied, which is phase retardation different between odd and even zones matching 5λ/2, the efficiency and uniformity are expected to be high. The diffraction efficiency of the CDG is defined as η = Σ I n / I out , where Σ I n is the total intensity of all diffraction peaks and I out is the output intensity. The measured magnitude of the diffraction efficiency was shown to be 84.5%, which correlated with the theoretical limits.
The response time can be measured by detecting the intensity of the diffractive orders. The switching-on time was measured when the transmittance of the diffractive orders increased from 10% to 90%, and the switching-off time corresponded to from 90% to 10%. When the magnitude of the electric field was 4.3 V/µm, the response time for both times τ ON and τ OFF was about 64 µs. This, inherent spontaneous polarization of FLCs make it possible to achieve submillisecond response time.
The stabilized by azo dye FLC film has high optical quality and enhanced stability. Proper treatment and irradiation doses for two-step photoalignment open the opportunity for the development of optical devices with record-breaking characteristics.

5. Conclusions

We showed that the inherent property of photoalignment to adjust key anchoring parameters is stimulating the development of new potential applications for optical systems. The key to successful manipulation of optical properties of LC layer is the control of anchoring energy and the ability to create complex and precise patterns. Recent studies have demonstrated that photoalignment has a high potential as the method for photonic and display applications. It can be successfully used to produce anisotropic optical films, various telecommunication devices, and thin film flexible electronic devices.
Overall, we hope that the results presented in this review could help improve understanding of the photoalignment technique and can be interesting to a wide range of scientists and scientific managers who are willing to develop new applications of LC devices.

Author Contributions

Writing—review and editing, V.C., A.K., and Q.G. All authors have read and agreed to the published version of the manuscript.

Funding

This research was funded by the Russian Science Foundation, grant number 20-19-00201.

Data Availability Statement

The authors declare that all data supporting this review are available within the article and its supplementary references. The data that support the findings of this study are available on request from the corresponding author, V.C.

Conflicts of Interest

The authors declare no conflict of interest.

References

  1. Tabiryan, N.V.; Khoo, I.C. Recent advances in nematic liquid crystal nonlinear optics. Handb. Liq. Cryst. 2014, 8, 1–21. [Google Scholar]
  2. Bos, P. Fast-switching liquid-crystal effects for displays. Inf. Disp. 2007, 23, 20. [Google Scholar]
  3. He, Z.; Tan, G.; Chanda, D.; Wu, S.-T. Novel liquid crystal photonic devices enabled by two-photon polymerization. Opt. Express 2019, 27, 11472–11491. [Google Scholar] [CrossRef]
  4. Yin, K.; Xiong, J.; He, Z.; Wu, S.-T. Patterning liquid-crystal alignment for ultrathin flat optics. ACS Omega 2020, 5, 31485–31489. [Google Scholar] [CrossRef] [PubMed]
  5. Guo, Q.; Srivastava, A.K.; Pozhidaev, E.P.; Chigrinov, V.G.; Kwok, H.S. Optimization of alignment quality of ferroelectric liquid crystals by controlling anchoring energy. Appl. Phys. Express 2014, 7, 021701. [Google Scholar] [CrossRef]
  6. Finnemeyer, V.; Bryant, D.; Reich, R.; Clark, H.; Berry, S.; Bozler, C.; Yaroshchuk, O.; Lu, L.; Bos, P. Versatile alignment layer method for new types of liquid crystal photonic devices. J. Appl. Phys. 2015, 118, 034501. [Google Scholar] [CrossRef]
  7. O’Neill, M.; Kelly, S. Photoinduced surface alignment for liquid crystal displays. J. Phys. D Appl. Phys. 2000, 33, R67. [Google Scholar] [CrossRef]
  8. Van Aerle, N.; Barmentlo, M.; Hollering, R. Effect of rubbing on the molecular orientation within polyimide orienting layers of liquid-crystal displays. J. Appl. Phys. 1993, 74, 3111–3120. [Google Scholar] [CrossRef]
  9. Ichimura, K.; Suzuki, Y.; Seki, T.; Hosoki, A.; Aoki, K. Reversible change in alignment mode of nematic liquid crystals regulated photochemically by command surfaces modified with an azobenzene monolayer. Langmuir 1988, 4, 1214–1216. [Google Scholar] [CrossRef]
  10. Yin, Y.; Li, W.; Cao, H.; Guo, J.; Li, B.; He, S.; Ouyang, C.; Cao, M.; Huang, H.; Yang, H. Effects of monomer structure on the morphology of polymer network and the electro-optical property of reverse-mode polymer-stabilized cholesteric texture. J. Appl. Polym. Sci. 2009, 111, 1353–1357. [Google Scholar] [CrossRef]
  11. Wang, J.; McGinty, C.; Reich, R.; Finnemeyer, V.; Clark, H.; Berry, S.; Bos, P. Process for a reactive monomer alignment layer for liquid crystals formed on an azodye sublayer. Materials 2018, 11, 1195. [Google Scholar] [CrossRef] [PubMed] [Green Version]
  12. Armitage, D. Alignment of liquid crystals on obliquely evaporated silicon oxide films. J. Appl. Phys. 1980, 51, 2552–2555. [Google Scholar] [CrossRef]
  13. Guo, Q.; Srivastava, A.K.; Chigrinov, V.G.; Kwok, H.S. Stabilized Photo-Alignment Layer for Liquid Crystal. U.S. Patent No. 9,791,743, 17 October 2017. [Google Scholar]
  14. Sun, J.; Chigrinov, V. Effect of azo dye layer on rewriting speed of optical rewritable E-paper. Mol. Cryst. Liq. Cryst. 2012, 561, 1–7. [Google Scholar] [CrossRef]
  15. Chigrinov, V.; Guo, Q.; Kudreyko, A. Photo-aligned ferroelectric liquid crystal devices with novel electro-optic characteristics. Crystals 2020, 10, 563. [Google Scholar] [CrossRef]
  16. Benoit, H. Study of the Kerr effect by dilute solutions of rigid macromolecules. Ann. Phys. (Paris) 1951, 6, 561–609. [Google Scholar]
  17. Morita, A.; Watanabe, H. An exact treatment of the Kerr-effect relaxation in a strong unidirectional electric field. J. Chem. Phys. 1979, 70, 4708–4713. [Google Scholar] [CrossRef]
  18. Chigrinov, V.; Pikin, S.; Verevochnikov, A.; Kozenkov, V.; Khazimullin, M.; Ho, J.; Huang, D.D.; Kwok, H.-S. Diffusion model of photoaligning in azo-dye layers. Phys. Rev. E 2004, 69, 061713. [Google Scholar] [CrossRef] [Green Version]
  19. Youngworth, K.S.; Brown, T.G. Focusing of high numerical aperture cylindrical-vector beams. Opt. Express 2000, 7, 77–87. [Google Scholar] [CrossRef]
  20. Lerman, G.M.; Yanai, A.; Levy, U. Demonstration of nanofocusing by the use of plasmonic lens illuminated with radially polarized light. Nano Lett. 2009, 9, 2139–2143. [Google Scholar] [CrossRef]
  21. Davis, J.A.; Hashimoto, N.; Kurihara, M.; Hurtado, E.; Pierce, M.; Sánchez-López, M.M.; Badham, K.; Moreno, I. Analysis of a segmented q-plate tunable retarder for the generation of first-order vector beams. Appl Opt. 2015, 54, 9583–9590. [Google Scholar] [CrossRef]
  22. Kim, J.; Li, Y.; Miskiewicz, M.N.; Oh, C.; Kudenov, M.W.; Escuti, M.J. Fabrication of ideal geometric-phase holograms with arbitrary wavefronts. Optica 2015, 2, 958–964. [Google Scholar] [CrossRef]
  23. Slussarenko, S.; Murauski, A.; Du, T.; Chigrinov, V.; Marrucci, L.; Santamato, E. Tunable liquid crystal q-plates with arbitrary topological charge. Opt. Express 2011, 19, 4085–4090. [Google Scholar] [CrossRef] [PubMed] [Green Version]
  24. Ito, T.; Okazaki, S. Pushing the limits of lithography. Nature 2000, 406, 1027–1031. [Google Scholar] [CrossRef] [PubMed]
  25. Chen, P.; Ji, W.; Wei, B.-Y.; Hu, W.; Chigrinov, V.; Lu, Y.-Q. Generation of arbitrary vector beams with liquid crystal polarization converters and vector-photoaligned q-plates. Appl. Phys. Lett. 2015, 107, 241102. [Google Scholar] [CrossRef]
  26. Yeh, P.; Gu, C. Optics of Liquid Crystal Displays; John Wiley & Sons: Hoboken, NJ, USA, 2009; Volume 67. [Google Scholar]
  27. Wu, H.; Hu, W.; Hu, H.-C.; Lin, X.-W.; Zhu, G.; Choi, J.-W.; Chigrinov, V.; Lu, Y.-Q. Arbitrary photo-patterning in liquid crystal alignments using DMD based lithography system. Opt. Express 2012, 20, 16684–16689. [Google Scholar] [CrossRef] [Green Version]
  28. Ren, H.; Wu, S.-T. Tunable electronic lens using a gradient polymer network liquid crystal. Appl Phys. Lett. 2003, 82, 22–24. [Google Scholar] [CrossRef]
  29. Schadt, M.; Seiberle, H.; Schuster, A.; Kelly, S.M. Photo-generation of linearly polymerized liquid crystal aligning layers comprising novel, integrated optically patterned retarders and color filters. Jpn. J. Appl. Phys. 1995, 34, 3240. [Google Scholar] [CrossRef]
  30. Yan, J.; Rao, L.; Jiao, M.; Li, Y.; Cheng, H.-C.; Wu, S.-T. Polymer-stabilized optically isotropic liquid crystals for next-generation display and photonics applications. J. Mater. Chem. 2011, 21, 7870–7877. [Google Scholar] [CrossRef]
  31. Zhan, Q. Cylindrical vector beams: From mathematical concepts to applications. Adv. Opt. Photonics 2009, 1, 1–57. [Google Scholar] [CrossRef]
  32. Yao, A.M.; Padgett, M.J. Orbital angular momentum: Origins, behavior and applications. Adv. Opt. Photonics 2011, 3, 161–204. [Google Scholar] [CrossRef] [Green Version]
  33. Yi, X.; Ling, X.; Zhang, Z.; Li, Y.; Zhou, X.; Liu, Y.; Chen, S.; Luo, H.; Wen, S. Generation of cylindrical vector vortex beams by two cascaded metasurfaces. Opt. Express 2014, 22, 17207–17215. [Google Scholar] [CrossRef] [PubMed] [Green Version]
  34. Tang, M.-J.; Chen, P.; Zhang, W.-L.; Tam, A.M.; Chigrinov, V.G.; Hu, W.; Lu, Y.-Q. Integrated and reconfigurable optical paths based on stacking optical functional films. Opt. Express 2016, 24, 25510–25514. [Google Scholar] [CrossRef]
  35. Denisenko, V.; Shvedov, V.; Desyatnikov, A.S.; Neshev, D.N.; Krolikowski, W.; Volyar, A.; Soskin, M.; Kivshar, Y.S. Determination of topological charges of polychromatic optical vortices. Opt. Express 2009, 17, 23374–23379. [Google Scholar] [CrossRef]
  36. Heikenfeld, J.; Zhou, K.; Kreit, E.; Raj, B.; Yang, S.; Sun, B.; Milarcik, A.; Clapp, L.; Schwartz, R. Electrofluidic displays using Young–Laplace transposition of brilliant pigment dispersions. Nat. Photonics 2009, 3, 292–296. [Google Scholar] [CrossRef]
  37. Chigrinov, V.G.; Yakovlev, D.; Kwok, H.S. Optimization and modeling of liquid-crystal displays. Inf. Disp. 2004, 20, 26. [Google Scholar] [CrossRef]
  38. Yakovlev, D.A.; Simonenko, G.V.; Tsoi, V.I.; Chigrinov, V.G.; Khokhlov, N.A.; Podyachev, Y.B. LCD-DESIGN: Universal system for computer simulation and optimization of electro-optical devices on the base of liquid crystals. In Proceedings of the Saratov Fall Meeting 2001: Coherent Optics of Ordered and Random Media II, Saratov, Russia, 2–5 October 2001; pp. 255–263. [Google Scholar]
  39. Yakovlev, D.A.; Chigrinov, V.G.; Kwok, H.-S. Modeling and Optimization of LCD Optical Performance; John Wiley & Sons: Hoboken, NJ, USA, 2015. [Google Scholar]
  40. Geng, Y.; Yao, L. Effect of azimuthal anchoring energy on rewriting speed of optical rewritable e-paper. Liq. Cryst. 2020, 1–7. [Google Scholar] [CrossRef]
  41. Wang, L.; Sun, J.; Liu, H.; Chigrinov, V.; Kwok, H.S. Increasing the rewriting speed of ORW e-paper by electric field. Liq. Cryst. 2018, 45, 553–560. [Google Scholar] [CrossRef]
  42. Sun, J.; Ren, L.; Deng, K.; Wang, T.; Guo, Q.; Sang, J.; Liu, Y.; Liu, H.; Shang, J.; Chigrinov, V. Greyscale generation for optically driving liquid crystal display. Liq. Cryst. 2019, 46, 1340–1344. [Google Scholar] [CrossRef]
  43. Chigrinov, V.G.; Kudreyko, A.A. Tunable optical properties for ORW e-paper. Liq. Cryst. 2020, 1–5. [Google Scholar] [CrossRef]
  44. Sun, J.; Deng, K.; Sang, J.; Gong, X.; Liu, Y.; Shang, J.; Liu, H.; Zhang, Y.; Guo, Q.; Chigrinov, V. The effect of chiral dopant on the rewriting speed of optically driving liquid crystal display. Liq. Cryst. 2020, 47, 516–521. [Google Scholar] [CrossRef]
  45. Ma, Y.; Xin, S.J.; Liu, X.; Liu, Y.; Sun, J.; Wang, X.; Guo, Q.; Chigrinov, V.G. Colour generation for optically driving liquid crystal display. Liq. Cryst. 2020, 47, 1729–1734. [Google Scholar] [CrossRef]
  46. Fattal, D.; Peng, Z.; Tran, T.; Vo, S.; Fiorentino, M.; Brug, J.; Beausoleil, R.G. A multi-directional backlight for a wide-angle, glasses-free three-dimensional display. Nature 2013, 495, 348–351. [Google Scholar] [CrossRef]
  47. Chen, H.; Weng, Y.; Xu, D.; Tabiryan, N.V.; Wu, S.T. Beam steering for virtual/augmented reality displays with a cycloidal diffractive waveplate. Opt. Express 2016, 24, 7287–7298. [Google Scholar] [CrossRef] [PubMed] [Green Version]
  48. Khorasaninejad, M.; Capasso, F. Metalenses: Versatile multifunctional photonic components. Science 2017, 358. [Google Scholar] [CrossRef] [PubMed] [Green Version]
  49. Serak, S.V.; Roberts, D.E.; Hwang, J.-Y.; Nersisyan, S.R.; Tabiryan, N.V.; Bunning, T.J.; Steeves, D.M.; Kimball, B.R. Diffractive waveplate arrays [Invited]. J. Opt. Soc. Am. B 2017, 34. [Google Scholar] [CrossRef]
  50. Dammann, H.; Görtler, K. High-efficiency in-line multiple imaging by means of multiple phase holograms. Opt. Commun. 1971, 3, 312–315. [Google Scholar] [CrossRef]
  51. Veldkamp, W.B.; Leger, J.R.; Swanson, G.J. Coherent summation of laser beams using binary phase gratings. Opt. Lett. 1986, 11, 303–305. [Google Scholar] [CrossRef] [PubMed]
  52. Morrison, R.L.; Walker, S.L.; Cloonan, T.J. Beam array generation and holographic interconnections in a free-space optical switching network. Appl Opt. 1993, 32, 2512–2518. [Google Scholar] [CrossRef]
  53. Yu, J.; Zhou, C.; Jia, W.; Ma, J.; Hu, A.; Wu, J.; Wang, S. Distorted dammann grating. Opt. Lett. 2013, 38, 474–476. [Google Scholar] [CrossRef] [PubMed]
  54. Davis, J.A.; Moreno, I.; Martínez, J.L.; Hernandez, T.J.; Cottrell, D.M. Creating three-dimensional lattice patterns using programmable Dammann gratings. Appl Opt. 2011, 50, 3653–3657. [Google Scholar] [CrossRef]
  55. Ge, S.-J.; Chen, P.; Ma, L.-L.; Liu, Z.; Zheng, Z.-G.; Shen, D.; Hu, W.; Lu, Y.-Q. Optical array generator based on blue phase liquid crystal Dammann grating. Opt. Mater. Express 2016, 6, 1087–1092. [Google Scholar] [CrossRef]
  56. Doh, K.B.; Dobson, K.; Poon, T.C.; Chung, P.S. Optical image coding with a circular Dammann grating. Appl. Opt. 2009, 48, 134–139. [Google Scholar] [CrossRef] [Green Version]
  57. Shinoda, Y.; Liu, J.P.; Chung, P.S.; Dobson, K.; Zhou, X.; Poon, T.C. Three-dimensional complex image coding using a circular Dammann grating. Appl. Opt. 2011, 50, B38–B45. [Google Scholar] [CrossRef] [PubMed] [Green Version]
  58. Zhao, S.; Chung, P.S. Collimation testing using a circular Dammann grating. Opt. Commun. 2007, 279, 1–6. [Google Scholar] [CrossRef]
  59. Zhang, Y.; Gao, N.; Xie, C. Using circular Dammann gratings to produce impulse optic vortex rings. Appl. Phys. Lett. 2012, 100. [Google Scholar] [CrossRef]
  60. Xu, Y.; Han, X.; Li, G.; Liu, J.; Xia, K.; Li, J. Vortex and LG01-mode Nd:YAG laser involving a circular Dammann grating. Opt. Eng. 2016, 55. [Google Scholar] [CrossRef]
  61. Wen, F.J.; Chen, Z.; Chung, P.S. Area measurement at long-distance using a circular Dammann grating. Appl. Opt. 2010, 49, 648–652. [Google Scholar] [CrossRef] [PubMed]
  62. Wen, F.J.; Chung, P.S. Use of the circular Dammann grating in angle measurement. Appl. Opt. 2008, 47, 5197–5200. [Google Scholar] [CrossRef]
  63. Zhou, C.; Jia, J.; Liu, L. Circular Dammann grating. Opt. Lett. 2003, 28, 2174–2176. [Google Scholar] [CrossRef]
  64. Zhao, S.; Chung, P.S. Design of a circular Dammann grating. Opt. Lett. 2006, 31, 2387–2389. [Google Scholar] [CrossRef]
  65. Levy, U.; Desiatov, B.; Goykhman, I.; Nachmias, T.; Ohayon, A.; Meltzer, S.E. Design, fabrication, and characterization of circular Dammann gratings based on grayscale lithography. Opt. Lett. 2010, 35, 880–882. [Google Scholar] [CrossRef] [PubMed]
  66. Pozhidaev, E.; Minchenko, M.; Molkin, V.; Torgova, S.; Srivastava, A.; Chigrinov, V.; Kwok, H.; Vashenko, V.; Krivoshey, A. High frequency low voltage shock-free ferroelectric liquid crystal: A new electro-optical mode with electrically suppressed helix. In Proceedings of the 31th International Display Research Conference EuroDisplay, Arcachon, France, 19–22 September 2011; pp. 19–22. [Google Scholar]
  67. Fan, F.; Yao, L.; Wang, X.; Shi, L.; Srivastava, A.K.; Chigrinov, V.G.; Kwok, H.-S.; Wen, S. Ferroelectric liquid crystal dammann grating by patterned photoalignment. Crystals 2017, 7, 79. [Google Scholar] [CrossRef] [Green Version]
  68. Luo, D.; Sun, X.W.; Dai, H.T.; Demir, H.V. Polarization-dependent circular Dammann grating made of azo-dye-doped liquid crystals. Appl. Opt. 2011, 50, 2316–2321. [Google Scholar] [CrossRef] [PubMed] [Green Version]
  69. Guo, Q.; Srivastava, A.K.; Chigrinov, V.G.; Kwok, H.S. Polymer and azo-dye composite: A photo-alignment layer for liquid crystals. Liq. Cryst. 2014, 41, 1465–1472. [Google Scholar] [CrossRef]
  70. Shteyner, E.A.; Srivastava, A.K.; Chigrinov, V.G.; Kwok, H.-S.; Afanasyev, A.D. Submicron-scale liquid crystal photo-alignment. Soft Matter 2013, 9. [Google Scholar] [CrossRef]
  71. Guo, Q.; Liu, T.; Wang, X.; Zheng, Z.; Kudreyko, A.; Zhao, H.; Chigrinov, V.; Kwok, H.-S. Ferroelectric liquid crystals for fast switchable circular Dammann grating. Chin. Opt. Lett. 2020, 18, 080002. [Google Scholar] [CrossRef]
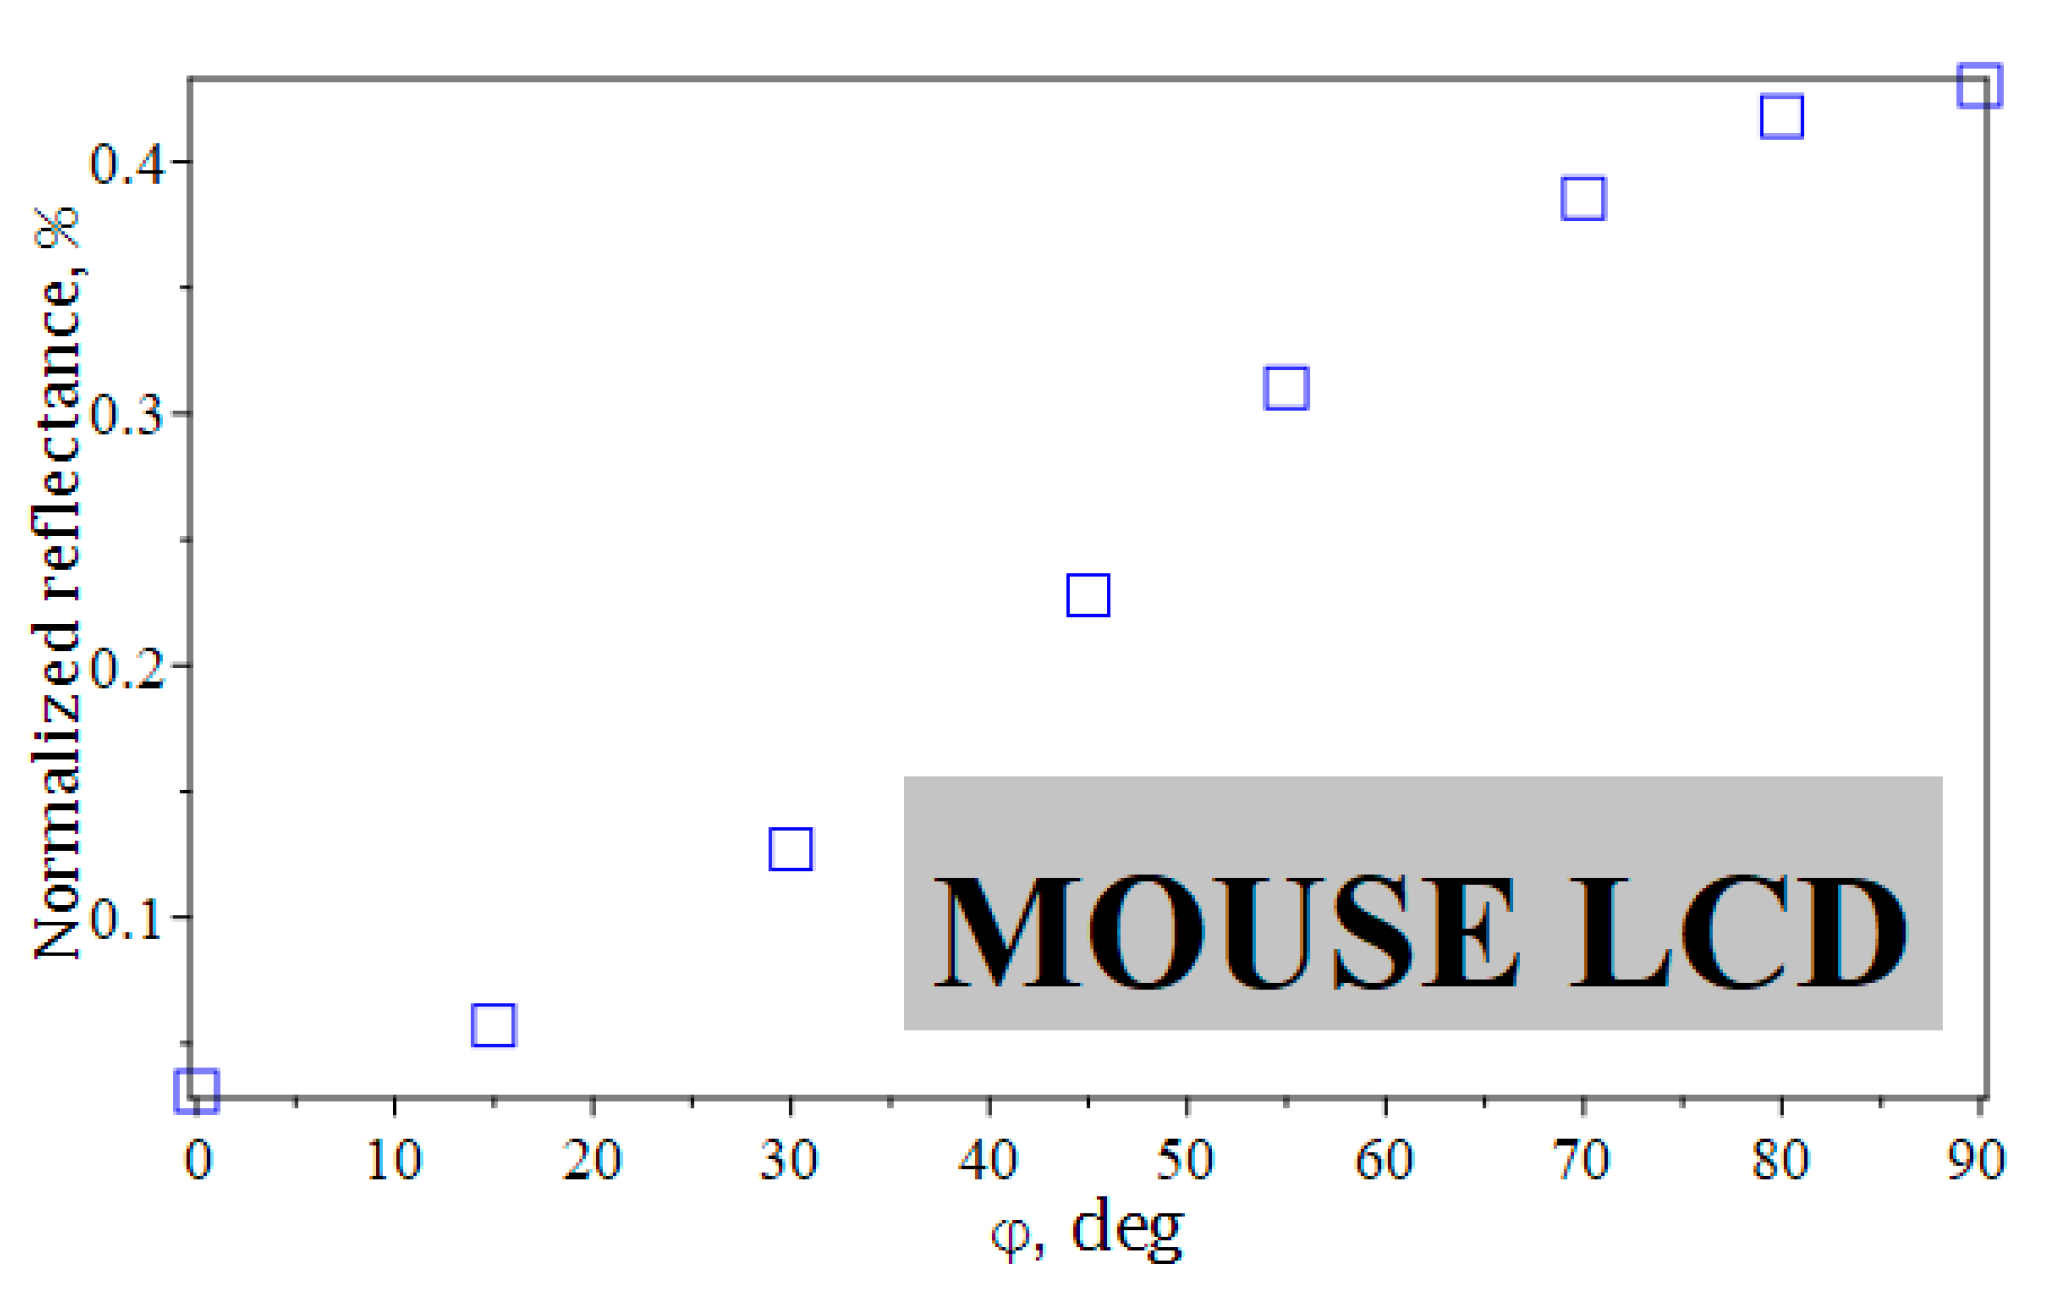
Figure 1. (a) Distribution function ρ(u) of the azo dye molecules for different values of parameter A; (b) schematic representation of the photoalignment technique.
Crystals 11 00084 g001
Figure 2. Schematic polarization distributions (top), experimental (middle), and simulated (bottom) intensity distributions of vector beams (VBs) with P = 1, (a) φ 0 = 0 (radial), (b) φ 0 = π / 4 (vortex), and (c) φ 0 = π / 2 (azimuthal). Cylindrically symmetric polarization distribution provided such fan-like images. Scale bars indicate 200 μm [25].
Crystals 11 00084 g002
Figure 3. Flow diagrams of fabrication procedure of liquid crystal polymer (LCP) q-plate and assembling of different optical films [34].
Crystals 11 00084 g003
Figure 4. Micrographs and the output beam patterns: (a) q-plate 1, (b) after stacking a LCP quarter-wave plate (QWP), (c) overlaying all desired films. Short black lines on blue plates indicate liquid crystal (LC) director distribution in the q-plate; pink plates illustrate a QWP. Polarizer directions are indicated by red and blue arrows. White arrows show the direction of analyzer before the charge-coupled device. Scale bars and color bar indicate 200 μm and relative optical intensity, respectively [34].
Crystals 11 00084 g004
Figure 5. (Color online) (a) Schematic representation of twisted nematic liquid crystal cell (d = 6.85 μm). (b) Device structure of optically rewritable electronic paper (ORW e-paper) [43].
Crystals 11 00084 g005
Figure 6. (Color online) Normalized reflectance of ORW e-paper versus the twist angle. Insert: the generated image includes maximum and minimum of the normalized reflectance [43].
Crystals 11 00084 g006
Figure 7. (a) Schematic representation of optically driven LCD. (b) Optically driven LCD with patterned reflective paint [45].
Crystals 11 00084 g007
Figure 8. Flower images of color optically driven LCDs: (a) gridded color map; (b) flower pattern without color filter; (c,d) transmissive and reflective modes with color filter, respectively (each colored line width ≈ 1 mm) [45].
Crystals 11 00084 g008
Figure 9. (a) Patterned colors: each color line ≈ 1 mm. (b) Colored images of letters, obtained by using reflective paint [45].
Crystals 11 00084 g009
Figure 10. Top view to illustrate the ferroelectric liquid crystal (FLC) molecule orientation. State 1 represents the no-applied-electric-field state, and State 2 and 3 represent the two different states with different electric field polarities.
Crystals 11 00084 g010
Figure 11. (a) Structure of the FLC Dammann grating; (b) diffractive state under crossed polarizer and analyzer (microscopic photo); (c) microscopic photo of the electrically suppressed helix (ESH) FLC Dammann grating (DG) in the non-diffractive state under crossed polarizer and analyzer; (d) illustration of molecular orientation and the output polarization plane in different states for two types of domains [67].
Crystals 11 00084 g011
Figure 12. (a) Optical setup for demonstration of the diffraction performance in the DG; (b) observation of the diffractive state; (c) non-diffractive state [67].
Crystals 11 00084 g012
Figure 13. Two-step exposure technique of patterned alignment for FLC circular DG (CDG): (a) exposure of polarized UV on the SD1 substrate; (b) exposure of SD1 substrate with the mask; (c) FLC CDG cell with a single-side alignment.
Crystals 11 00084 g013
Figure 14. Observation of diffraction rings provided by FLC CDG: (a) the far-field diffraction patterns and (b) visualization of light intensity profiles [71].
Crystals 11 00084 g014
Table 1. Computer-generated grey tones for different twist angles.
Twist angle15°30°45°55°70°80°90°
Reflectance0.0310.05710.16380.25790.32020.38550.4180.4302
Generated shades of grey Crystals 11 00084 i001 Crystals 11 00084 i002 Crystals 11 00084 i003 Crystals 11 00084 i004 Crystals 11 00084 i005 Crystals 11 00084 i006 Crystals 11 00084 i007 Crystals 11 00084 i008
Publisher’s Note: MDPI stays neutral with regard to jurisdictional claims in published maps and institutional affiliations.

