
Experimental and Numerical Study of Lattice Girder Composite Slabs with Monolithic Joint


Abstract
:1. Introduction
2. Experimental Study
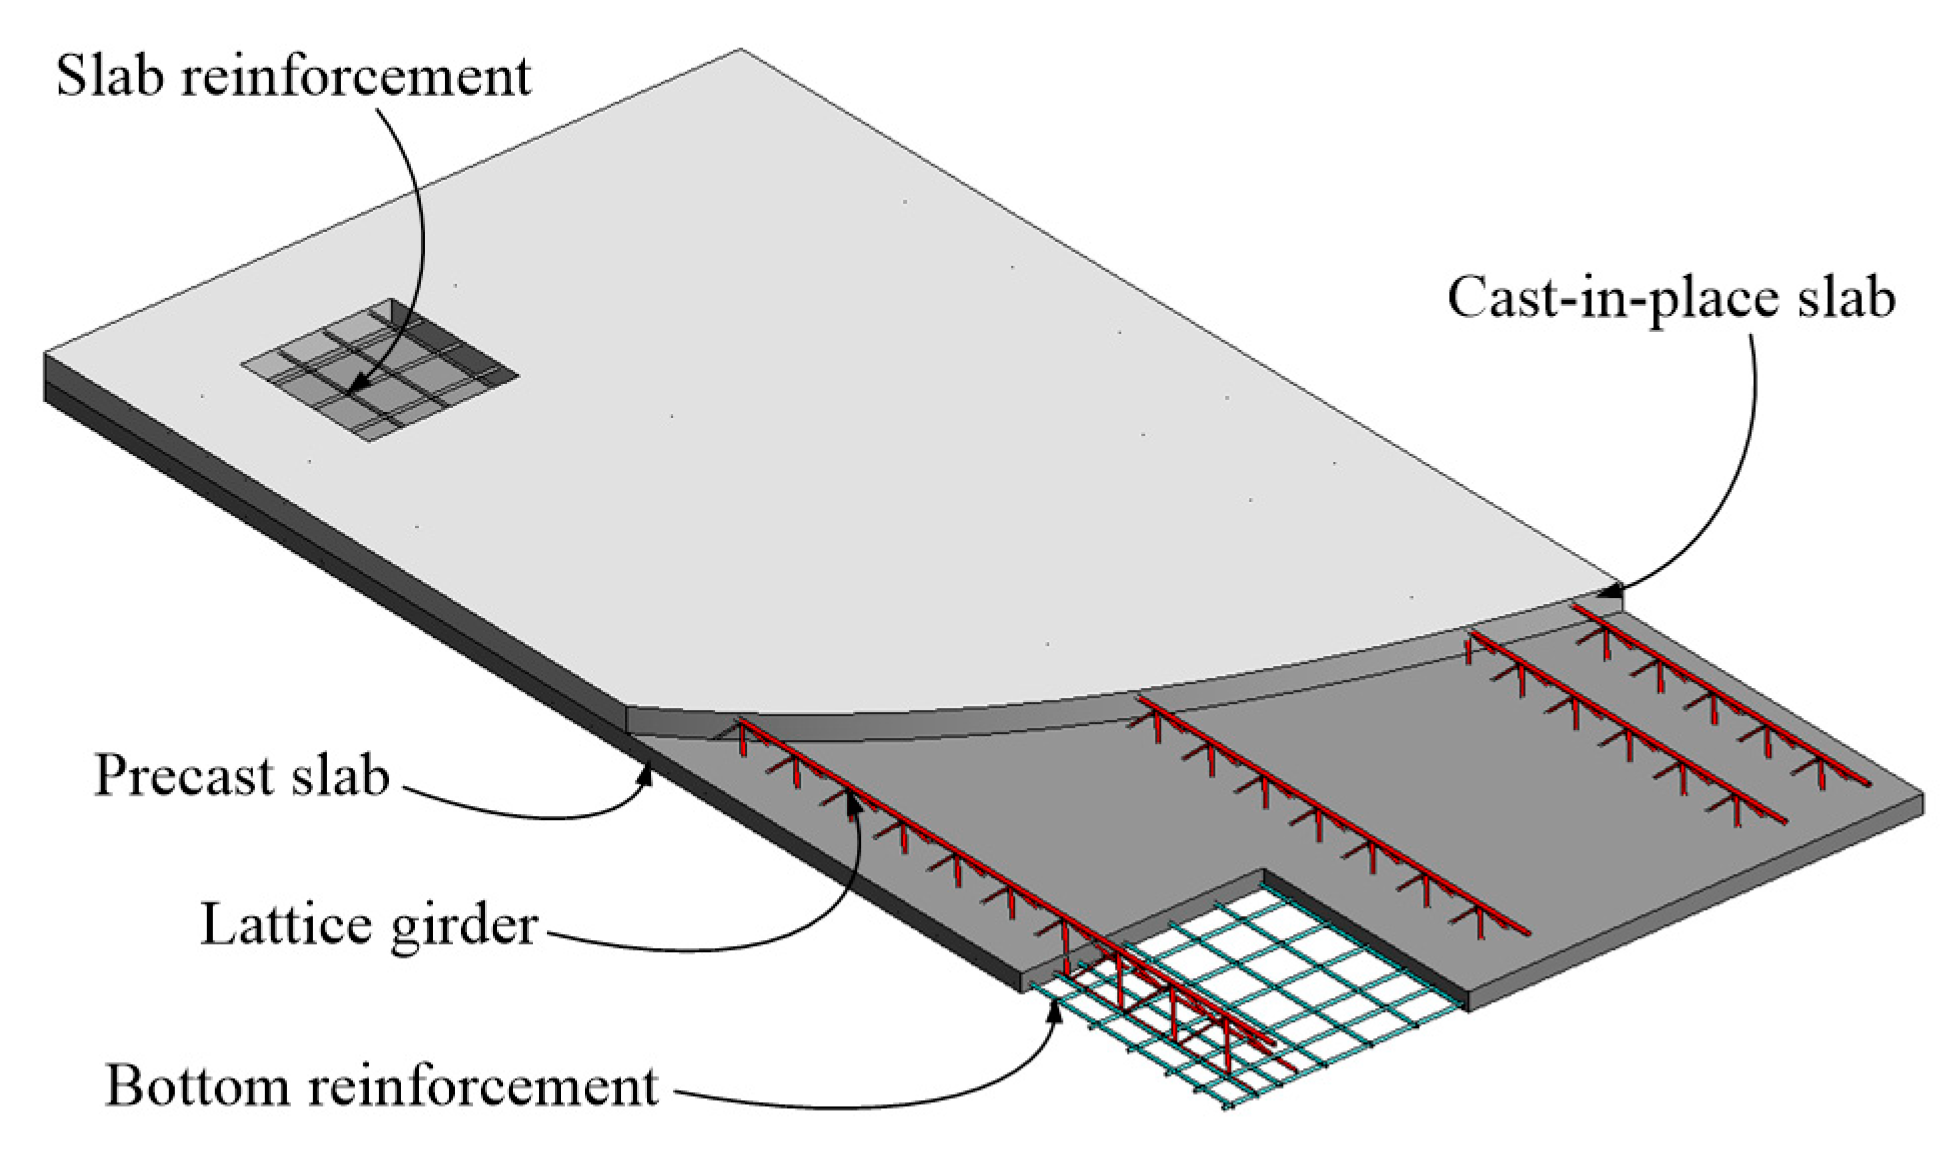
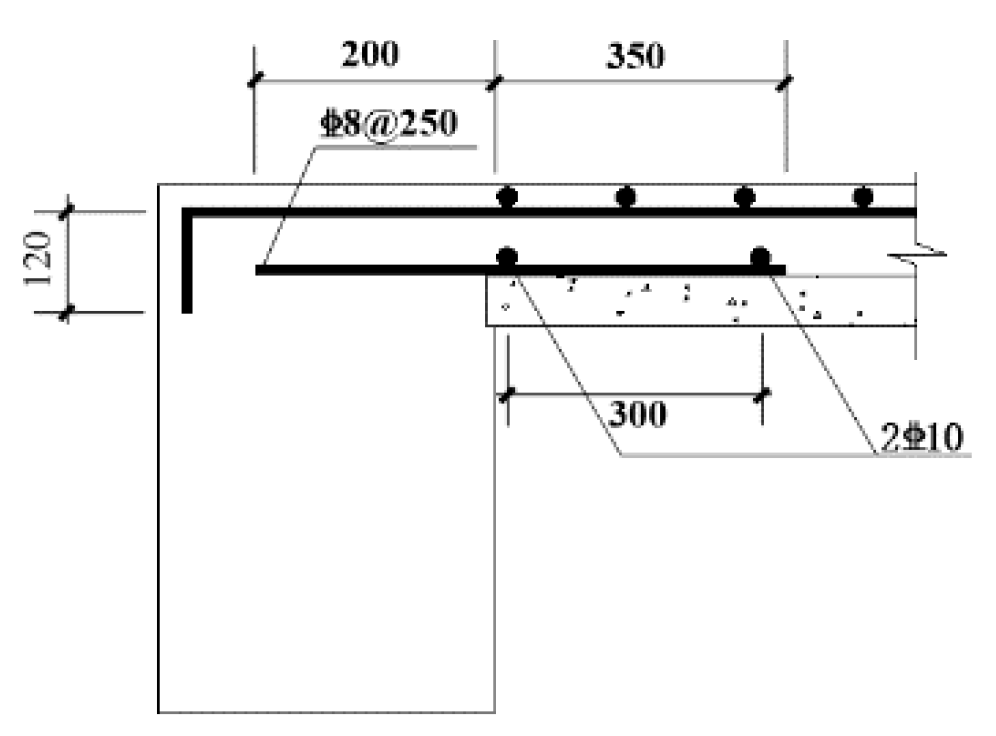
2.1. Test Specimen
2.2. Testing Method
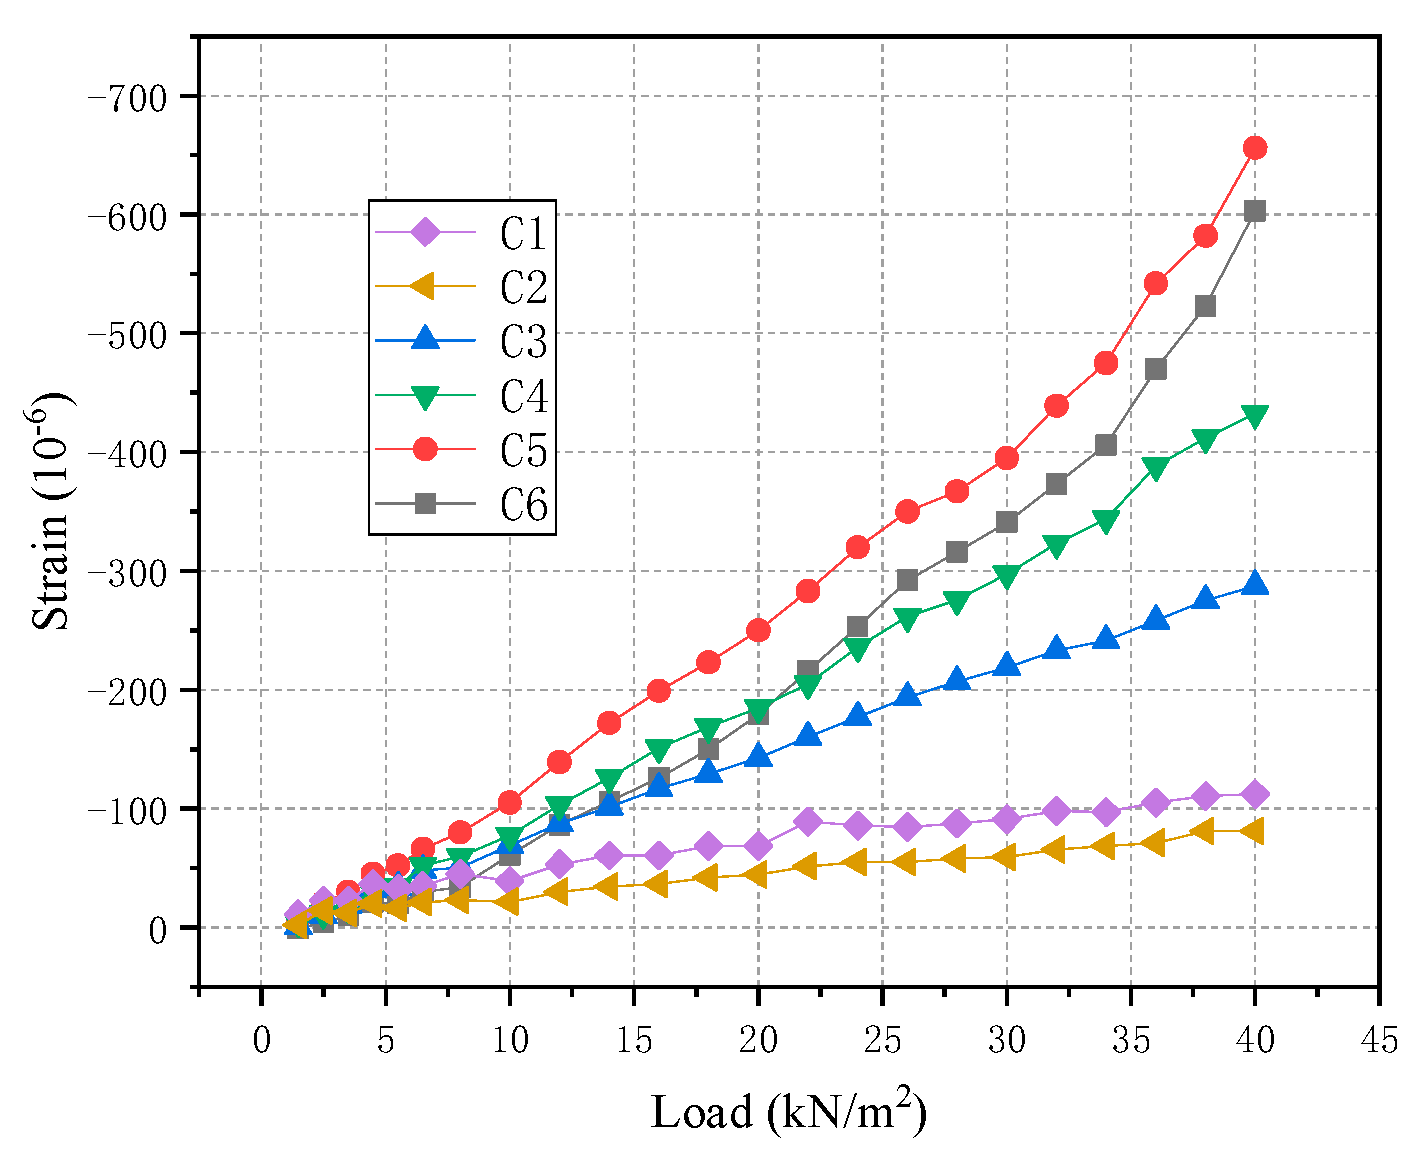
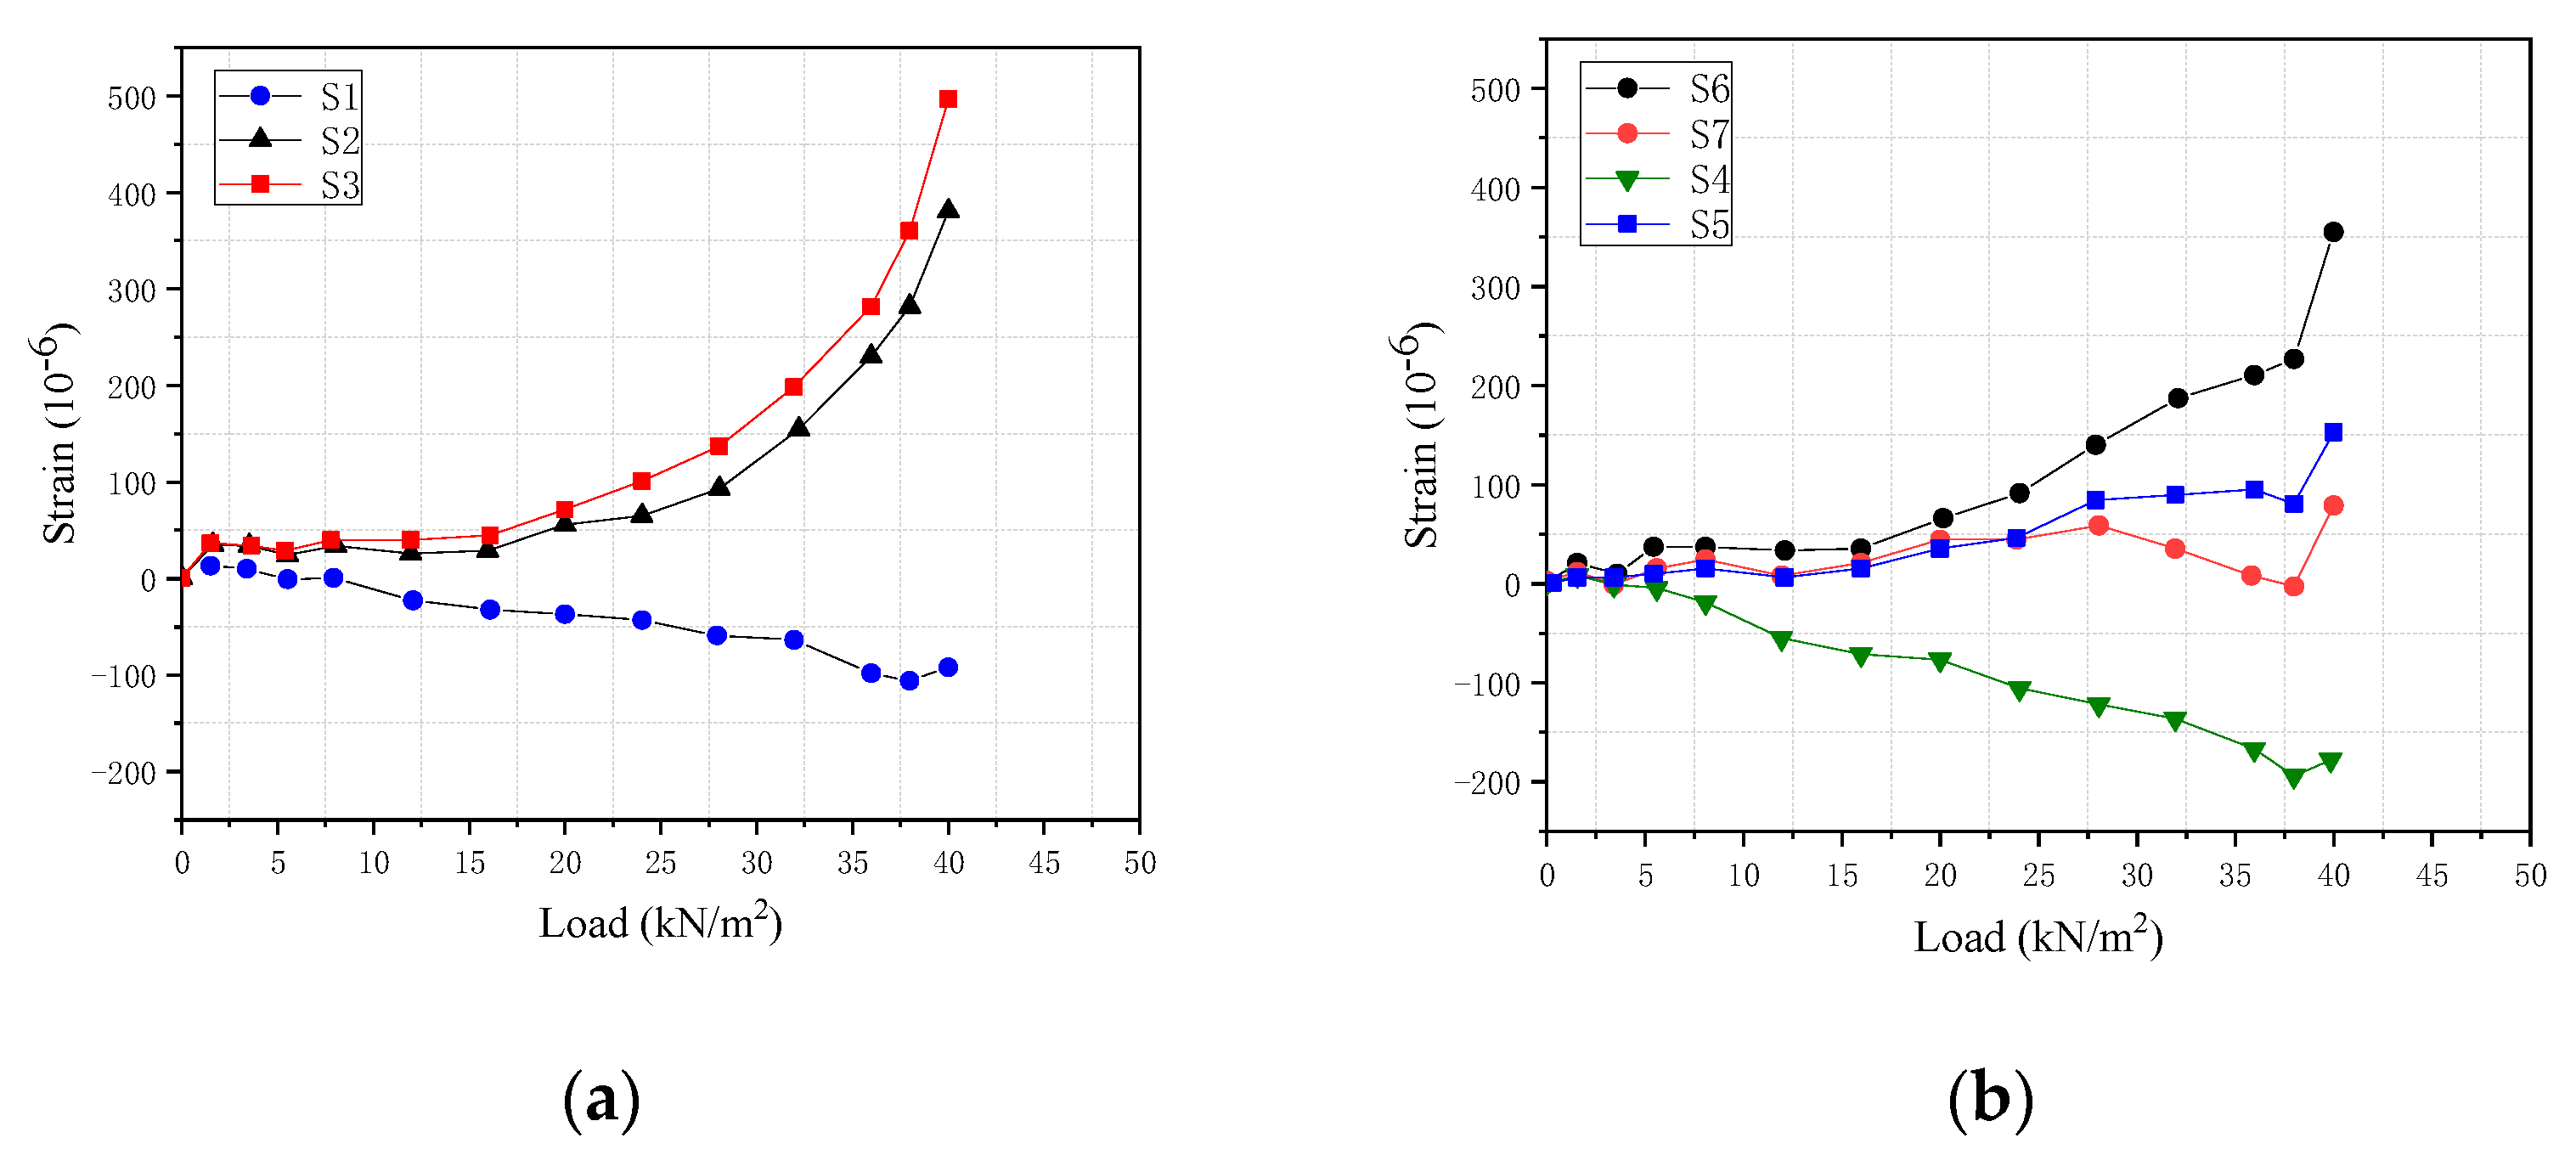
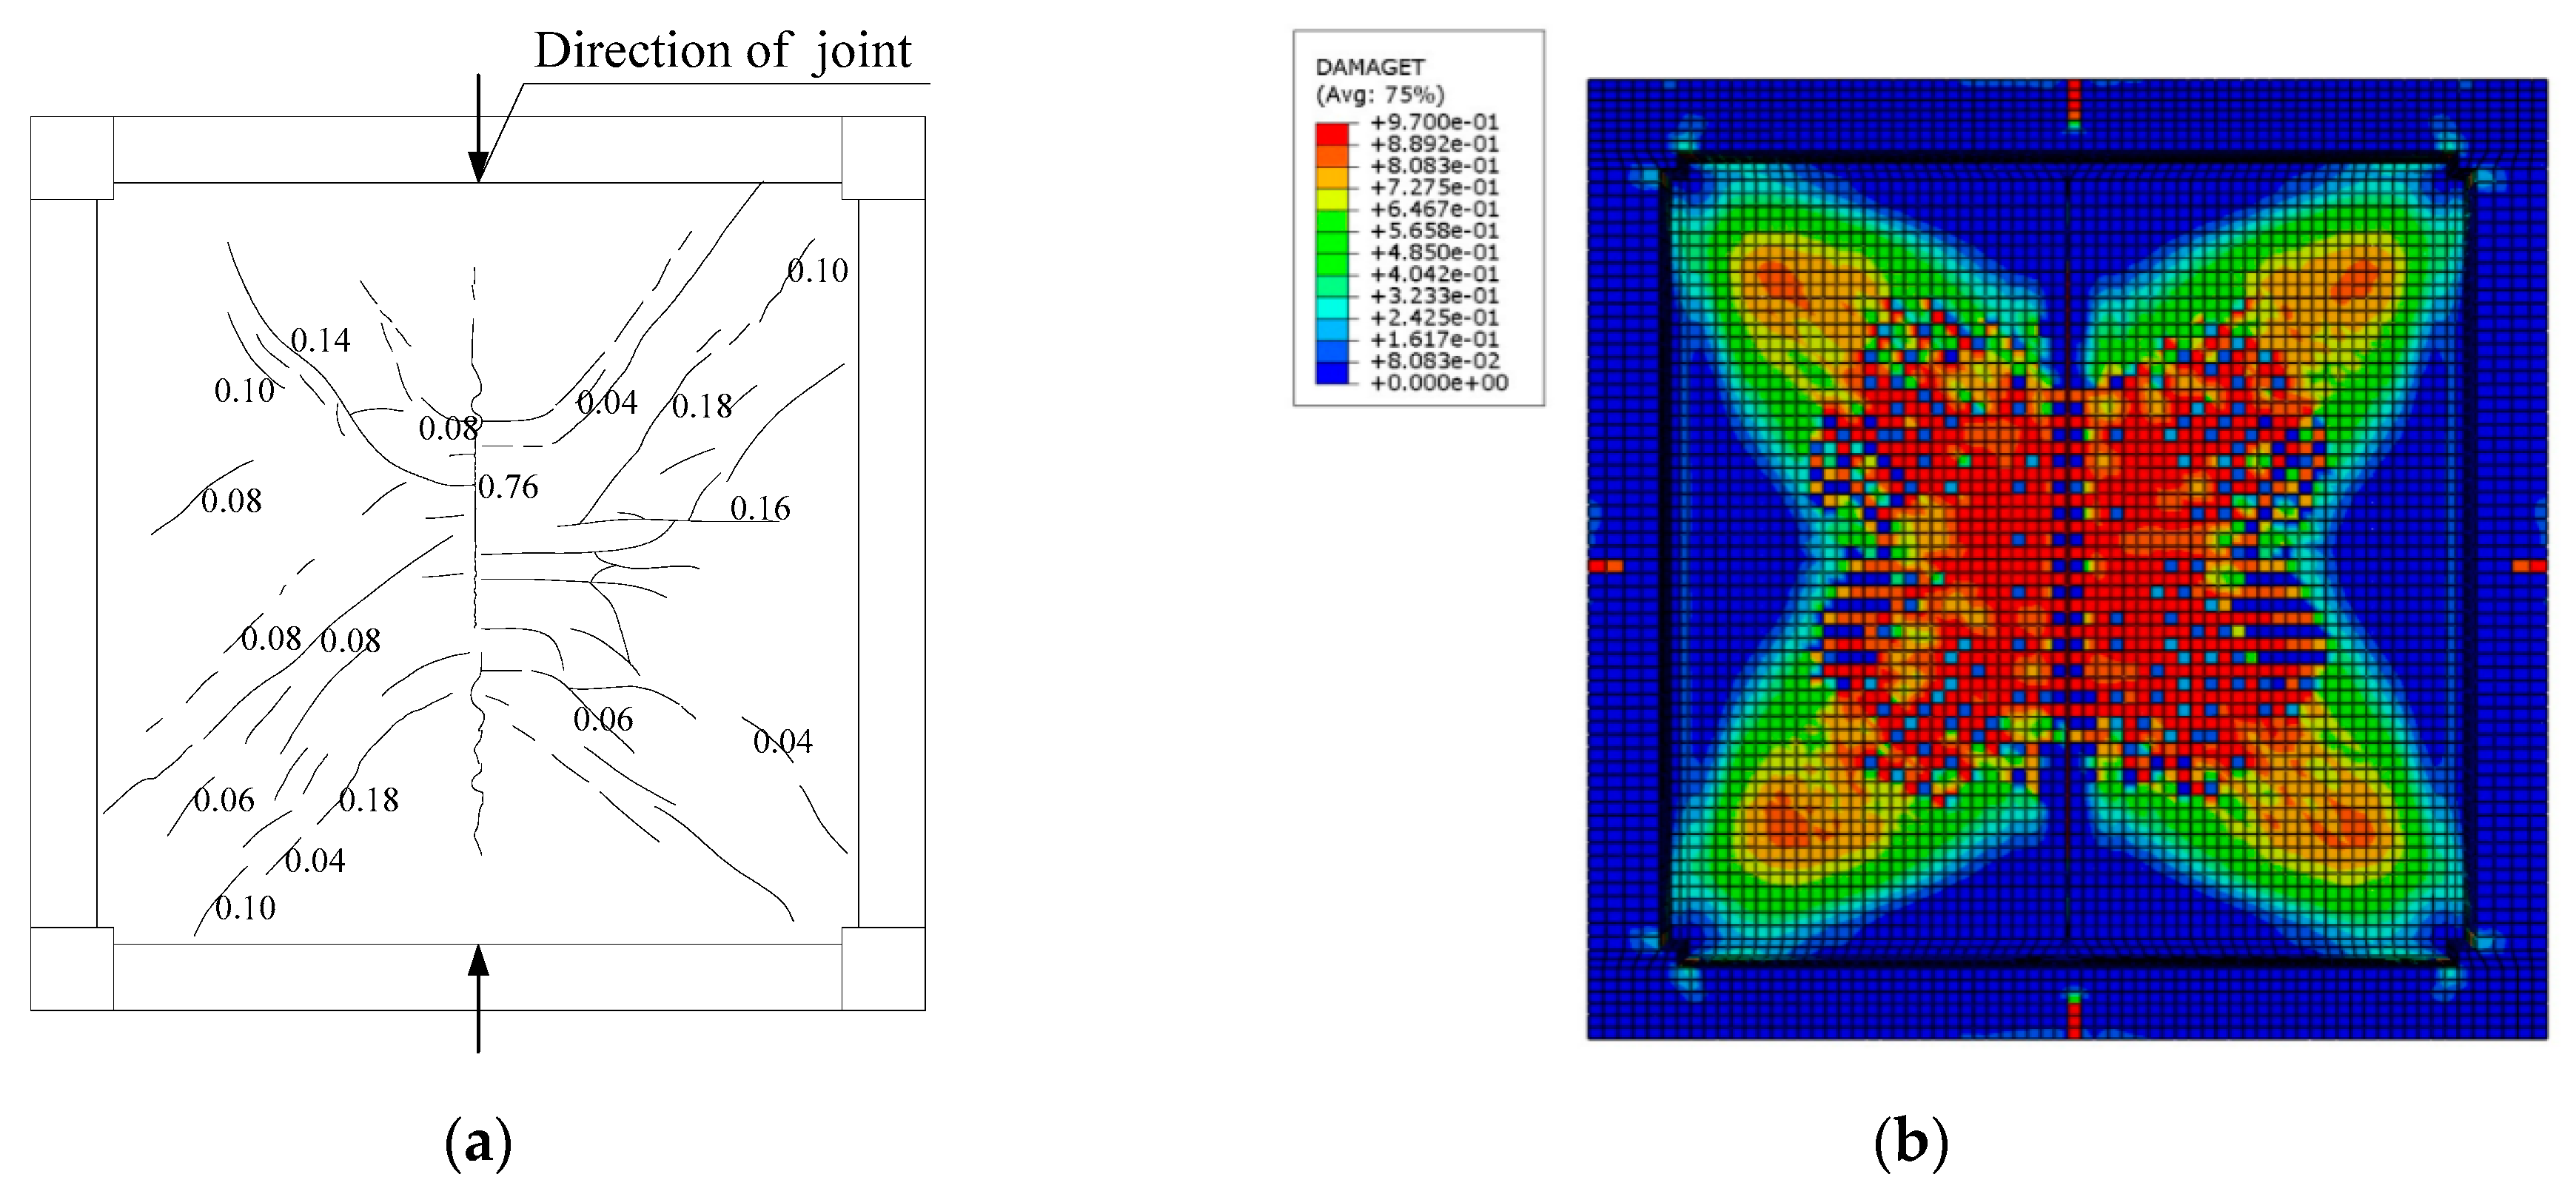
2.3. Test Results
3. Numerical Simulation
3.1. Numerical Model
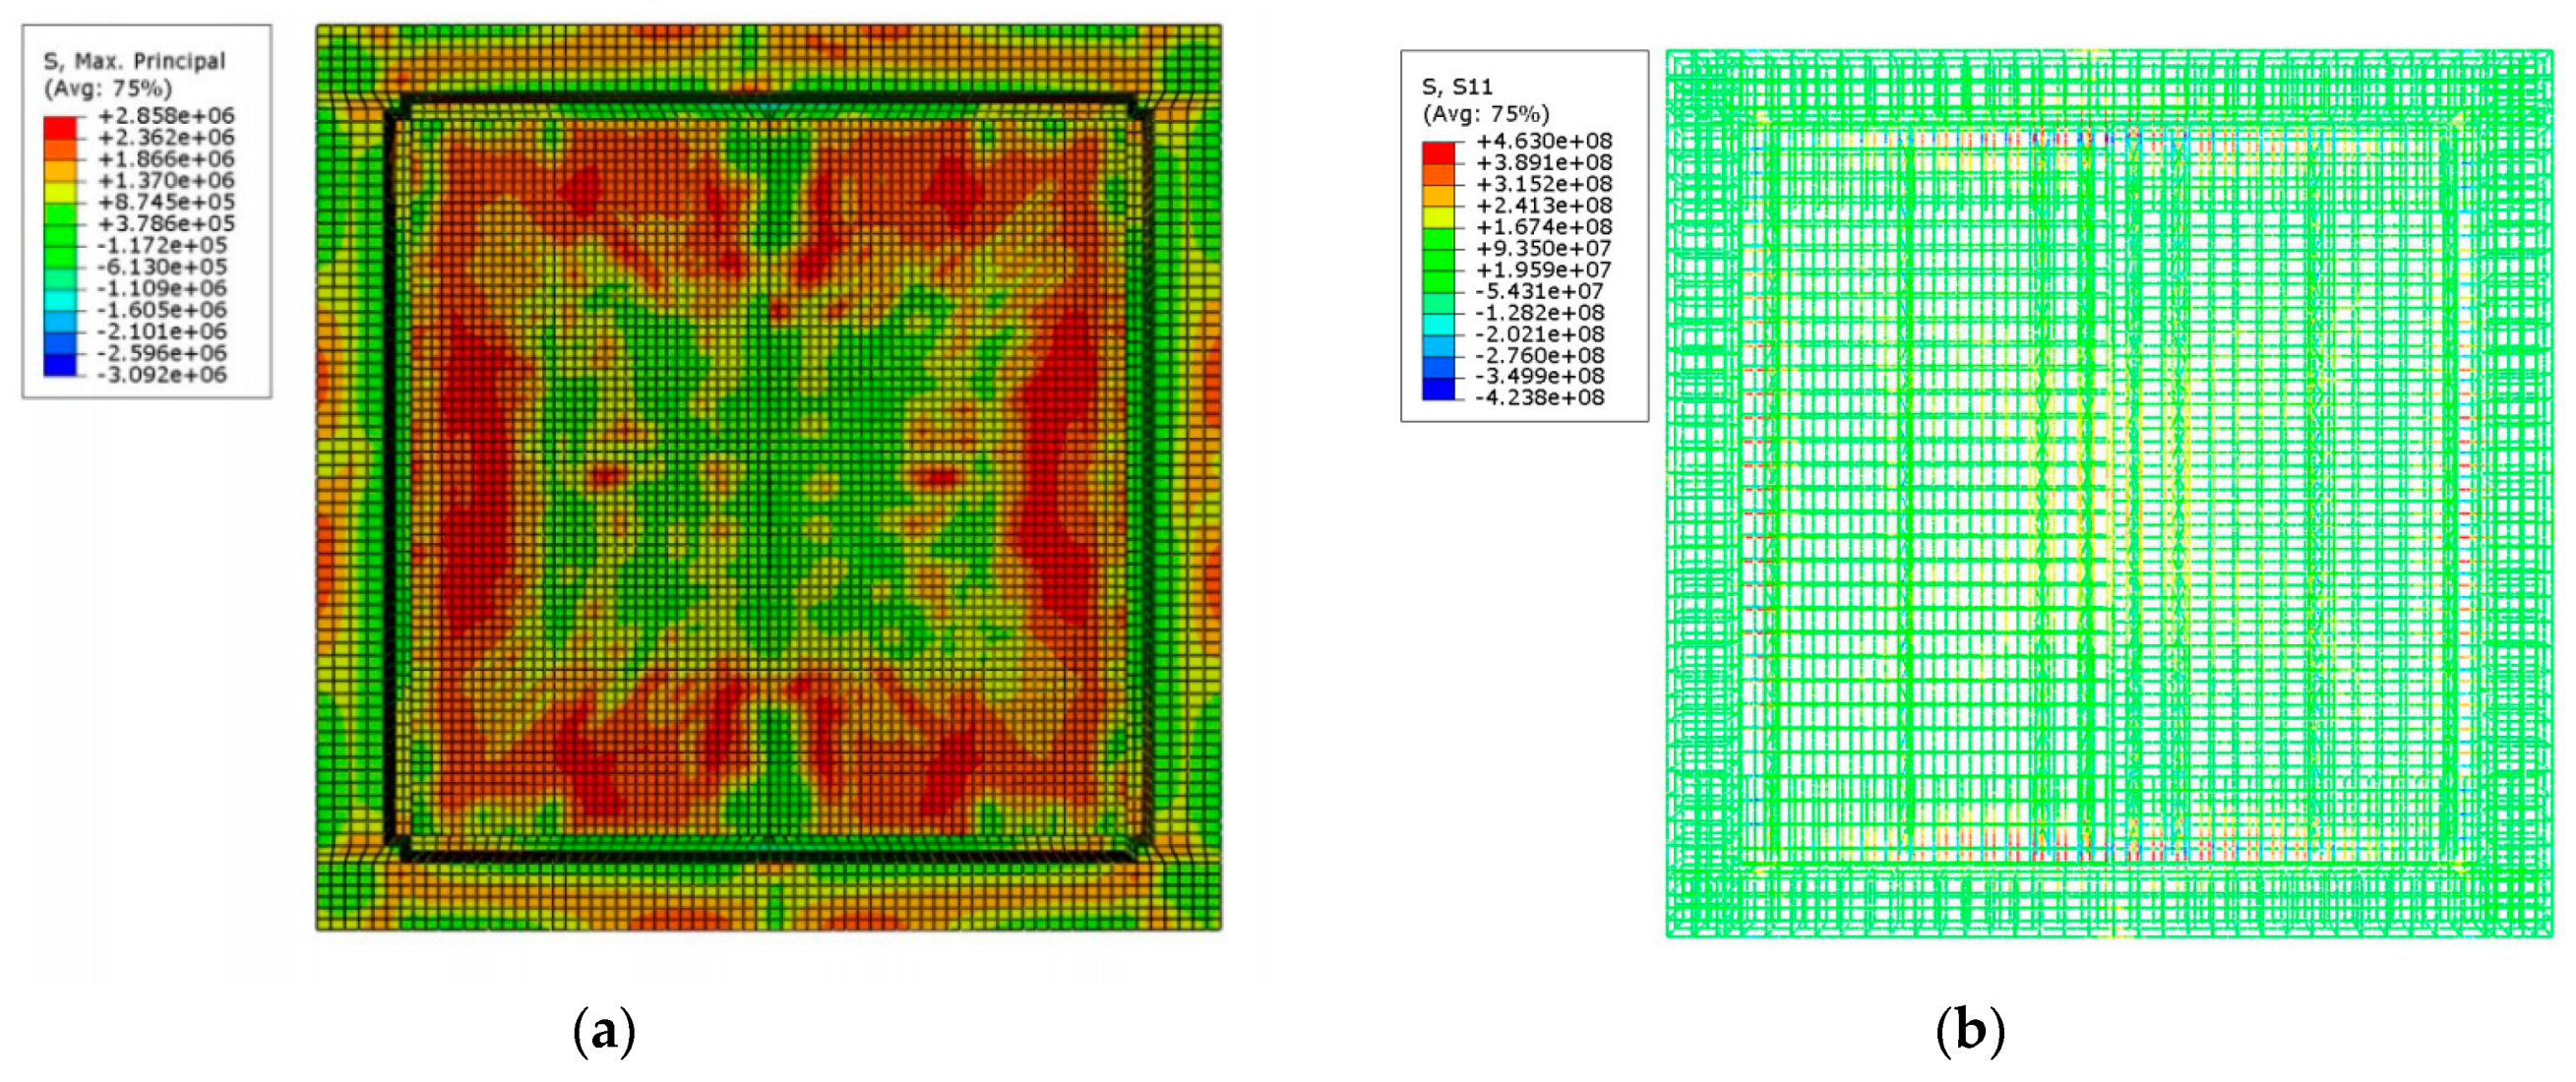
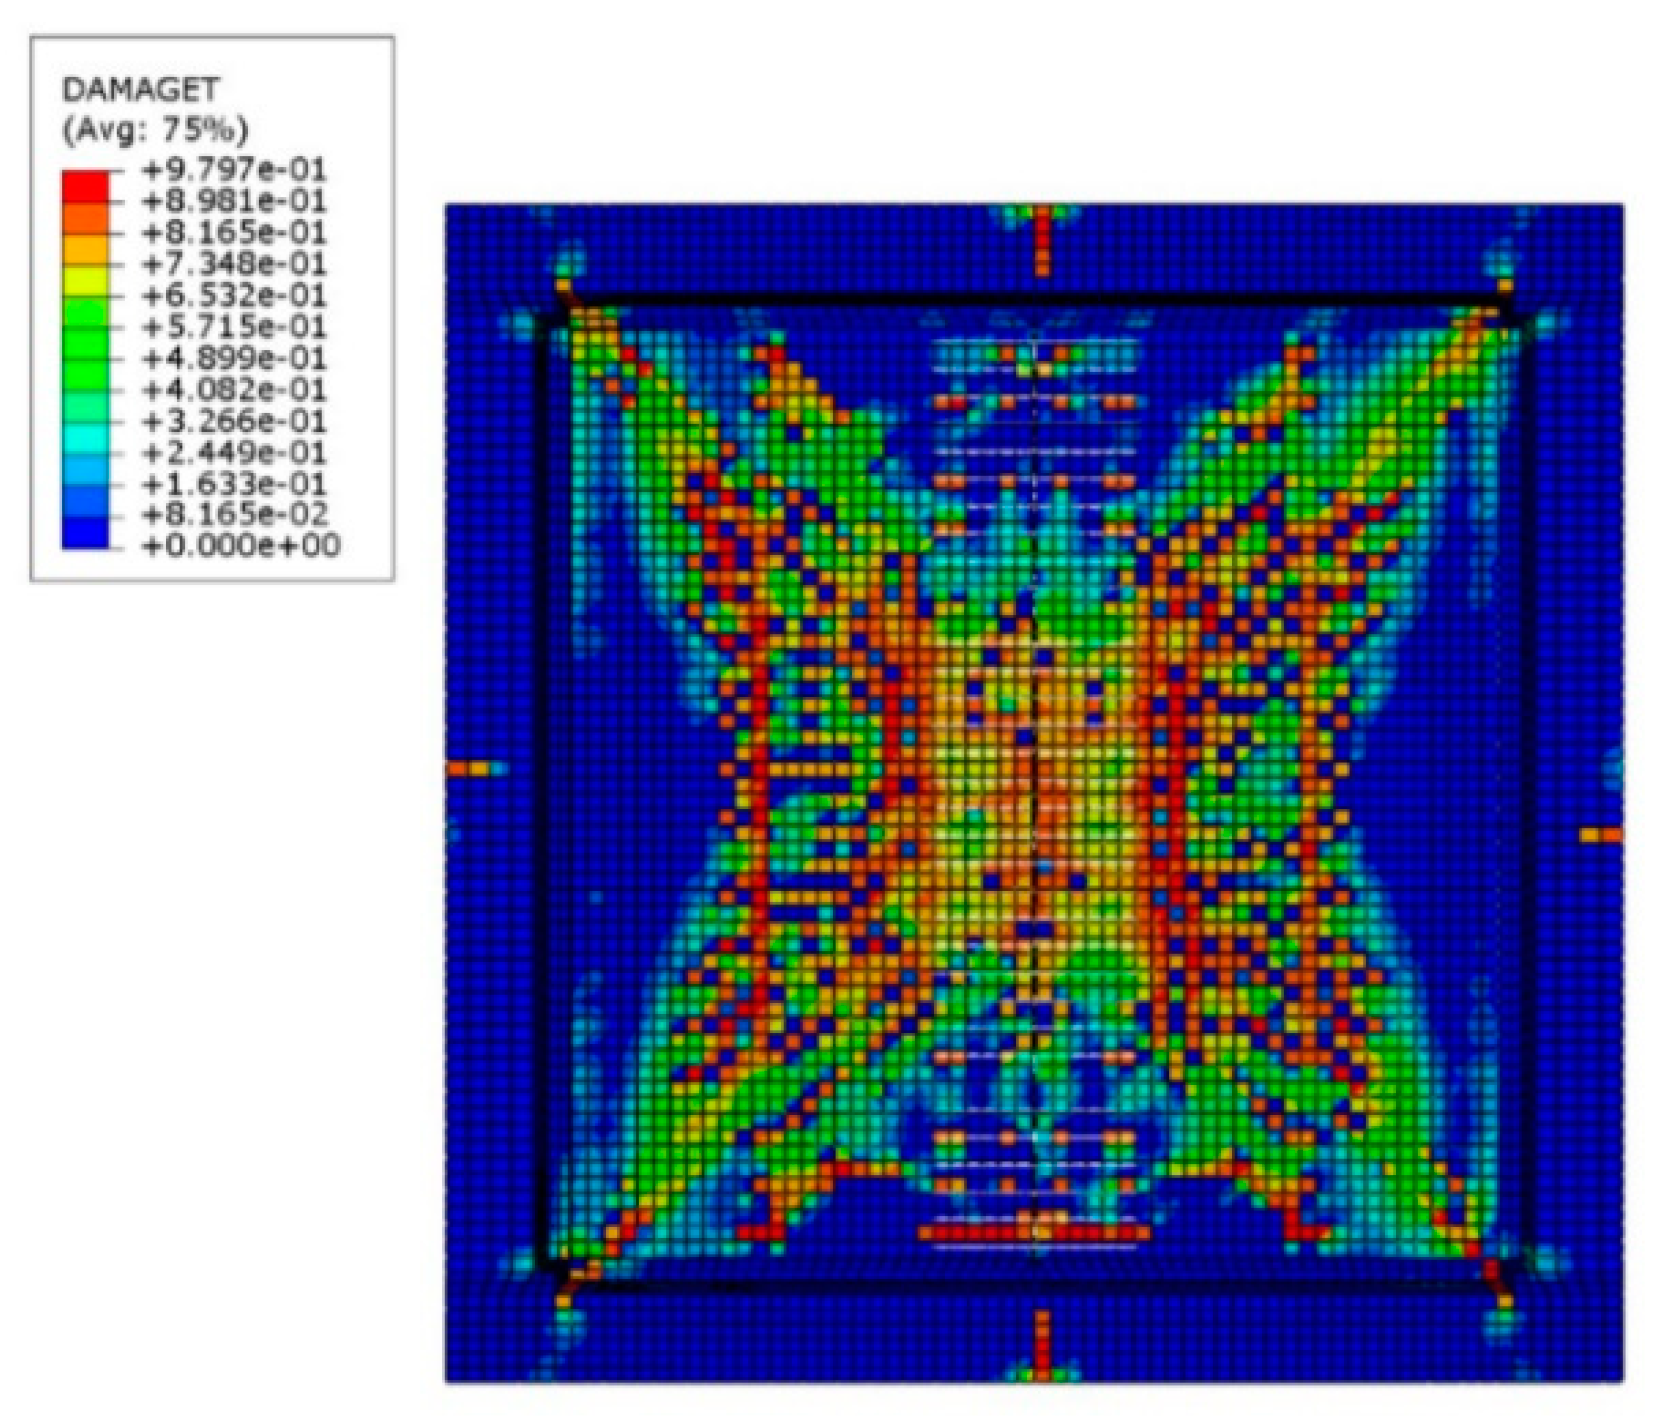
3.2. Simulation Results
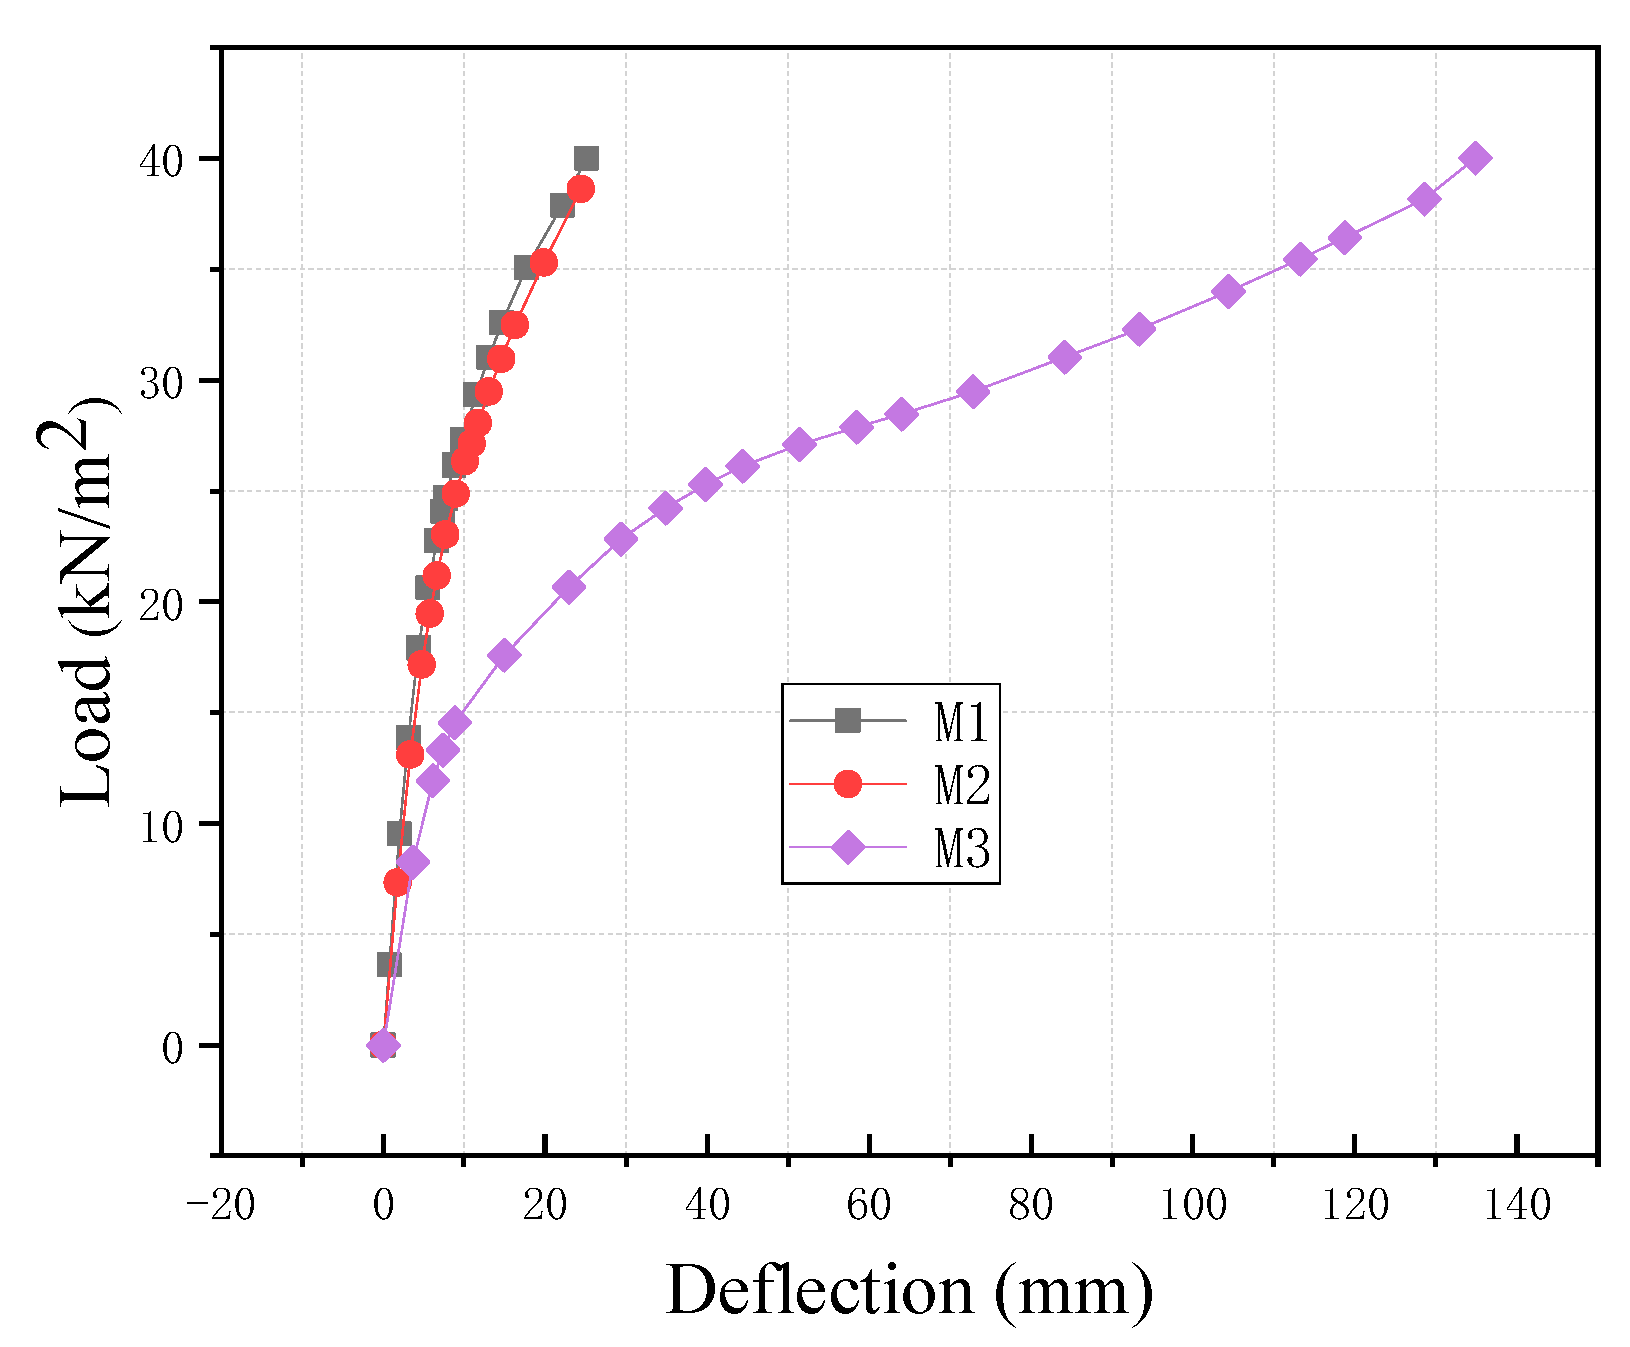
4. Parametric Study
5. Conclusions
Author Contributions
Funding
Data Availability Statement
Acknowledgments
Conflicts of Interest
References
- Girhammar, U.A.; Pajari, M. Tests and analysis on shear strength of composite slabs of hollow core units and concrete topping. Constr. Build. Mater. 2008, 22, 1708–1722. [Google Scholar] [CrossRef]
- Baran, E. Effects of cast-in-place concrete topping on flexural response of precast concrete hollow-core slabs. Eng. Struct. 2015, 98, 109–117. [Google Scholar] [CrossRef]
- Rahimi Mansour, F.; Abu Bakar, S.; Ibrahim, I.S.; Marsono, A.K.; Marabi, B. Flexural performance of a precast concrete slab with steel fiber concrete topping. Constr. Build. Mater. 2015, 75, 112–120. [Google Scholar] [CrossRef]
- Ibrahim, I.S.; Elliott, K.S.; Abdullah, R.; Kueh, A.B.H.; Sarbini, N.N. Experimental study on the shear behaviour of precast concrete hollow core slabs with concrete topping. Eng. Struct. 2016, 125, 80–90. [Google Scholar] [CrossRef]
- Lam, S.S.E.; Wong, V.; Lee, R.S.M. Bonding assessment of semi-precast slabs subjected to flexural load and differential shrinkage. Eng. Struct. 2019, 187, 25–33. [Google Scholar] [CrossRef]
- Du, H.; Hu, X.; Meng, Y.; Han, G.; Guo, K. Study on composite beams with prefabricated steel bar truss concrete slabs and demountable shear connectors. Eng. Struct. 2020, 210, 110419. [Google Scholar] [CrossRef]
- Newell, S.; Goggins, J. Experimental study of hybrid precast concrete lattice girder floor at construction stage. Structures 2019, 20, 866–885. [Google Scholar] [CrossRef]
- Nahar, M.; Islam, K.; Billah, A.M. Seismic collapse safety assessment of concrete beam-column joints reinforced with different types of shape memory alloy rebars. J. Build. Eng. 2020, 29, 101106. [Google Scholar] [CrossRef]
- Yu, J.; Tan, K.H. Numerical analysis with joint model on RC assemblages subjected to progressive collapse. Mag. Concr. Res. 2014, 66, 1201–1218. [Google Scholar] [CrossRef]
- Celik, O.C.; Ellingwood, B.R. Modeling Beam-Column Joints in Fragility Assessment of Gravity Load Designed Reinforced Concrete Frames. J. Earthq. Eng. 2008, 12, 357–381. [Google Scholar] [CrossRef]
- Abdullah, R.; Samuel Easterling, W. New evaluation and modeling procedure for horizontal shear bond in composite slabs. J. Constr. Steel Res. 2009, 65, 891–899. [Google Scholar] [CrossRef] [Green Version]
- Tzaros, K.A.; Mistakidis, E.S.; Perdikaris, P.C. A numerical model based on nonconvex–nonsmooth optimization for the simulation of bending tests on composite slabs with profiled steel sheeting. Eng. Struct. 2010, 32, 843–853. [Google Scholar] [CrossRef]
- Ríos, J.D.; Cifuentes, H.; Martínez-De La Concha, A.; Medina-Reguera, F. Numerical modelling of the shear-bond behaviour of composite slabs in four and six-point bending tests. Eng. Struct. 2017, 133, 91–104. [Google Scholar] [CrossRef]
- Feng, D.; Wu, G.; Lu, Y. Finite element modelling approach for precast reinforced concrete beam-to-column connections under cyclic loading. Eng. Struct. 2018, 174, 49–66. [Google Scholar] [CrossRef] [Green Version]
- Karam, M.S.; Yamamoto, Y.; Nakamura, H.; Miura, T. Numerical Evaluation of the Perfobond (PBL) Shear Connector Subjected to Lateral Pressure Using Coupled Rigid Body Spring Model (RBSM) and Nonlinear Solid Finite Element Method (FEM). Crystals 2020, 10, 743. [Google Scholar] [CrossRef]
- Technical Specification for Application of Lattice Girder Slab; T/CECS 715-2020; China Construction Industry Press: Beijing, China, 2020.
- Code for Design of Concrete Structures; GB50010-2010/2015; China Construction Industry Press: Beijing, China, 2015.
- Chinese Standard for Testing Methods of Concrete Structures; China Construction Industry Press: Beijing, China, 2012.
- Abaqus, 6.14; User’s Manual; SIMULIA: Providence, RI, USA, 2014.
- Lee, J.; Fenves, G.L. Plastic-damage model for cyclic loading of concrete structures. J. Eng. Mech. 1998, 124, 892–900. [Google Scholar] [CrossRef]
- Kytinou, V.K.; Chalioris, C.E.; Karayannis, C.G. Analysis of Residual Flexural Stiffness of Steel Fiber-Reinforced Concrete Beams with Steel Reinforcement. Materials 2020, 13, 2698. [Google Scholar] [CrossRef] [PubMed]
- Sun, Y.; Liu, Y.; Wu, T.; Liu, X.; Lu, H. Numerical Analysis on Flexural Behavior of Steel Fiber-Reinforced LWAC Beams Reinforced with GFRP Bars. Appl. Sci. 2019, 9, 5128. [Google Scholar] [CrossRef] [Green Version]
- Xu, X.; Needleman, A. Numerical simulations of fast crack growth in brittle solids. J. Mech. Phys. Solids 1994, 42, 1397–1434. [Google Scholar] [CrossRef]
- Camacho, G.T.; Ortiz, M. Computational modelling of impact damage in brittle materials. Int. J. Solids. Struct. 1996, 33, 2899–2938. [Google Scholar] [CrossRef]
- Belytschko, T.; Lu, Y.Y.; Gu, L. Element-free Galerkin methods. Int. J. Numer. Meth. Eng. 1994, 37, 229–256. [Google Scholar] [CrossRef]
- Liu, W.K.; Jun, S.; Zhang, Y.F. Reproducing kernel particle methods. Int. J. Numer. Meth. Fluids 1995, 20, 1081–1106. [Google Scholar] [CrossRef]
- Chen, J.; Pan, C.; Wu, C.; Liu, W.K. Reproducing kernel particle methods for large deformation analysis of non-linear structures. Comp. Meth. Appl. Mech. Eng. 1996, 139, 195–227. [Google Scholar] [CrossRef]
- Sukumar, N.; Moes, N.; Moran, B.; Belytschko, T. Extended finite element method for three-dimensional crack modelling. Int. J. Numer. Meth. Eng. 2000, 48, 1549–1570. [Google Scholar] [CrossRef]
- Moes, N.; Belytschko, T. Extended finite element method for cohesive crack growth. Eng. Fract. Mech. 2002, 69, 813–833. [Google Scholar] [CrossRef] [Green Version]


| Dilation Angle | Eccentricity | k | Viscosity Parameter | |
|---|---|---|---|---|
| 30 | 0.1 | 1.16 | 0.667 | 0.0005 |
| Strain/(10−6) | C1 | C2 | C3 | C4 | C5 | C6 |
|---|---|---|---|---|---|---|
| Experiment | 112 | 81 | 287 | 432 | 656 | 603 |
| Simulation | 118 | 80 | 265 | 438 | 653 | 569 |
| Error | 5.4% | −1.2% | −7.6% | 1.4% | −0.4% | −5.6% |
Publisher’s Note: MDPI stays neutral with regard to jurisdictional claims in published maps and institutional affiliations. |
© 2021 by the authors. Licensee MDPI, Basel, Switzerland. This article is an open access article distributed under the terms and conditions of the Creative Commons Attribution (CC BY) license (http://creativecommons.org/licenses/by/4.0/).
Share and Cite
Zhang, X.; Li, H.; Liang, S.; Zhang, H. Experimental and Numerical Study of Lattice Girder Composite Slabs with Monolithic Joint. Crystals 2021, 11, 219. https://doi.org/10.3390/cryst11020219
Zhang X, Li H, Liang S, Zhang H. Experimental and Numerical Study of Lattice Girder Composite Slabs with Monolithic Joint. Crystals. 2021; 11(2):219. https://doi.org/10.3390/cryst11020219
Chicago/Turabian StyleZhang, Xuefeng, Huiming Li, Shixue Liang, and Hao Zhang. 2021. "Experimental and Numerical Study of Lattice Girder Composite Slabs with Monolithic Joint" Crystals 11, no. 2: 219. https://doi.org/10.3390/cryst11020219