Article

Preparation and Evaluation of Cu-Zn-GNSs Nanocomposite Manufactured by Powder Metallurgy

1
15th of May Higher Institute of Engineering, Cairo 14531, Egypt
2
Mining, Metallurgy and Petroleum Engineering Department, Faculty of Engineering, AL-Azhar University, Cairo 11651, Egypt
3
Mechanical Engineering Department, Faculty of Engineering, Al-Azhar University, Cairo11651, Egypt
4
Powder Technology Department, Central Metallurgical Research and Development Institute (CMRDI), Cairo 11912, Egypt
*
Author to whom correspondence should be addressed.
Crystals 2021, 11(12), 1449; https://doi.org/10.3390/cryst11121449
Submission received: 27 October 2021 / Revised: 13 November 2021 / Accepted: 18 November 2021 / Published: 24 November 2021

Abstract

:
Room-temperature ball milling technique has been successfully employed to fabricate copper-zinc graphene nanocomposite by high-energy ball milling of elemental Cu, Zn, and graphene. Copper powder reinforced with 1-wt.% nanographene sheets were mechanically milled with 5, 10, 15, and 20 wt.% Zn powder. The ball-to-powder weight ratio was selected to be 10:1 with a 400-rpm milling speed. Hexane and methanol were used as a process control agent (PCA) during composite fabrication. The effect of PCA on the composite microstructure was studied. The obtained composites were compacted by a uniaxial press under 700 MPa. The compacted samples were sintered under a controlled atmosphere at 1023 K for 90 min. The microstructure, mechanical, and tribological properties of the prepared Cu-Zn GrNSs nanocomposites were studied. All results indicated that composites using hexane as PCA had a uniform microstructure with higher densities. The densities of sintered samples were decreased gradually by increasing the Zn percent. The obtained composite contained 10 wt.% Zn had a more homogeneous microstructure, low porosity, higher Vickers hardness, and compression strength, while the composite contained 15 wt.% Zn recorded the lowest wear rate. Both the electrical and thermal conductivities were decreased gradually by increasing the Zn content.

Graphical Abstract

1. Introduction

The fabrication of Cu-matrix composite has attracted an increased interest, especially the fabrication of Cu-Zn alloy (brass), which has been widely used as an industrial material due to its excellent characteristics, such as: high corrosion resistance, non-magnetism, and good plasticity [1]. Cu-Zn alloy is significantly less expensive than copper, but unfortunately, has low strength properties, which can negate the economic advantage of brass [2,3]. Zinc plays a crucial role in the mechanical properties of copper-zinc alloys. For many working conditions, the copper-zinc alloys are subjected to the static tensile load or dynamic fatigue load. During the past decades, much of the research on the microstructure and mechanical properties of the copper-zinc alloys has been carried out, including the microstructure evolution and tensile plastic deformation, by using equal-channel angular pressing process, which demonstrated the increase in both plasticity and strength of refining grain of copper-zinc alloy with grain sizes less than 100 nm [4,5,6]. In recent years, engineering applications of copper-zinc alloys have increased steadily due to their attractive properties, such as high specific strength and good machinability. In order to improve the strength of Cu-Zn alloy, previous researchers have completed the addition of one or more alloying elements, such as Sn, Mn, Ni, Al, or Co.
An excessive effort has been made to develop a high-strength duplex brass alloy with small amounts of a chromium (Cr) additive by powder metallurgy technique [7]. After iron, aluminum, and copper, zinc is the fourth most widely used metal globally. In 2018, the global zinc supply increased to 13.4 Mt, with a global demand of 13.77 Mt. [8]. Significant amounts of zinc are recycled, and secondary zinc production is estimated to be 20–40% of global consumption [9]. However, due to of the strict limitation on impurities in die-casting composition standards, almost all zinc die-casting alloys are prepared from primary zinc production. In general, about one half of the consumed zinc finds its application in galvanizing steel, to prevent corrosion [10]. Other essential applications involve using zinc for other coatings, or as an alloying element in brasses, bronzes, aluminum, and magnesium alloys. Zinc is exploited as an oxide in chemical, pharmaceutical, cosmetics, paint, rubber, and agricultural industries. Zinc-based alloys offer a series of properties that make them particularly attractive for die-casting manufacturing and, in general, for foundry technologies [11]. The large precipitates reduce the ductility of this alloy. On the other hand, less than one mass% Cr addition in the brass alloy can prevent many precipitations, which causes a remarkable decrease in ductility and machinability. It is possible to produce a high-strength brass alloy with a supersaturated solid solution using the rapid solidification method. Brass alloys were prepared using rapid solidification of the ternary Cu-40 mass% Zn-0.5 mass% Cr alloy powder. The effect of solid solute Cr behavior in the consolidated materials on microstructures and mechanical properties was investigated [12]. Mechanical milling has received an increased interest as a simple and environmentally friendly alternative to high temperature [13]. It is well known that ball milling elemental powders induces a solid-state reaction through the atomic mixing of the components, which has been used to synthesize various equilibrium and non-equilibrium alloy powders with extremely fine microstructures. To avoid the formation of an oxide in the preparation process, mechanochemical reactions of Cu and its oxides under several atmospheres have been investigated separately. The advantage of this technique is the comparison with other fabrication techniques in the ability to synthesis Cu-Zn alloy without oxide phases, and the uniform distribution of the reinforcement particles in one-step [14]. Cu-Zn alloy was prepared by high-energy ball milling of elemental copper and zinc powders by the attrition mill. The different parameters, such as milling time, ball-to-powder ratio, and milling speeds, were optimized. The results show that different milling parameters can produce the different Cu-Zn alloy phases. It has been found that milling time is highly significant to the refining process, and the ratios of the ball to powder also benefit the new phases formed. Copper-based composites are widely used in various applications, and the Cu-Zn system is rich in equilibrium and non-equilibrium phases such as α, β, γ, η, and β′ [15]. In addition, different compositions of many copper-zinc alloys, such as 70 Cu-30 Zn, 75 Cu-25 Zn, and 80 Cu-20Zn alloys, have already been studied as a function of strain amplitude during the load interruptions, and the characteristic shapes of these loops were considered to arise from zinc segregation to dislocations as a function of cycle strain. Although the damage mechanism of copper-zinc alloys has already been obtained by many researchers, the quantitative effects of the proportion of zinc on the deformation behavior, plastic work consumption, and strain-life of copper-zinc alloys during static tensile tests and dynamic fatigue tests were seldom mentioned. C11000 copper and H63 copper-zinc alloy were adopted to investigate the quantitative effects of zinc on the static and dynamic mechanical properties of copper-zinc alloys. The deformation behavior, plastic work consumption, and strain-life of the C11000 copper and H63 copper-zinc alloy during static tensile and dynamic fatigue tests were investigated. During the tensile testing, C11000 copper shows apparent plastic deformation behavior with a tensile strength of 270.1 MPa and elongation of 19.6%. H63 copper-zinc alloy shows the obvious brittle deformation behavior with a tensile strength of 396.8 MPa and elongation of 3.4% [16].
The present work aims to offer simple and suitable techniques for fabrication Cu-Zn GNSs nanocomposites by powder metallurgy techniques, including mechanical milling, cold compaction, sintering process, and studying the effect of hybrid reinforcement of copper with constant percent of GNSs and a variable percentage of Zn for different mechanical applications.

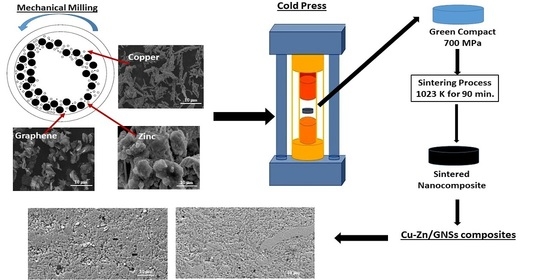
2. Experimental Work

Elemental powders of high purity (99.94%) Cu (75 µm), Zinc 99% purity (75 µm), and 1 wt.% of high purity (99.95%) Graphene nanosheets with 50 nm particle size were used as starting reactant materials. Figure 1 showed the microstructure of the used powders, in which graphene had a nanosheet structure (Figure 1a), while copper had a dendritic structure (Figure 1b), and zinc had irregular spheres-like morphology (Figure 1c).
The powders were mixed to give the desired composition and then sealed in a stainless steel (SUS 316) vial (80 mL in volume) together with 10 stainless steel (SUS 316) balls (12 mm in diameter) in a glove box under an Ar gas atmosphere (O2 and H2O are less than 10 ppm). The ball-to-powder weight ratio was selected to be 10:1. The milling procedure was carried out at room temperature, using a high-energy ball mill (FRITACH P6) for 12 hr. milling time with 400-rpm milling speed.
Hexane or methanol was used as a PCA (to choose the preferable one, Cu with 1wt.% GNSs was mixed mechanically with 10 wt.% of hexane or methanol). Copper GNSs was reinforced with 5, 10, 15, and 20-wt % Zinc powder (Table 1). The mixed composite powders were compacted in a uniaxial single hydraulic press using stainless steel die under 700 MPa pressure. Next, the compacted samples were sintered in a vacuum furnace at 1023 K for 90 min., in which there were three holding steps. During the first step (degassing step), the applied heating rate was 276 K/min. and holed in 523 K. The second step (melting of Zn) was headed with the same heating rate and holed in 673 K. Finally, the third step (sintering process) was headed with a heating rate of 278 K/min. and holed in 1023 K for the complete sintering process.
The phase structure and composition of the sintered Cu-Zn GNSs were characterized by scanning electron microscope (SEM) and X-ray diffraction (XRD). For microstructure investigation, the samples were ground with 220, 400, 600, 800, 1000, 1200, 2000, and 3000 grit SiC paper and polished with 6-micron alumina paste. The microstructure was studied using an Optical microscope (model Leco LX 31, camera PAX-Cam). Additionally, a field emission scanning electron microscope (models FEI Inspect S 50) was used. The densities of the sintered samples were estimated according to Archimedes’ principle, using water as a floating liquid. The sintered samples were weighed in air and in distilled water, and the actual density ( ρ act . ) was calculated according to the Equation (1):
ρ act . = W a W a W w
where Wa and Ww were the weight of the sample in air and water, respectively. The theoretical density ( ρ th . ) for the investigated composite was determined according to the following Equation (2):
ρ th . = ( V M ρ M ) + ( V R ρ R )
where VM and RM were the volume fraction and density of the matrix, respectively, while VR and ρ R were those for the reinforcement sample, respectively [17].
Relative   Density = ρ act . / ρ th .
XRD device of the (model D8 XPORT) was used to emphasize the chemical composition and any new chemical compound or intermetallic formed between the constituent of the composition, and to study the crystal structure of the sintered composition. Vickers hardness was measured using Vickers microhardness tester (D-6700 Wolpert, Meisenweg, Germany) at a load of 10 kg/f, and an indentation time of 10 s for all specimens. The reported Vickers hardness values of the specimens were represented by the average of five readings of each sample. Compression strength test of the investigated samples was performed using a micro-computer controlled uniaxial universal testing machine (WDW300). The samples used for compression tests had a 10 mm cross-section and a height of 15 mm. The applied crosshead speed of the universal test machine used was 2 mm/min, and the tests were conducted at room temperature.
The electrical conductivity, resistivity, and (International Annealed Copper Standard) IACS% were estimated for the sintered sample. The test was established using Material Tester for Metal, PCE-COM20. Next, the thermal conductivity was calculated using the Wiedemann and Franz equation, which is a relationship between electrical and thermal conductivity [14]. The Wiedmann-Franz relation is shown in the following equation:
K / σ = LT
where K is the thermal conductivity in w/m·k, σ is the electrical conductivity s/m, L is Lorenz constant which equals 2.44 × 10⁻⁸ wxΩk−2 value, and T is the absolute temperature in Kelvin.
The adhesive wear was carried out using the Tribometer pin on a ring testing machine under normal loads of 10, 20, and 30 N, at 150, 300, and 450 rpm, respectively, during the sliding process. The adhesive wear of the pin was determined as the weight loss divided the time to determination wear rate per unit second. A sensitive electronic balance was used to measure weight loss.

3. Results and Discussions

The density results of Cu-1% GNSs with hexane and methanol indicated that the hexane sample had a higher density than the methanol sample, as shown in Table 2.
Furthermore, microstructure indicated the good homogeneity of the hexane sample rather than the methanol sample, as shown in Figure 2.
From the above results (Table 2), we found the use of hexane was better than using methanol as a PCA. In the present study, all CU-Zn GNSs composites were manufactured using hexane as a PCA. This result was mentioned previous in prior work [18].

3.1. Optical Micrographs

Figure 3 shows the microstructure of Cu-Zn GNSs composites estimated by optical microscope, in which a, b, c, and d represented Cu-Zn-1% GNSs with 5, 10, 15, and 20 wt.% Zn percentage, respectively. GNSs were well distributed throughout the copper matrix. Samples containing 10 wt.% Zn had the most homogenous and uniform microstructure, which was confirmed by the SEM images and the density values.

3.2. Microstructure Examination

Figure 4 showed the microstructure of Cu-Zn (5, 10, 15, and 20 wt.% zinc)/1 wt.% GNSs nanocomposites (a, b, c, and d), respectively. For all samples there were three areas: white, gray, and black. The white area represented the Zn metal; the gray area represented the Cu matrix; and the black area represented the GNSs and the pores. It could be noted that, samples containing 10 wt.% Zn had a good microstructure, good homogeneity between GNSs, and a Cu-Zn matrix with the lowest porosity. By increasing the Zn contents, some aggregations transpired that causes the formation of pores, as recorded in the density results.

3.3. EDX Analysis

Figure 5a–d showed the EDX analysis of Cu-Zn (5, 10, 15, and 20)/1 wt.% GNSs samples, respectively. It was clear that the specimens had perfect homogenous dispersion with a smaller number of GNSs agglomerations, due to the good mixing process between Cu-Zn and GNSs. Furthermore, the EDX patterns of all samples referred to the presence of Cu, Zn and C (that belong to GNSs) in a good homogeneity (Figure 5). The percent of each constitute were near to the added ones, which indicated the good processing parameters. This could be due to the suitable PCA in the mechanical milling process with good sintering conditions suitable for Cu-Zn solid solution formation.

3.4. Relative Density

Table 3 Showed the effect of Zn metal additions on the relative density of Cu matrix reinforced with 1 wt.% GNSs. The density increased by increasing Zn value from 5 up to 10 wt.%, then decreased gradually by increasing Zn up to 20 wt.%. Generally, decreasing the density could be attributed to the lower density values of Zn (7.14 g/cc) and GNSs (2.2 g/cc) than that of Cu (8.96 g/cc). As such, the addition of light material to a heavier one decreased the overall density [19]. Furthermore, the mismatch between GNSs and the Cu-Zn brass alloy was due to the high surface energy and the non-wettability problem between GNSs and its ceramic nature with the metallic brass Cu-Zn alloy [20]. This was causing a gap between the internal particles, which formed voids that decreased the density. However, the 10 wt.% Zn sample had the highest density value, as it had the best homogenous microstructure; both Zn and GNSs were well distributed on the Cu matrix, and 10 wt.% Zn percentage was the most suitable for Cu-Zn alloy formation.

3.5. XRD Analysis

XRD pattern for obtained nanocomposites (Figure 6) showed the phase composition and structure of the manufactured Cu-Zn GNSs. For 5 and 10 wt.% Zn samples, only the phases corresponding to Cu and Zn were observed, while for the higher percentages of Zn (15 and 20 wt.%), new peaks were recorded corresponding to the β (Cu-Zn) solid solution. This could be explained according to the phase rule and phase diagram between Cu and Zn. Cu-Zn was an important binary alloy system. In the interested temperature ranges from 300 to 1500 K, there were eight phases: liquid, Cu, β, β′, γ, δ, ϵ, and Zn phases, as shown in Figure 7. A new description of the liquid phase and a simplified description of the body-centered cubic (bcc) phase was proposed, in which a solution of a solid in a solid occurred for a certain concentration of both alloys at a certain temperature. Two metals were combined in a solid solution, such as zinc in copper, where the Zn atoms replaced the Cu atoms in the unit cell, leading to the formation of Cu-Zn solid solution. For the small Zn percent, the Cu-Zn beta phase was formed, but its percent was lower than the XRD device limits.

3.6. Vickers Hardness

Figure 8 presented the effect of Zn additions on Vickers hardness values of Cu matrix reinforced with 1 wt.% GNSs. The Figure demonstrated that the hardness of all prepared samples was higher than that of pure annealed Cu (40 Hv). As such, reinforcing Cu with 1 wt.% GNSs and Zn metal improved the hardness of Cu up to 78.1 Hv for 10 wt.% Zn sample. This may be attributed to the high strength of GNSs, which dispersed homogeneously on the Cu matrix. GNSs had superior properties, such as being super-flexible, super-strong, super-light, and super-thin. Owing to all these extraordinary properties, reinforcing any ductile metal with GNSs improved its mechanical properties, especially hardness. GNSs were the hardest material known, until now. It had a tensile strength of 130 GPa, and as such, the addition of GNSs to Cu-Zn alloy enhanced the microhardness. A Zn sample has the highest hardness with a 10 wt.%, possibly attributed to its highest density and more uniform microstructure. Although the hardness of 15 and 20 wt.% Zn was decreased, it was still higher than that of pure Cu. This could be attributed to reinforcing Cu with a hard ceramic GNSs and Zn metal that formed a solid solution that gave strength to the samples [21].

3.7. Compression Strengths Estimation

Figure 9 showed the effect of 1 wt.% GNSs and Zn additions on the compression strength of Cu-Zn-GNSs nanocomposites. The Figure showed that compression strength increased by Zn addition up to 10 wt.% sample, which subsequently decreased by increasing the Zn percentage up to 20 wt.% Zn. This may be explained according to the higher density and hardness of the 10 wt.% Zn sample. Furthermore, the good homogeneous structure of GNSs and Zn was throughout the Cu matrix. Meanwhile, by increasing the Zn percentage, the density decreased, and consequently, porosity increased. As such, the availability of material cracking was increased as the internal pores were considered as a center for crack initiation and spreading [22]. It must be mentioned that dispersing GNSs in the Cu-Zn alloy improved the overall strength of the manufactured samples due to the good mechanical milling parameters that helped in its dispersing and distribution in the Cu matrix. The strength of the Cu-Zn alloy matrix was improved, which made the sample able to withstand the high mechanical loads.

3.8. Electrical Conductivity Measurements

Figure 10 showed the effect of Zn additions and graphene nanosheets on the electrical conductivity of Cu-Zn-GNSs composites. A gradual decrease in the electrical conductivity occurred by increasing Zn percentages. This could be attributed to the lower electrical conductivity value of Zn than that of Cu (1.63 × 10⁷ and 5.96 × 10⁷ s/m for Zn and Cu, respectively). The incorporation of low conductive particles with low free electrons to a conductive matrix restricted the electron motion and decreased the conductivity value. However, although the conductivity of Cu-Zn GNSs composites decreased, the 5 and 10 wt.% Zn samples had a high conductivity value, which was already in the application ranges of Cu. Furthermore, the presence of GNSs helped in enhancing the electrical conductivity of the prepared samples.

3.9. Thermal Conductivity Estimation

Figure 11 showed the effect of Zn additions on the thermal conductivity of Cu-Zn GNSs composites. The Figure showed gradual decreases in the thermal conductivity by Zn increment. This could be attributed to more than one reason; the first is a decreased thermal conductivity value of Zn than that of Cu, which was 401 (w/m·k) for Cu and 116 (w/m·k) for Zn. As such, the presence of Zn particles with low thermal conductivity decreased the conductivity of the prepared samples [23]. The second reason was the formation of pores by the addition of Zn and GNSs, which also had a negative effect on the thermal conductivity as the conductivity of any pore is zero, which restricted the heat carrier mobility.

3.10. Wear Behavior

Figure 12, Figure 13 and Figure 14 showed the effects of Zn additions, applied load, and milling speed on the wear rate of the manufactured Cu-Zn GNSs composites. From Figure 12, Figure 13 and Figure 14, it was clear that as the applied load increased, the wear rate increased, and by increasing the milling speed (rpm), the wear rate also increased. This could be explained by the fact that the contact area between the pin and the sample’s surface increased, giving the pin more chance to wear more area from the contact surface, and consequently, the wear rate increased [24]. By increasing the rpm, the increased wear rate could be explained by the fact which stated that increasing (rpm) led to an increase in the frictional track on the sample’s surface that increases the grooves and wear rate [25]. Another phenomenon from the wear rate figures could be observed: the decreased wear rate from increasing the zinc ratio up to the 15 wt.% that recorded the lowest wear rate value, then increased for the 20 wt.% sample. This was for both the 150 and the 450 rpm groups for the three applied loads (10, 20, and 30 N). This could be explained by the addition of a ceramic or lubricant material, such as the kind GNSs gives to increase strength to the ductile Cu with its good distribution [19,26]. Furthermore, low density (2.2 g/cc) caused the collection of it on the sample’s surface, increasing the sliding of the pin on the surface, consequently decreasing the wear rate. The presence of GNSs caused the formation of tribo-layer on the sample’s surface that decreased the wear rate. For the 20 wt.% Zn sample, some agglomerations of GNSs occurred that increased the porosity, which consequently caused the wear rate to increase. Zinc formed a solid solution with Cu and provided more strength by forming an alloy that resisted wear and corrosion. However, for 300 rpm, the wear rate decreased by increasing the Zn percentage gradually to 20 wt.% Zn sample, which recorded the lowest wear rate [27].

4. Conclusions

In this research, Cu-Zn GNSs nanocomposites were successfully produced by powder metallurgy methods, including ball milling technique, followed by compacting steps using uniaxial press. The results showed that bulk nanocomposites prepared using hexane as PCA had a uniform microstructure with no evidence for the presence of voids. Furthermore, the addition of 10 wt.% zinc increased the densities of obtained nanocomposite materials, which ultimately decreased with further additions of zinc.
XRD revealed the formation of beta phase Cu-Zn solid solution for higher percentages of Zn (15 and 20 wt.%). Obtained nanocomposites containing 10 wt.% zinc recorded a higher value of Vickers hardness (78.1 Hv), while those with 20 wt.% zinc recorded (49.6 Hv).
Good dispersing GNSs in the Cu-Zn alloy improved the overall strength of the manufactured nanocomposites, with higher values of compressive strength for composite containing 10% zinc.
Both the electrical and thermal conductivities for obtained nanocomposites decreased gradually by increasing zinc content. In addition, the nanocomposite having 15 wt.% zinc recorded the lowest wear rate.
Cu-Zn GNSs-CNTs hybrid nanocomposites were prepared using mechanical ball milling technique. We will discuss the effect of the addition of CNTs with GNSs in the near future.

Author Contributions

Writing—original draft preparation, A.T.H., E.S.M. and A.A.M.; writing—review and editing, I.G.E.-B. and O.A.E. All authors have read and agreed to the published version of the manuscript.

Funding

This research received no external funding.

Data Availability Statement

Not applicable.

Conflicts of Interest

The authors declare no conflict of interest.

References

  1. Yusoff, M.; Mohamad, M.; Abu Bakar, M.B.; Masri, M.N.; Noriman, N.Z.; Dahham, O.S.; Umar, M.U. Copper Alloy Reinforced by Graphene by Powder Metallurgy Technique. AIP Conf. Proc. 2020, 2213, 020264. [Google Scholar]
  2. Pola, A.; Rollez, D.; Prenger, F. Zinc Alloy Family for Foundry Purposes. World Metall. Erzmetall 2015, 68, 354–358. [Google Scholar]
  3. Yang, G.S.; Lee, J.K.; Jang, W.Y. Mechanical Properties and Microstructure Observation with Grain Refinement in CuZnAl Alloy. Mater. Sci. Forum Jan. 2008, 569, 173–176. [Google Scholar] [CrossRef]
  4. Rajeshkumara, L.; Suriyanarayanan, R.; Hari, K.S.; Babu, S.V.; Bhuvaneswari, V.; Karunan, M.P.J. Influence of boron carbide addition on particle size of copper zinc alloys synthesized by powders metallurgy. Mater. Sci. Eng. 2020, 954, 1–9. [Google Scholar] [CrossRef]
  5. Traleski, A.V.; Vurobi, S., Jr.; Cintho, O.M. Osvaldo Mitsuyuki Cintho, Processing of Cu-Al-Ni and Cu-Zn-Al Alloys by Mechanical Alloying. Mat. Sci. Forum 2012, 727–728, 200–205. [Google Scholar]
  6. Da Silva, F.C.; Kazmierczak, K.; da Costa, C.-E.; Milan, J.C.G.; Torralba, J.M. Zamak 2 Alloy Produced by Mechanical Alloying and Consolidated by Sintering and Hot Pressing. J. Manuf. Sci. Eng. 2017, 139, 1–7. [Google Scholar] [CrossRef]
  7. Imai, H.; Li, S.; Kondoh, K.; Kosaka, Y.; Okada, K.; Yamamoto, K.; Takahashi, M.; Umeda, J. Microstructure and Mechanical Properties of Cu-40%Zn-0.5%Cr Alloy by Powder Metallurgy. Mater. Trans. 2014, 55, 528–533. [Google Scholar] [CrossRef] [Green Version]
  8. Global Zinc Market to Grow at 3.8% in 2022. Available online: https://www.mining-technology.com/comment/zinc-outlook-2019/ (accessed on 5 January 2020).
  9. Lynch, R.F. Zinc: Alloying, Thermomechanical Processing, Properties, and Applications. In Encyclopedia of Materials: Science and Technology; Elsevier: Amsterdam, The Netherlands, 2001; pp. 9869–9883. [Google Scholar]
  10. Marder, A.R. Metallurgy of zinc-coated steel. Prog. Mater. Sci. 2000, 45, 191–271. [Google Scholar] [CrossRef]
  11. Levy, G.K.; Goldman, J.; Aghion, E. The prospects of zinc as a structural material for biodegradable implants: A review paper. Metals 2017, 7, 402. [Google Scholar] [CrossRef] [Green Version]
  12. Pola, A.; Tocci, M.; Goodwin, F.E. Review of Microstructures and Properties of Zinc Alloys. Metals 2020, 10, 253. [Google Scholar] [CrossRef] [Green Version]
  13. Panigrahi, M.; Avar, B. Influence of mechanical alloying on structural, thermal, and magnetic properties of Fe50Ni10Co10Ti10B20 high entropy soft magnetic alloy. J. Mater. Sci. Mater. Electron. 2021, 32, 21124–21134. [Google Scholar] [CrossRef]
  14. Wang, K.J.; Cai, X.L.; Wang, H.; Hu, J.; Zhang, Y.F. Preparation of Cu-Zn Alloy by Different High Energy Ball Milling. Adv. Mater. Res. 2012, 12, 259–262. [Google Scholar]
  15. Kaijun, W. Preparation of Cu-Zn Alloy by High Energy Ball Milling of Elemental Copper and Zinc. Adv. Mater. Res. 2011, 148–149, 1413–1416. [Google Scholar]
  16. El-Khatib, S.; Shash, A.Y.; Elsayed, A.H.; El-Habak, A. Effect of carbon nano-tubes and dispersions of SiC and Al2O3 on the mechanical and physical properties of copper-nickel alloy. Heliyon 2018, 4, e00876. [Google Scholar] [CrossRef]
  17. Zhi-Chao, M.A. Effects of zinc on static and dynamic mechanical properties of copper-zinc alloy. J. Cent. South Univ. 2015, 22, 2440–2445. [Google Scholar]
  18. Hamed, A.; Mosa, E.; Mahdy, A.; El-Batanony, I.; Alkady, O. Effect of process controlling agent on the microstructure, and mechanical properties of copper/graphene composite. In Proceedings of the Al Azhar Engineering Fifteenth International Conference, Cairo, Egypt, 13–15 March 2021. [Google Scholar]
  19. Fathy, A.; Elkady, O.; Abu-Oqail, A. Microstructure, mechanical and wear properties of Cu-ZrO2 nanocomposites. Mater. Sci. Technol. 2017, 33–17, 2138–2146. [Google Scholar] [CrossRef]
  20. Yehia, H.M. Effect of graphene nano-sheets content and sintering time on the microstructure, coefficient of thermal expansion, and mechanical properties of (Cu/WC-TiC-Co) nano-composites. J. Alloys Compd. 2018, 764, 36–43. [Google Scholar] [CrossRef]
  21. Fathy, A.; Elkady, O.; Abu-Oqail, A. Synthesis and characterization of Cu-ZrO2 nanocomposite produced by thermochemical process. J. Alloys Compd. 2017, 719, 411–419. [Google Scholar] [CrossRef]
  22. Fathy, A.; Elkady, O.; Abu-Oqail, A. Effect of high energy ball milling on strengthening of Cu-ZrO2 nanocomposites. Ceram. Int. 2019, 45, 5866–5875. [Google Scholar] [CrossRef]
  23. El-Kady, O.; Yehia, H.M.; Nouh, F. Preparation and characterization of Cu/(WC-TiC-Co)/graphene nanocomposites as a suitable material for heat sink by powder metallurgy method. Int. J. Refract. Met. Hard Mater. 2019, 79, 108–114. [Google Scholar] [CrossRef]
  24. Elkady, O.A.M.; Abu-Oqail, A.; Ewais, E.M.M.; El-Sheikh, M. Physico-mechanical and tribological properties of Cu/h-BN nanocomposites synthesized by PM route. J. Alloys Compd. 2015, 625, 309–317. [Google Scholar] [CrossRef]
  25. Abu-Oqail, A.; Wagih, A.; Fathy, A.; Elkady, O.; Kabeel, A.M. Production and properties of Cu-ZrO2 nanocomposites. J. Compos. Mater. 2017, 52–11, 1519–1529. [Google Scholar]
  26. Yehia, H.M.; Abu-Oqail, A.; Elmaghraby, M.A.; Elkady, O.A. Microstructure, hardness, and tribology properties of the (Cu/MoS2)/graphene nanocomposite via the electroless deposition and powder metallurgy technique. J. Compos. Mater. 2020, 54–23, 3435–3446. [Google Scholar] [CrossRef]
  27. Sadoun, A.M.; Mohammed, M.M.; Elsayed, E.M.; Meselhy, A.F.; El-Kady, O. A Effect of nano Al2O3 coated Ag addition on the corrosion resistance and electrochemical behavior of Cu-Al2O3 nanocomposites. J. Mater. Res. Technol. 2020, 9–3, 4485–4493. [Google Scholar] [CrossRef]
Figure 1. SEM micrographs for Graphene nanosheets (a), Copper (b), and Zinc powder (c).
Crystals 11 01449 g001
Figure 2. The microstructure of the Cu-1wt.% GNSs for hexane (a) and methanol (b), respectively.
Crystals 11 01449 g002
Figure 3. Optical micrographs of sintered Cu-Zn GNSs nanocomposites: (a) Cu-Zn 5 wt.% + Graphene 1 wt.%; (b) Cu-Zn 10 wt.% + Graphene 1 wt.%; (c) Cu-Zn 15 wt.% + Graphene 1 wt.%; and (d) Cu-Zn 20 wt.% + Graphene 1 wt.%.
Crystals 11 01449 g003
Figure 4. SEM of sintered Cu-Zn GNSs composites: (a) Zn 5 wt.%, (b) Zn 10 wt.%, (c) Zn 15 wt.%, and (d) Zn 20 wt.%.
Crystals 11 01449 g004
Figure 5. EDX of sintered composite samples: (a) Cu94Zn5GNSs1, (b) Cu89Zn10GNSs1, (c) Cu84Zn15GNSs1, and (d) Cu79Zn20GNSs1.
Crystals 11 01449 g005
Figure 6. XRD patterns of the sintered Cu-Zn-GNSs composite.
Crystals 11 01449 g006
Figure 7. Phase diagram of Cu-Zn alloy.
Crystals 11 01449 g007
Figure 8. Dependence of the Vickers hardness of bulk composite samples.
Crystals 11 01449 g008
Figure 9. Effect of compositions on compressive strengths of obtained composite samples.
Crystals 11 01449 g009
Figure 10. Effect Zn additions have on the electrical conductivity of Cu-Zn-GNSs nanocomposites.
Crystals 11 01449 g010
Figure 11. Effect of Zn additions on the thermal conductivity of Cu-Zn-GNSs composites.
Crystals 11 01449 g011
Figure 12. Effect of different loads and rpm on the wear rate of obtained composite sample.
Crystals 11 01449 g012
Figure 13. Effect of different loads and rpm on the wear rate of obtained composite samples.
Crystals 11 01449 g013
Figure 14. Effect of different loads and rpm on the wear rate of obtained composite samples.
Crystals 11 01449 g014
Table 1. The composition of fabricated composites.
AlloysCu wt.%Zn wt.%GNSs wt.%
Cu94Zn5GNSs19451
Cu89Zn10GNSs189101
Cu84Zn15GNSs184151
Cu79Zn20GNSs179201
Table 2. Relative densities and process control agent (PCA) used.
SampleProcess Control Agent (PCA)Relative Density
Cu-1 wt.% GNSsHexane86.35
Cu-1 wt.% GNSsMethanol76.32
Table 3. Relative density measured value for obtained composites.
AlloysRelative Density %
Cu94Zn5GNSs189.90
Cu89Zn10GNSs190.64
Cu84Zn15GNSs187.41
Cu79Zn20GNSs185.82
Publisher’s Note: MDPI stays neutral with regard to jurisdictional claims in published maps and institutional affiliations.

