Article

Quantitative Characterization of the γ’ Phase Distribution in the Large-Scale Area of the Second-Generation Nickel-Based Single Crystal Blade DD5

1
Beijing Advanced Innovation Center for Materials Genome Engineering, Central Iron & Steel Research Institute, Beijing 100081, China
2
Beijing Key Laboratory of Metal Materials Characterization, NCS Testing Technology Co., Ltd., Beijing 100081, China
3
School of National Center for Materials Service Safety, University of Science and Technology Beijing, 30 Xueyuan Road, Haidian District, Beijing 100083, China
4
High Temperature Materials Research Department, Central Iron and Steel Research Institute, No.76 Xueyuannanlu, Haidian District, Beijing 100081, China
*
Authors to whom correspondence should be addressed.
Crystals 2021, 11(11), 1399; https://doi.org/10.3390/cryst11111399
Submission received: 25 October 2021 / Revised: 7 November 2021 / Accepted: 10 November 2021 / Published: 17 November 2021
(This article belongs to the Topic Single-Crystal Ni-Based Alloys)

Abstract

:
Nickel-based single crystal superalloy blades have excellent high-temperature performance as the hot end part of the aero-engine turbine. The most important strengthening phase in the single crystal blade is the γ’ phase, and its morphology and size distribution directly affect the high temperature performance of the single crystal blade. In this work, scanning electron microscopy (SEM) was used to obtain the microscopic images of the γ’ phase in multiple large continuous fields of view in the transverse sections of single crystal blades, and the quantitative statistical characterization of the γ’ phase was performed by image segmentation method based on deep learning. The 20 μm × 20 μm region was selected from the primary dendrite arm, the secondary dendrite arm, and the interdendrite to statistically analyze the γ’ phases. The statistical results show that the average size of the γ’ phase at the position of the interdendrite is significantly larger than the average size of the γ’ phase at the position of the dendrite; the sizes of the γ’ phase at the primary dendrite arm, the secondary dendrite arm and the interdendrite all obey the normal distribution; about 3.17 × 10⁷ γ’ phases are counted in 20 positions in the 5 transverse sections of the single crystal blade in a total area of 5 mm2, and the size, geometric morphology and area fraction of all γ’ phases are respectively counted. In this work, the quantitative parameters of the γ’ phases at 4 different positions of the section of the single crystal superalloy DD5 blade were compared, the size and area fraction of the γ’ phases at the leading edge and the trailing edge were smaller, and the shape of the γ’ phase of the leading edge and the trailing edge is closer to the cube.

Graphical Abstract

1. Introduction

The nickel-based single crystal superalloy blade is widely used as the hot end part of the aero-engine and gas turbine [1,2,3]. Its research and development and manufacturing level is an important reflection of national core competitiveness to measure national economic development and national defense security. The single crystal superalloy produced by directional solidification has excellent fatigue resistance [4,5,6] and good high-temperature mechanical properties [7,8], and its most important microstructure is composed of γ phase and γ’ precipitated phase [9,10]. The γ’ phases are dispersedly distributed in the γ matrix. Studies have shown that the excellent performance of single crystal materials is mainly due to the strengthening effect of the γ’ precipitated phase. Parameters such as the size, morphology, and area fraction of the γ’ phase are closely related to the process and properties of the alloy [11,12,13].
The shape of the nickel-based single crystal hollow turbine blades is complex, which leads to a complicated process of directional solidification of single crystal blades [14,15]. The complexity of the blade shape and the solidification process makes the uneven distribution of the microstructure inevitably formed during the production process [16,17]. The structure of the material determines the performance of the material, and the distribution of the γ’ phase structure of the single crystal superalloy has a significant effect on the high temperature performance of the single crystal blade. There are differences in the height and size of the transverse section of the single crystal blade from the crown to the tenon, resulting in the morphology and size of the γ’ phase in different parts of the single crystal blade [18]. Therefore, the detailed quantitative analysis of the γ’ phase distribution in different parts of the blade has important guiding significance for the solidification process of the blade.
Chen [19] established the corresponding relationship between the area fraction and position of γ’ through the quantitative characterization of the γ’ phase in the typical regions of transverse sections with different heights, and studied the evolution and damage degree of the microstructure of different parts of the leaf. However, this process only selects 5 images in each region as representative, which cannot represent the characteristic information of the entire region.
Guo [20] studied the evolution of the microstructure through the area fractions and morphology changes of γ and γ’ phases. In order to obtain the size parameters of the γ/γ’ phase in the SEM image, a method for identifying and extracting the γ and γ’ phases was developed through an image segmentation method based on image binary processing. However, with common image processing methods, segmentation parameters need to be manually defined and adjusted, which makes it difficult to stably process a large number of feature images with complex backgrounds. Ref. [21] developed an image processing program to automatically identify the length and width of each γ’ phase. However, this method also cannot quickly process a large number of images with complex backgrounds.
The quantitative characterization of γ’ phase usually selects a small amount of γ’ phases in the typical field of view for statistical analysis, and the γ’ phase is usually extracted manually. However, there are few research studies on the automatic quantitative statistical characterization distribution of γ’ phase in the large-scale area of the single crystal superalloy blade section. The manual extraction and quantitative characterization of γ’ phase require a large amount of work, so only a small amount of γ’ phase can be extracted. More importantly, the subjective error of the manual extraction process is difficult to remove. It is difficult to reflect the true distribution of γ’ phases in the full field of view by using the distribution of part of the γ’ phase in a small amount of field of view. Therefore, the rapid quantitative extraction and statistical distribution characterization of the γ’ phase in the high-precision image of the large-size sample is of great significance for the study of the microstructure inhomogeneity of the single crystal blade.
This work uses the semantic segmentation network U-Net [22] based on deep learning [23,24] to quantitatively and statistically characterize the distribution of γ’ phases in a large area of different transverse sections and different parts of the second-generation single crystal blade DD5. The use of deep learning-based methods to achieve the quantitative statistical analysis of the microstructure has been widely used in a variety of materials [25,26,27]. The U-Net network structure uses a completely symmetrical encoding-decoding structure, and uses skip connections to fuse the feature information of each layer in the encoding process into the corresponding layer feature in the decoding process. This method uses a feature extraction network to extract features, and automatically corrects feature extraction parameters in the iterative process, avoiding the subjective error of manually defining features, and the entire segmentation process is implemented in a highly parallel neural network, which greatly improves the calculation speed.

2. Experimental Data and Methods

2.1. Materials and Experimental Data

The test material is the second-generation heat-treated nickel-based single crystal superalloy DD5 blade independently developed by CISRI-GAONA (High Temperature Materials Research Department, Central Iron and Steel Research Institute). The design composition of the single crystal blade is shown in Table 1. The heat treatment process is 1300 °C/2 h air quenching + 1800 °C/4 h air cooling + 900 °C/4 h air cooling. The structure of single crystal blades is complex, and the differences in the blade structure at different positions lead to differences in the solidification rate, which in turn causes the uneven distribution of γ’ phase. In order to study the distribution of γ’ phases in different parts of the blade, five transverse sections were selected sequentially from the blade crown to the tenon, as shown in Figure 1. Moreover, 400, 800, and 1200 mesh sandpaper were selected to grind the sample, and then polished with 2.5 μm alumina polishing paste. Four areas are selected to collect the microscopic images of the single crystal blade from each transverse section, and the selected positions are leading edge, trailing edge, suction side, and pressure side, as shown in Figure 2. The size of each acquisition area is 5mm × 5mm, and a total of 20 areas are acquired in 5 transverse sections. The Navigator-OPA high-throughput scanning electron microscope is used to acquire 784 high-resolution images in each acquisition area. A total of 15,680 γ’ phase SEM images were collected in 20 areas, and the size of a single image was 2048 × 2048 pixels. The γ’ phase SEM images collected in each section are shown in Figure 3.

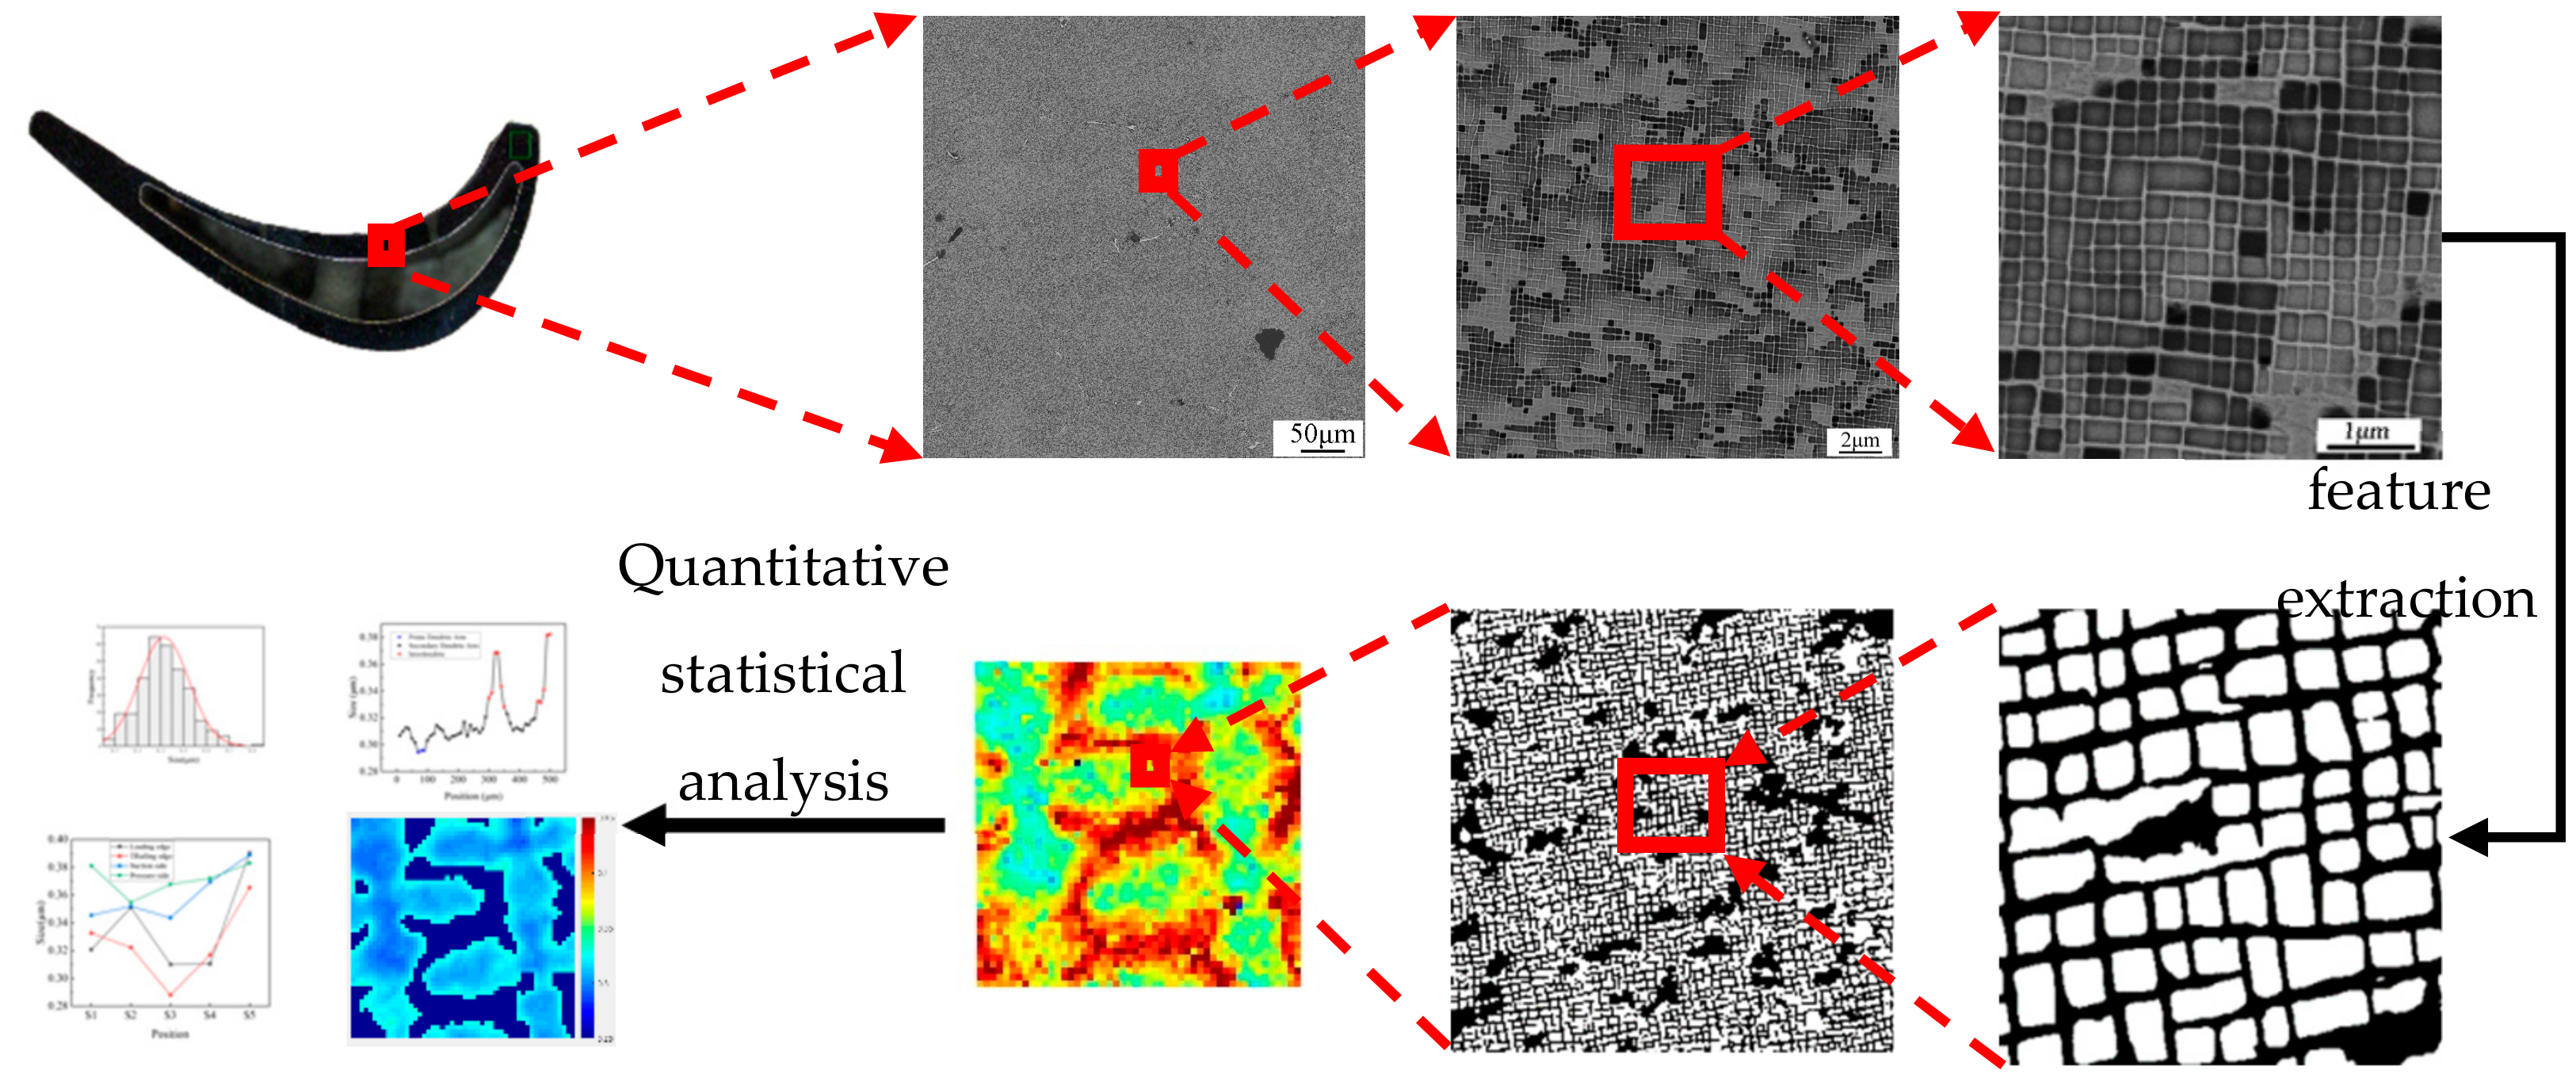
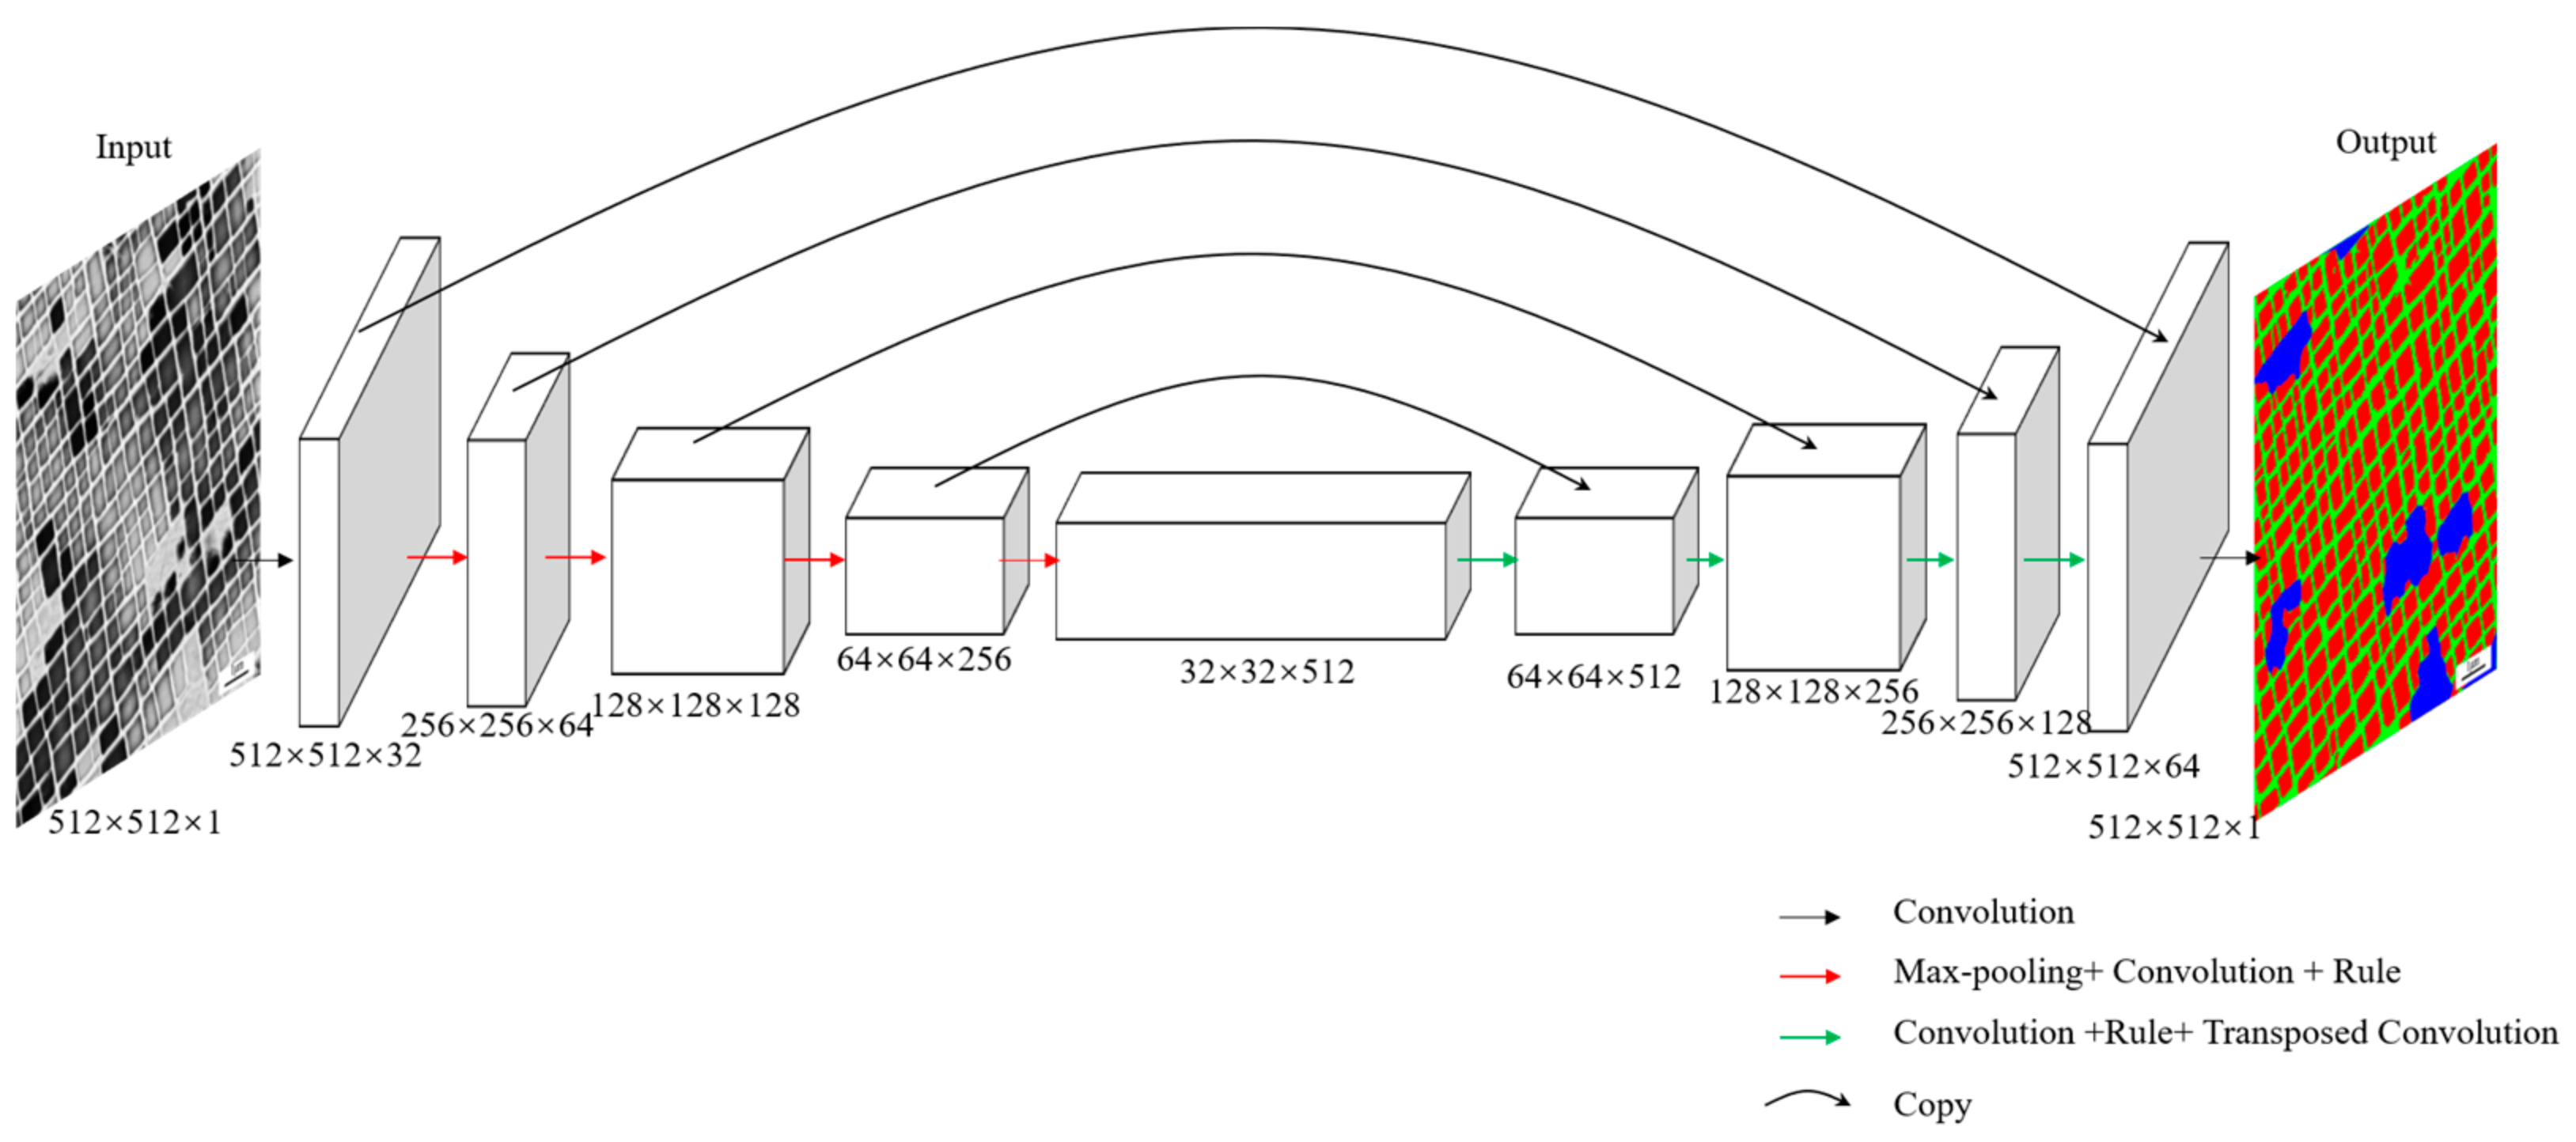
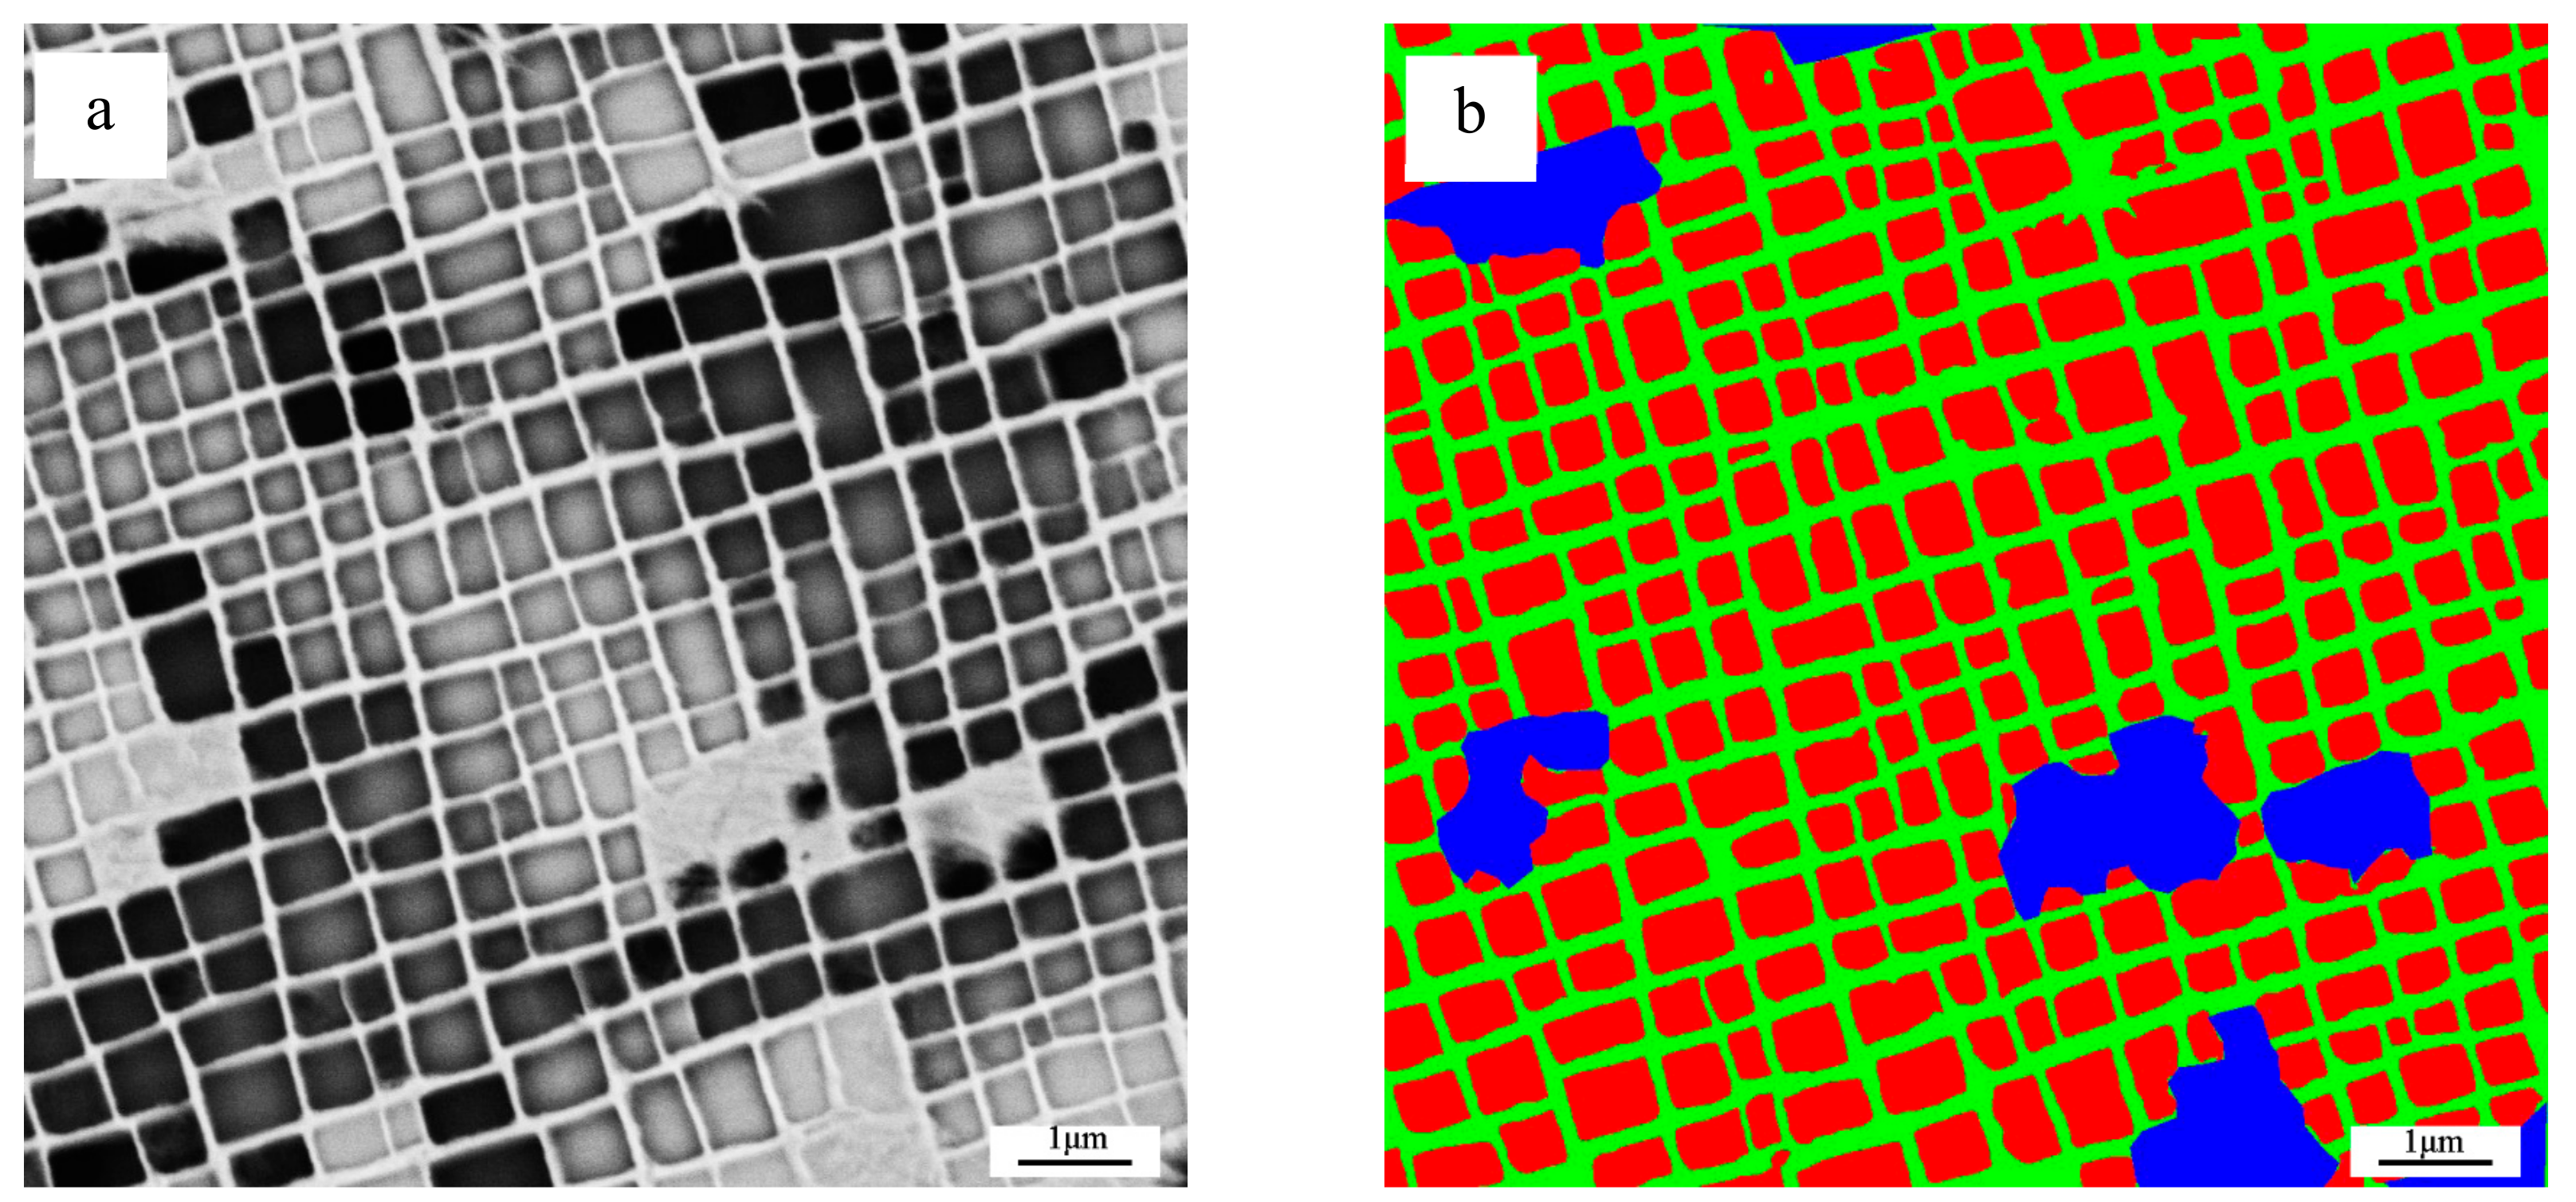
2.2. Intelligent Identification and Extraction of γ’ Phase and Quantitative Statistical Analysis Method

The size, morphology, area fraction and other parameters of γ’ phase are directly related to the performance of single crystal blades. In this work, high-throughput data acquisition and calculation are used to quickly obtain γ’ phase SEM images and to count the relevant parameters of each γ’ phase in the full field of view. The Navigator-OPA high-throughput field emission scanning electron microscope was used to collect 784 SEM images in a 0.5 mm × 0.5 mm area selected from the blade section, and all γ’ phases in the full field of view were extracted. Finally, the γ’ phase extracted from the full field of view is quantitatively characterized and analyzed. The flow of experimental data collection, processing and statistical analysis is shown in Figure 4. In this process, U-Net, an image segmentation network based on deep learning, is used to quickly extract γ’ phase features, and the network architecture is shown in Figure 5.
In this experiment, the size, geometric shape factor, and area fraction of the γ’ phase are used as quantitative standards to count and compare the inhomogeneity of the microstructure. The calculation methods of each parameter are as follows.
The two-dimensional transverse section of the γ’ phase is equivalent to a square, and the side length of the square is taken as the equivalent size of the γ’ phase. The calculation equation is:
D = S
where D is the size of the γ’ phase, and S is the sectional area of the γ’ phase.
The geometric factor G is a quantitative index describing the geometric shape of the γ’ phase, which is determined by the perimeter and area of the section of the γ’ phase. The calculation equation is:
G = P 2 16 S
where G is the geometric shape factor of the γ’ phase, P is the sectional perimeter of the γ’ phase, and S is the sectional area of the γ’ phase. When G is closer to 1, the sectional geometry of the γ’ phase is closer to a square.
The area fraction is obtained by calculating the proportion of γ’ phase in γ’/γ, so it is necessary to extract the γ’ phase and the γ matrix separately from the field of view, which can be obtained by:
R = S γ S γ + S γ
where R is the area fraction of the γ’ phase, S γ is the area of the γ’ phase, and S γ is the area of the γ matrix.
The parameters of the γ’ phase are calculated and quantitatively counted in multiple large-scale areas, providing comprehensive data information for further in-depth analysis and mining of the distribution of γ’ phase and finding the corresponding relationship between microstructure and performance.

3. Results

The γ’ phase and γ matrix in all the fields of view were identified and extracted by the trained U-Net network, as shown in Figure 6. Figure 6a is the original SEM image of one field of view, of which the size is 10 μm × 10 μm; the result is shown in Figure 6b. The red feature in Figure 6b is the γ’ phase, and the green feature is the γ matrix. The size of the γ’ phase in the field of view is counted, and its distribution follows the normal distribution, as shown in Figure 7. According to Equations (1)–(3), all relevant parameters of the γ’ phase in the field of view are calculated and counted. The statistical results are shown in Table 2. Moreover, 15,680 SEM images in 20 areas of 5 sections were processed by the same model and calculation method. The 3.17 × 10⁷ γ’ phases extracted from 20 regions were quantitatively analyzed, and the statistical results were visualized based on the original position of the γ’ phase.

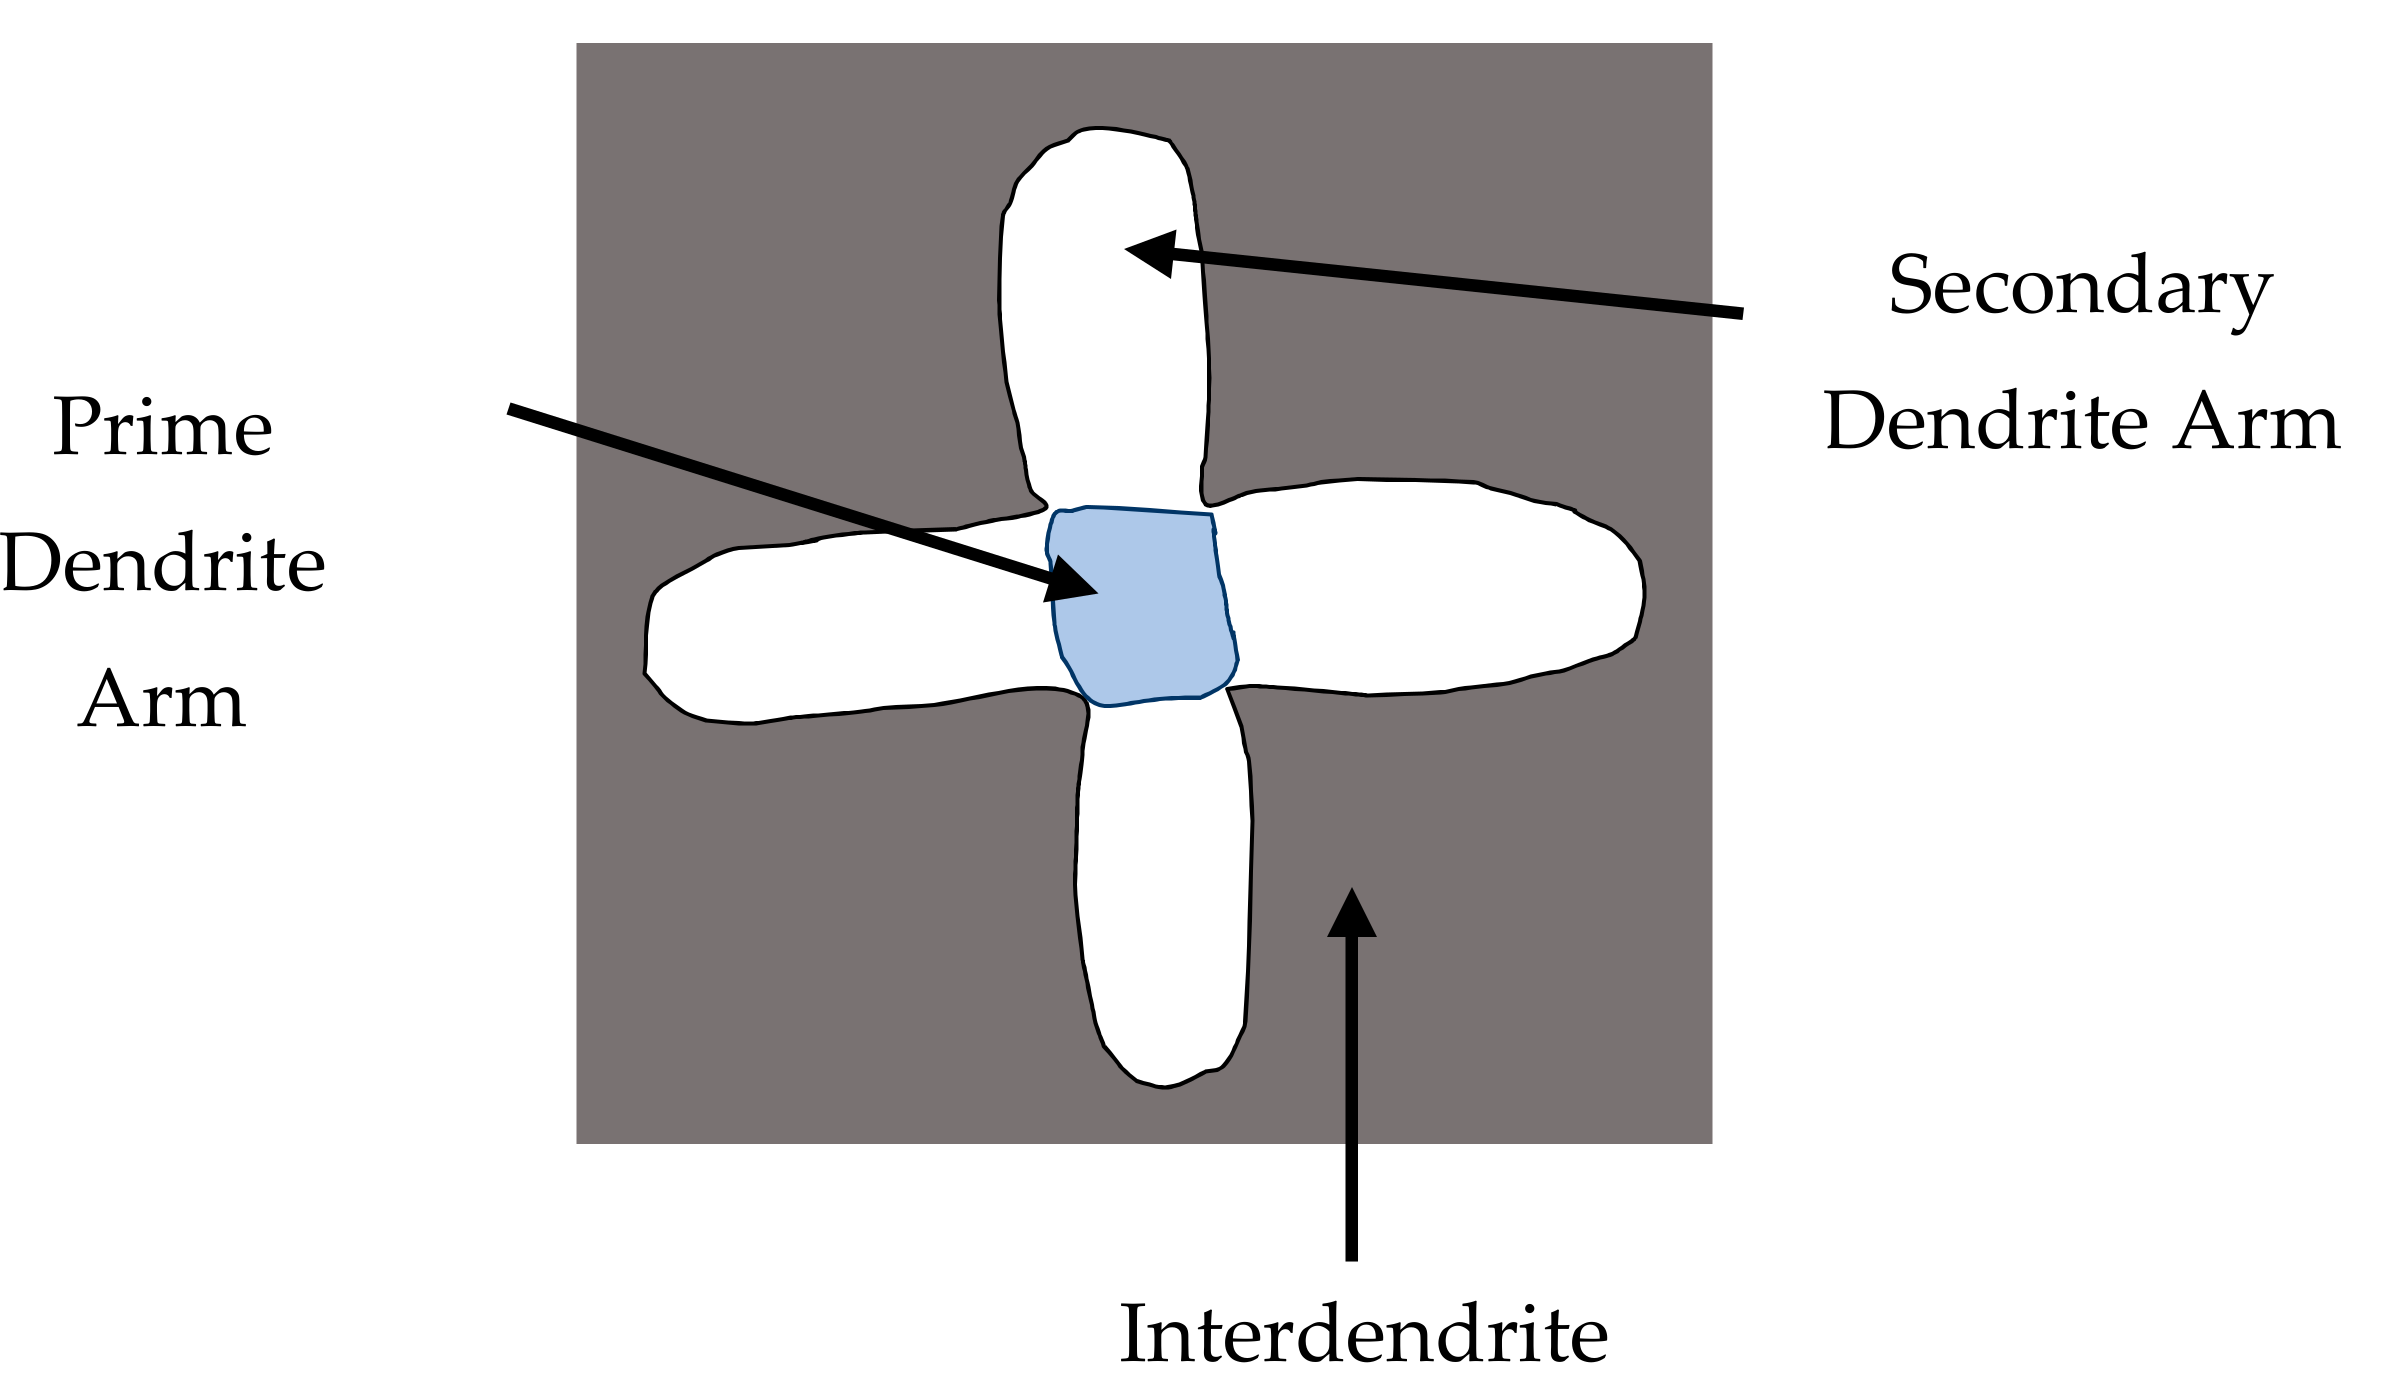
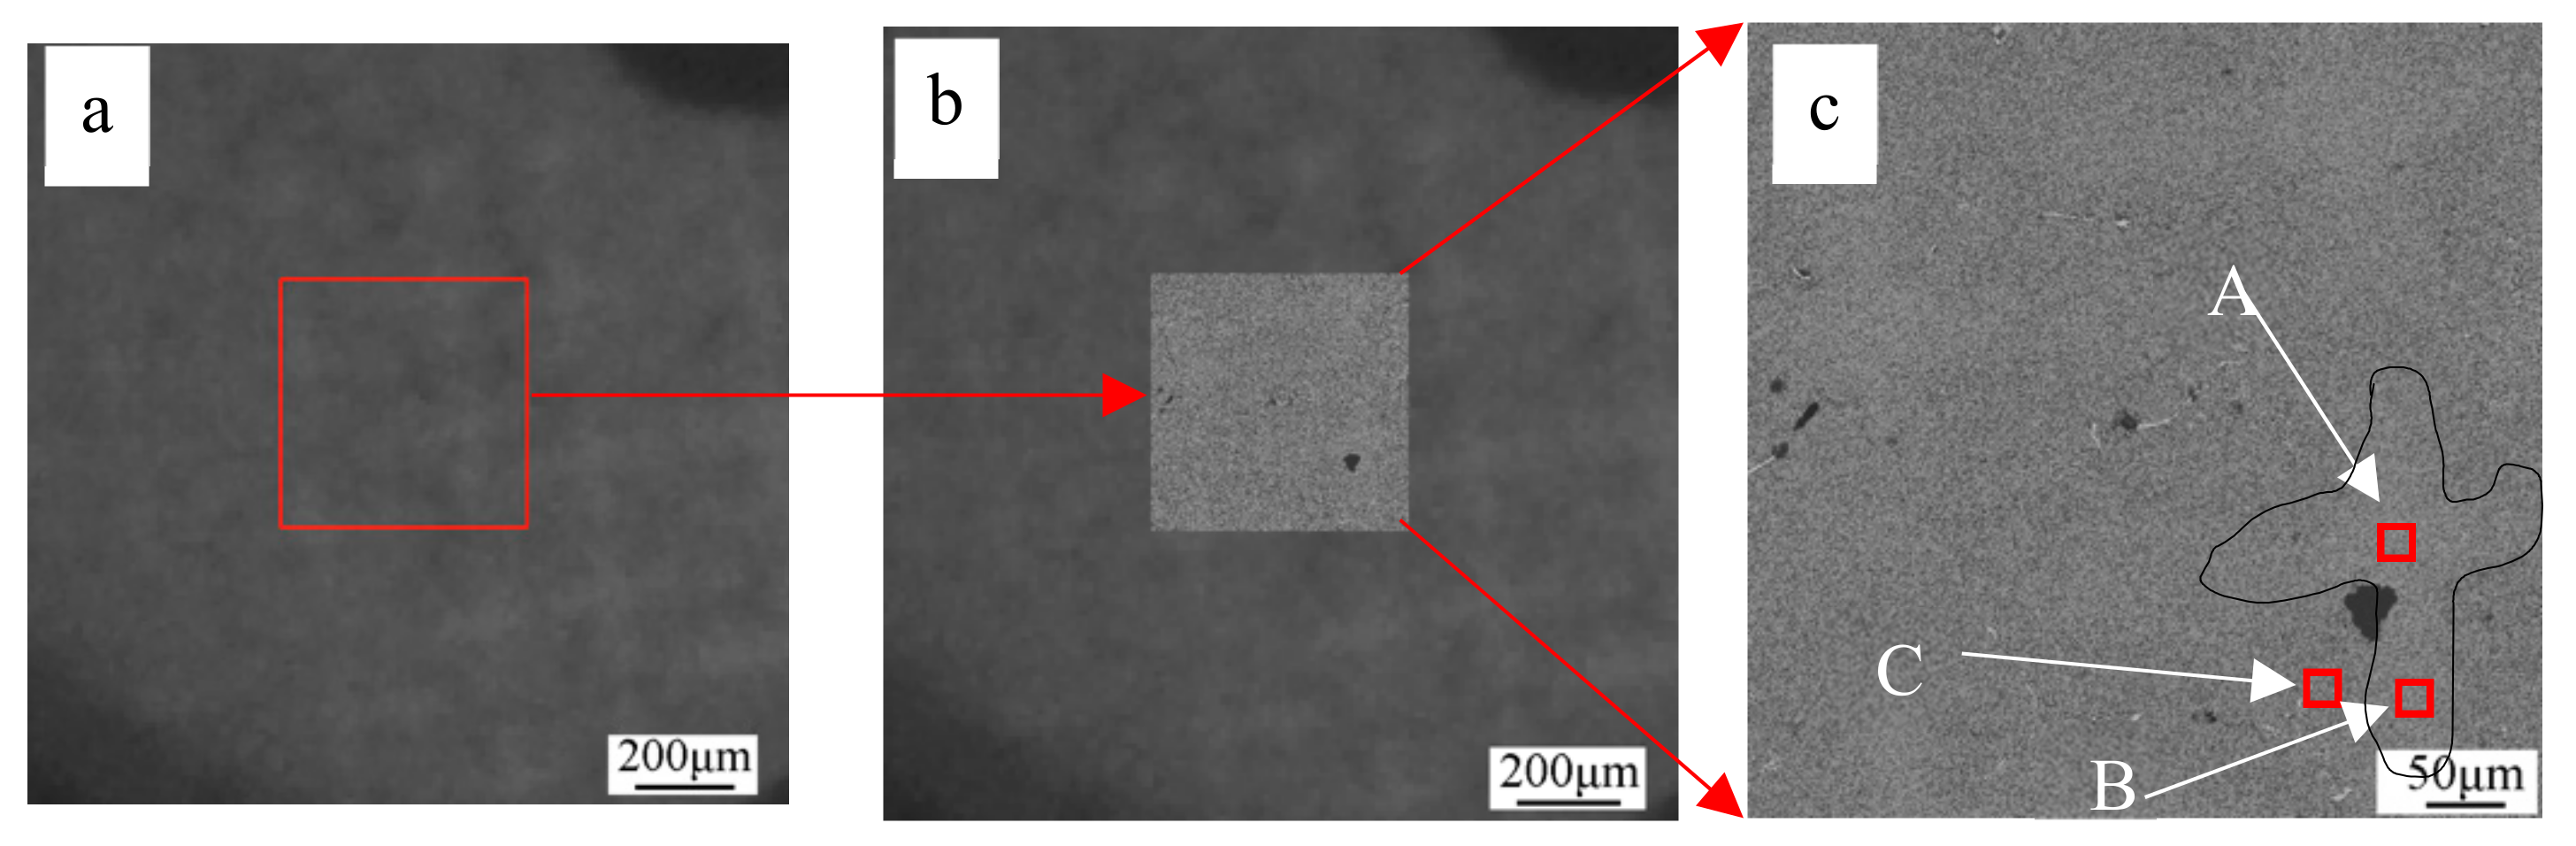
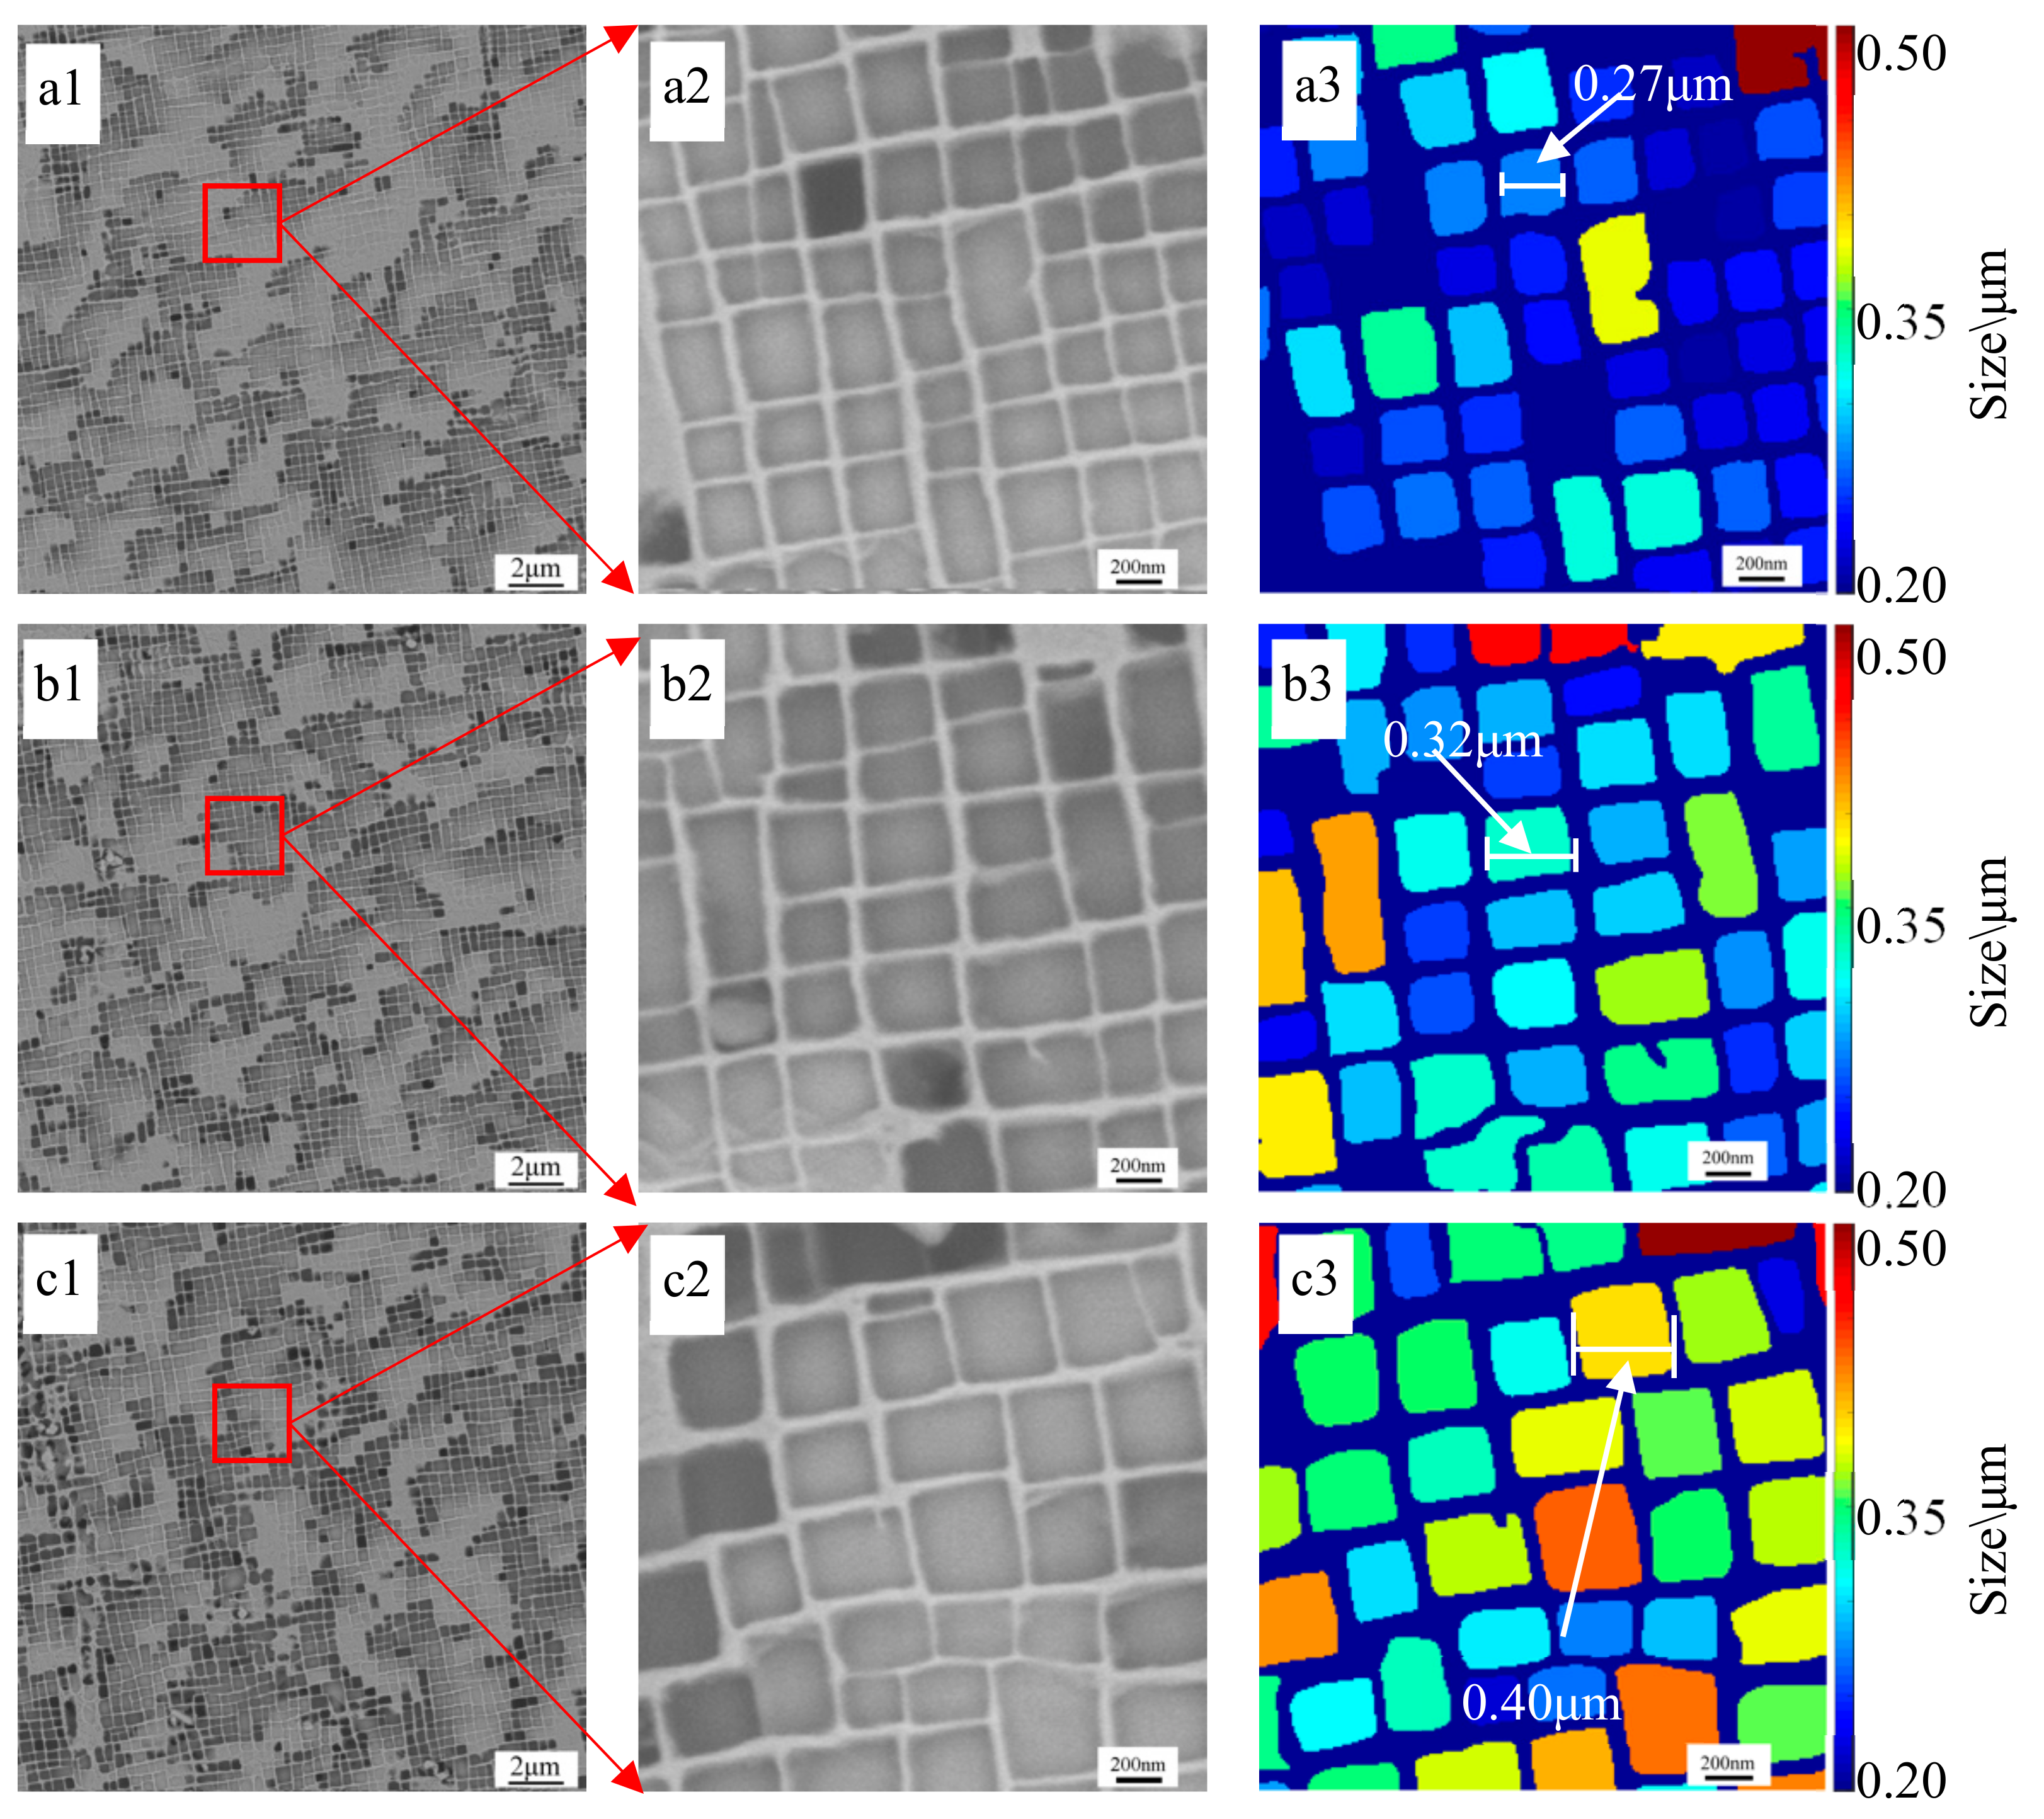
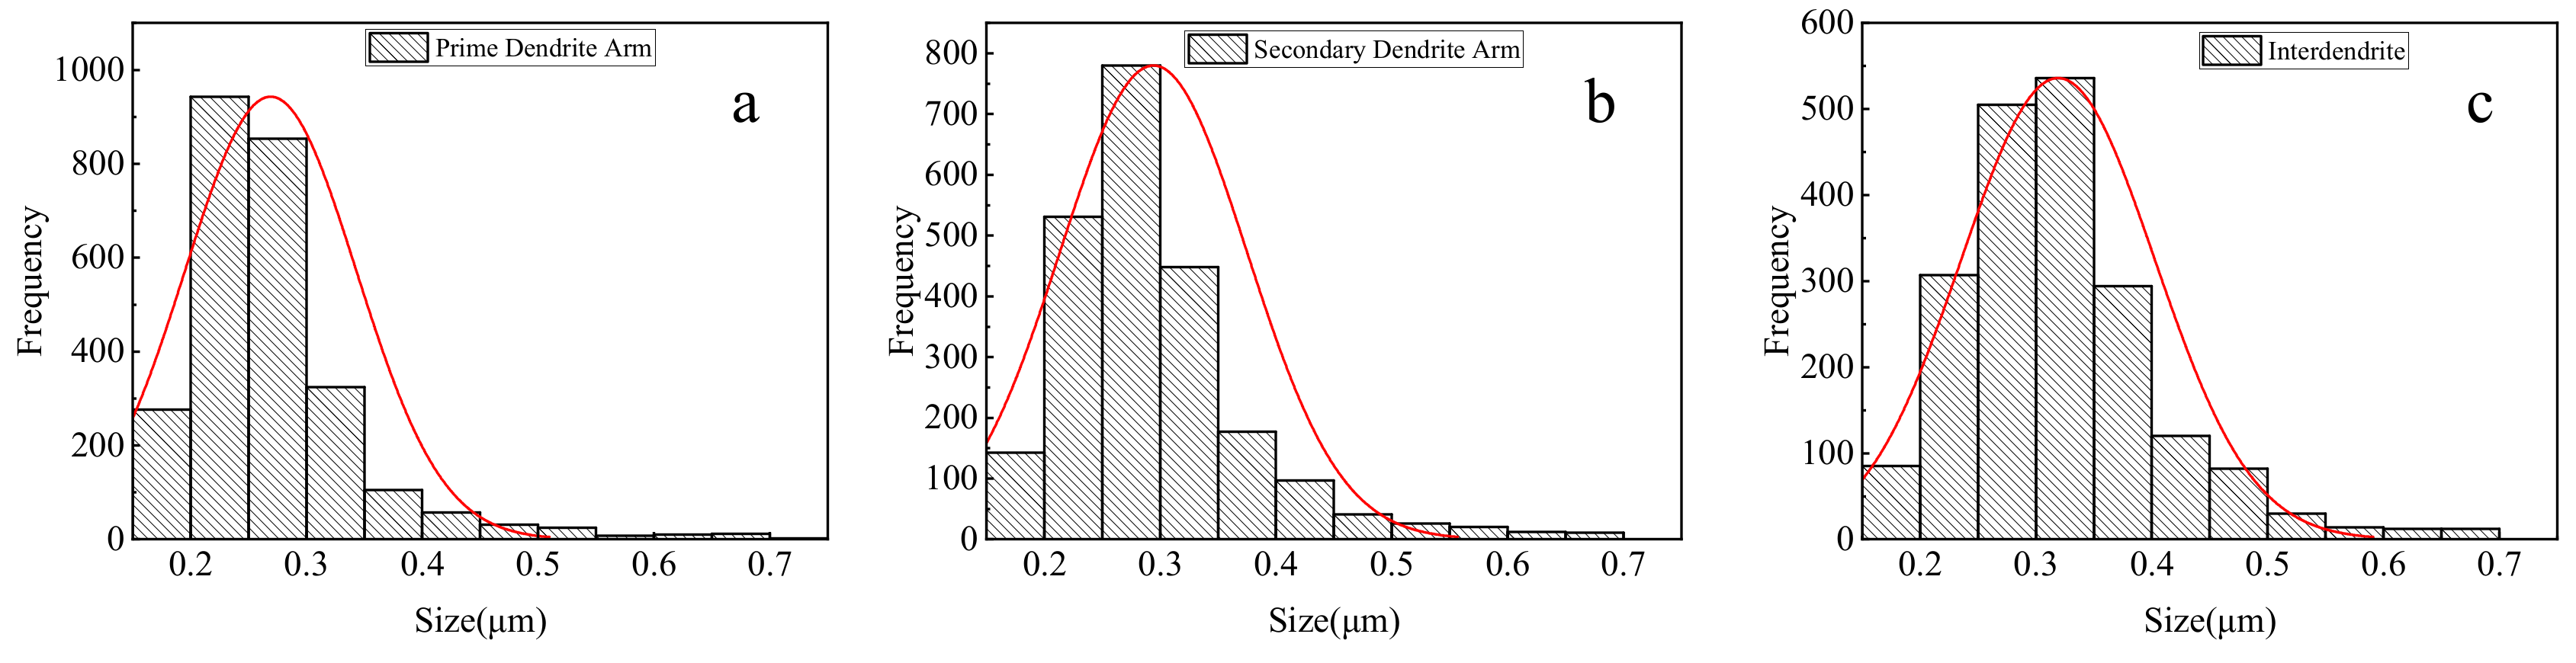
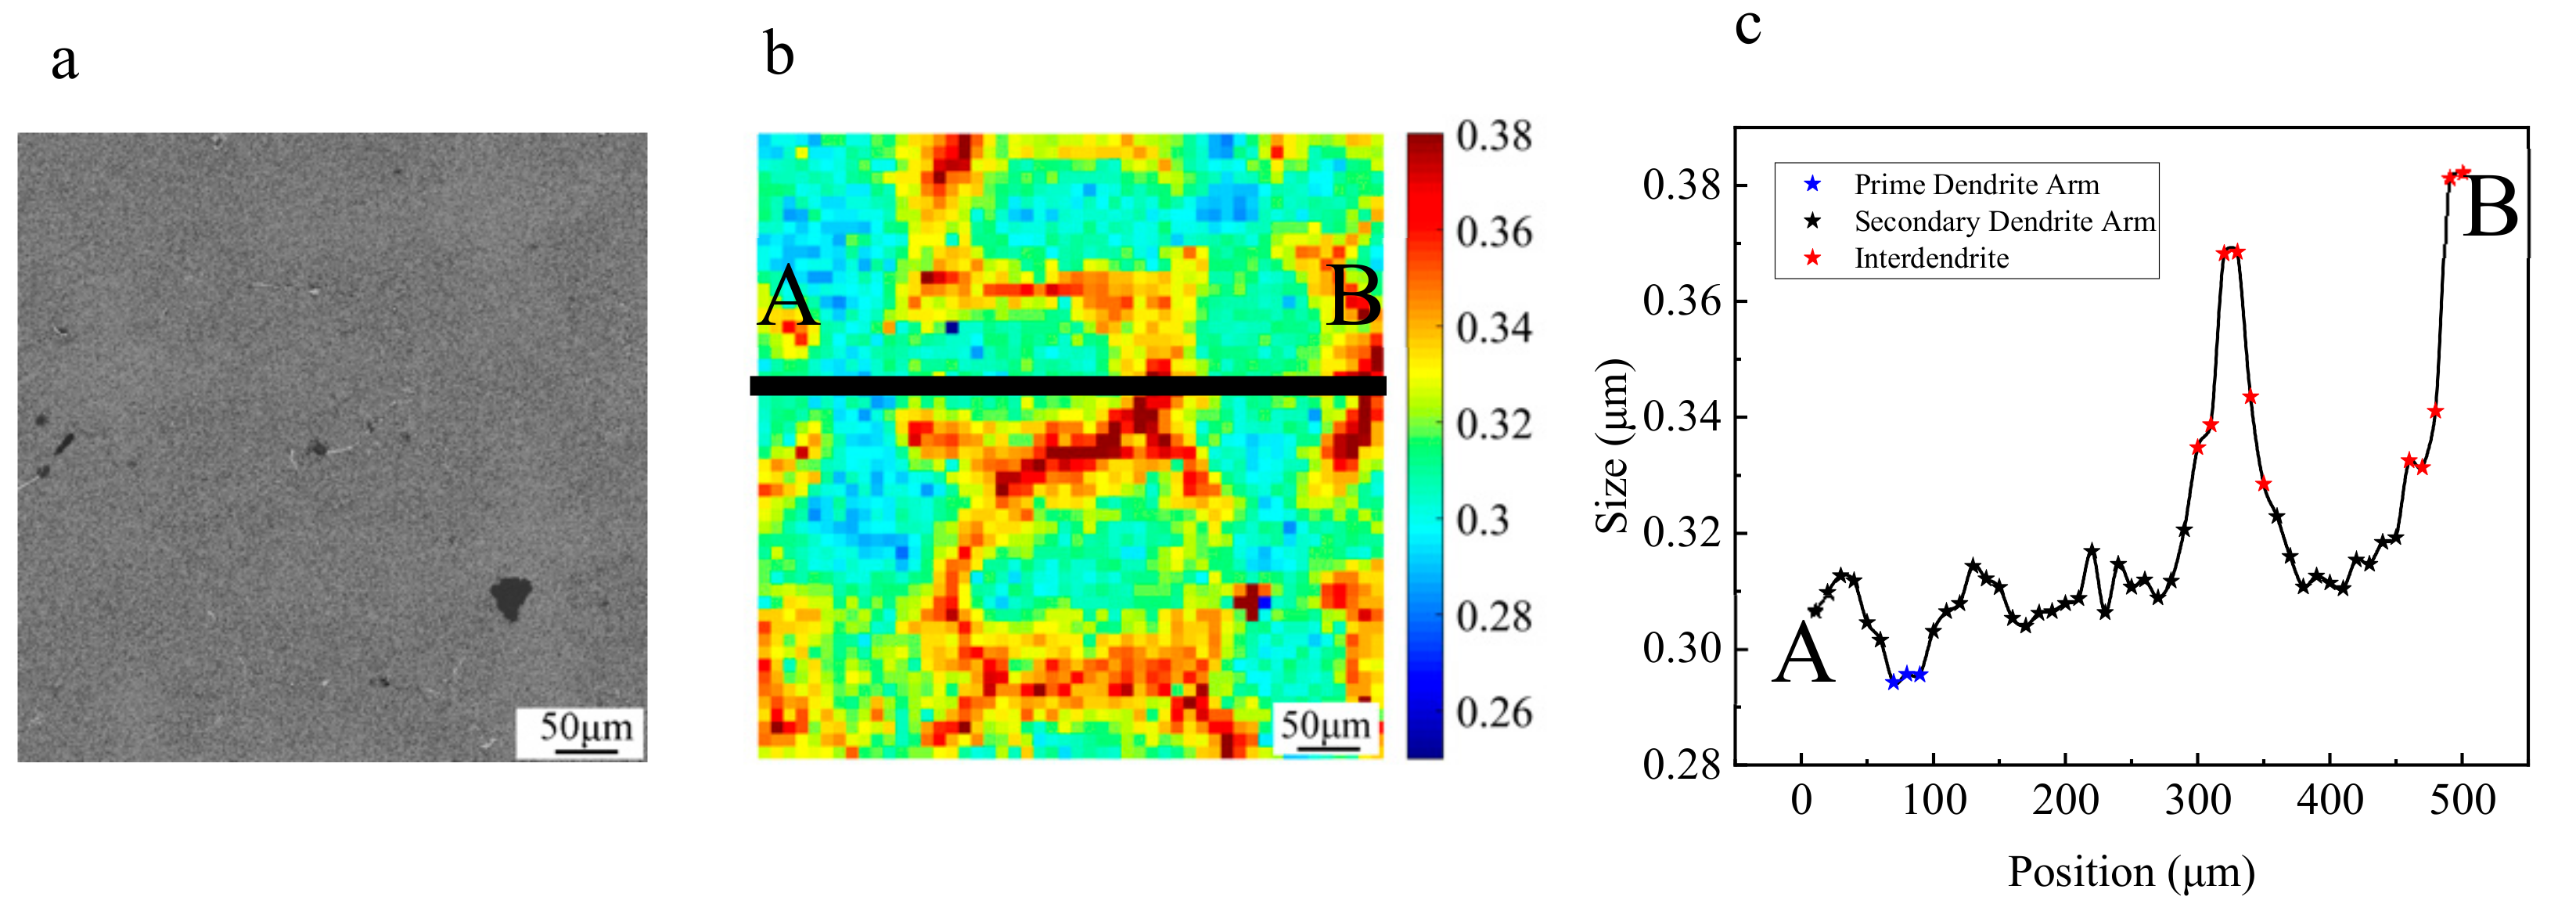
3.1. γ’ Phase Distribution of Primary Dendrite Arm, Secondary Dendrite Arm and Interdendrite

The γ’ phases are distributed in both the dendrite arms and the interdendrite. In order to study the uniformity of γ’ phase distribution, three regions with sizes of 20 μm × 20 μm were selected from the primary dendrite arm, secondary dendrite arm, and interdendrite position respectively, as shown in Figure 8. The dendrites of single crystal have obvious characteristics in the optical image. Therefore, the positions of primary dendrite, secondary dendrite and interdendrite were determined through the optical image in this work, and then the corresponding local SEM images were selected from the full-field SEM image corresponding to the optical image, as shown in Figure 9.
The dendrite microstructures have obvious characteristics in the optical image, so the positions of the primary dendrite arm, the secondary dendrite arm and the interdendrite are determined by the optical image. The SEM images of the typical regions are selected from the full-field SEM image corresponding to the optical image, as shown in Figure 8. The SEM images at each position are shown in Figure 10(a1–c1). It can be seen that the γ’ phases at the interdendrite are larger than those at the primary and secondary dendrite arms, as shown in Figure 10(a2–c2). The sizes of all γ’ phases at three different positions are calculated and visualized, as shown in Figure 10(a3–c3). The quantitative results show that the large-size γ’ phases of the interdendrite are obviously more than the other two positions. The corresponding conclusion can also be seen from the size distribution of all γ’ phases in the three fields of view, as shown in Figure 11. Figure 11 also shows that the size of the γ’ phase at the primary dendrite arm position is the most concentrated, while the size of the γ’ phase at the interdendrite position has the largest dispersion. The average sizes of the γ’ phase at the primary dendrite arm, secondary dendrite arm and interdendrite are 0.27, 0.29 and 0.32 μm, respectively, as shown in Table 3.
A large number of γ’ phases are distributed in the primary dendrite arms, secondary dendrite arms and interdendrite positions, but the sizes of the γ’ phases at different positions are not the same. Figure 11 shows the statistical results of different sizes of γ’ phases in three small fields of view. In order to avoid the statistical deviation caused by sampling in a small field of view, the size distribution of the γ’ phase in a 0.5 mm × 0.5 mm area is quantitatively and statistically characterized, and the characterization results are shown in Figure 12. Figure 12a is the original full-field SEM image of the γ’ phase, and Figure 12b is the size distribution of the γ’ phase in Figure 12a. It can be seen that the distribution of γ’ phase in Figure 12b has a clearer unevenness. Among them, the γ’ phase at the position of the dendrite arm is smaller, and the larger γ’ phase is more distributed in the interdendrite. Figure 12c is the line distribution of the γ’ phase of the line AB passing through the primary dendrite arm, the secondary dendrite arm and the interdendrite at the same time in Figure 12b. The size of the γ’ phase near the primary dendrite arm is the smallest, and the size of the γ’ phase between the dendrites is obviously larger than the size of the γ’ phase at the dendrite arm, as shown by the red star mark in Figure 12c.

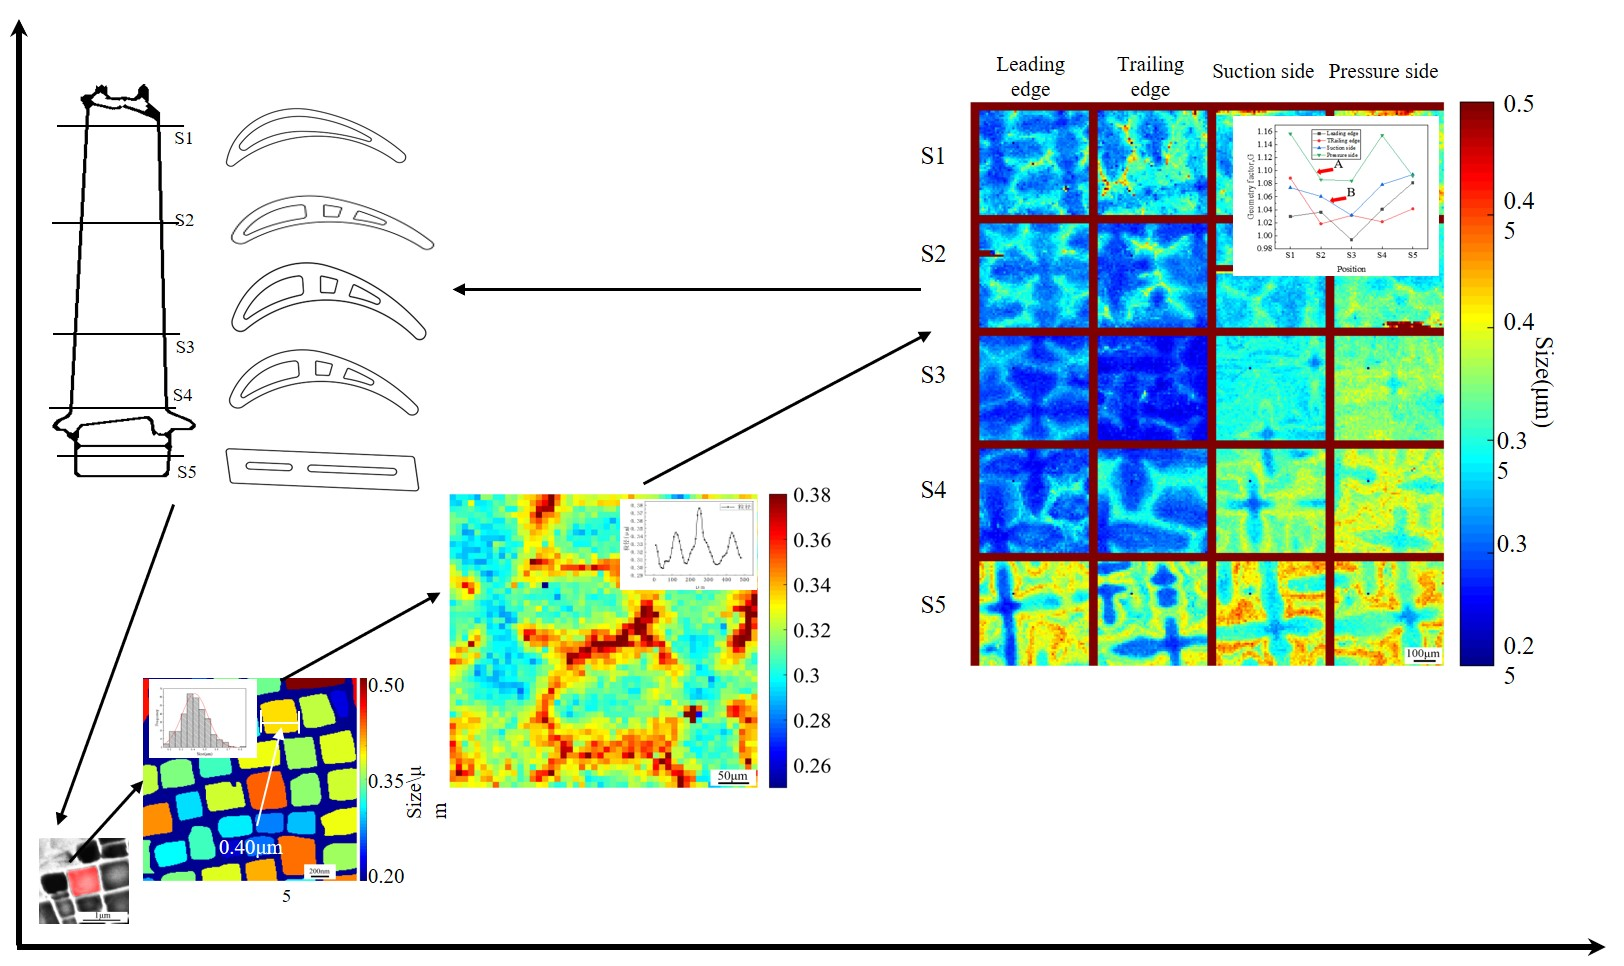
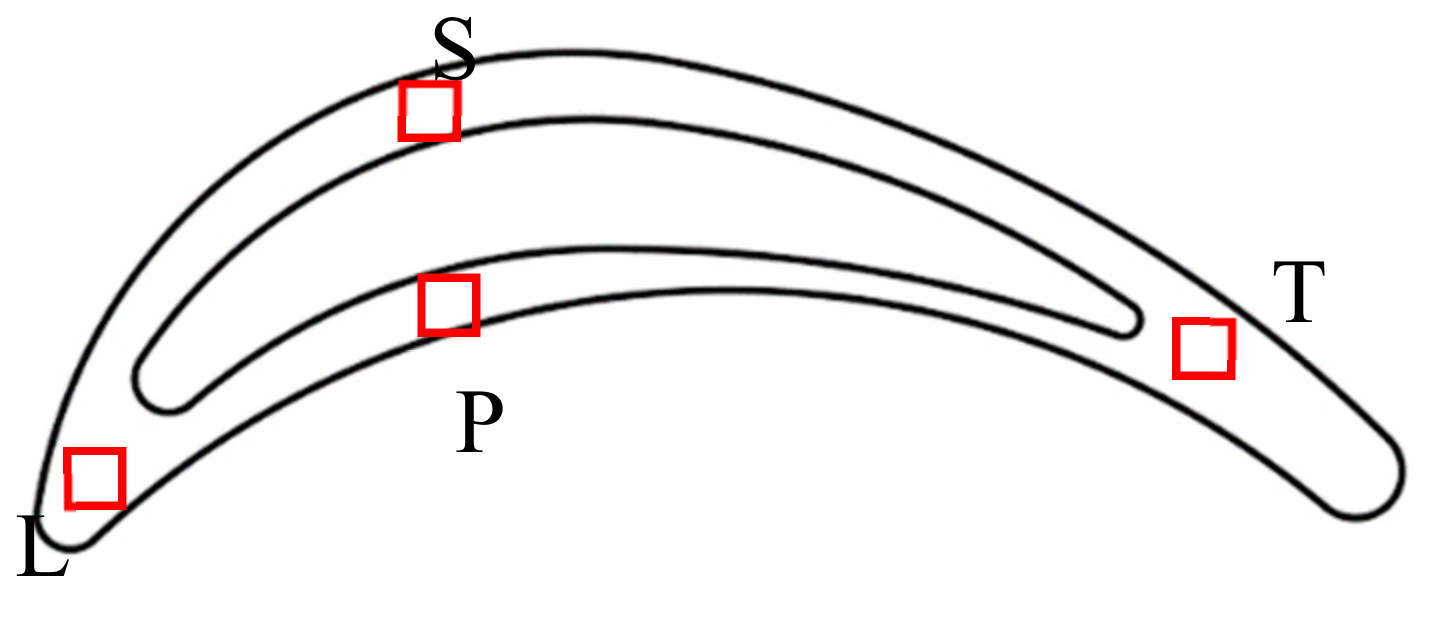
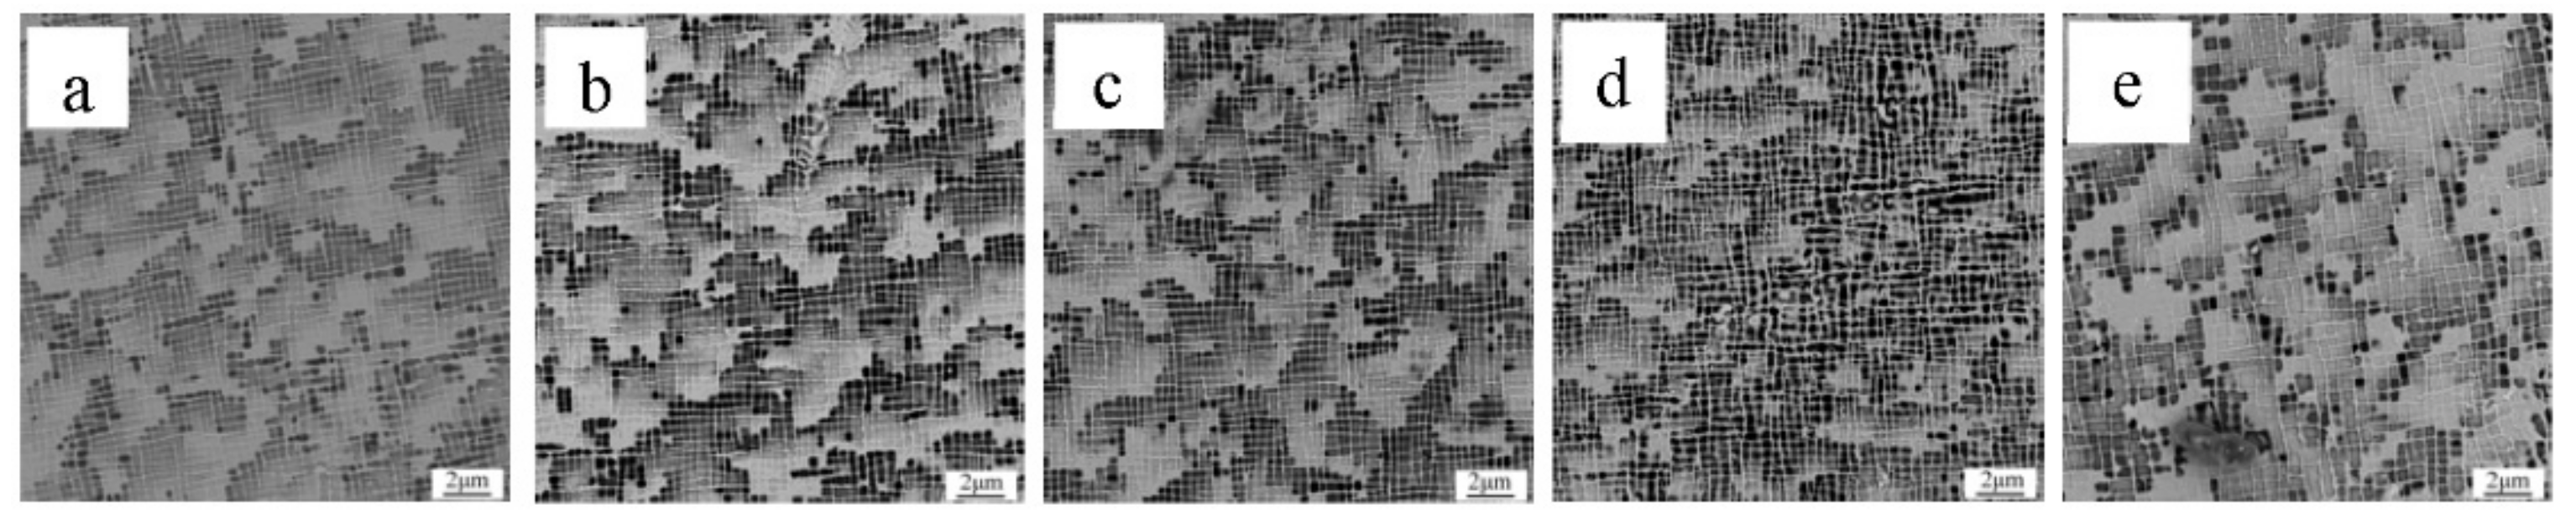
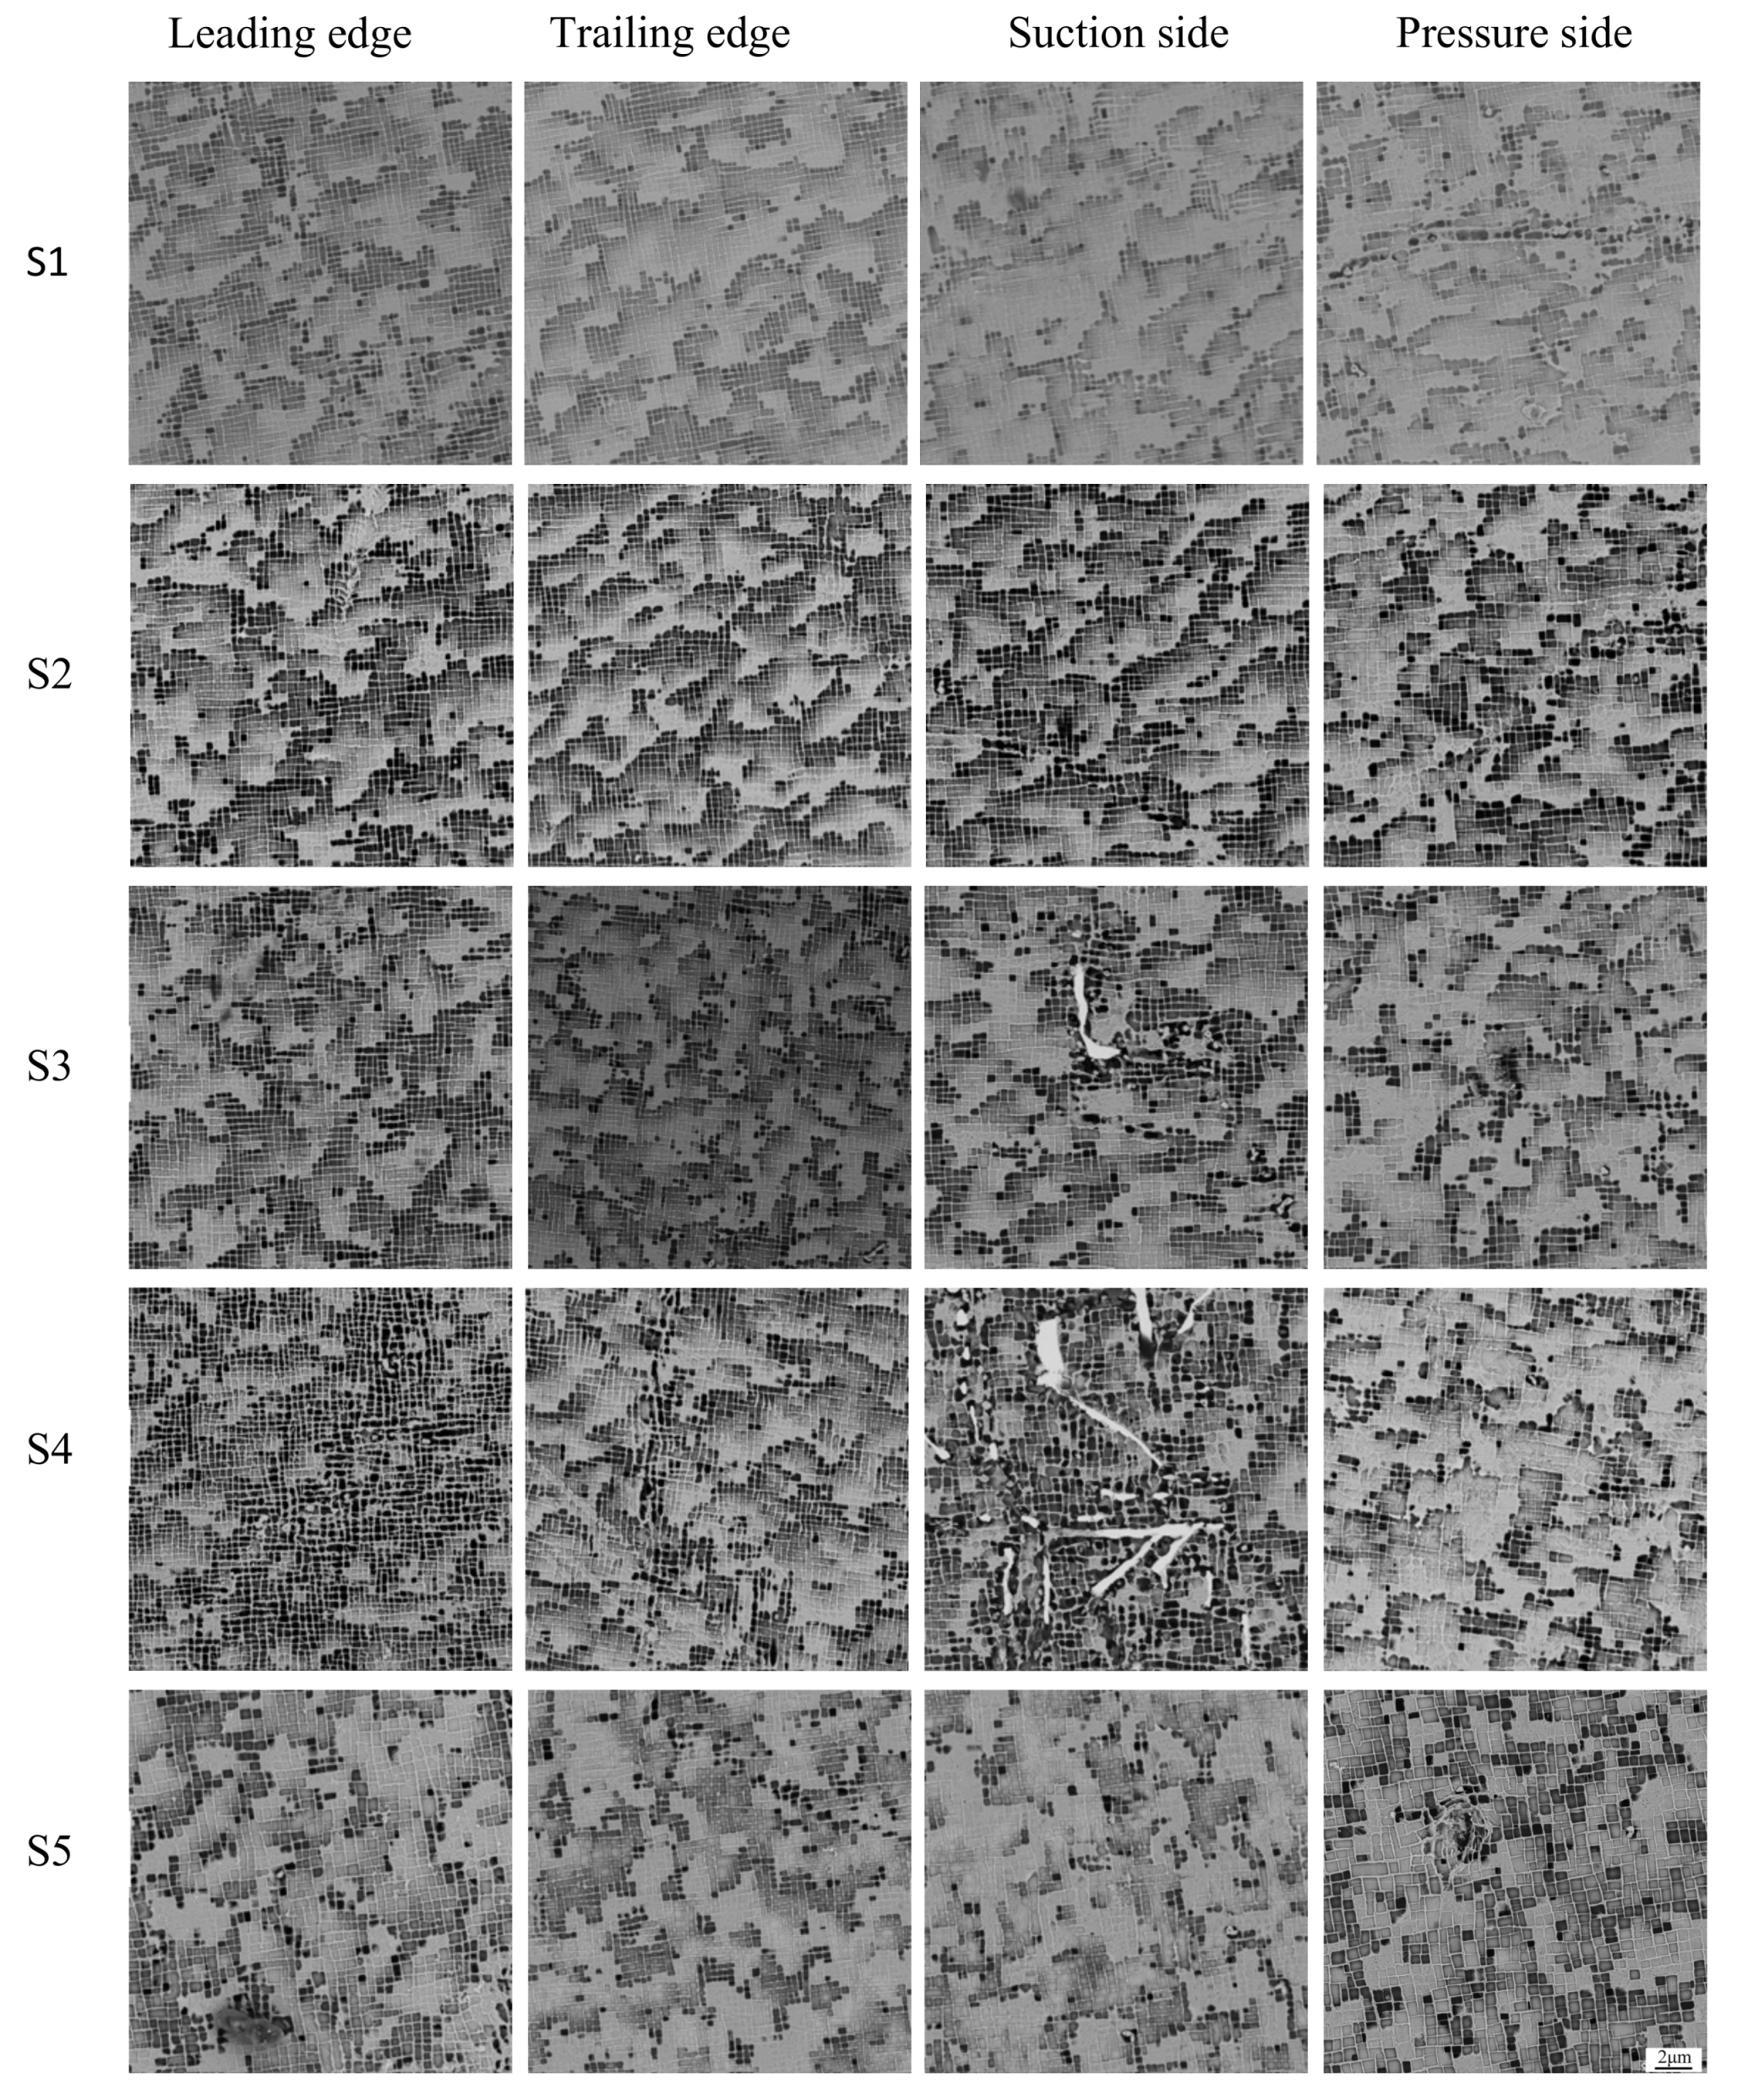
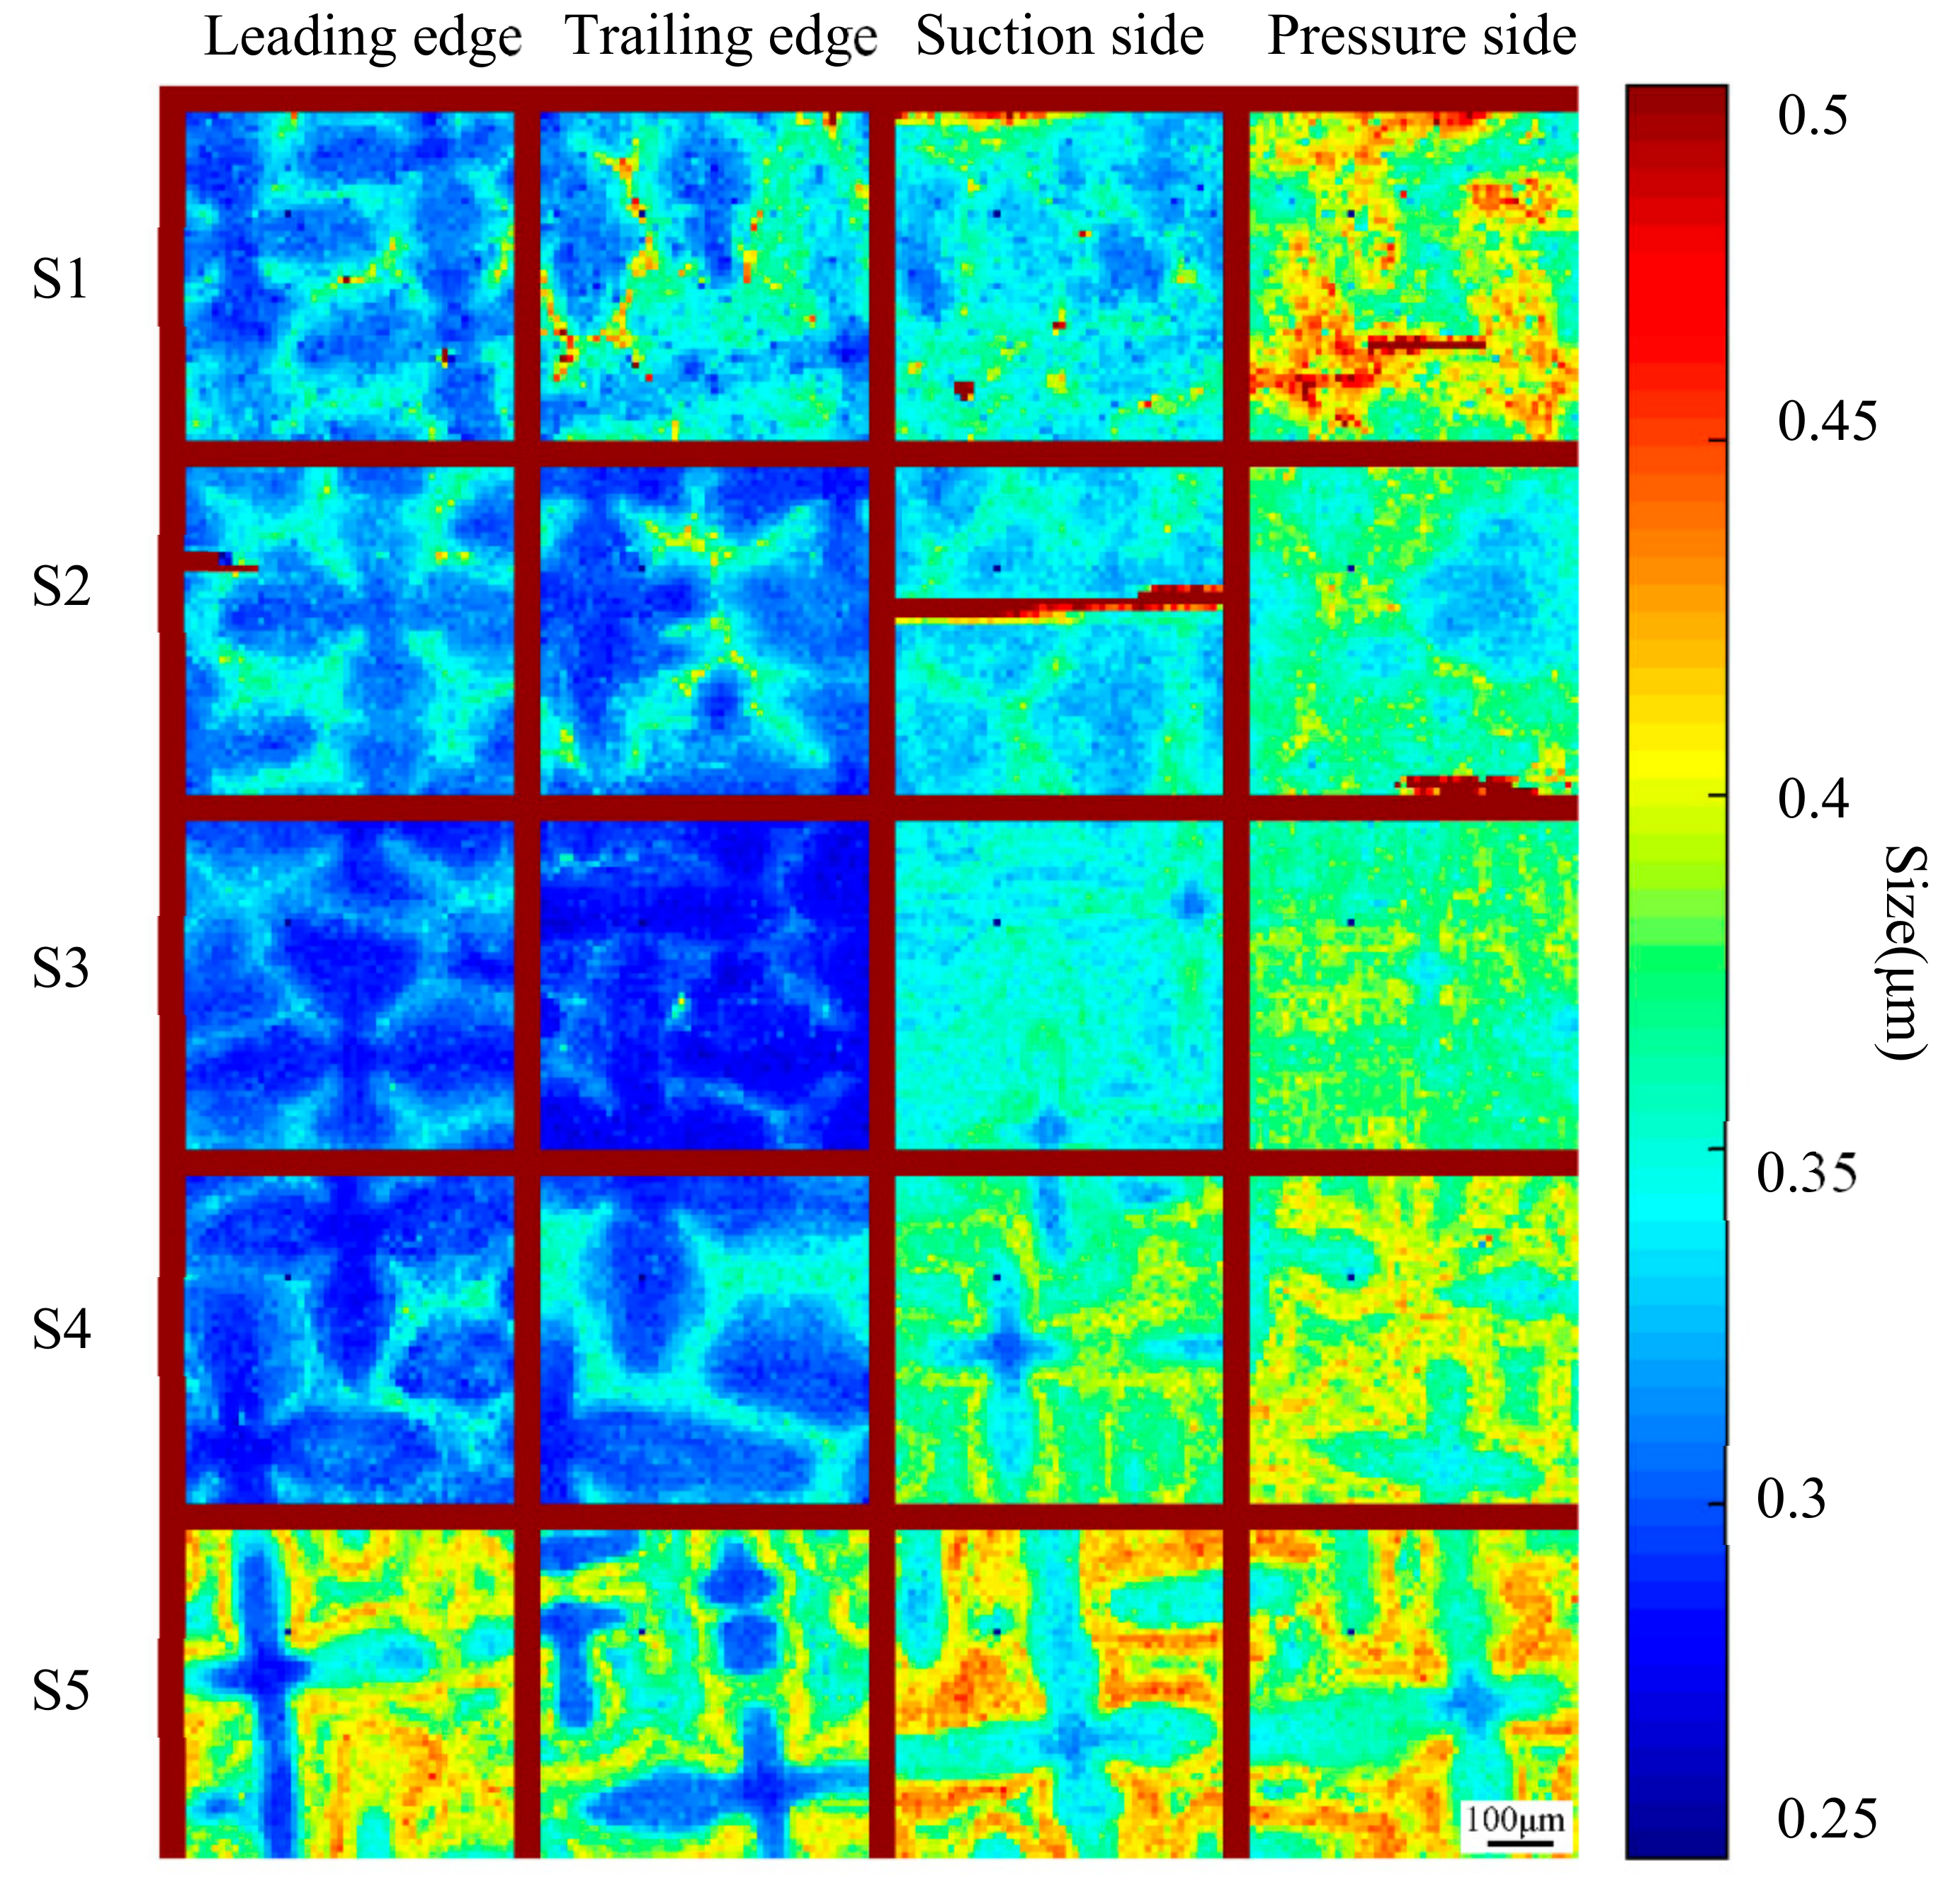
3.2. Microstructure in the Transverse Sections of the Single Crystal Blad

Figure 13 shows the SEM images of γ/γ’ in transverse section S1–S5. It can be clearly shown that the size of the γ’ phases at different positions is not the same. The γ’ phases at the Pressure side position are obviously larger than the γ’ phases at other positions. In order to accurately compare the distribution differences of the γ’ phases at different positions of the blade, all the γ’ phases at each position are quantitatively and statistically characterized, and the characterization results are shown in Figure 14. It can be seen that the size distribution of γ’ phases present a regular uneven distribution. In accordance with the distribution pattern shown in Figure 12, Figure 14 also shows that the γ’ phases of the dendrite arms are smaller, and the γ’ phases in the interdendrite are larger. The distribution of γ’ phases at different positions of the blades is also not uniform. It can be clearly shown that the size of the γ’ phase at the suction side of the blade and the pressure side is larger than the γ’ at the leading edge and trailing edge. In addition, the distribution of the γ’ phase in different sections is also uneven, and the γ’ phases at the tenon are larger than the γ’ phases at other positions.
The heat treatment process can significantly increase the degree of cubization of the γ’ phase in the single crystal blade, and the excellent high temperature performance of the single crystal blade is closely related to the degree of cubization of the γ’ phase. In this work, we calculated the geometric factor of the γ’ phase according to Equation (3) to quantify the degree of cubization of the γ’ phase, as shown in Figure 15. In Figure 15A–C are typical geometric morphologies, where A, B, and C are γ’ phase features with rectangular, square, and circular sections, respectively. Among the three selected γ’ phases, B is the most cubic γ’ phase. Calculate the geometric factors of A, B, and C as 1.51, 1.02, and 0.87, respectively. Equation (3) and Figure 15 show that when the geometric factor is closer to 1, the cubic degree of the γ’ phase is better. Calculate the geometric factors of all γ’ phases at each position in the five cross-sections by Equation (3).
The average values of the size and geometric factor of the γ’ phases in a total of 20 regions on the five sections are calculated, and the result is shown in Figure 16. Figure 16a shows that the γ’ phases at the leading edge and trailing edge of the blade are smaller than the γ’ phases at the suction side and pressure side positions, and the γ’ phases of the blade body section are smaller than the γ’ phases of the tenon section. Figure 16b shows that the γ’ phases at the positions of the leading edge and trailing edge of the blade are closer to the cube than the γ’ phases at the suction side and pressure side positions. In addition, we calculated the area fractions of the γ’ phases of five different sections, and the calculation results are shown in Table 4. The results show that the area fractions of theγ’ phases at the leading edge and trailing edge are smaller than the area fractions of the γ’ phases at the other two positions.
The quantitative statistical results show that the γ’ phases at the blade body are smaller than the γ’ phases at the tenon, and the γ’ phases at the leading edge and trailing edge are smaller than the γ’ phases at the suction side and pressure side. In addition, the γ’ phases at the leading edge and the trailing edge are more cubed than the γ’ phases at the other two positions, and the area fractions are smaller. Among the various sections of the blade, the average geometry factor at the pressure side position is the largest, which indicates that most of the γ’ phases appearing at this position are rectangular.

4. Conclusions

  • A total of 3.17 × 10⁷ γ’ phases distributed in different parts of the leaf in 20 areas with a size of 5 mm × 5 mm were quickly identified and extracted by the U-net segmentation algorithm and quantitatively counted, which took 1h in total.
  • The γ’ phases at the primary dendrite arms, secondary dendrite arms and interdendrite have different sizes. Among them, the size of the γ’ phase appearing at the primary dendrite arms is the smallest, and the size of the γ’ phase appearing at the interdendrite is the largest.
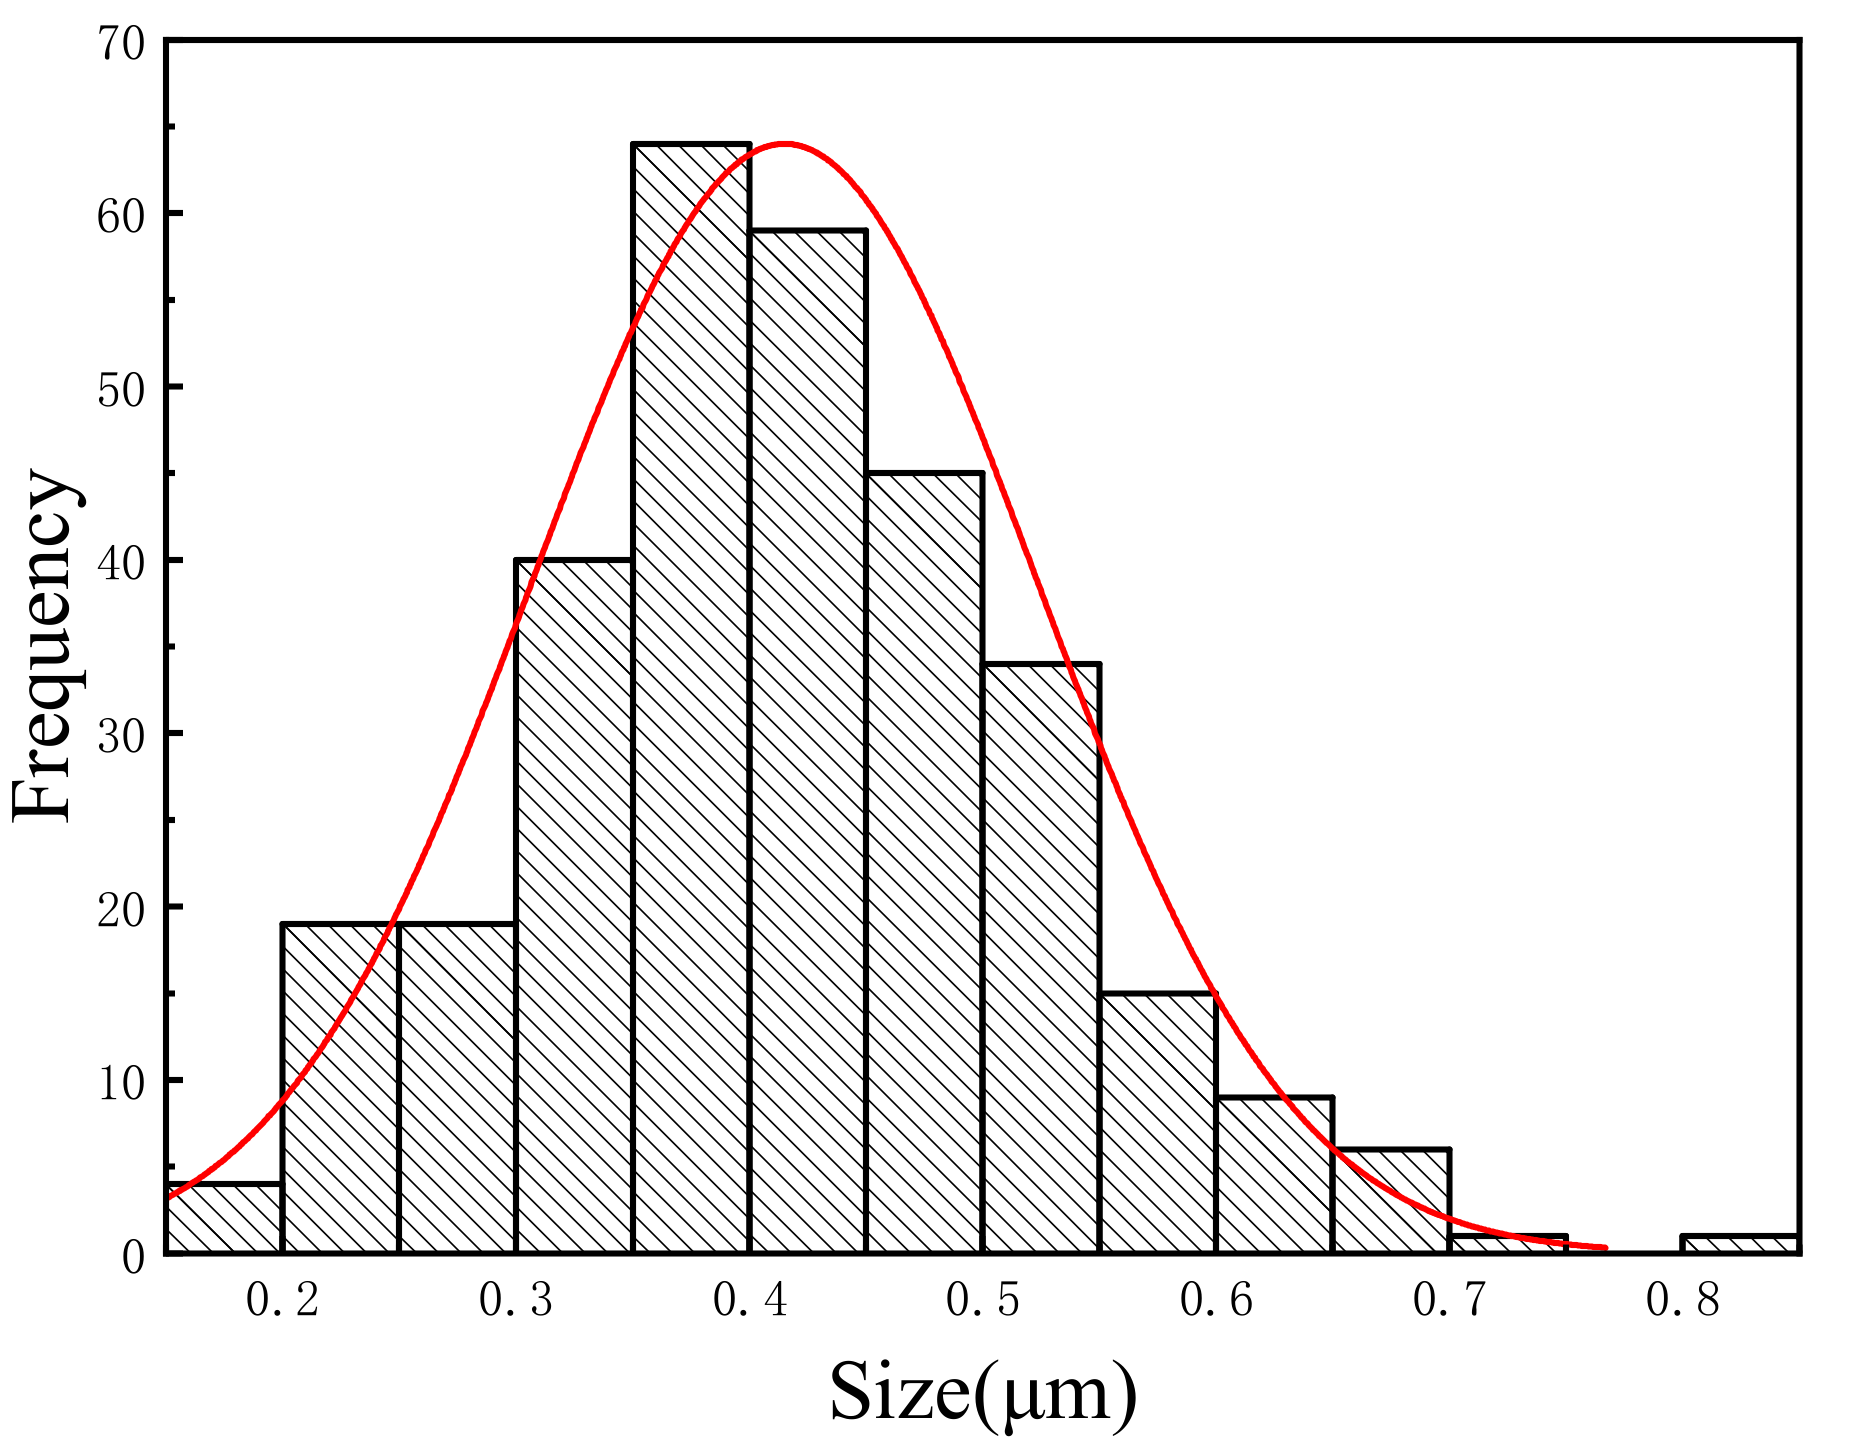
  • The sizes of the γ’ phase distributed at the interdendrite and the dendrite arms all follow the normal distribution. Among them, the γ’ phase size distribution is the most concentrated at the primary dendrite arm, and the γ’ phase size between the dendrites is the most dispersed.
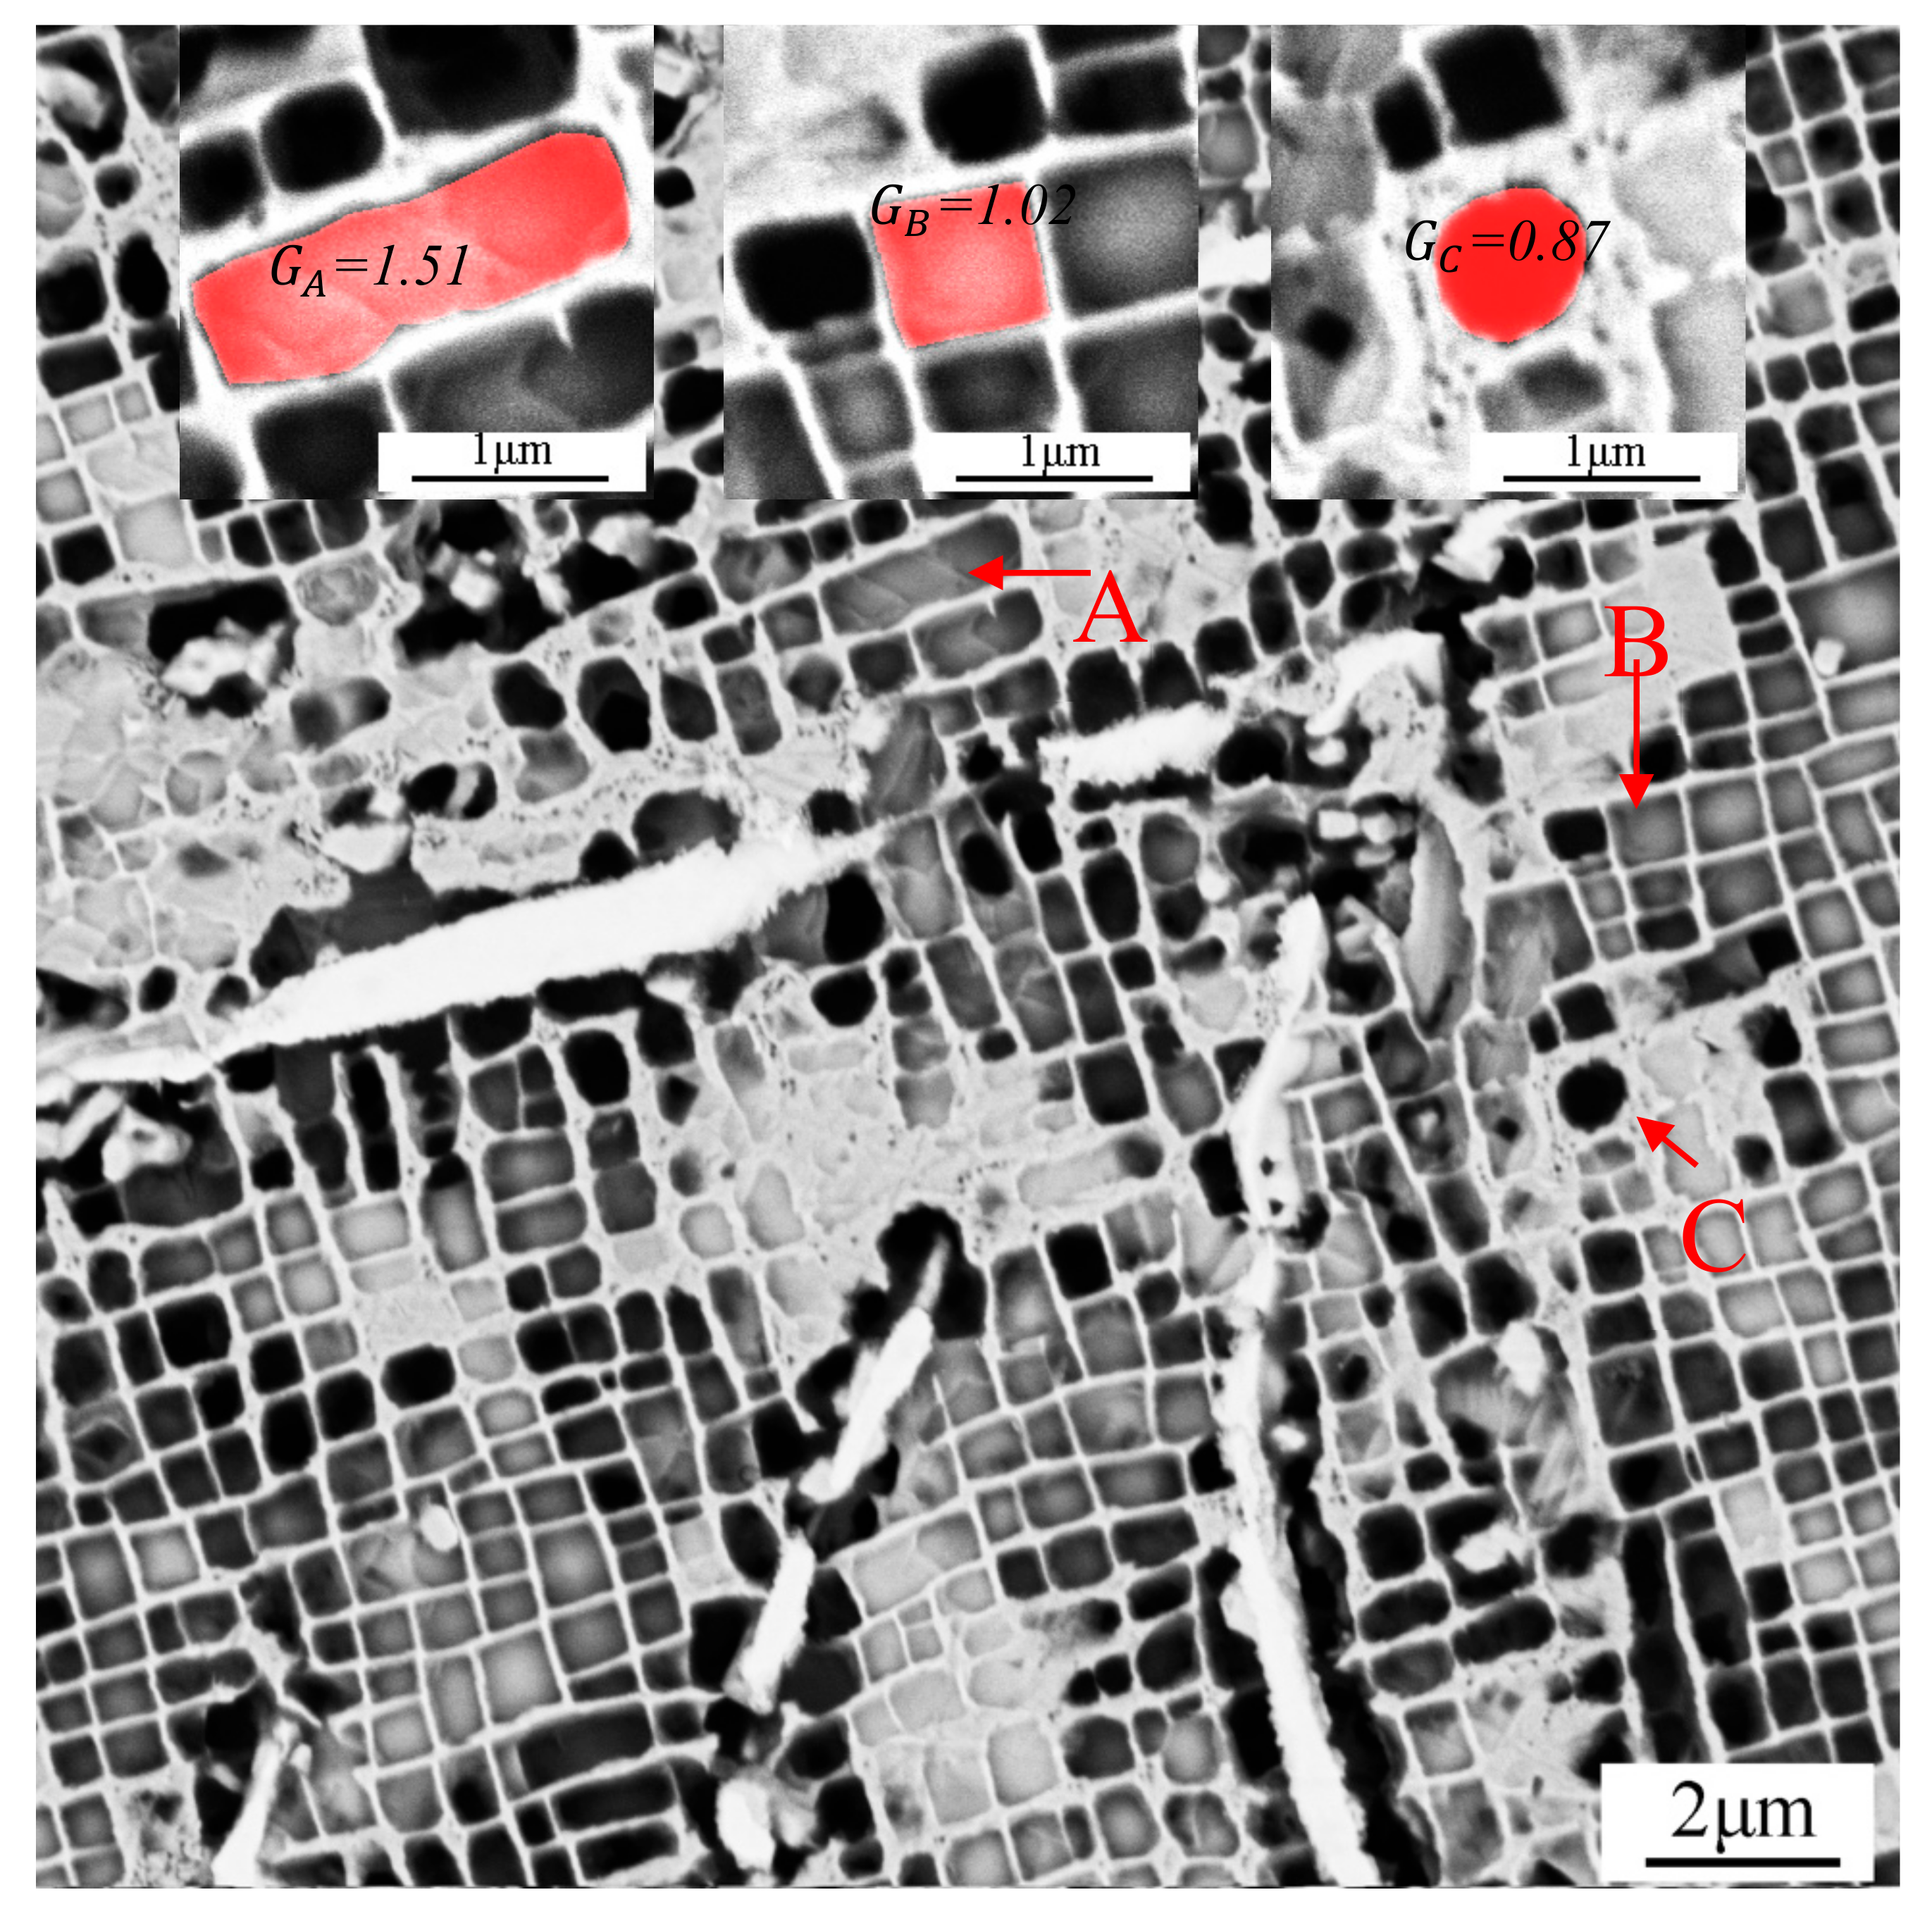
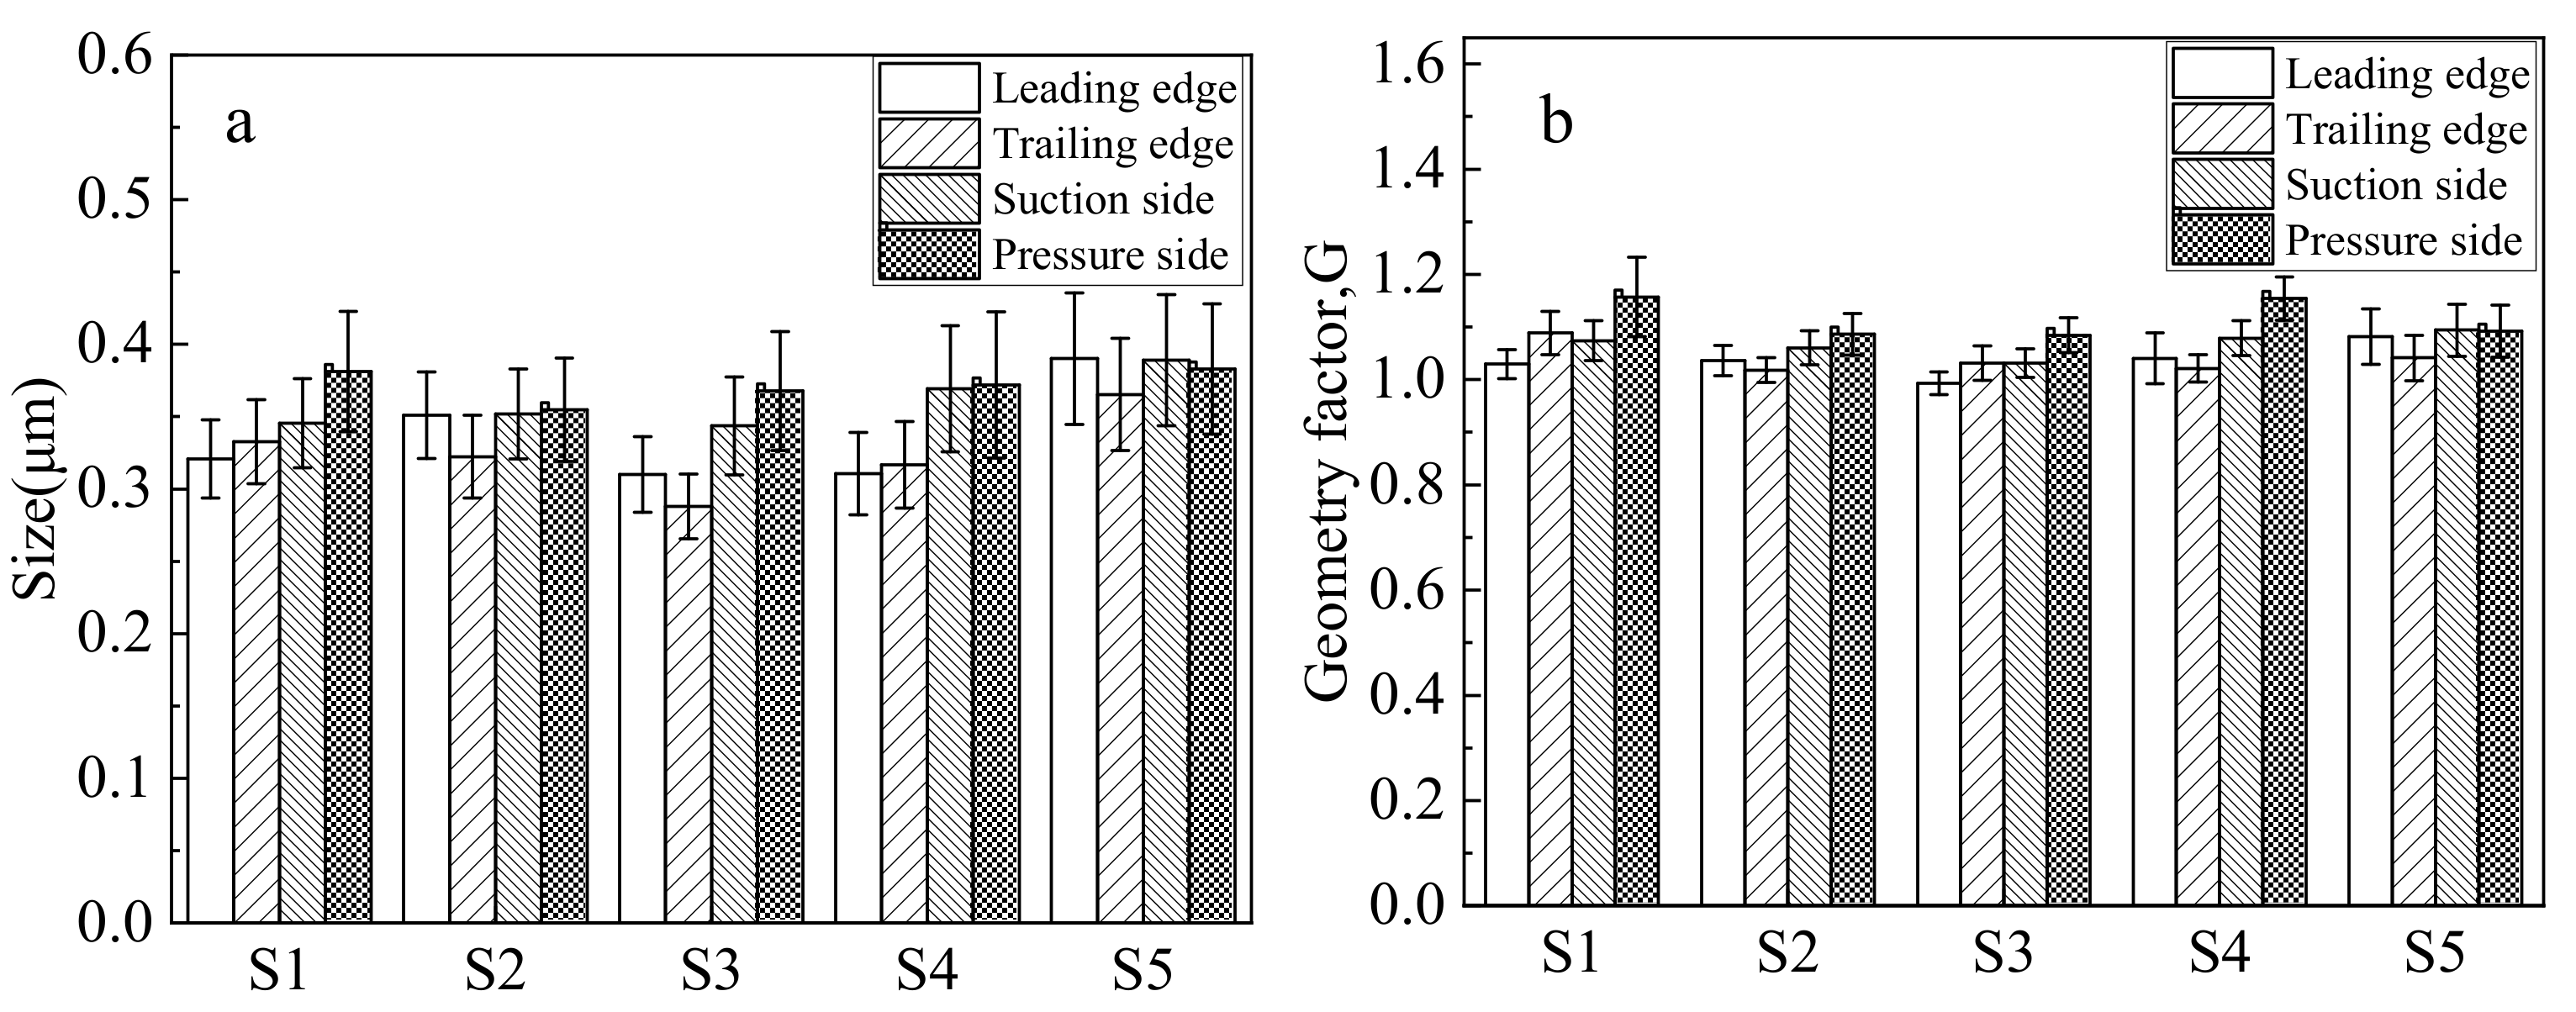
  • The γ’ phases at the leading edge and trailing edge are smaller in size, and have a more cubic geometry. The γ’ phases at the blade body are smaller than the γ’ phases at the tenon.

Author Contributions

Conceptualization: H.W. and W.W.; Methodology: W.W. and D.L.; Software: W.W.; Validation: H.W., Q.Z. (Qiang Zeng) and X.X.; Formal analysis: W.W. and Q.Z. (Qingqing Zhou); Investigation: W.W. and D.L.; Resources: Q.Z. (Qiang Zeng) and X.X.; Data curation: W.W., Q.Z. (Qingqing Zhou) and H.S.; Writing—Original Draft preparation: W.W.; Writing—Review and Editing: H.W., D.L. and W.W.; Visualization: W.W. and H.S.; Supervision: H.W.; Project administration: D.L. All authors have read and agreed to the published version of the manuscript.

Funding

(1) This research was funded by National Key Research and Development Program of China, grant number: No. 2018YFB0704102. (2) This research was funded by the Taishan Industrial Leading Talents Project, grant number: No. 2017TSCYCX-03.

Conflicts of Interest

The authors declare no conflict of interest.

References

  1. Ford, T. Single crystal blades. Aircr. Eng. Aerosp. Technol. 1997, 69, 564–566. [Google Scholar] [CrossRef]
  2. Dong, Y.; Bu, K.; Dou, Y.; Zhang, D. Determination of interfacial heat-transfer coefficient during investment-casting process of single-crystal blades. J. Mater. Process. Technol. 2011, 211, 2123–2131. [Google Scholar] [CrossRef]
  3. Ma, D.; Bührig-Polaczek, A. Application of a Heat Conductor Technique in the Production of Single-Crystal Turbine Blades. Metall. Mater. Trans. B 2009, 40, 738–748. [Google Scholar] [CrossRef]
  4. Cervellon, A.; Cormier, J.; Mauget, F.; Hervier, Z.; Nadot, Y. Very High Cycle Fatigue of Ni-Based Single-Crystal Superalloys at High Temperature. Metall. Mater. Trans. A 2018, 49, 3938–3950. [Google Scholar] [CrossRef]
  5. Li, S.; Ping, L. Low-Cycle Fatigue Behavior of a Nickel Base Single Crystal Superalloy at High Temperature. Rare Met. Mater. Eng. 2015, 44, 288–292. [Google Scholar] [CrossRef]
  6. Leidermark, D. Evaluation of Thermomechanical Fatigue Crack Initiation in a Single-Crystal Superalloy. Stud. Eur. Cine. 2015, 11, 155–169. [Google Scholar]
  7. Gan, W.; Gao, H.; Zhao, Y.; Wen, Z.; Lu, G.; Jiang, B.; Yue, Z. Influence of microstructure degradation induced by pretreatment on the creep behavior in Ni-based single-crystal superalloy with different orientations. J. Mater. Res. 2020, 35, 610–622. [Google Scholar] [CrossRef]
  8. Huang, Y.; Wang, X.; Cui, C.; Tan, Z.; Li, J.; Yang, Y.; Liu, J.; Zhou, Y.; Sun, X. Effect of thermal exposure on the microstructure and creep properties of a fourth-generation Ni-based single crystal superalloy. J. Mater. Sci. Technol. 2021, 69, 180–187. [Google Scholar] [CrossRef]
  9. Wang, J.; Zhang, L.T.; Chen, K.; Sun, N.R.; Shan, A.D. Morphology and chemical composition of γ/γ’ phases in Re-containing Ni-based single crystal superalloy during two-step aging. Trans. Nonferrous Met. Soc. China 2011, 21, 1513–1517. [Google Scholar] [CrossRef]
  10. Xuan, W.; Lan, J.; Zhao, D.; Li, C.; Shang, X.; Zhong, Y.; Li, X.; Ren, Z. Effect of a High Magnetic Field on γ′ Phase for Ni-Based Single Crystal Superalloy During Directional Solidification. Metall. Mater. Trans. B 2018, 49, 1919–1924. [Google Scholar] [CrossRef]
  11. Wang, F.; Ma, D.; Bogner, S.; Bührig-Polaczek, A. Comparative Investigation of the Downward and Upward Directionally Solidified Single-Crystal Blades of Superalloy CMSX-4. Metall. Mater. Trans. A 2016, 47, 2376–2386. [Google Scholar] [CrossRef]
  12. Ding, Q.; Bei, H.; Zhao, X.; Gao, Y.; Zhang, Z. Processing, Microstructures and Mechanical Properties of a Ni-Based Single Crystal Superalloy. Crystals 2020, 10, 572. [Google Scholar] [CrossRef]
  13. Xiang, S.; Mao, S.; Wei, H.; Liu, Y.; Zhang, J.; Shen, Z.; Long, H.; Zhang, H.; Wang, X.; Zhang, Z.; et al. Selective evolution of secondary γ′ precipitation in a Ni-based single crystal superalloy both in the γ matrix and at the dislocation nodes. Acta Mater. 2016, 116, 343–353. [Google Scholar] [CrossRef]
  14. Elliott, A.J.; Pollock, T.M.; Tin, S.; King, W.T.; Huang, S.C.; Gigliotti, M.F.X. Directional solidification of large superalloy castings with radiation and liquid-metal cooling: A comparative assessment. Metall. Mater. Trans. A 2004, 35, 3221–3231. [Google Scholar] [CrossRef]
  15. Clemens, M.L.; Price, A.; Bellows, R.S. Advanced solidification processing of an industrial gas turbine engine component. Jom J. Miner. Met. Mater. Soc. 2003, 55, 27–31. [Google Scholar] [CrossRef]
  16. Liu, Z.; Shu, J. Characterization of Microstructure, Precipitations and Microsegregation in Laser Additive Manufactured Nickel-Based Single-Crystal Superalloy. Materials 2020, 13, 2300. [Google Scholar] [CrossRef] [PubMed]
  17. Wang, X.M.; Liu, H.; Hui, Y.Z.; Yu, Z.Y.; Li, L.; Deng, C.H.; Yue, Z.F. Quantitative study of the microstructure evolution along the thickness direction in the nickel-based single crystal superalloy DD6 at 1323 K thermal exposure. Mater. Charact. 2019, 154, 285–293. [Google Scholar] [CrossRef]
  18. Milhet, X.; Arnoux, M.; Pelosin, V.; Colin, J. On the Dissolution of the γ′ Phase at the Dendritic Scale in a Rhenium-Containing Nickel-Based Single Crystal Superalloy After High Temperature Exposure. Metall. Mater. Trans. A 2013, 44, 2031–2040. [Google Scholar] [CrossRef]
  19. Jinbin, C.; Jingyang, C.; Xidong, H.; Qing, L.; Chengbo, X. Quantitative Characterization and Assessment of Served René N5 Ni-based Single Crystal Industrial Gas Turbine Blade. Rare Met. Mater. Eng. 2020, 49, 2207–2212. [Google Scholar]
  20. Guo, Z.; Huang, D.; Yan, X. Physics-Based Modeling of γ/γ Microstructure Evolution and Creep Constitutive Relation for Single Crystal Superalloy. Int. J. Plast. 2020, 137, 102916. [Google Scholar] [CrossRef]
  21. Guo, Z.X.; Qin, X.Y.; Huang, D.W.; Yan, X.J. Morphology Evolution and Probability Characteristic of γ’ Phase in Single Crystal Superalloy during Creep Rafting. Key Eng. Mater. 2019, 827, 373–378. [Google Scholar] [CrossRef]
  22. Ronneberger, O.; Fischer, P.; Brox, T. U-Net: Convolutional Networks for Biomedical Image Segmentation. In Proceedings of the International Conference on Medical Image Computing and Computer-Assisted Intervention, Munich, Germany, 5–9 October 2015. [Google Scholar]
  23. Schmidhuber, J. Deep Learning in Neural Networks: An Overview. Neural Netw. 2015, 61, 85–117. [Google Scholar] [CrossRef] [PubMed] [Green Version]
  24. Litjens, G.; Kooi, T.; Bejnordi, B.E.; Setio, A.A.A.; Ciompi, F.; Ghafoorian, M.; Van Der Laak, J.A.; Van Ginneken, B.; Sánchez, C.I. A Survey on Deep Learning in Medical Image Analysis. Med. Image Anal. 2017, 42, 60–88. [Google Scholar] [CrossRef] [PubMed] [Green Version]
  25. Wan, W.; Li, D.; Wang, H.; Zhao, L.; Shen, X.; Sun, D.; Chen, J.; Xiao, C. Automatic Identification and Quantitative Characterization of Primary Dendrite Microstructure Based on Machine Learning. Crystals 2021, 11, 1060. [Google Scholar] [CrossRef]
  26. Azimi, S.M.; Britz, D.; Engstler, M.; Fritz, M.; Mücklich, F. Advanced Steel Microstructural Classification by Deep Learning Methods. Sci. Rep. 2018, 8, 2128. [Google Scholar] [CrossRef]
  27. Chun, S.; Roy, S.; Nguyen, Y.T.; Choi, J.B.; Udaykumar, H.S.; Baek, S.S. Deep learning for synthetic microstructure generation in a materials-by-design framework for heterogeneous energetic materials. Sci. Rep. 2020, 10, 13307. [Google Scholar] [CrossRef] [PubMed]
Figure 1. Schematic diagrams of typical sectional positions of the single crystal blade. (a) Single crystal superalloy blades and selected sectional positions, S1–S5, are the selected sectional positions; (bf) are the corresponding sections of S1–S5, respectively.
Crystals 11 01399 g001
Figure 2. The collection area of the transverse section of the single crystal blade. The positions L, T, S, and P represent the area selected from leading edge, trailing edge, suction side, and pressure side, respectively.
Crystals 11 01399 g002
Figure 3. SEM images of γ’ phase in each section of single crystal blade. (ae) are the SEM images of the γ’ phase in the S1–S5 transverse section, respectively.
Crystals 11 01399 g003
Figure 4. The SEM image collection, identification extraction and quantitative statistical analysis process of γ’ phase in single crystal blades.
Crystals 11 01399 g004
Figure 5. Image segmentation network architecture.
Crystals 11 01399 g005
Figure 6. γ’ phase identification and extraction results, (a) is the original SEM image, (b) is the recognition result, the red feature is the γ’ phase, the green feature is the γ matrix, and the blue area is the unidentified interference.
Crystals 11 01399 g006
Figure 7. The γ’ phase size distribution in the 10 μm × 10 μm field of view.
Crystals 11 01399 g007
Figure 8. Typical positions selected for quantitative statistics of γ’ phase distribution.
Crystals 11 01399 g008
Figure 9. SEM image collection area and 3 typical locations. (a) The optical image of the single crystal blade, the red frame is the SEM image collection area (b) the SEM image corresponding to the position of the optical image, (c) Three typical positions determined based on optical images, where A, B and C correspond to primary dendrite arm, secondary dendrite arm and interdendrite, respectively.
Crystals 11 01399 g009
Figure 10. The SEM image of each typical region and the visualized image of the size of the γ’ phase. (a1c1) represent the original SEM images of primary dendrite arm, secondary dendrite arm and interdendrite, respectively, (a2c2) are the corresponding magnified images of the γ’ phase, (a3c3) are visual images of the size of the corresponding γ’ phase, respectively.
Crystals 11 01399 g010
Figure 11. The γ’ phase size distribution in the typical region of the single crystal blade section. (a) Primary dendrite arm, (b) Secondary dendrite arm, (c) Interdendrite.
Crystals 11 01399 g011
Figure 12. γ’ phase size all-view scene distribution and special position line distribution. (a) Original SEM image of full field of view (0.5 mm × 0.5 mm); (b) γ’ phase size distribution in the full field of view; (c) The line distribution of the γ’ phase corresponds to the line AB in (b). The blue star is the size of the γ’ phase at the primary dendrite arms, the black star is the size of the γ’ phase at the secondary dendrite arms, and the red star is the size of the γ’ phase between the dendrite arms.
Crystals 11 01399 g012
Figure 13. SEM images of γ/γ’ microstructures at leading edge, trailing edge, suction side and pressure side of transverse sections 1–5 of the blade.
Crystals 11 01399 g013
Figure 14. The size distribution of the γ’ microstructure at the leading edge, trailing edge, suction side and pressure side in the section S1–S5 of the single crystal blade.
Crystals 11 01399 g014
Figure 15. The γ’ phases of typical geometric shapes and their geometric factors. G A , G B and G C are the geometric factors of the γ’ phase corresponding to A, B, and C, respectively.
Crystals 11 01399 g015
Figure 16. The quantitative results of the characteristic parameters of the γ’ phase in the typical positions of the single crystal blade section S1–S5, and S1–S5 are the section positions. (a) Size, (b) Geometry factor.
Crystals 11 01399 g016
Table 1. DD5 single crystal blade design composition (wt/%).
CCrCoWAlTaMoHfBReNi
0.04–0.066.75–7.257.00–8.004.75–5.256.00–6.406.30–6.701.30–1.700.12–0.180.003–0.0052.75–3.25Bal.
Table 2. Statistical results of related parameters of γ’ phase in 10 μm × 10 μm field of view.
Area/μm2NumberAverage Size/μmArea Fraction/%Geometry Factor
58.163160.41560.341.15
Table 3. The average size of the γ’ phase extracted at different positions of the single crystal blade.
PositionPrime Dendrite ArmSecondary Dendrite ArmInterdendrite
Average Size (μm)0.270.290.32
Table 4. Area fraction of γ’ phase in all regions.
PositionLeading EdgeTrailing EdgeSuction SidePressure Side
S164.77%66.66%68.05%68.75%
S263.20%61.86%65.12%64.02%
S362.71%63.08%67.97%72.48%
S460.11%62.18%68.14%71.55%
S565.82%64.95%67.74%68.80%
Publisher’s Note: MDPI stays neutral with regard to jurisdictional claims in published maps and institutional affiliations.

