
Spectroscopic and Structural Properties of β-Tricalcium Phosphates Ca9RE(PO4)7 (RE = Nd, Gd, Dy)

 , and
, and 
Abstract
:1. Introduction
2. Experimental
3. Discussion
3.1. β–TCP Structural Arrangment
3.1.1. β-TCP and Related Phases
3.1.2. XRD Qualitative Analysis
3.1.3. Polyhedral Environment
3.1.4. Three-Dimensional Framework
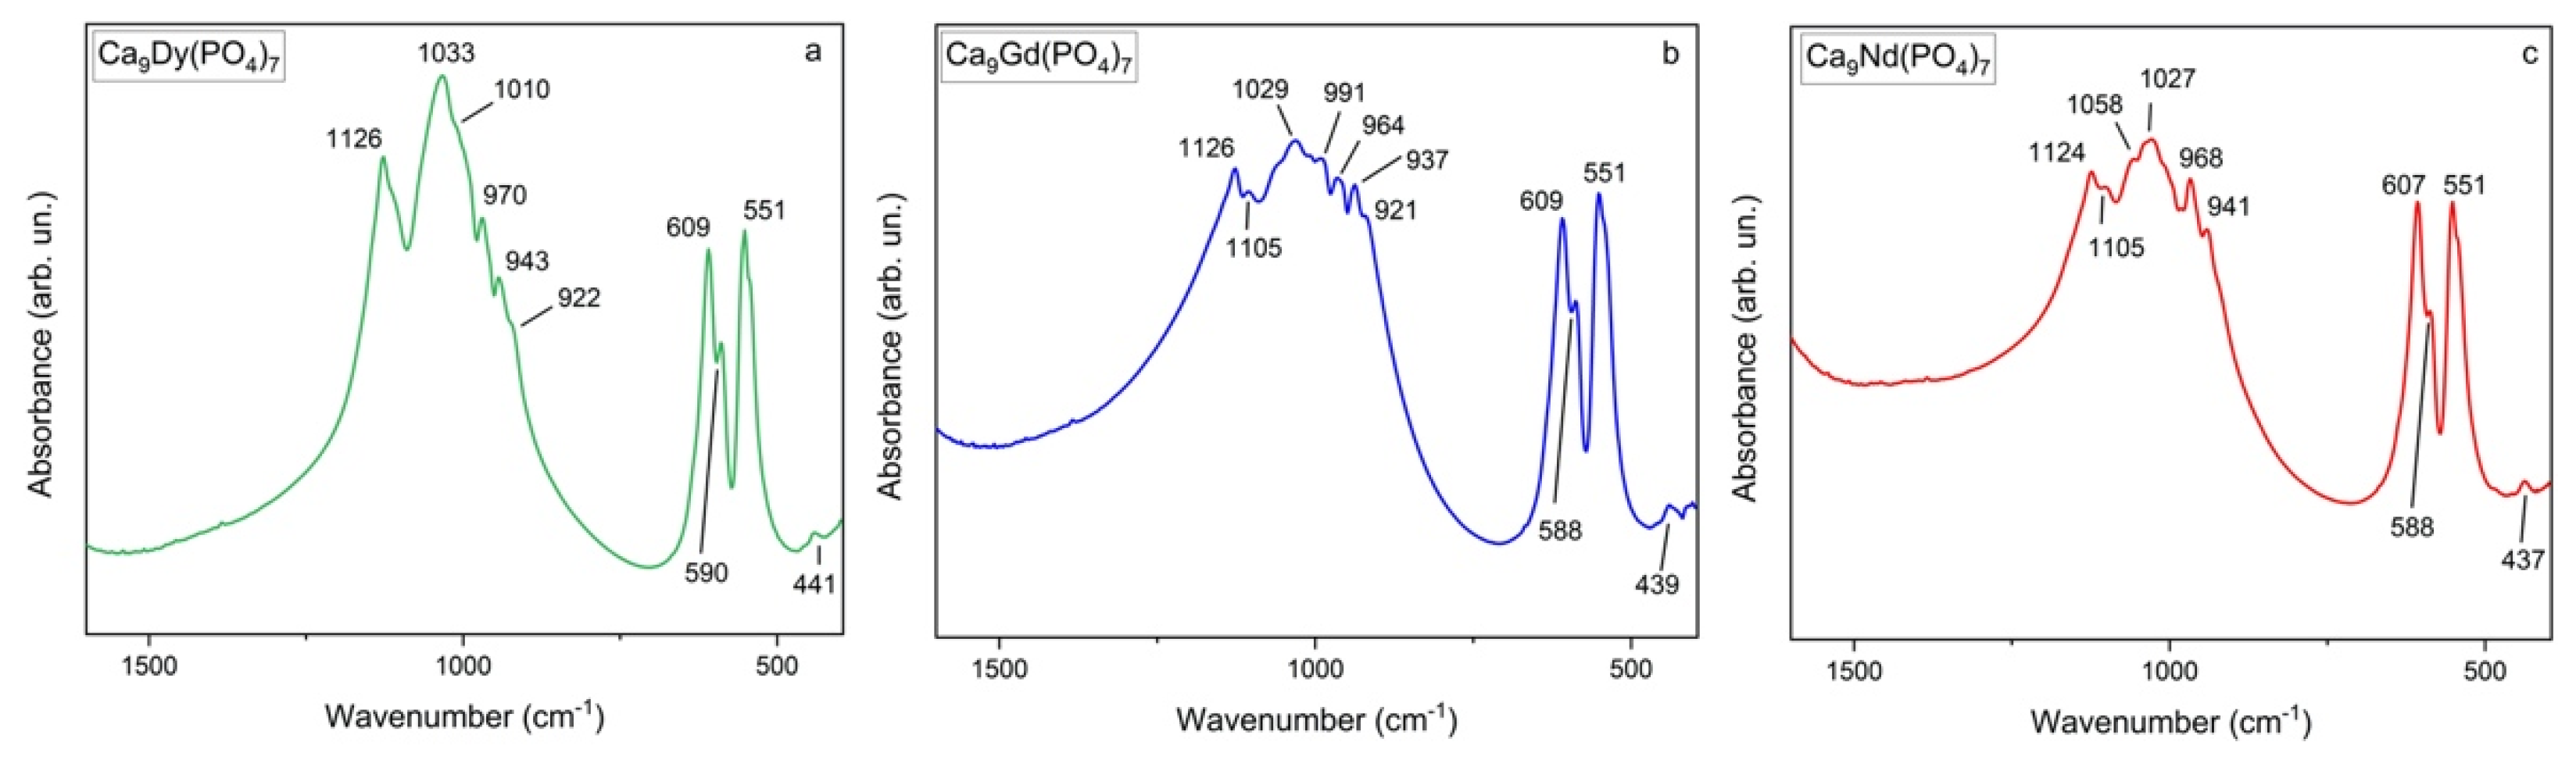
3.2. FTIR Spectroscopy
3.3. Photoluminescence Spectroscopy
3.3.1. Dy3+ TCP
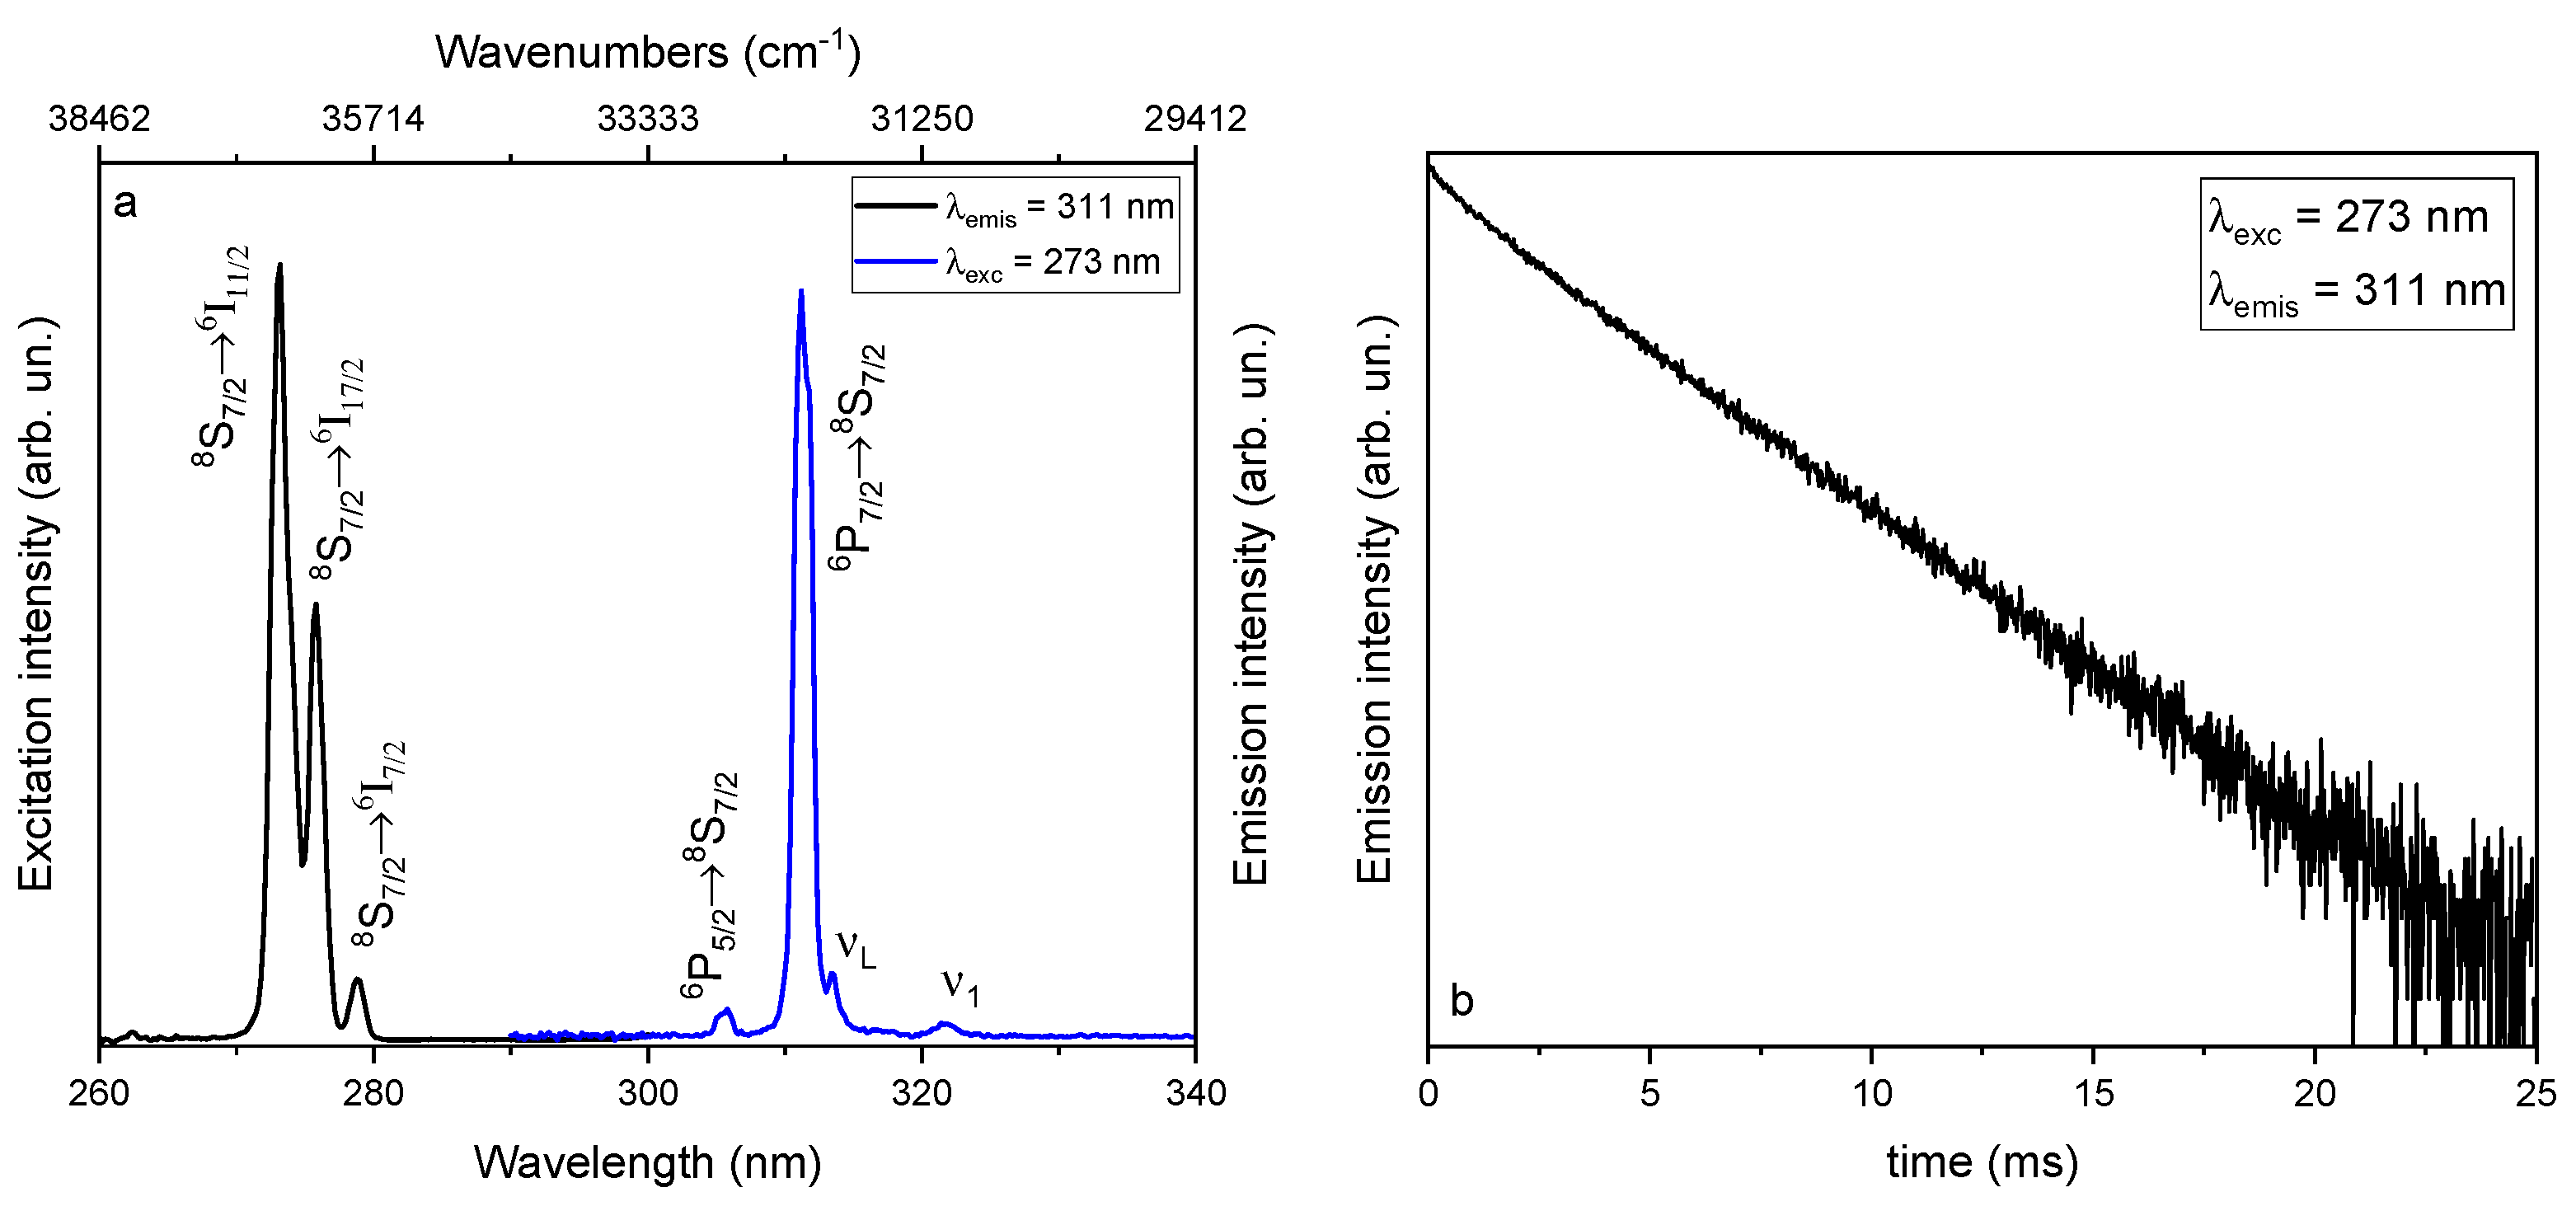
3.3.2. Gd3+ TCP
3.3.3. Nd3+ TCP
4. Conclusions
Author Contributions
Funding
Data Availability Statement
Acknowledgments
Conflicts of Interest
References
- Trevisani, M.; Ivanovskikh, K.V.; Piccinelli, F.; Speghini, A.; Bettinelli, M. Fast UV luminescence of Pr3+-doped calcium lutetium whitlockite. ECS Trans. 2012, 41, 11–17. [Google Scholar] [CrossRef]
- Piccinelli, F.; Trevisani, M.; Plaisier, J.R.; Bettinelli, M. Structural study of Yb3+, Eu3+ and Pr3+ doped Ca9Lu (PO4)7. J. Rare Earth 2015, 33, 977–982. [Google Scholar] [CrossRef]
- Carrasco, I.; Piccinelli, F.; Bettinelli, M. Optical spectroscopy of Ca9Tb1−xEux(PO4)7 (x = 0, 0.1, 1): Weak donor energy migration in the whitlockite structure. J. Phys. Chem. C. 2017, 121, 16943–16950. [Google Scholar] [CrossRef]
- Trevisani, M.; Ivanovskikh, K.V.; Piccinelli, F.; Speghini, A.; Bettinelli, M. Interconfigurational 5d→4f luminescence of Ce3+ and Pr3+ in Ca9Lu (PO4)7. J. Phys. Condens. Matter 2012, 24, 385502. [Google Scholar] [CrossRef]
- Watras, A.; Carrasco, I.; Pazik, R.; Wiglusz, R.J.; Piccinelli, F.; Bettinelli, M.; Deren, P.J. Structural and spectroscopic features of Ca9M(PO4)7 (M = Al3+, Lu3+) whitlockites doped with Pr3+ ions. J. Alloy. Compd. 2016, 672, 45–51. [Google Scholar] [CrossRef]
- El Khouri, A.; Elaatmani, M.; Della Ventura, G.; Sodo, A.; Rizzi, R.; Rossi, M.; Capitelli, F. Synthesis, structure refinement and vibrational spectroscopy of new rare-earth tricalcium phosphates Ca9RE(PO4)7 (RE = La, Pr, Nd, Eu, Gd, Dy, Tm, Yb). Ceram. Int. 2017, 43, 15645–15653. [Google Scholar] [CrossRef]
- Dikhtyar, Y.Y.; Deyneko, D.V.; Boldyrev, K.N.; Borovikova, E.Y.; Lipatiev, A.S.; Stefanovich, S.Y.; Lazoryak, B.I. Luminescent properties of Er3+ in centrosymmetric and acentric phosphates Ca8Mer (PO4)7 (M = Ca, Mg, Zn) and Ca9-xZnxLa (PO4)7:Er3+. Mater. Res. Bull. 2021, 138, 111244. [Google Scholar] [CrossRef]
- Lira, A.; Speghini, A.; Camarillo, E.; Bettinelli, M.; Caldiño, U. Spectroscopic evaluation of Zn(PO3)2:Dy3+ glass as an active medium for solid state yellow laser. Opt. Mater. 2014, 38, 188–192. [Google Scholar]
- Chemingui, S.; Ferhi, M.; Horchani-Naifer, K.; Ferid, M. Synthesis and luminescence characteristics of Dy3+ doped KLa(PO3)4. J. Lumin. 2015, 166, 82–87. [Google Scholar] [CrossRef] [Green Version]
- Kim, E.J.; Choi, S.W.; Hong, S.H. Synthesis and photoluminescence properties of Eu3+-doped calcium phosphates. J. Am. Ceram. Soc. 2007, 90, 2795–2798. [Google Scholar] [CrossRef]
- Malik, C.; Kaur, N.; Singh, B.; Pandey, A. Luminescence properties of tricalcium phosphate doped with dysprosium. Appl. Radiat. Isot. 2020, 158, 109062. [Google Scholar] [CrossRef] [PubMed]
- Madhukumar, K.; Varma, H.K.; Komath, M.; Elias, T.S.; Padmanabhan, V.; Nair, C.M.H. Photoluminescence and thermoluminescence properties of tricalcium phosphate phosphors doped with dysprosium and europium. Bull. Mater. Sci. 2007, 30, 527–534. [Google Scholar] [CrossRef]
- Ait Benhamou, R.; Bessière, A.; Wallez, G.; Viana, B.; Elaatmani, M.; Daoud, M.; Zegzouti, A. New insight in the structure—Luminescence relationships of Ca9Eu(PO4)7. J. Sol. State Chem. 2009, 182, 2319–2325. [Google Scholar] [CrossRef]
- Meenambal, R.; Nandha Kumar, P.; Poojar, P.; Geethanath, S.; Kannan, S. Simultaneous substitutions of Gd3+ and Dy3+ in β-Ca3(PO4)2 as a potential multifunctional bio-probe. Mater. Des. 2017, 120, 336–344. [Google Scholar] [CrossRef]
- Meenambal, R.; Poojar, P.; Geethanath, S.; Kannan, S. Structural insights in Dy3+-doped β-Tricalcium phosphate and its multimodal imaging characteristics. J. Am. Ceram. Soc. 2017, 100, 1831–1841. [Google Scholar] [CrossRef]
- Ellens, A.; Salemink, B.; Meijerink, A.; Blasse, G. Study of the vibronic transitions of Gd3+ and Eu3+ in crystalline materials and glasses of the same composition. J. Sol. State Chem. 1998, 136, 206–209. [Google Scholar] [CrossRef]
- Sola, D.; Balda, R.; Peña, J.; Fernández, J. Site-selective laser spectroscopy of Nd3+ ions in 0.8CaSiO3-0.2Ca3(PO4)2 biocompatible eutectic glass-ceramics. Opt. Express 2012, 20, 10701–10711. [Google Scholar] [CrossRef] [PubMed] [Green Version]
- Lecointre, A.; Bessière, A.; Viana, B.; Aït Benhamou, R.; Gourier, D. Thermally stimulated luminescence of Ca3(PO4)2 and Ca9Ln(PO4)7 (Ln = Pr, Eu, Tb, Dy, Ho, Er, Lu). Radiat. Meas. 2010, 45, 273–276. [Google Scholar] [CrossRef]
- Horiba Jobin Yvon DAS6 Fluorescence Decay Analysis Software User Guide, version 2744.F.; Horiba Jobin Yvon SAS: Edison, NJ, USA, 2008; pp. 29–31.
- Yashima, M.; Sakai, A.; Kamiyama, T.; Hoshikawa, A. Crystal structure analysis of β-tricalcium phosphate Ca3(PO4)2 by neutron powder diffraction. J. Sol. State Chem. 2003, 175, 272–277. [Google Scholar] [CrossRef]
- Mathew, M.; Schroeder, L.W.; Dickens, B.; Brown, W.E. Crystal Structure of α-Ca3(PO4)2. Acta Crystallogr. B 1977, 33, 1325–1333. [Google Scholar] [CrossRef]
- Capitelli, F.; Bosi, F.; Capelli, S.; Radica, F.; Della Ventura, G. Neutron and XRD single-crystal diffraction study and vibrational properties of whitlockite, the natural counterpart of synthetic tricalcium phosphate. Crystals 2021, 11, 225. [Google Scholar] [CrossRef]
- Zhai, S.; Kanzaki, M.; Katsura, T.; Ito, E. Synthesis and characterization of strontium-calcium phosphate γ-Ca3-xSrx(PO4)2 (0 ≤ x ≤ 2). Mater. Chem. Phys. 2010, 120, 348–350. [Google Scholar] [CrossRef]
- Xie, X.D.; Gu, X.P.; Chen, M. An occurrence of tuite, gamma-Ca3(PO4)2, partly transformed from Ca-phosphates in the Suizhou meteorite. Meteorit. Planet. Sci. 2016, 51, 195–202. [Google Scholar] [CrossRef]
- The Powder Diffraction File; International Center for Diffraction Data: Newton Square, PA, USA, 2003.
- Spedding, F.H. Lanthanide Contraction; McGraw-Hill Education: New York, NY, USA, 2020. [Google Scholar]
- Ni, Y.-X.; Hughes, J.M.; Mariano, A.N. Crystal chemistry of the monazite and xenotime structures. Am. Mineral. 1995, 80, 21–26. [Google Scholar] [CrossRef]
- Tahiri, A.A.; El Bali, B.; Lachkar, M.; Piniella, J.F.; Capitelli, F. Crystal structure of new lanthanide diphosphates KLnP2O7·2(H2O) (Ln = Gd, Tb, Yb). Z. Kristallogr. 2006, 221, 173–177. [Google Scholar] [CrossRef]
- Capitelli, F.; El Bali, B.; Essehli, R.; Lachkar, M.; Da Silva, I. New hybrid diphosphates Ln2(NH2(CH2)2NH2)2(HP2O7)2⋅4H2O (Ln = Eu, Tb, Er): Synthesis, single crystal and powder X-ray crystal structure. Z. Kristallogr. 2006, 221, 788–794. [Google Scholar] [CrossRef]
- Zhang, S.; Li, Y.; Lv, Y.; Fan, L.; Hu, Y.; He, M. A full-color emitting phosphor Ca9Ce(PO4)7:Mn2+, Tb3+: Efficient energy transfer, stable thermal stability and high quantum efficiency. Chem. Eng. J. 2017, 322, 314–327. [Google Scholar] [CrossRef]
- Capitelli, F.; Rossi, M.; El Khouri, A.; Elaatmani, M.; Corriero, N.; Sodo, A.; Della Ventura, G. Synthesis, structural model and vibrational spectroscopy of lutetium tricalcium phosphate Ca9Lu(PO4)7. J. Rare Earths 2018, 36, 1162–1168. [Google Scholar] [CrossRef]
- Rizzi, R.; Capitelli, F.; Lazoryak, B.I.; Morozov, V.A.; Piccinelli, F.; Altomare, A. A comprehensive study on Ca9Tb(PO4)7 and Ca9Ho(PO4)7 doped β-tricalcium phosphates: Ab-initio crystal structure solution, Rietveld analysis and dielectric properties. Cryst. Growth Des. 2021, 21, 2263–2276. [Google Scholar] [CrossRef]
- Brown, I.D.; Altermatt, D. Bond-valence parameters obtained from a systematic analysis of the Inorganic Crystal Structure Database. Acta Crystallogr. B 1985, 41, 244–247. [Google Scholar] [CrossRef] [Green Version]
- Inorganic Crystal Structure Database (ICSD), version 2018–2; Fachinformationszentrum: Karlsruhe, Germany, 2018.
- El Bali, B.; Capitelli, F.; Alaoui, A.T.; Lachkar, M.; da Silva, I.; Alvarez-Larena, A.; Piniella, J.F. New thallium diphosphates Tl2Me(H2P2O7)2·2H2O, Me = Mg, Mn, Co, Ni and Zn. Synthesis, single crystal X-ray structures and powder X-ray structure of the Mg phase. Z. Kristallogr. 2008, 223, 448–455. [Google Scholar] [CrossRef]
- Capitelli, F.; Harcharras, M.; Assaaoudi, H.; Ennaciri, A.; Moliterni, A.G.G.; Bertolasi, V. Crystal structure of new hexahydrate dicobalt pyrophosphate Co2P2O7·6H2O: Comparison with Co2P2O7·2H2O, α-, β- and γ- Co2P2O7. Z. Kristallogr. 2003, 218, 345–350. [Google Scholar] [CrossRef]
- Capitelli, F.; Khaoulaf, R.; Harcharras, M.; Ennaciri, A.; Habyby, S.H.; Valentini, V.; Mattei, G.; Bertolasi, V. Crystal structure and vibrational spectroscopy of the new acidic diphosphate (NH4)2Zn(H2P2O7)2⋅2H2O. Z. Kristallogr. 2005, 220, 25–30. [Google Scholar] [CrossRef]
- Shannon, R.D. Revised effective ionic radii and systematic studies of interatomic distances in halides and chalcogenides. Acta Crystallogr. A 1976, 32, 751. [Google Scholar] [CrossRef]
- Carnall, W.T.; Fields, P.R.; Rajnak, K. Electronic energy levels in the trivalent lanthanide aquo ions. I. Pr3+, Nd3+, Pm3+, Sm3+, Dy3+, Ho3+, Er3+, and Tm3+. J. Chem. Phys. 1968, 49, 4424–4442. [Google Scholar] [CrossRef]
- Cao, C.; Yang, H.K.; Chung, J.W.; Moon, B.K.; Choi, B.C.; Jeong, J.H.; Kim, K.H. Hydrothermal synthesis and white luminescence of Dy3+-doped NaYF4 microcrystals. J. Am. Ceram. Soc. 2011, 94, 3405–3411. [Google Scholar] [CrossRef]
- Sun, J.; Cui, D. Synthesis, structure, and thermally stable luminescence of Dy3+-doped Na3YSi2O7 host compound. J. Am. Ceram. Soc. 2014, 97, 843–847. [Google Scholar] [CrossRef]
- Cavalli, E.; Bettinelli, M.; Belletti, A.; Speghini, A. Optical spectra of yttrium phosphate and yttrium vanadate single crystlas activated with Dy3+. J. All. Compd. 2002, 341, 107–110. [Google Scholar] [CrossRef]
- Jayasimhadri, M.; Ratnam, B.V.; Jang, K.; Lee, H.S.; Chen, B.; Yi, S.-S.; Jeong, J.-H.; Moorth, L.R. Greenish-yellow emission from Dy3+-doped Y2O3 nanophosphors. J. Am. Ceram. Soc. 2010, 93, 494–499. [Google Scholar] [CrossRef]
- Carnall, W.T.; Crosswhite, H.; Crosswhite, H.M. Energy Level Structure and Transition Probabilities in the Spectra of the Trivalent Lanthanides in LaF₃; Argonne National Lab: Argonne, IL, USA, 1978.
- Blasse, G.; Dirksen, G.J. Luminescence of Eu(III) in (NH4)3YCl6: Nonradiative transitions induced by the second coordination sphere. J. Sol. State Chem. 1992, 96, 258–262. [Google Scholar] [CrossRef]
- Blasse, G.; Brixner, L.H.; Mroczkowski, S. The electronic and vibronic transitions in the emission spectrum of Gd3+ in the yttrium hydroxide structure. J. Sol. State Chem. 1989, 82, 303–306. [Google Scholar] [CrossRef]
- Sytsma, J.; van Schaik, W.; Blasse, B. Vibronic transitions in the emission spectra of Gd3+ in several rare-earth compounds. J. Phys. Chem. Solids 1991, 52, 419–429. [Google Scholar] [CrossRef]
- Brixner, L.H.; Crawford, M.K.; Blasse, G. Optical luminescence of electronic and vibronic transitions in Gd2−xYx(SO4)3·8H2O. J. Sol. State Chem. 1990, 85, 1–7. [Google Scholar] [CrossRef]
- Nash, K.L.; Dennis, R.C.; Gruber, J.B.; Sardar, D.K. Intensity analysis and energy-level modelling of Nd3+ in Nd3+:Y2O3 nanocrystals in polymeric hosts. J. Appl. Phys. 2009, 105, 033102. [Google Scholar] [CrossRef]
- Kindrat, I.I.; Padlyak, B.V.; Lisiecki, R.; Adamiv, V.T. Spectroscopic and luminescent properties of the lithium tetraborate glass co-doped with Nd and Ag. J. Alloys Compd. 2021, 853, 157321. [Google Scholar] [CrossRef]
- Moorthy, L.R.; Rao, T.S.; Jayasimhadri, M.; Radhapathy, A.; Murthy, D.V.R. Spectroscopic investigations of Nd3+-doped alkali chloroborophosphate glasses. Spectrochim. Acta A Mol. Biomol. Spectrosc. 2004, 60, 2449–2458. [Google Scholar] [CrossRef]


Publisher’s Note: MDPI stays neutral with regard to jurisdictional claims in published maps and institutional affiliations. |
© 2021 by the authors. Licensee MDPI, Basel, Switzerland. This article is an open access article distributed under the terms and conditions of the Creative Commons Attribution (CC BY) license (https://creativecommons.org/licenses/by/4.0/).
Share and Cite
Paterlini, V.; El Khouri, A.; Bettinelli, M.; Trucchi, D.M.; Capitelli, F. Spectroscopic and Structural Properties of β-Tricalcium Phosphates Ca9RE(PO4)7 (RE = Nd, Gd, Dy). Crystals 2021, 11, 1269. https://doi.org/10.3390/cryst11101269
Paterlini V, El Khouri A, Bettinelli M, Trucchi DM, Capitelli F. Spectroscopic and Structural Properties of β-Tricalcium Phosphates Ca9RE(PO4)7 (RE = Nd, Gd, Dy). Crystals. 2021; 11(10):1269. https://doi.org/10.3390/cryst11101269
Chicago/Turabian StylePaterlini, Veronica, Asmaa El Khouri, Marco Bettinelli, Daniele Maria Trucchi, and Francesco Capitelli. 2021. "Spectroscopic and Structural Properties of β-Tricalcium Phosphates Ca9RE(PO4)7 (RE = Nd, Gd, Dy)" Crystals 11, no. 10: 1269. https://doi.org/10.3390/cryst11101269