1. Introduction
Ibuprofen (IBU) is a widely used anti-inflammatory drug. Actually, it is a 50–50 mixture of two enantiomers, R and S, forming a racemic compound, with different pharmaceutical effects. In order to achieve the best activity with the lowest side effects, it is desirable to separate these two enantiomers. The separation of R and S can be performed using a chiral amine, such as the S-α-methylbenzylamine (S-αMBA) in ethanol [
1,
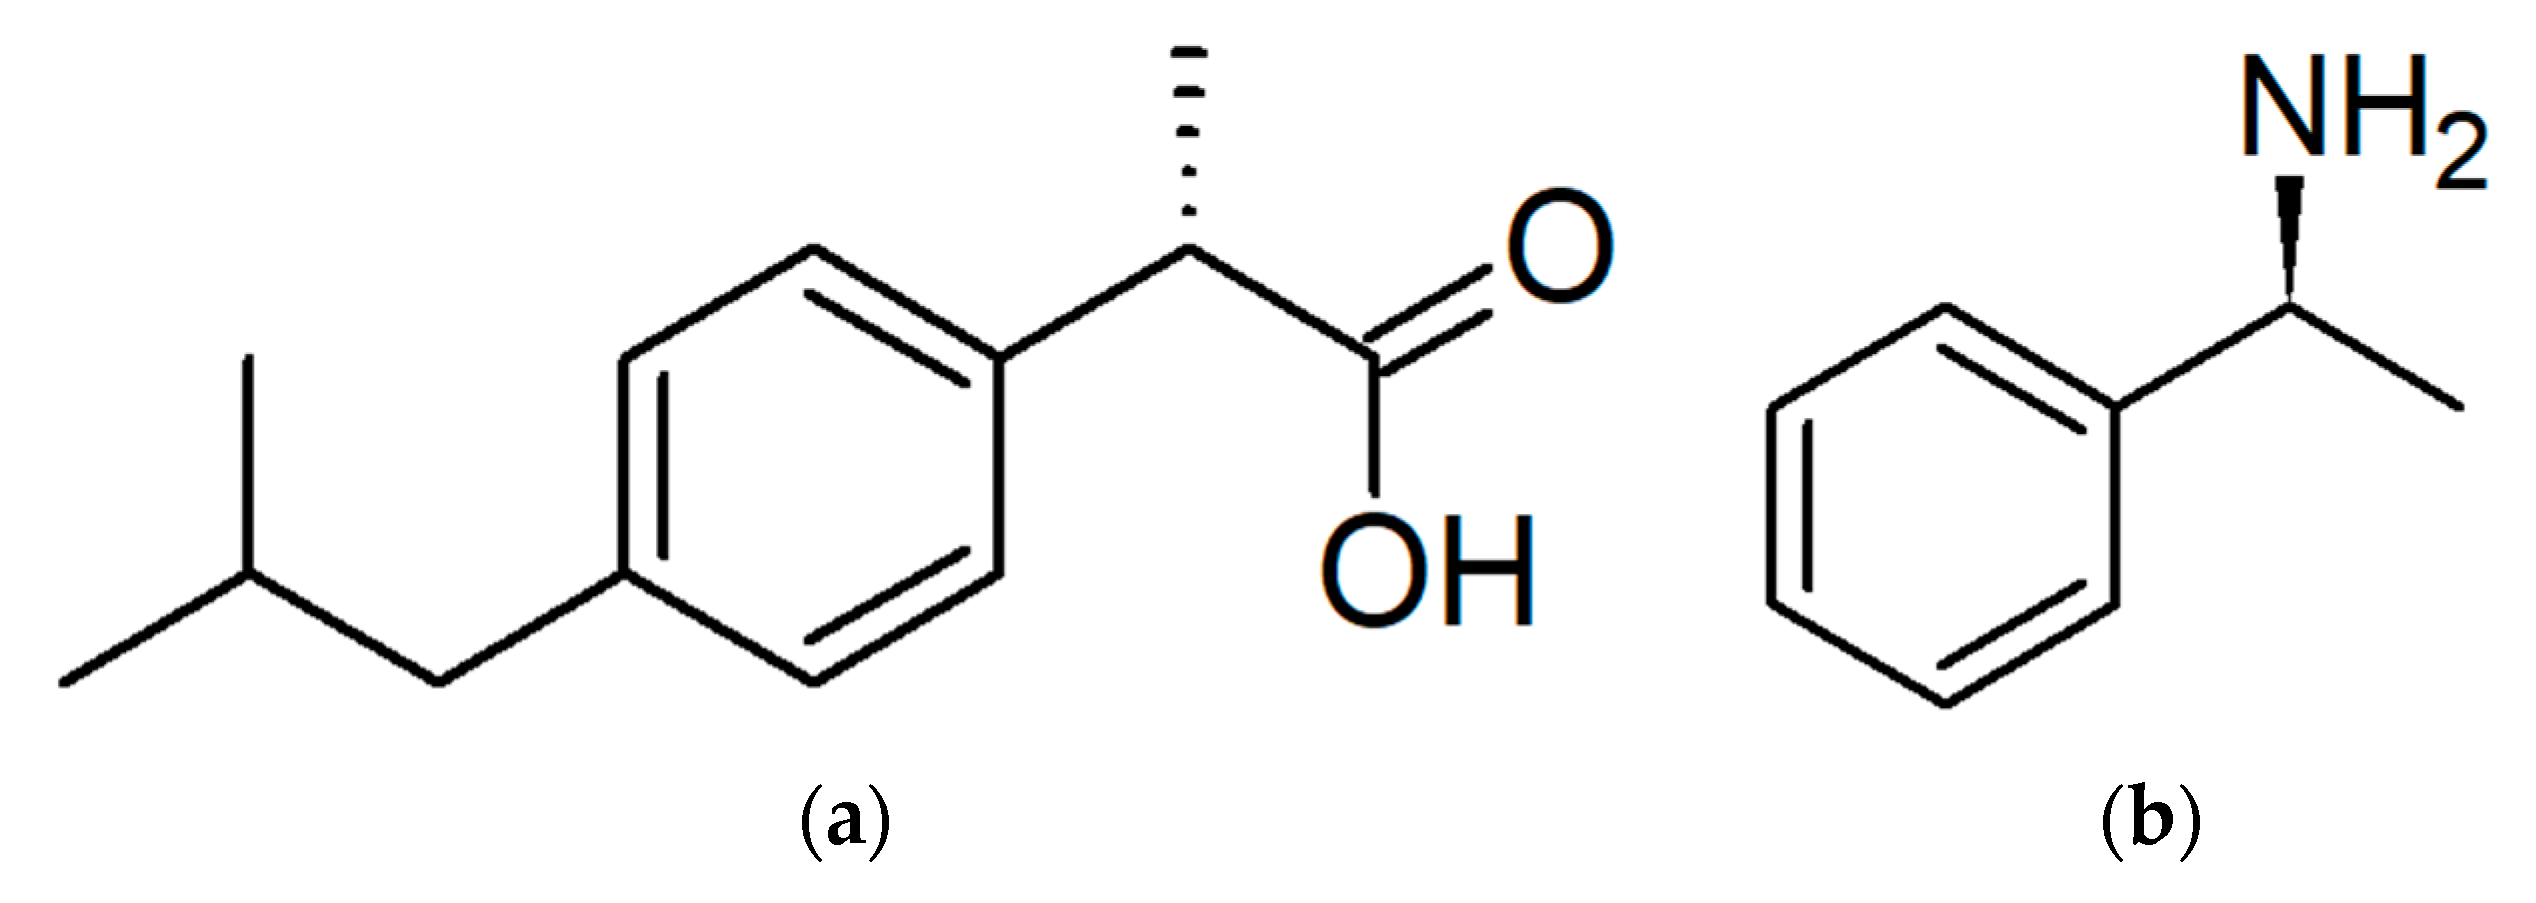
2]. The structural formula of S-IBU and S-αMBA is depicted in
Figure 1. In order to limit the consumption of resolving agent, a part of it can be substituted by soda.
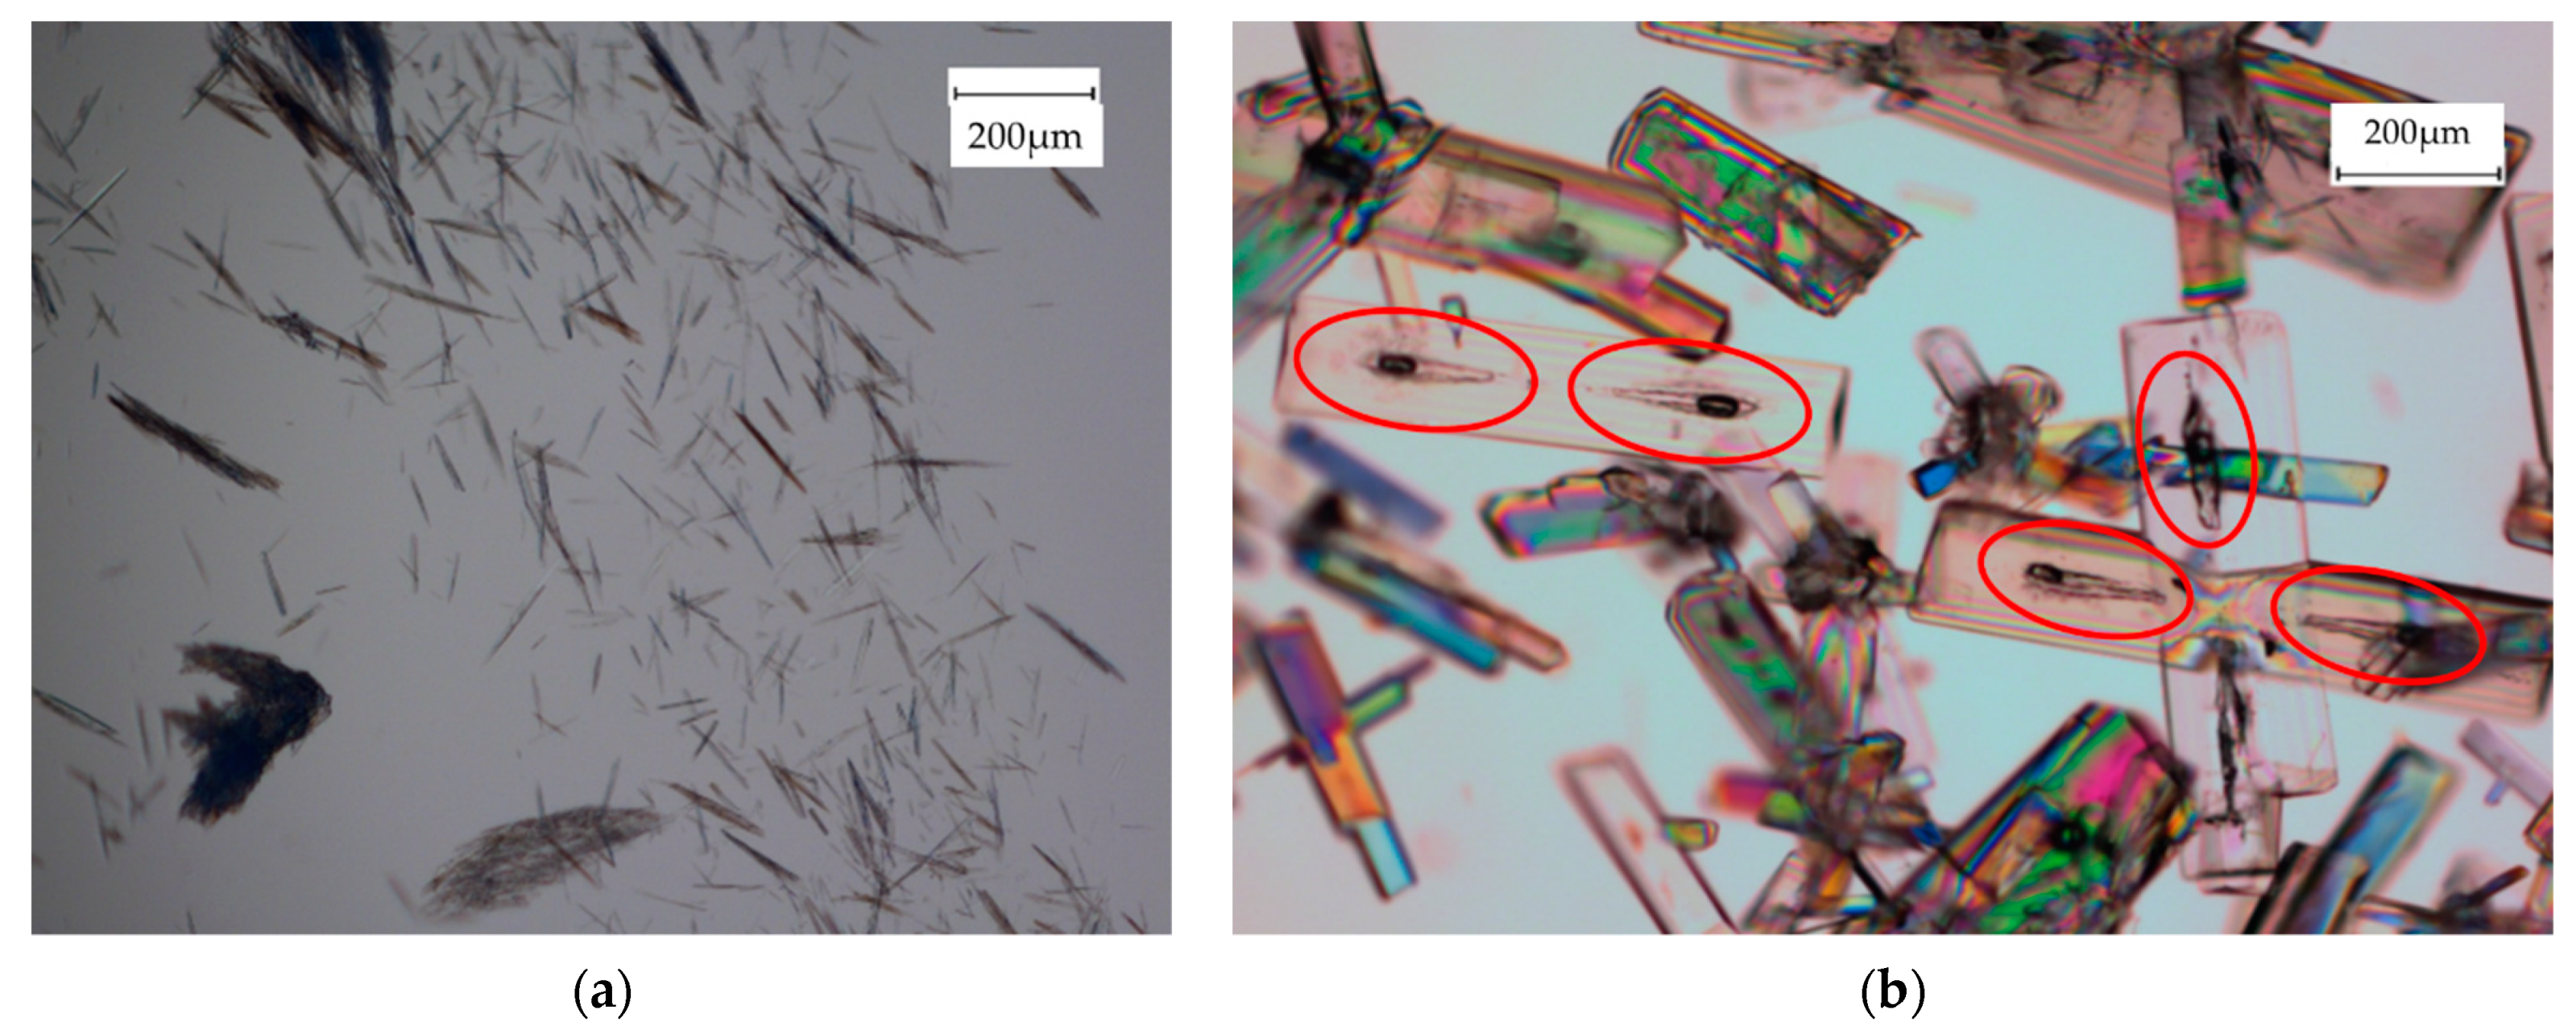
The process, called Pasteurian resolution of (±) (IBU), consists of a selective crystallization of S-IBU/S-αMBA in ethanol out of an equimolar mixture of S-IBU/S-αMBA and R-IBU/S-αMBA. This less soluble salt containing the desired drug crystallizes as very fine needles (
Figure 2a). This is not convenient for the filtration, storage and flow-ability of the solid particles. Moreover, accumulation of electrostatic charges on large quantities can lead to safety issues. To resolve those problems, different pharmaceutically acceptable additives, which could act as habit modifiers, were tried. Water appeared to be the simplest and the safest, transforming the very fine needles into platelets (
Figure 2b). Nevertheless, this elegant solution creates another problem since large fluid inclusions in crystals are frequent. Moreover, the partial substitution of S-αMBA by NaOH in the medium increases the occurrence of fluid inclusions.
Usually, the observation of reproducible fluid inclusions results from a too high crystal growth rate as soon as the crystals exceed a threshold in size [
3,
4,
5,
6,
7]. However, other mechanisms have been proposed [
8,
9,
10]. They can also produce a symmetrical pattern; this pattern can be solvent-dependent [
11]. Conversely for the same compound, by using different conditions of growth, it could be completely irregular [
12,
13], with inclusion having a curved-tube shape known as ‘necking’. Nevertheless, in the present case, there are roughly two symmetrical vacuoles located at both ends of the particle; they are filled with the saturated mother liquor and a bubble of gas. This is in contrast with other cases for which fluid inclusions are repeated along a given crystallographic axis [
6,
14].
In order to minimize the problem of fluid inclusion, the effect of gas dissolved in the mother liquor has to be investigated. CO
2 warranted special attention because its solubility is much greater than that of the other gases and literature shows several examples of its importance in the formation of fluid inclusions [
15,
16].
The presence of gas bubbles in fluid inclusions could result from two different mechanisms:
- Type I:
When a crystal with a mother liquor inclusion is cooled down, the solubility (being presumed normal) decreases, and thus leads to crystallization on the inner wall of the cavity. The density of the crystal being usually greater than that of the mother liquor, there is a deficit in volume which induces the nucleation of a bubble of gas. This is called a retreat bubble; the nucleation of that bubble of gas sometimes requires quite a long period of time [
17]. If the cooling is fast, several bubbles of gas could nucleate simultaneously, but usually after a while, only the largest one survives because of the Laplace–Young equation: ΔP = 2γ/R. In this equation, R is the radius of the gas bubble, γ is the surface tension and ΔP is the difference of pressure between the interior and the exterior of the bubble of gas [
18].
- Type II:
When a crystal is growing, there is a local heat release. This brings about a local drop in solubility of gases dissolved in the solution (indeed, they all have a retrograde solubility). If the surface is rough, nucleation of micro or even nano bubbles of gas is facilitated [
19]. When the cavity is finally closed up, these bubbles of gas are trapped. A variant of that mechanism is when, by accident, a crystal is growing and comes into contact with an already existing bubble of gas; it can incorporate that sphere with or without mother liquor around. The probability of that latter event decreases when the suspension is stirred.
The aims of that study are (i) to spot the origin of fairly poor results in terms of diastereomeric excess after the first resolution step and (ii) to understand the formation of those vacuoles, to find possible remedies for those drawbacks.
2. Materials and Methods
2.1. Optical Microscopy
Photographs were taken with a Nikon Eclipse LV100 optical, equipped with a Nikon Digital sight DS-Ri1 camera, or with a Nikon SMZ-10A binocular optical microscope equipped with a Sony Power HAD camera. Both microscopes possess a pair of cross polarizers. The software used to exploit the results is Nikon NIS Elements D V3.1.
To perform temperature-regulated microscopy, a hot/cold stage chamber Linkam THMS 600 was used.
2.2. Scanning Electron Microscopy (SEM)
SEM photographs were taken with an SEM JEOL JCM 5000 NeoScope Secondary Electron imaging; high resolution and large depth of field; magnification from ×10 up to ×40,000; high vacuum mode engaged; accelerating voltages of 10 kV).
Samples were prepared as follows: the powder samples were stuck on analysing plots using conductive adhesives and then received a gold coating in order to reduce the charge accumulations during the observation using a NeoCoater MP-19020NCTR.
2.3. Differential Scanning Calorimetry (DSC)
DSC measurements were performed on a Netzsch DSC 214 Polyma apparatus equipped with an intracooler and purged by nitrogen. Samples were weighed in 25-μL aluminum pans. The software used to exploit the results is Netzsch Proteus Analysis.
2.4. Chiral High-Performance Liquid Chromatography (HPLC)
Chiral HPLC analyses were done on a Thermo Scientific Ultimate 3000 system (Pump, Autosampler, RS variable wavelength detector), with a column Daicel Chiralcel OD-H 5 µm 250–4.6 mm and the following conditions:
Samples were dissolved in the mobile phase. The software used to exploit the results is the Thermo Scientific Dionex Chromeleon 6.8 Chromatography Data System system.
2.5. X-ray Powder Diffraction (XRPD)
XRPD measurements were carried out on a Bruker D8 Discover apparatus using the Cu Kα radiation (1.54 Å). The samples were scanned from 3 to 30° 2θ angles, with a 0.02° step (2 s duration). The detector slit was set at 0.2 mm. The analyses were done using quartz as internal standard. The software used to exploit the results is Bruker DIFFRAC.EVA V4.1.
2.6. Single-Crystal—X-ray Diffraction (SC-XRD)
The crystal structures were determined from single-crystal diffraction on a Bruker SMART diffractometer equipped with an APEX detector (with Mo Kα1 radiation: λ = 0.71073 Å). The cell parameters and the orientation matrix of the crystal were preliminarily determined using SMART Software (Bruker). Data integration and global cell refinement were performed with SAINT Software, (Bruker). The structures were solved by direct methods (SHEL-XS). Anisotropic displacement parameters were refined for all non-hydrogen atoms using SHEL-XL available with the WinGX package [
20].
2.7. Material Studio
Lattice parameters were obtained with Biovia Material Studio 2019 (19.1.0.2353) [
21].
2.8. Materials
(±) IBU has been supply by Pharmadev (CH), (+) IBU by Acros Organics, (S) α-MBA by Acros Orgnaics, technical and HPLC Ethanol by VWR.
2.9. Resolution Experiments Set Up
Resolution experiments were performed in a stirred, double-jacketed wall reactor with temperature regulated by a programmable thermostat Lauda Eco Silver RE415.
3. Results
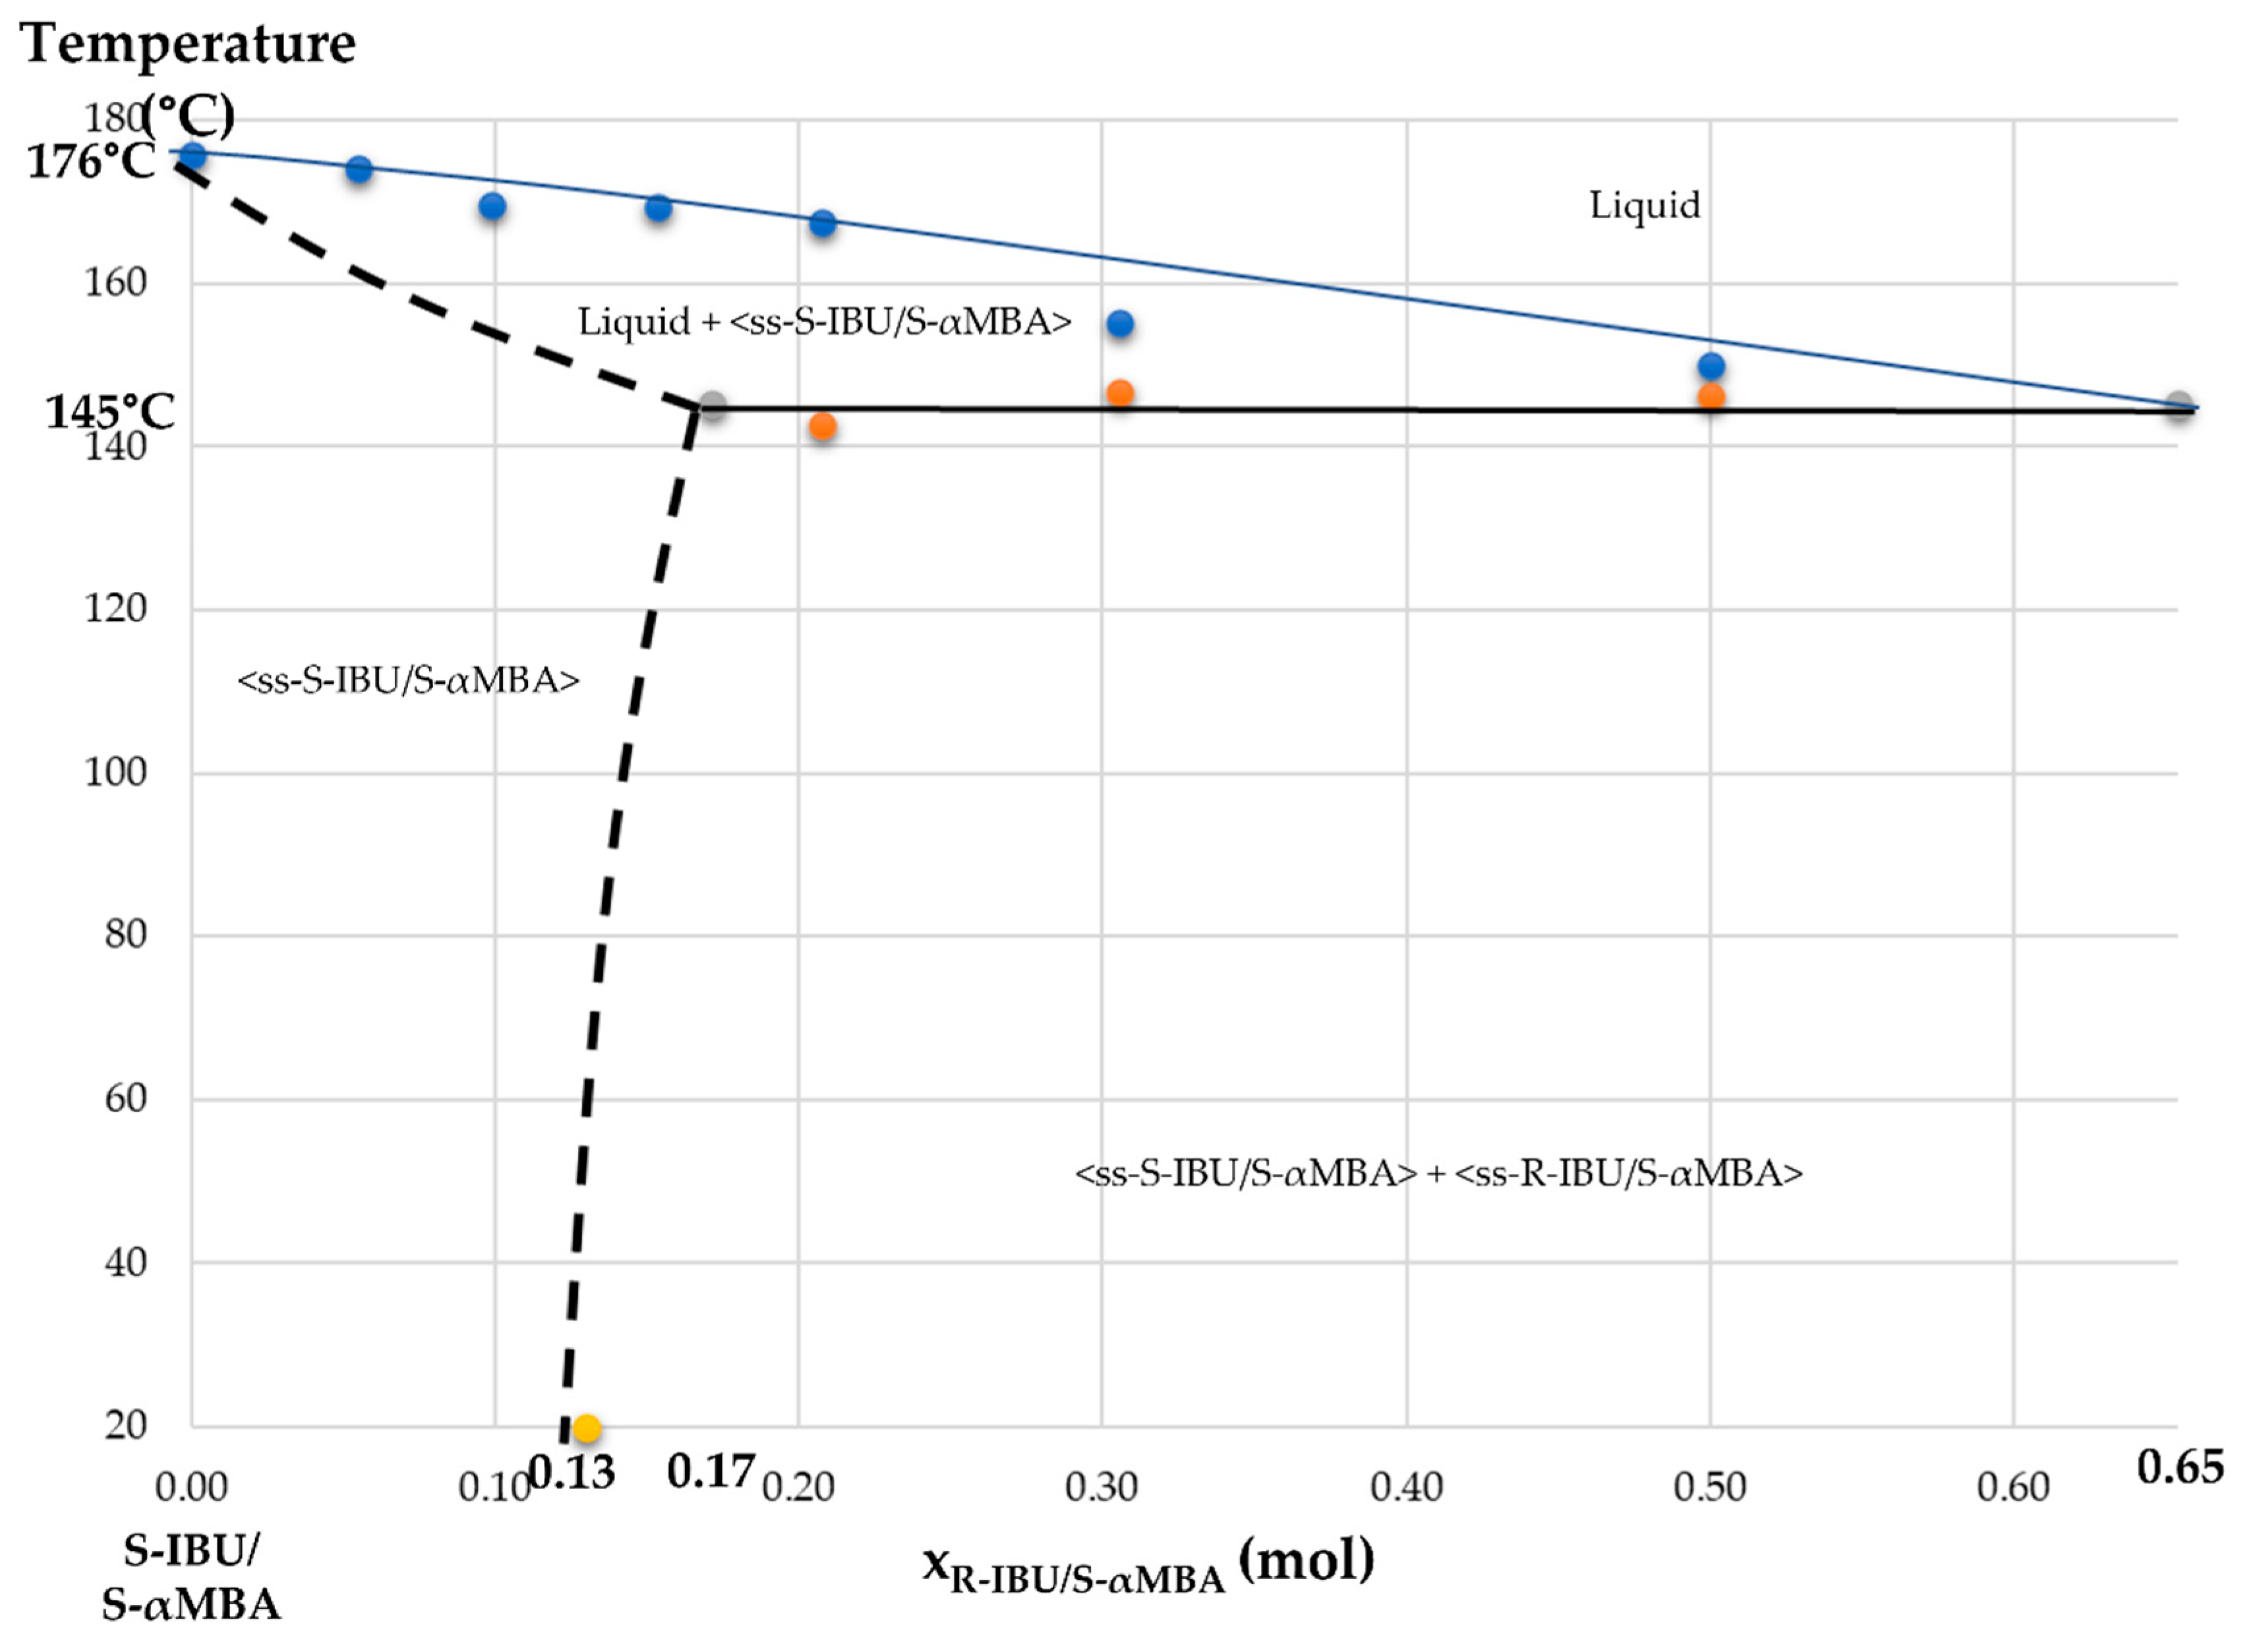
3.1. Revised Binary System between S-IBU/S-αMBA and R-IBU/S-αMBA
According to Ebbers et al. [
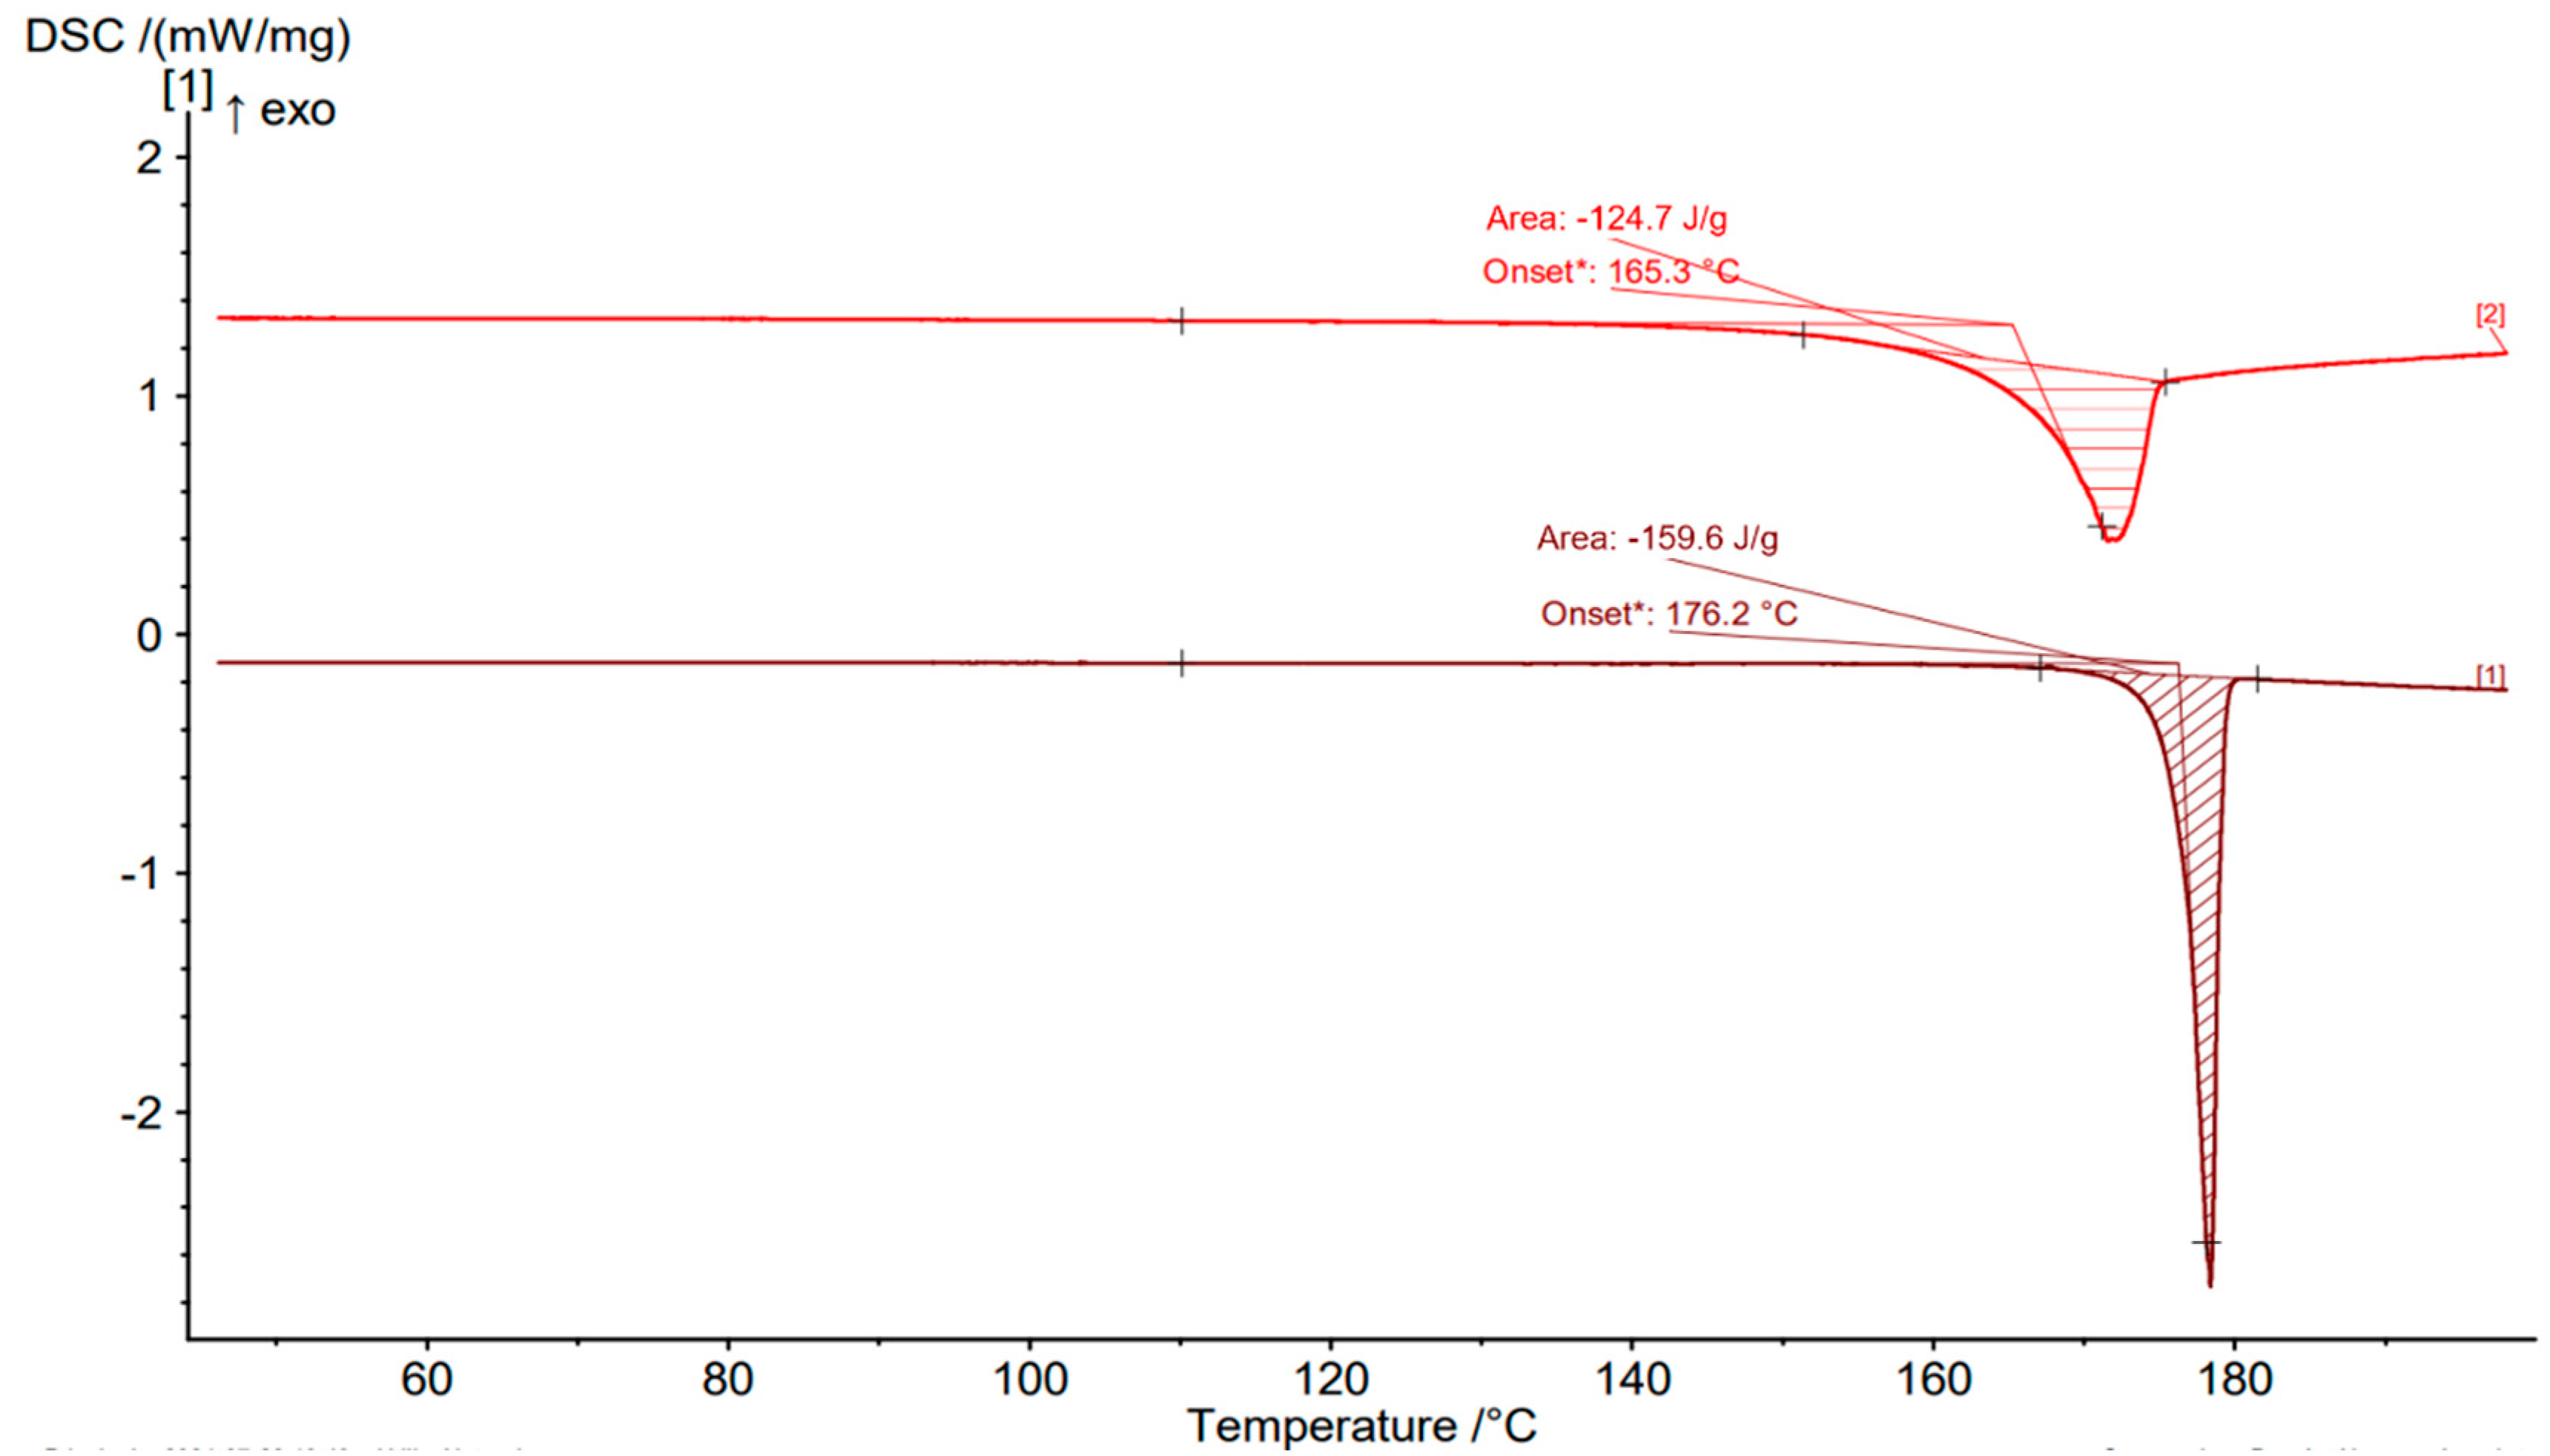
1], the binary system between S-IBU/S-αMBA and R-IBU/S-αMBA presents a simple eutectic at 150 °C without any solid solution. The operating conditions used during DSC analyses have a significant impact on the results. Indeed, with pierced lids, the diastereomeric salts sublimate and lead to an apparent eutectic temperature 10 °C below the one reported by Ebbers et al. With sealed crucibles, the temperature of eutectic is conformed to that reported in the literature, and the resolution of the peaks is improved (
Figure 3). After the fusion, the baseline is not flat for the first curve (with pierced pans). It is mainly due to the sublimation of the salt. This has been confirmed by collecting the vapors above a Köfler bench at approximately 140 °C.
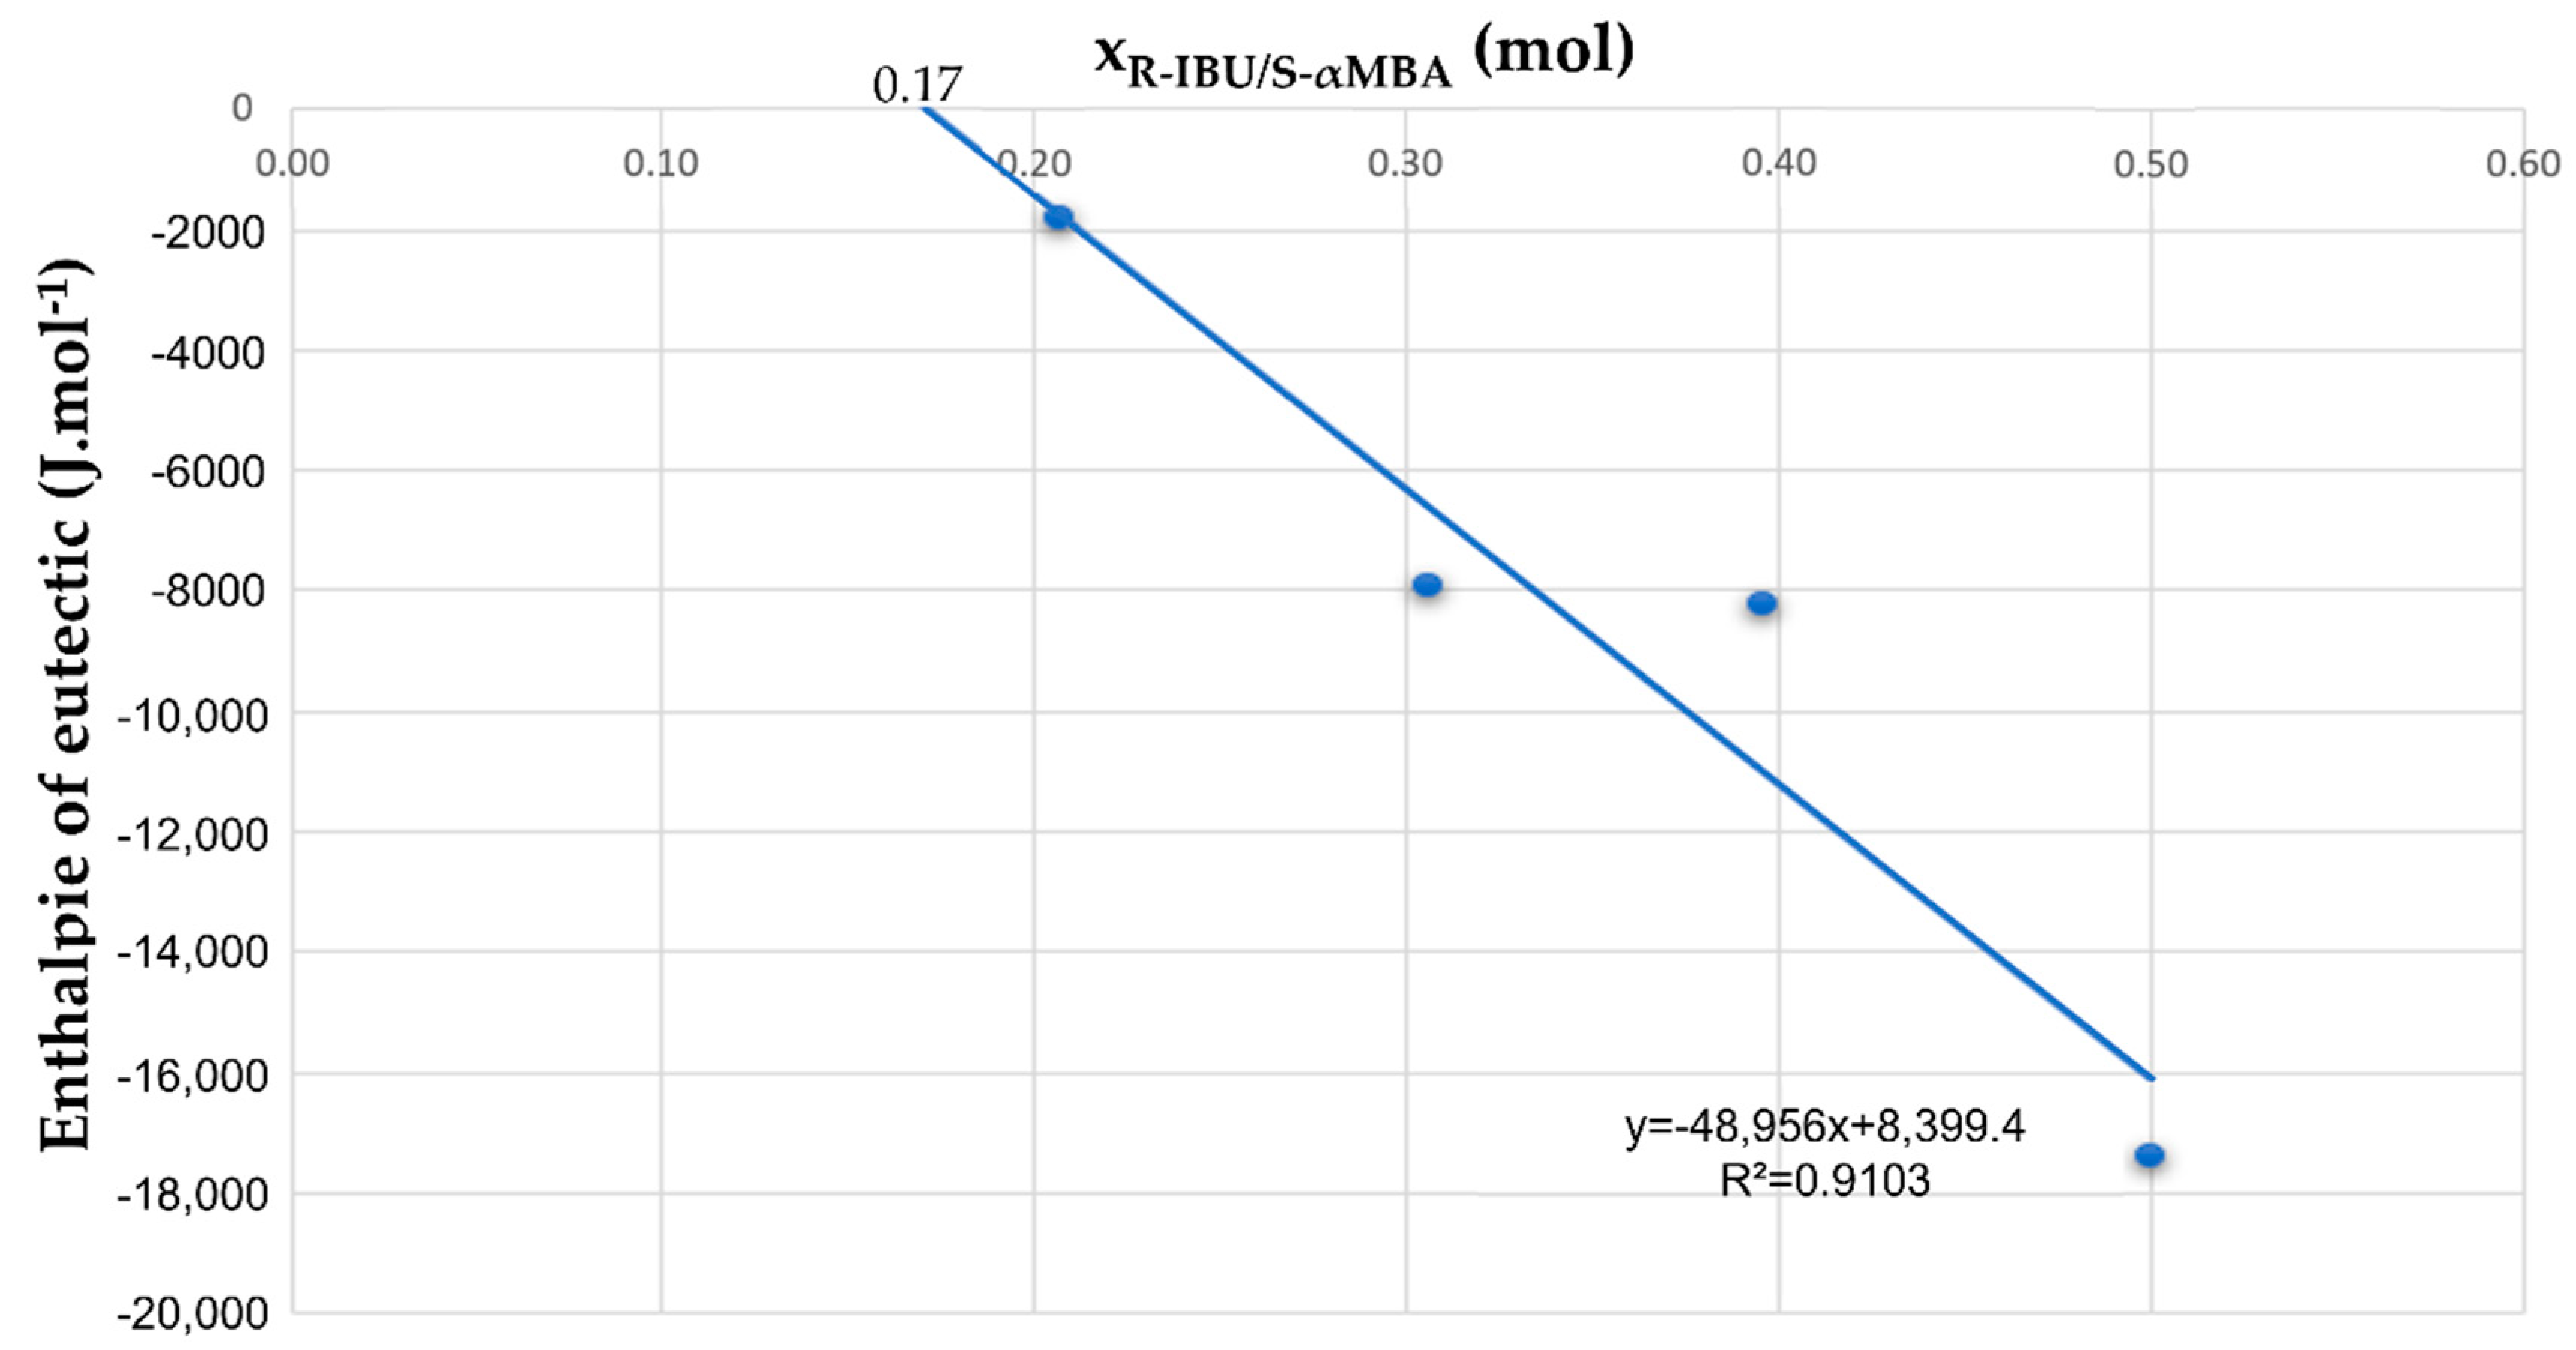
Regardless of these two operating conditions, refinement of the phase diagram region close to the pure component S-IBU/S-αMBA shows that actually, there is a partial solid solution, i.e., a phase mainly composed of S-IBU/S-αMBA, accepting a certain amount of R-IBU/S-αMBA versus temperature. Hereafter, S-IBU/S-αMBA will refer to the pure phase and ss-S-IBU/S-αMBA to the partial solid solution. The limit of miscibility of R-IBU/S-αMBA at the temperature of the eutectic (X
R-IBU/S-αMBA = 17%) has been estimated by the calorimetry of the invariant represented with the Tammann graph (
Figure 4). The partial solid solution is confirmed by accurate XRPD experiments at room temperature (see
Supplementary Information Figure S1). At 20 °C, the limit of the domain of solid solution is at circa: X
R-IBU/S-αMBA = 13%. This result comes from chiral HPLC measurements of the best solid phase isolated after the first crystallization.
The binary phase diagram obtained with sealed pans is represented in
Figure 5. The blue curve represents the liquidus, and the black one is for the eutectic invariant. The dotted lines represent the estimated limits of the partial solid solution. The eutectic invariant is found at 145 °C.
3.2. Crystallographic and Morphological Study
3.2.1. Partial Solid Solution ss-S-IBU/S-αMBA
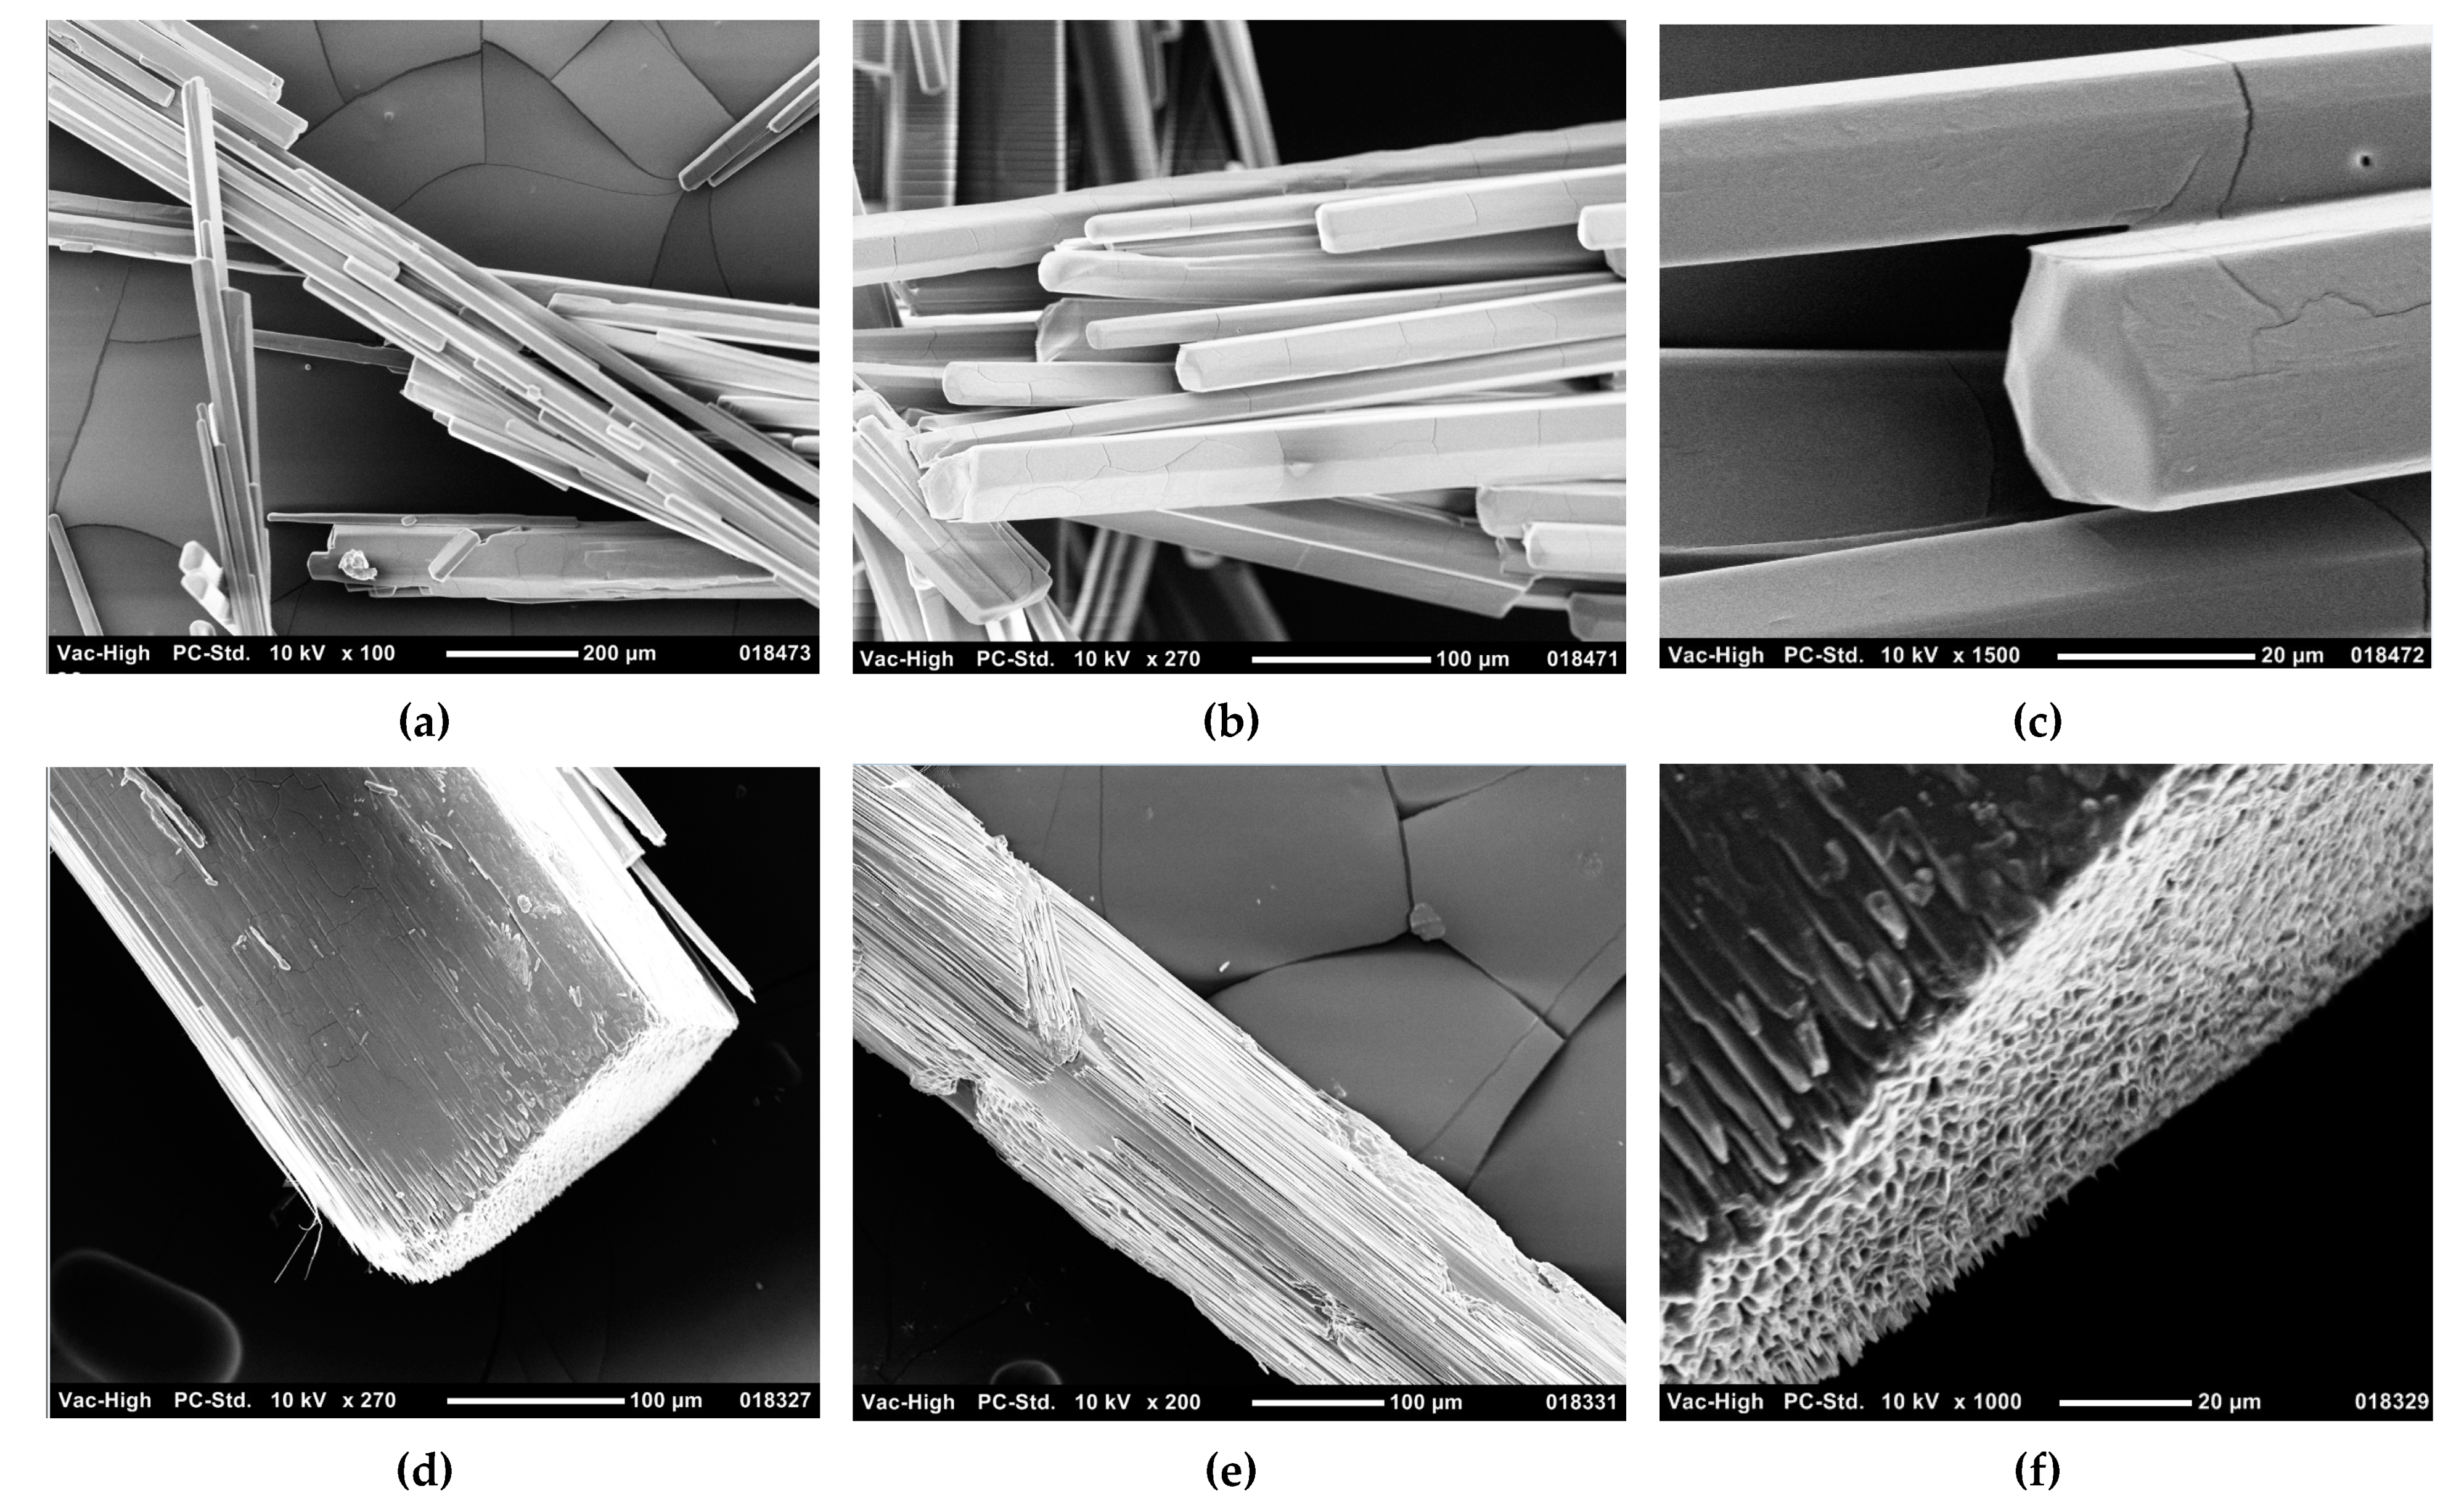
In a conventional approach, the crystal structure leads to understand the change in morphological indexes of the different faces when adding water in the mother liquor. Indeed, at a ‘macroscopic’ scale (circa 0.5 mm scale), the particles look like classical single crystals. However, at microscopic scale (circa 10 μm scale), the single particles appear more like fibrous crystals, which could be defined as a collection of well-aligned fibers with an external shape resembling that of a single crystal.
Figure 6a–f collects SEM photographs showing the meso-structure of particles obtained in ethanol/water (80/20
w/w) representative of the population for the pure S-S diastereomeric salt (
Figure 6a–c) and for the phase at the limit of the partial solid solution (
Figure 6d–f). The authors have already experienced this concept when trying to prepare a single crystal of sodium divalproate. Single-crystal X-ray diffraction on several of those fibrous crystals lead to an undefined reciprocal space. By chance, after several attempts, we picked up a ‘twinned’ crystal of ss-S-IBU/S-αMBA for which the structure could be roughly resolved at room temperature by selecting a unique set of spots (see SI). The crystallographic parameters at room temperature (RT) are: a = 5.9617(9) Å; b = 15.354(2) Å; c = 22.543(3) Å; space group:
P2
12
12
1. They are consistent with literature: a = 5.881 Å; b = 15.259 Å; c = 22.318 Å with the same space group:
P2
12
12
1. Those parameters have been determined after a data collection at 170K [
22]. Other studies contain consistent and complementary data: refcodes: VAKVEK (SS or RR the less soluble diastereomer) or VUCHOR (2009) determined at 115 K [
23].
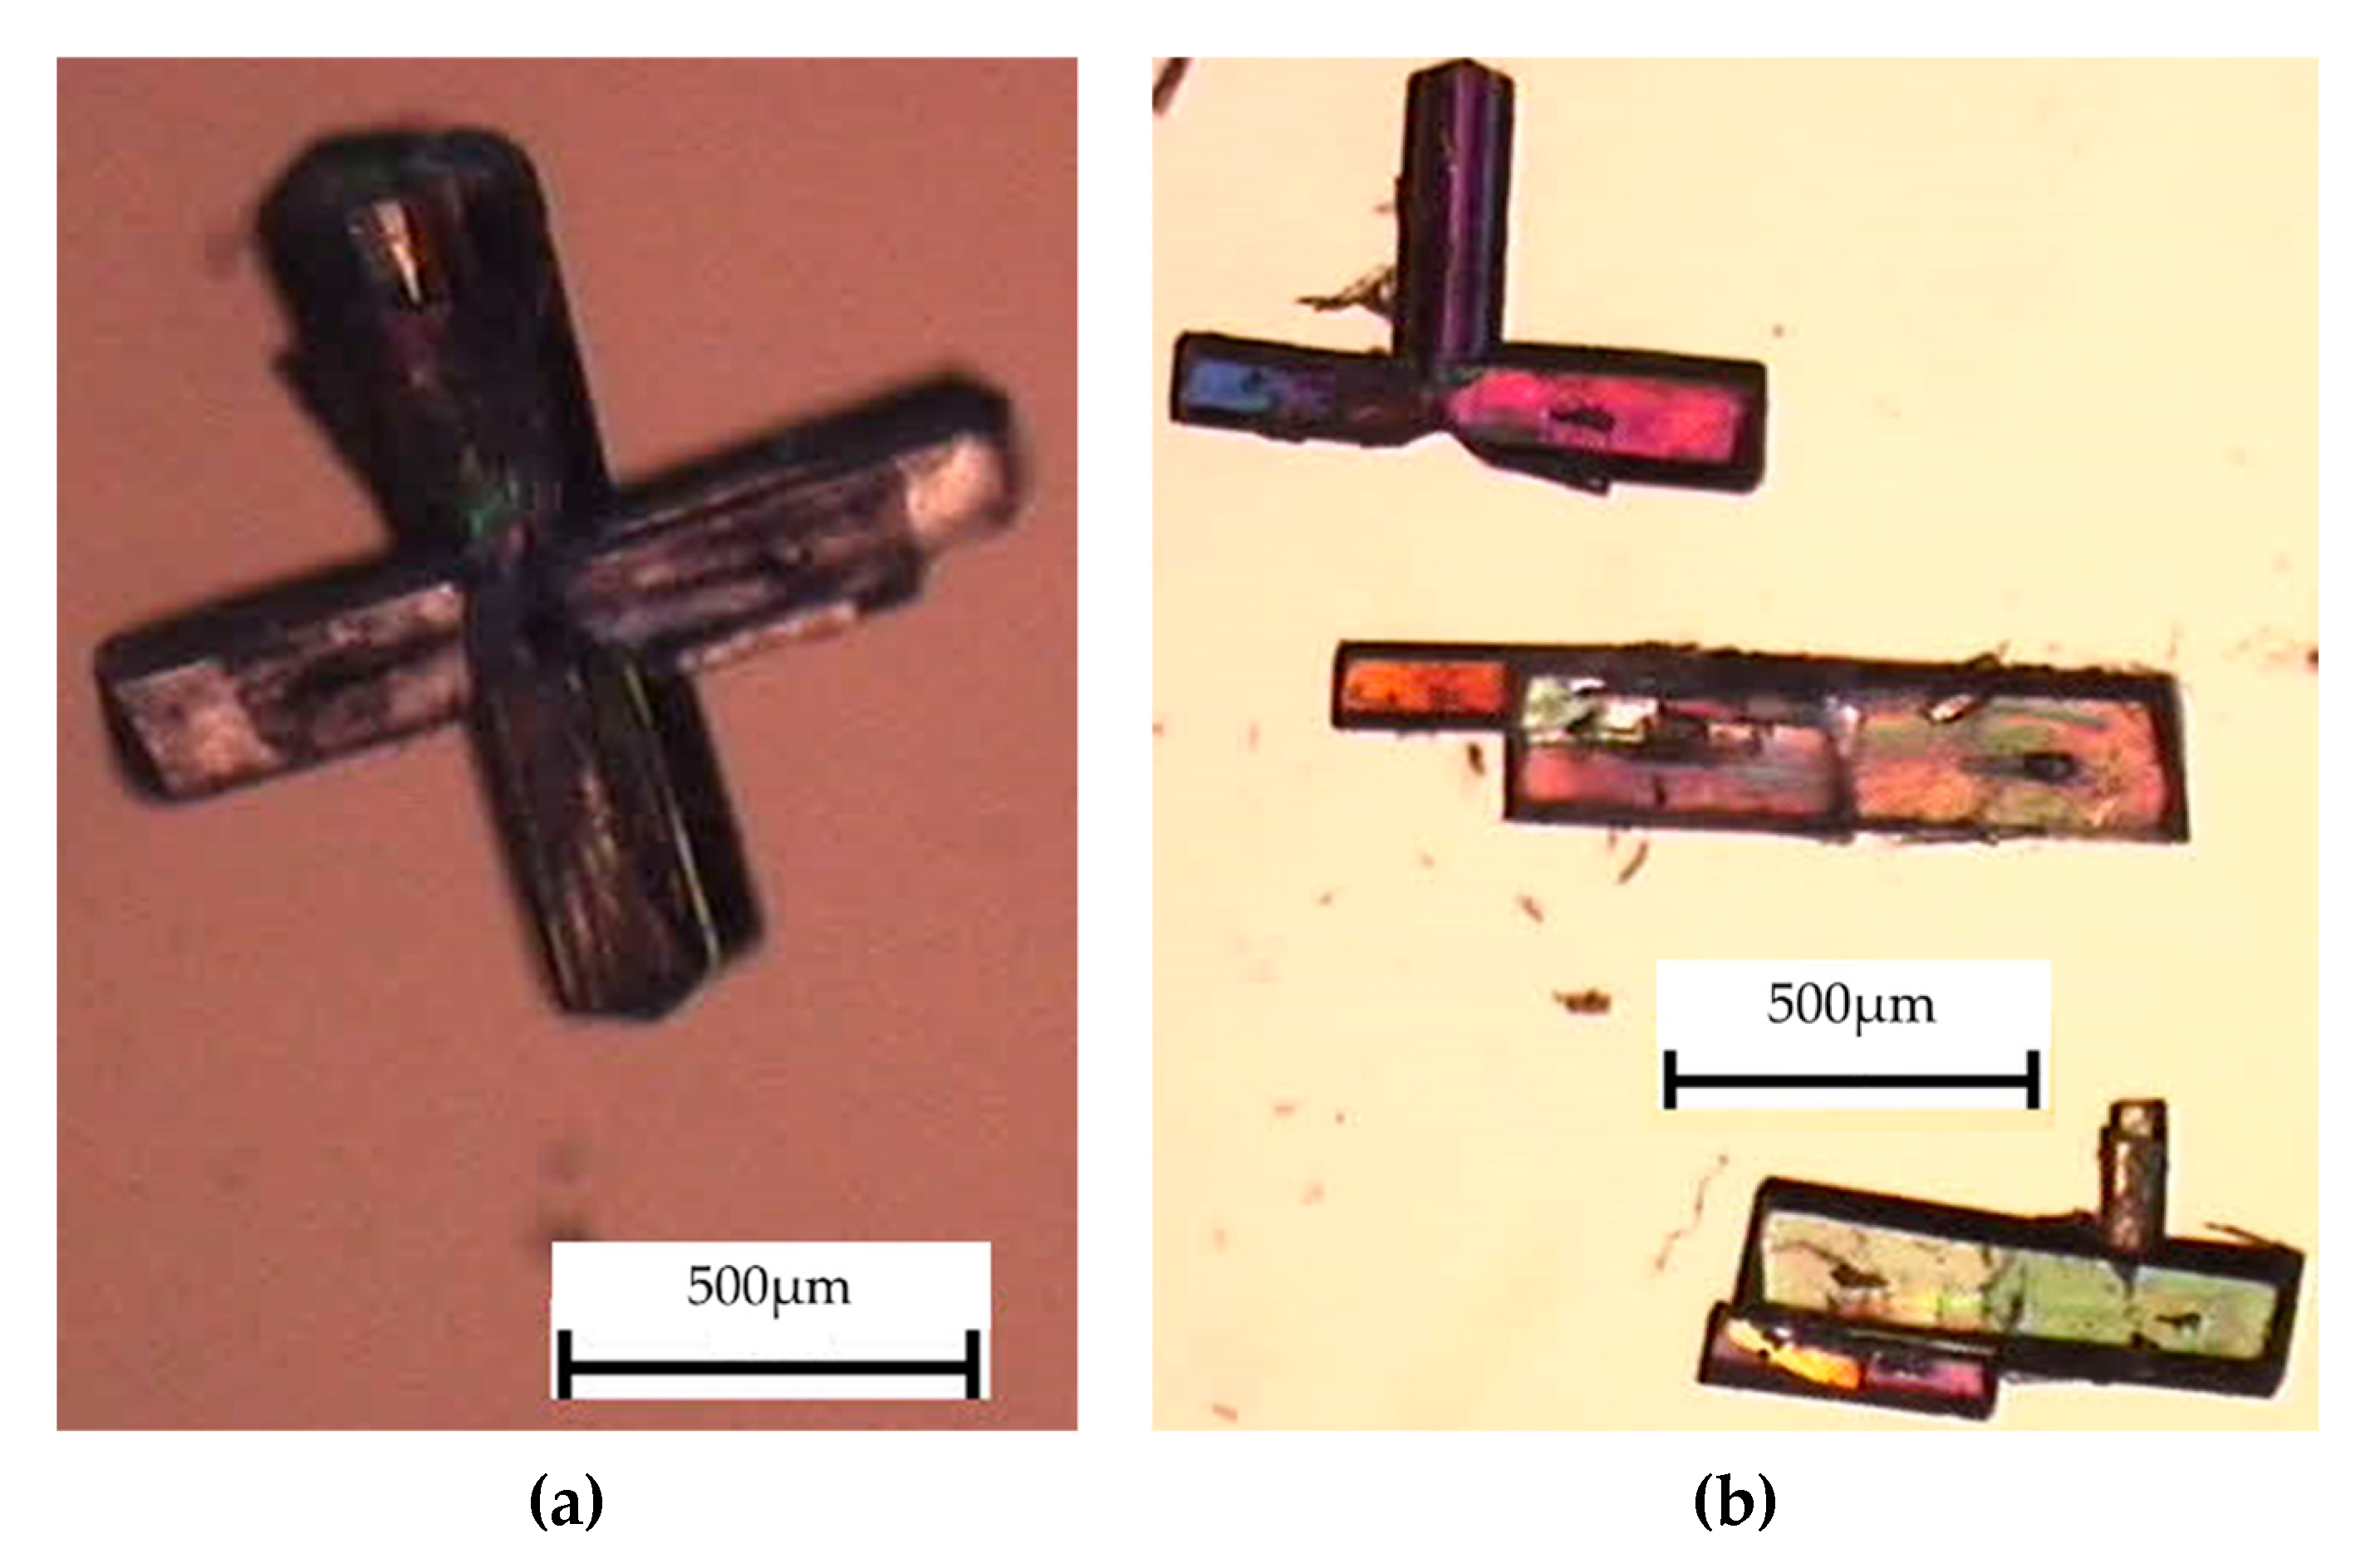
Further examination of the particles shows that they are actually constituted of two parts connected by a zone roughly perpendicular to the main axis ‘a’ of the elongated particles. It is not clear if this is a kind of twin or resulting from the initial seed which grew towards dual opposite sides (
Figure 7).
These fibrous crystals mimic pretty well ‘normal’ single crystals inasmuch as their macroscopic habits look the same: with external faces for which simple Miller indices could be assigned.
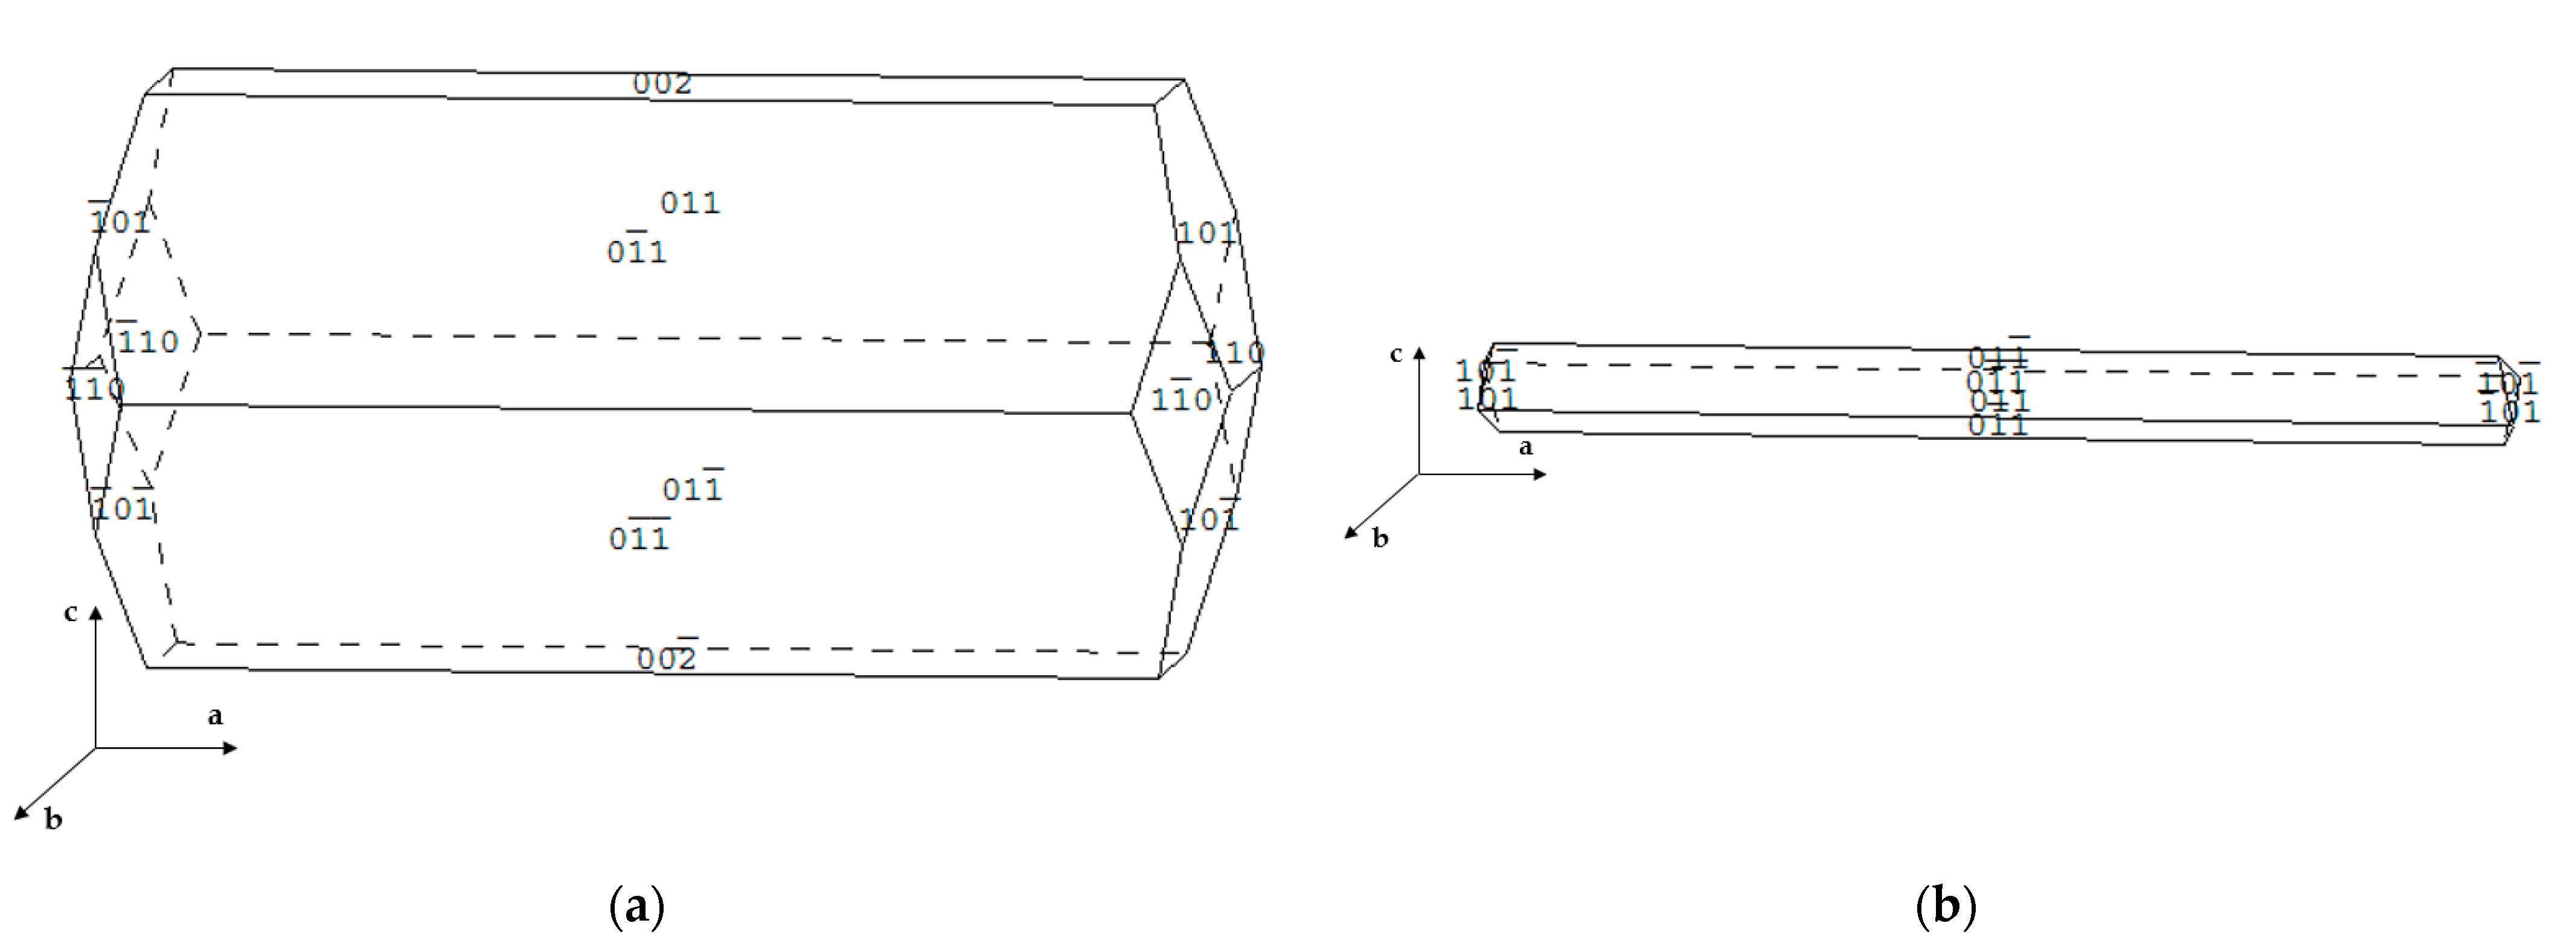
Figure 8a displays the calculated morphology with the classical BFDH model with distance to the central point inversely proportional to the d-spacing (i.e., 1/d). The large discrepancy with the actual morphology of the fibrous crystals is obvious. A much better variant of the model is obtained when the distance between the central point and the (hkl) face is proportional to exp(-Ad) (
Figure 8b) [
24]. In this refined model, A = 0.4 is the upper limit, so that {002} appears (i.e., it appears for k < 0.4). The two sets of planes {002}and {011} delineate the morphology of the particles.
3.2.2. Pure S-IBU/S-αMBA
Figure 9a, obtained by using polarized light microscopy on a particle obtained from a solution of pure S-IBU/S-αMBA in ethanol/water (80/20), gives clear evidence of the association of two crystals perfectly aligned. SEM analyses of those crystals show that they are also elongated, but the habitus of the particle is that of a normal crystal, not a fibrous crystal. Therefore, it can be inferred that the miscibility in the solid state is responsible for the rather ‘bad’ crystallographic quality of the fibrous crystals. A recent study also detailed the concomitant presence of solid solution and fluid inclusions [
25].
Figure 9b shows the habitus of pure S-IBU/S-αMBA obtained in 99.8% ethanol. In comparison with the particle obtained in the presence of water (
Figure 9a), the vacuole occupies a more important fraction of the crystal.
Figure 10b shows a projection along the ‘a’ axis of the structure. The polar periodic bond chains propagate along the ‘a’ axis, forming a polar column (
Figure 10a). The rest of the crystal structure is definitively hydrophobic. In the partial solid solution domain, the substitution of one IBU enantiomer by the other disrupts the quality of the single crystals but not that much the crystal lattice. It is likely that the R enantiomer existing in the matrix of the ss-S-IBU/S-αMBA results from the inversion of the methyl moiety by the hydrogen atom; this minimizes the steric hindrance.
The software “Material Studio” was used to refine the lattice parameters (
Table 1). It is confirmed that the salt crystallized in an orthorhombic system with a space group
P2
12
12
1. In the case of the upper limit in composition of the solid solution, the ‘c’ axis increases more than the other parameters. The C*-CH3 covalent bond in IBU and the ‘c’ axis are 19.3° only apart (see
SI Figure S6). This crystallographic data is thus consistent with the partial substitution of S-IBU by R-IBU by means of inversion between both the methyl and the hydrogen in the alpha of the stereogenic carbon.
3.3. Location, Shape and Temperature of Homogenization of the Fluid Inclusions
3.3.1. Location and Shape
In the vast majority of the cases, there is a single fluid inclusion at both ends of the particles. They are located close to the tips of the particles. They are also symmetrical in position and shape.
The shape of the cavity could somewhat vary:
When operating the resolution from an equimolar composition of diastereomeric salts: S-IBU/S-αMBA and R-IBU/S-αMBA in ethanol/water (80/20) mixture; the cavity is in the shape of a flattened elongated cone expanding towards the extremity of the particle and containing a large bubble of gas. This corresponds to the most probable shape (
Figure 2b).
When the crystallization is operated with pure S-IBU/S-αMBA in ethanol/water (80/20) mixture, the cavity could be oblong or even rectangular with a large bubble of gas (
Figure 9a).
When the crystallization is operated with pure S-IBU/S-αMBA in pure ethanol (99.8%), the particles are less elongated needles, but then fluid inclusions are observed (
Figure 9b). Usually, these vacuoles are conical again, but they are deprived of bubble of gas at room temperature.
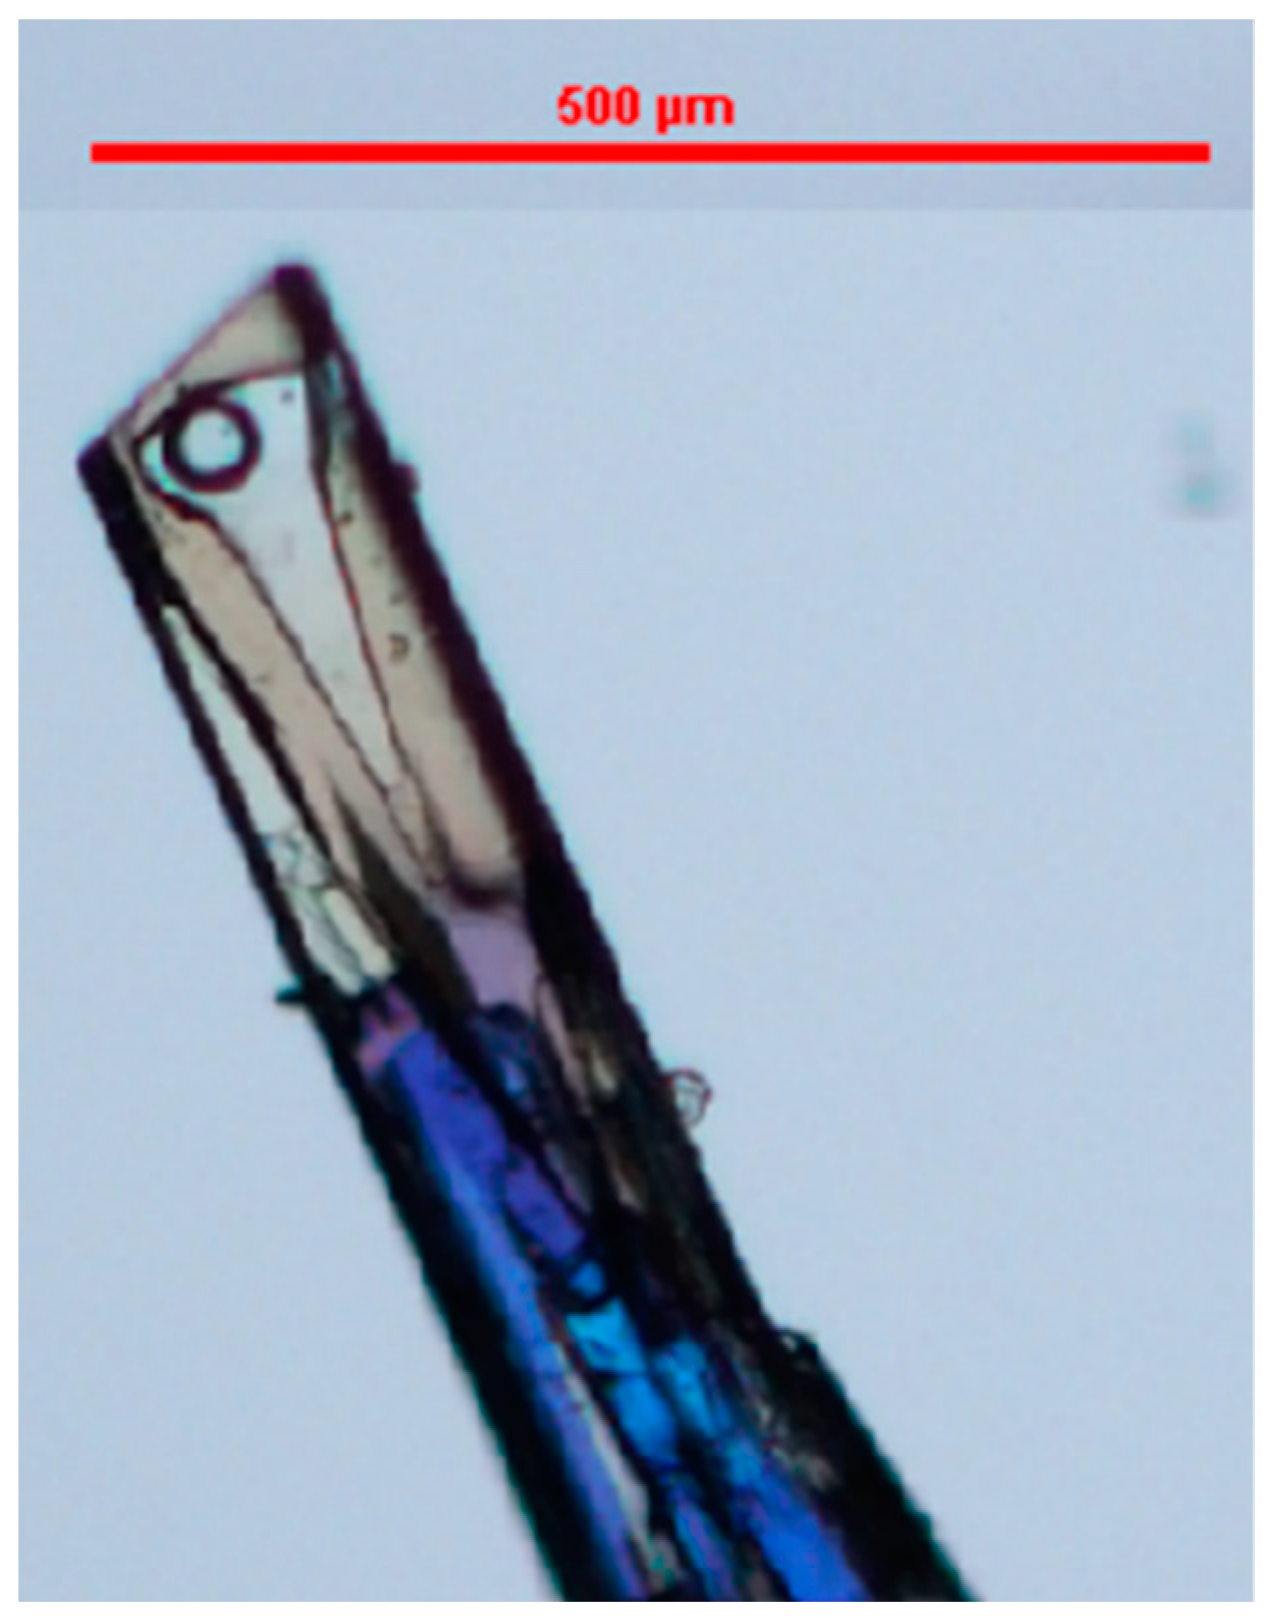
Occasionally, as displayed in
Figure 11, the projection of the conical shape of the cavity could have two (or more) angles. The angle disruption has been observed close to the tip of the particle. This testifies for different regimes during crystal growth.
The fraction of crystals showing those inclusions increases with the size of the crystals and the presence of soda in the medium (for partial substitution of the resolving agent: S-αMBA). However, the size of the fluid inclusions is not clearly dependent on the practical condition of the crystallization.
3.3.2. Temperature of Homogenization
The size of the bubbles of gas appears too large to correspond to a simple retreat bubble. Indeed, the temperature of homogenization (T > 120 °C) exceeds the temperature at which the crystallization took place (from 40 °C to room temperature). No temperature of homogenization means that it is a type II or type II plus type I bubble of gas (see Introduction).
In a special attempt to check the evolution of a fibrous crystal versus temperature, the particle has been heated up to 120 °C (see film in SI). The dissolution brought about the opening of the two opposite cavities and the release of solvent. Simultaneously, the particle is transformed in a less fibrous micro-structure, probably by means of diffusion.
Figure 12 displays the initial (a) and the final (b) particle, in a shape of two opposite fingers with a clear view of the interface between the two bodies.
4. Discussion
The resolution of (±) IBU using S-αMBA in ethanol leads to very fine fibers of ss-S-IBU/S-αMBA; the diastereomeric excess does not exceed 72–73%. This apparent threshold is due to the limit of miscibility of ss-S-IBU/S-αMBA, evidenced in the revised binary phase diagram (
Figure 5).
Addition of water up to 20% induces the formation of fibrous crystals. Apart from an external shape suggesting ‘normal’ single crystals, those particles are actually an ordered collection of parallel fibers, stacked along their common main axis ‘a’. Those particles present variable degrees of microscopic order. Indeed, several studies on a single-crystal X-ray diffractometer revealed an ill-defined order in the reciprocal lattice. The best result was two ‘single crystals’ with an interface perpendicular to the main axis delivering diffraction spots usable for a complete resolution of the crystal structure.
Annealing of the fibrous crystals at different temperatures revealed that diffusion becomes sufficient only at a high temperature of ≈100 °C. In that case, the dissolution around the fluid inclusions leads to the piercing of the two opposite vacuoles and thus the release of solvent. Prior to this event, no homogenization could be observed, suggesting that at least part of the gas trapped in the inclusion comes from a nucleation process of micro-bubbles on the very rough surfaces at the tips of the particles. These almost porous surfaces are prompt to adsorb the gas dissolved in the mother liquor. Water molecules are probably docked at the end point of the ionic period chains parallel to the ‘a’ axis, slowing down the growth rate. Lateral diffusion from one fiber to its neighbors is probably more difficult than for an ordinary crystal, and this inhibits, or at least retards, the self-healing process.
The mechanism of formation of an inclusion results from the interplay between several factors. When the particle becomes large enough the center has more difficulty to be fed compared to the border. As soon as a small cuvette has been formed, the feeding of the center of the depression becomes even more difficult, sustaining and even amplifying the process. This results in a conical aspect of the cavity. When the environmental conditions change, the angle of the cone adapts. When the supersaturation drops, it is possible to close up the cavity.
It is noteworthy that the Pasteurian resolution can also be modified by the complement method with soda; nevertheless, it worsens the problem of fluid inclusions.
5. Conclusions
A partial solid solution ss-S-IBU/S-αMBA between S-IBU/S-αMBA and R-IBU/S-αMBA has been evidenced for the less soluble salt by using chiral HPLC, DSC and XRPD. The monophasic domain width in composition has been assessed at circa 13% at room temperature and 17% at the temperature of the eutectic invariant. This limit of miscibility of ss-S-IBU/S-αMBA restricts the diastereomeric excess reachable after the first resolution step. Therefore, the maximum diastereomeric excess achievable is restraint by heterogeneous equilibria.
From very fine needles of the diastereomeric salt ss-S-IBU/S-αMBA (ca. 82% enriched solid solution) obtained during resolution of the racemic mixture in ethanol, addition of water induces various phenomena: (i) oriented agglomeration of fibers along the ‘a’ axis which can have variable degrees of disorder; (ii) the particles called fibrous crystals are actually dual (twin-like), with an interface perpendicular to the main axis ‘a’; (iii) presence of two-fluid inclusions with a temperature of homogenization exceeding the melting temperature of that phase.
In order to avoid the formation of these fluid inclusions: crystal growth in soda free solution at lower supersaturation in a vigorously stirred and degassed mother liquor proved to be optimum at laboratory scale.
Supplementary Materials
The following are available online at
https://www.mdpi.com/article/10.3390/cryst11101188/s1, Figure S1: XRPD overlay of two products ss-S-IBU/S-αMBA with the highest chiral purity obtained by chiral resolution of rac-IBU, compared with pure S-IBU/S-αMBA; Figure S2: Binary phase diagram obtained with DSC measurements in pierced pans from 20 °C to 200 °C at a heating rate of 2 K/min; Figure S3: Tammann graph obtained with DSC measurements in pierced pan from 20 °C to 200 °C at a heating rate of 2 K/min; Table S1: Eutectic composition calculated with Schröder van Laar equation; Figure S4: Mapview of the Fobs-Fcalc through C13-C2-H2 plane; Figure S5: Mapview of Fo through C13 C2 H2 atoms; Table S2: Comparison of the Ueqs; Figure S6: Inclination of the bond C*-C with reference to the ‘c’ axis; Film S1: Hot stage microscopy from 20 °C to 120 °C at 1 K/min on the inclusions of a crystal of S-Ibu-S-a-MBA.
Author Contributions
Conceptualization, G.C. and L.M.; methodology, L.M. and C.L.; software, M.S. and C.L.; validation, L.M., J.-M.S. and G.C.; formal analysis, C.L. and M.S.; investigation, L.M. and C.L.; data curation, C.L. and L.M.; writing—original draft preparation, G.C.; writing—review and editing, L.M., G.C., M.S. and J.-M.S.; supervision, G.C. and J.-M.S.; project administration, G.C.; funding acquisition, G.C. and J.-M.S. All authors have read and agreed to the published version of the manuscript.
Funding
This research is sponsored by SEQENS (PhD grant L. MARC).
Data Availability Statement
Acknowledgments
Pharmadev (Geneva CH) is thanks for support of that study and for the supply of rac-IBU.
Conflicts of Interest
The authors declare no conflict of interest.
References
- Ebbers, E.J.; Plum, B.J.M.; Ariaans, G.J.A.; Kaptein, B.; Broxterman, Q.B.; Bruggink, A.; Zwanenburg, B. New Resolving Bases for Ibuprofen and Mandelic Acid: Qualification by Binary Phase Diagrams. Tetrahedron Asymmetry 1997, 8, 4047–4057. [Google Scholar] [CrossRef] [Green Version]
- Bhattacharya, A.; Murphy, D. Temperature Selective Diastereo-Recognition (TSD): Enantiomeric Ibuprofen via Environmentally Benign Selective Crystallization. Org. Process Res. Dev. 2003, 7, 717–722. [Google Scholar] [CrossRef]
- Mullin, J.W. Crystallization, 3rd ed.; Butterworth-Heinemann: Oxford, UK, 1993. [Google Scholar]
- Zhang, G.G.Z.; Grant, D.J.W. Formation of Liquid Inclusions in Adipic Acid Crystals during Recrystallization from Aqueous Solutions. Cryst. Growth Des. 2005, 5, 319–324. [Google Scholar] [CrossRef]
- Brandel, C.; Gbabode, G.; Cartigny, Y.; Martin, C.; Gouhier, G.; Petit, S.; Coquerel, G. Crystal Growth, Structure, and Polymorphic Behavior of an Ionic Liquid: Phthalate Derivative of N -Butyl, N -Methylimidazolium Hexafluorophosphate. Chem. Mater. 2014, 26, 4151–4162. [Google Scholar] [CrossRef]
- Bobo, E.; Petit, S.; Coquerel, G. Growth Rate Dispersion at the Single-Crystal Level. Chem. Eng. Technol. 2015, 38, 1011–1016. [Google Scholar] [CrossRef]
- Yan, S.; Xie, C.; Zhang, X.; Zhou, L.; Hou, B.; Huang, J.; Zhou, L.; Yin, Q. Influence of Crystal Growth Conditions on Formation of Macroscopic Inclusions inside Thiourea Crystals. ChemistrySelect 2018, 3, 2293–2297. [Google Scholar] [CrossRef]
- Saito, N.; Yokota, M.; Sato, A.; Kubota, N. Growth Enhancement and Liquid-Inclusion Formation by Contacts on NaCI Crystal. AIChE J. 1999, 45, 1153–1156. [Google Scholar]
- Saito, N.; Yokota, M.; Fujiwara, T.; Kubota, N. Liquid Inclusions in Crystals Produced in Suspension Crystallization. Chem. Eng. J. 2000, 79, 53–59. [Google Scholar] [CrossRef]
- Waldschmidt, A.; Dupray, V.; Berton, B.; Couvrat, N.; Petit, S.; Coquerel, G. Incidence of Crystal Growth Conditions on the Formation of Macroscopic Liquid Inclusions in Ciclopirox Crystals. J. Cryst. Growth 2012, 342, 72–79. [Google Scholar] [CrossRef]
- Cooper, J.; Borne, L.; Coquerel, G. Antisolvent Addition: An Effective Method of Controlled Fluid Inclusion Formation in RDX Crystals. Cryst. Growth Des. 2020, 20, 7120–7128. [Google Scholar] [CrossRef]
- Kim, J.-W.; Kim, J.-K.; Kim, H.-S.; Koo, K.-K. Characterization of Liquid Inclusion of RDX Crystals with a Cooling Crystallization. Cryst. Growth Des. 2009, 9, 2700–2706. [Google Scholar] [CrossRef]
- Kim, J.-W.; Kim, J.-K.; Kim, H.-S.; Koo, K.-K. Application of Internal Seeding and Temperature Cycling for Reduction of Liquid Inclusion in the Crystallization of RDX. Org. Process Res. Dev. 2011, 15, 602–609. [Google Scholar] [CrossRef]
- Wang, Y.; Zhang, N.; Hou, B.; Yin, Q.; Gong, J.; Tang, W. Effect of Crystal Growth Kinetics on the Formation of Liquid Inclusions in Tetramethylpyrazine Crystals. CrystEngComm 2020, 22, 1991–2001. [Google Scholar] [CrossRef]
- Waldschmidt, A.; Couvrat, N.; Berton, B.; Dupray, V.; Morin, S.; Petit, S.; Coquerel, G. Impact of Gas Composition in the Mother Liquor on the Formation of Macroscopic Inclusions and Crystal Growth Rates. Case Study with Ciclopirox Crystals. Cryst. Growth Des. 2011, 11, 2463–2470. [Google Scholar] [CrossRef]
- Zhou, J.; Hao, L.; Hao, H.; Ji, X.; Li, J.; Zhou, L. Formation Mechanism of Liquid Inclusions in Dicumyl Peroxide Crystals. CrystEngComm 2021, 23, 4214–4228. [Google Scholar] [CrossRef]
- Waldschmidt, A.; Rietveld, I.; Couvrat, N.; Dupray, V.; Sanselme, M.; Berton, B.; Nicolai, B.; Mahé, N.; Petit, S.; Céolin, R.; et al. About Aged Heterogeneous Liquid Inclusions Inside Organic Crystals in Relation to Crystal Formation, Structure, and Morphology. Cryst. Growth Des. 2011, 11, 2580–2587. [Google Scholar] [CrossRef]
- Bobo, E.; Lefez, B.; Caumon, M.-C.; Petit, S.; Coquerel, G. Evidence of Two Types of Fluid Inclusions in Single Crystals. CrystEngComm 2016, 18, 5287–5295. [Google Scholar] [CrossRef]
- Jones, S.F.; Evans, G.M.; Galvin, K.P. Bubble Nucleation from Gas Cavities—A Review. Adv. Colloid Interface Sci. 1999, 80, 27–50. [Google Scholar] [CrossRef]
- Farrugia, L.J. WinGX Suite for Small-Molecule Single-Crystal Crystallography. J. Appl. Cryst. 1999, 32, 837–838. [Google Scholar] [CrossRef]
- Biovia Material Studio 2019 (19.1.0.2353), Copyright © 2021 Dassault Systèmes, All Right Reserved. Available online: http://Accelrys.Com/Products/Collaborative-Science/Biovia-Materials-Studio (accessed on 31 August 2021).
- Lemmerer, A.; Bourne, S.A.; Caira, M.R.; Cotton, J.; Hendricks, U.; Peinke, L.C.; Trollope, L. Incorporating Active Pharmaceutical Ingredients into a Molecular Salt Using a Chiral Counterion. CrystEngComm 2010, 12, 3634. [Google Scholar] [CrossRef]
- Molnár, P.; Bombicz, P.; Varga, C.; Bereczki, L.; Székely, E.; Pokol, G.; Fogassy, E.; Simándi, B. Influence of Benzylamine on the Resolution of Ibuprofen with (+)-(R)-Phenylethylamine via Supercritical Fluid Extraction. Chirality 2009, 21, 628–636. [Google Scholar] [CrossRef] [PubMed]
- Donnay, J.D.H.; Harker, D. A New Law of Crystal Morphology Extending the Law of Bravais. Amer. Mineral. 1937, 22, 446–467. [Google Scholar]
- Wang, Y.; Li, H.; Raikes, M.; Linehan, B.; Robson, J.; Nordstrom, F.L. Formation of Macrotubular Crystals of Salicylic Acid through Ripening of Solid Solution Crystals Containing Impurity Gradients. Cryst. Growth Des. 2021, 21, 4100–4110. [Google Scholar] [CrossRef]
Figure 1.
Structural formula of (a) S-IBU and (b) S-αMBA.
Figure 1.
Structural formula of (a) S-IBU and (b) S-αMBA.
Figure 2.
Crystals of S-IBU/S-αMBA obtained from a direct resolution. (a) Crystallization performed in ethanol; (b) crystallization performed in a mixture: ethanol–water (80/20 w/w) and a supersaturation: β = 1.8 at 20 °C; seeding at 40 °C. Encircled in red the symmetrical fluid inclusions.
Figure 2.
Crystals of S-IBU/S-αMBA obtained from a direct resolution. (a) Crystallization performed in ethanol; (b) crystallization performed in a mixture: ethanol–water (80/20 w/w) and a supersaturation: β = 1.8 at 20 °C; seeding at 40 °C. Encircled in red the symmetrical fluid inclusions.
Figure 3.
DSC thermograms obtained for pierced pans (top curve) and sealed pans (bottom curve). A heating rate of 2 K/min until 200 °C was used for pierced pans. For sealed pans, the solid was heated up to 130 °C, with a heating rate of 2 K/min. After 2 hours at 130 °C, the sample was cooled down to 20 °C (5K/min) and then heated up to 200 °C (2 K/min).
Figure 4.
Tammann graph obtained with DSC measurements in closed pan from 20 °C to 130 °C at a heating rate of 2 K/min in closed pans. After 2 hours at 130 °C, the sample is cooled down to 20 °C (5 K/min) and then heated up to 200 °C (2 K/min).
Figure 4.
Tammann graph obtained with DSC measurements in closed pan from 20 °C to 130 °C at a heating rate of 2 K/min in closed pans. After 2 hours at 130 °C, the sample is cooled down to 20 °C (5 K/min) and then heated up to 200 °C (2 K/min).
Figure 5.
Revised binary system between S-IBU/S-αMBA and R-IBU/S-αMBA; focus on the part close to S-IBU/S-αMBA, the pure, less soluble salt. Binary phase diagram obtained with DSC measurements in sealed pans from 20 °C to 130 °C at a heating rate of 2 K/min. After 2 hours at 130 °C, every sample was cooled down to 20 °C (5 K/min) and then heated up to 200 °C (2 K/min). Blue curve = liquidus; black line = eutectic; dotted lines = limits of the partial solid solution. The solvus has been extrapolated with the following points: (T = 145 °C; XR-IBU/S-αMBA = 0.17) and (T = 20 °C; XR-IBU/S-αMBA = 0.13). NB: the authors assume that there is also a partial solid solution close to R-IBU/S-αMBA, which is why the second component of the biphasic domain is labelled ss-R-IBU/S-αMBA.
Figure 6.
(a–c): SEM photographs of pure S-IBU/S-αMBA. (d–f): SEM photographs of ss-S-IBU/S-αMBA at the limit of the solid solution (XR-IBU/S-αMBA = 14%). Pure salt is smooth and has a regular shape, whereas the salt with solid solution is rough due to a visible association of fibers. Some cracks are observed on the two samples.
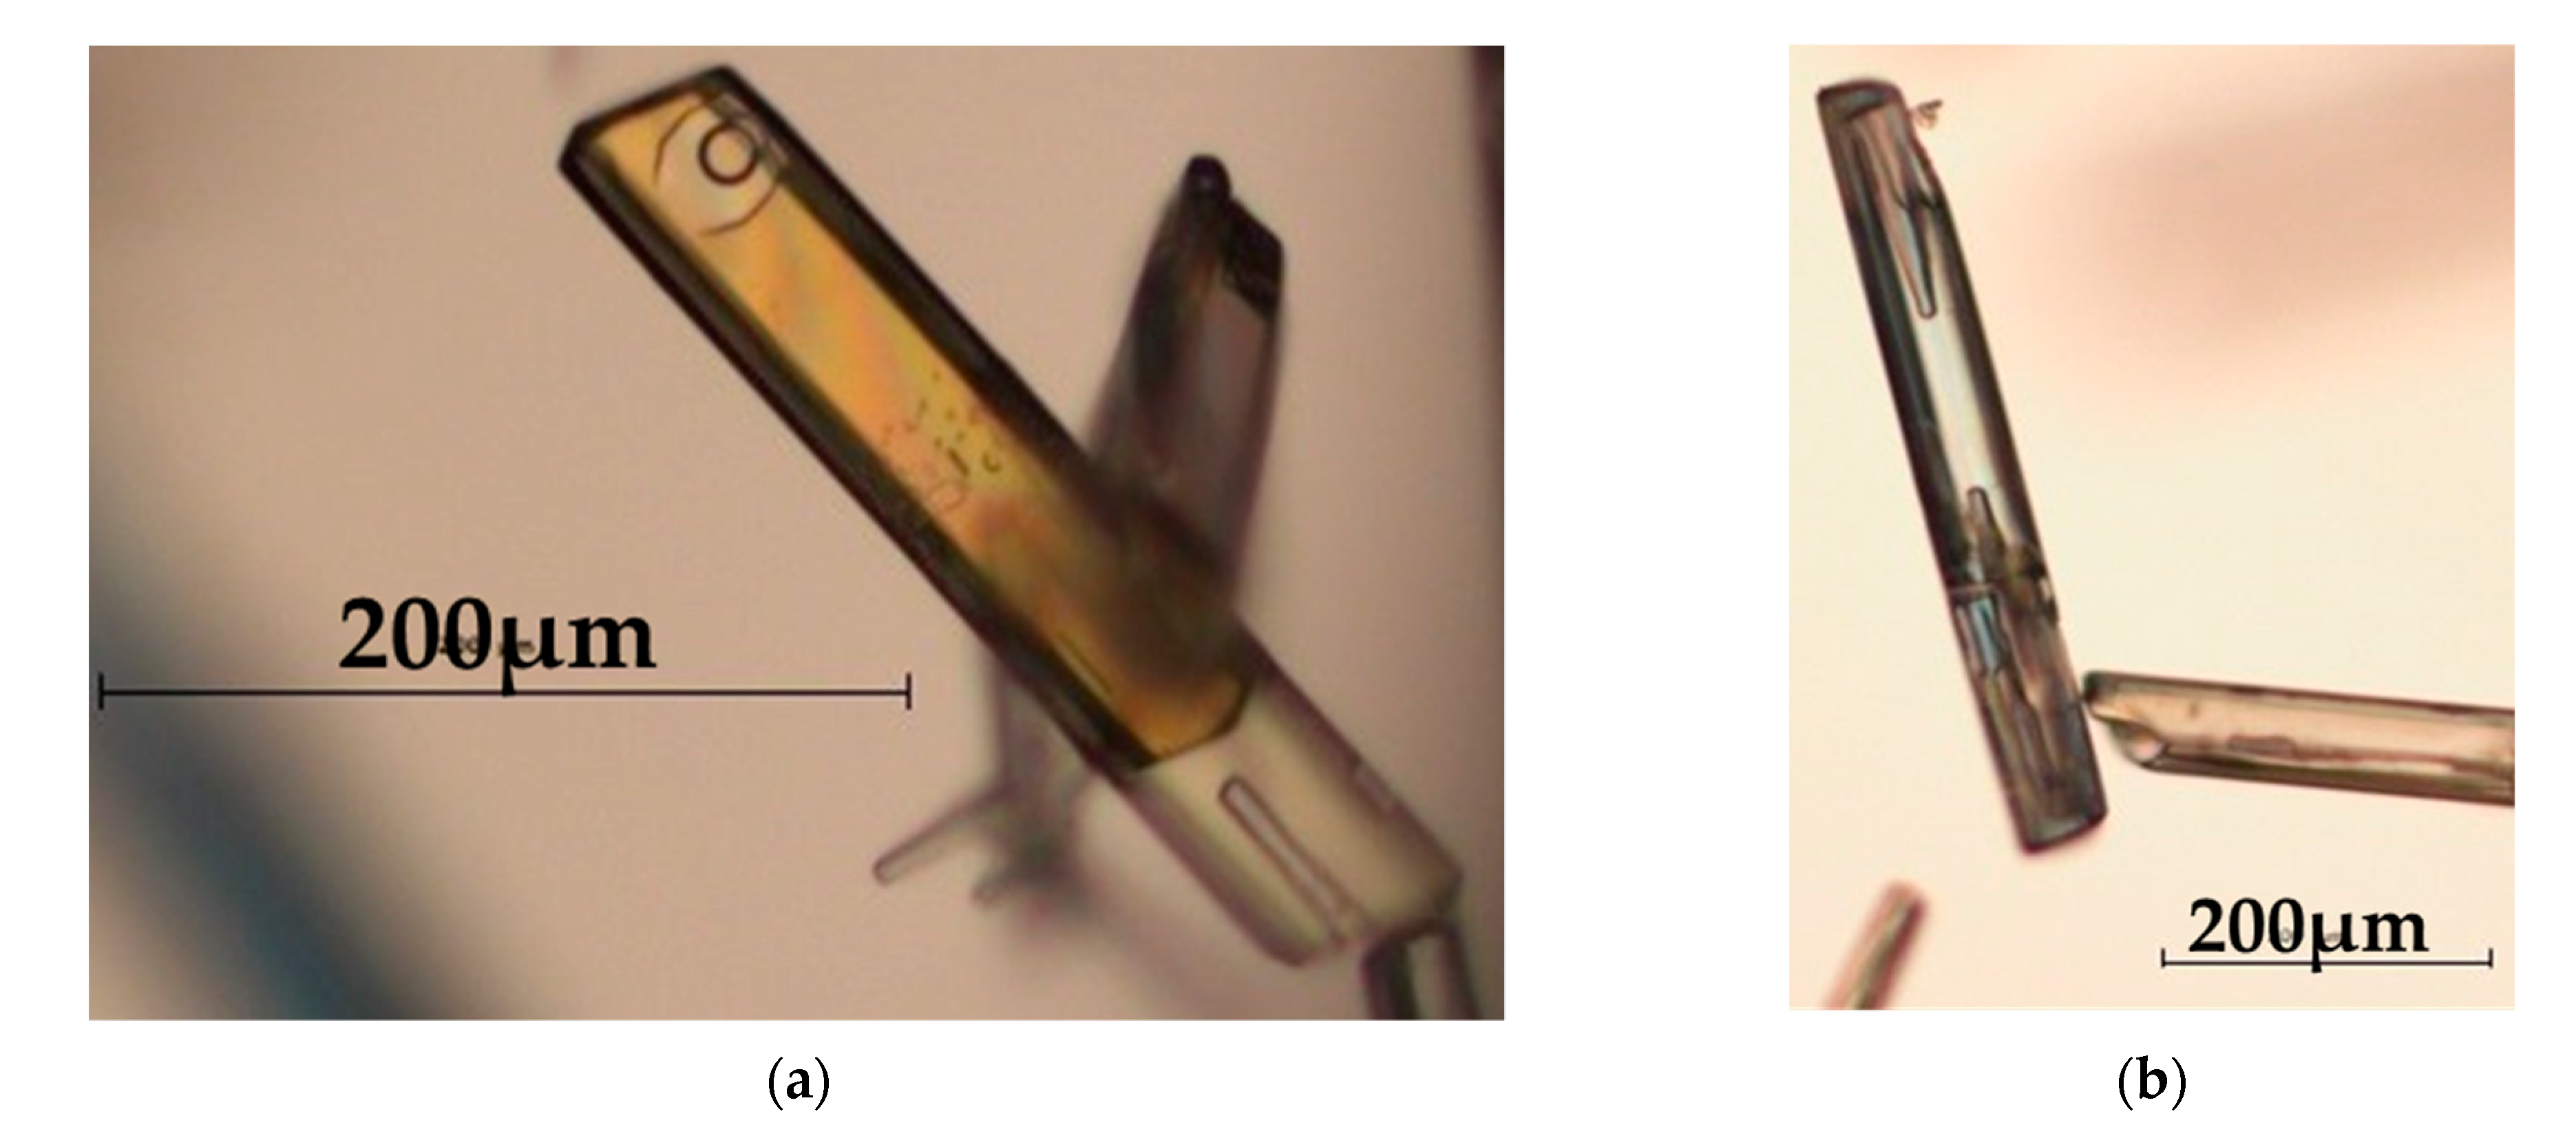
Figure 7.
Photographs taken by binocular polarized light microscopy of the observed ‘parts’ of the S-IBU/S-αMBA crystals. They seem connected by a zone roughly perpendicular to the main axis ‘a’ of the elongated particles. (a) Crystal with four visible parts; (b) crystals with two or three visible parts.
Figure 8.
Calculated morphologies with BFDH model. (a) BFDH with distance to the central point inversely proportional to the d-spacing (1/d). (b) Variant of the BFDH model with distance to the central point proportional to exp(-Ad) with A = 0.4. Growth rate of {101} could be much faster resulting in a more extreme needle shape.
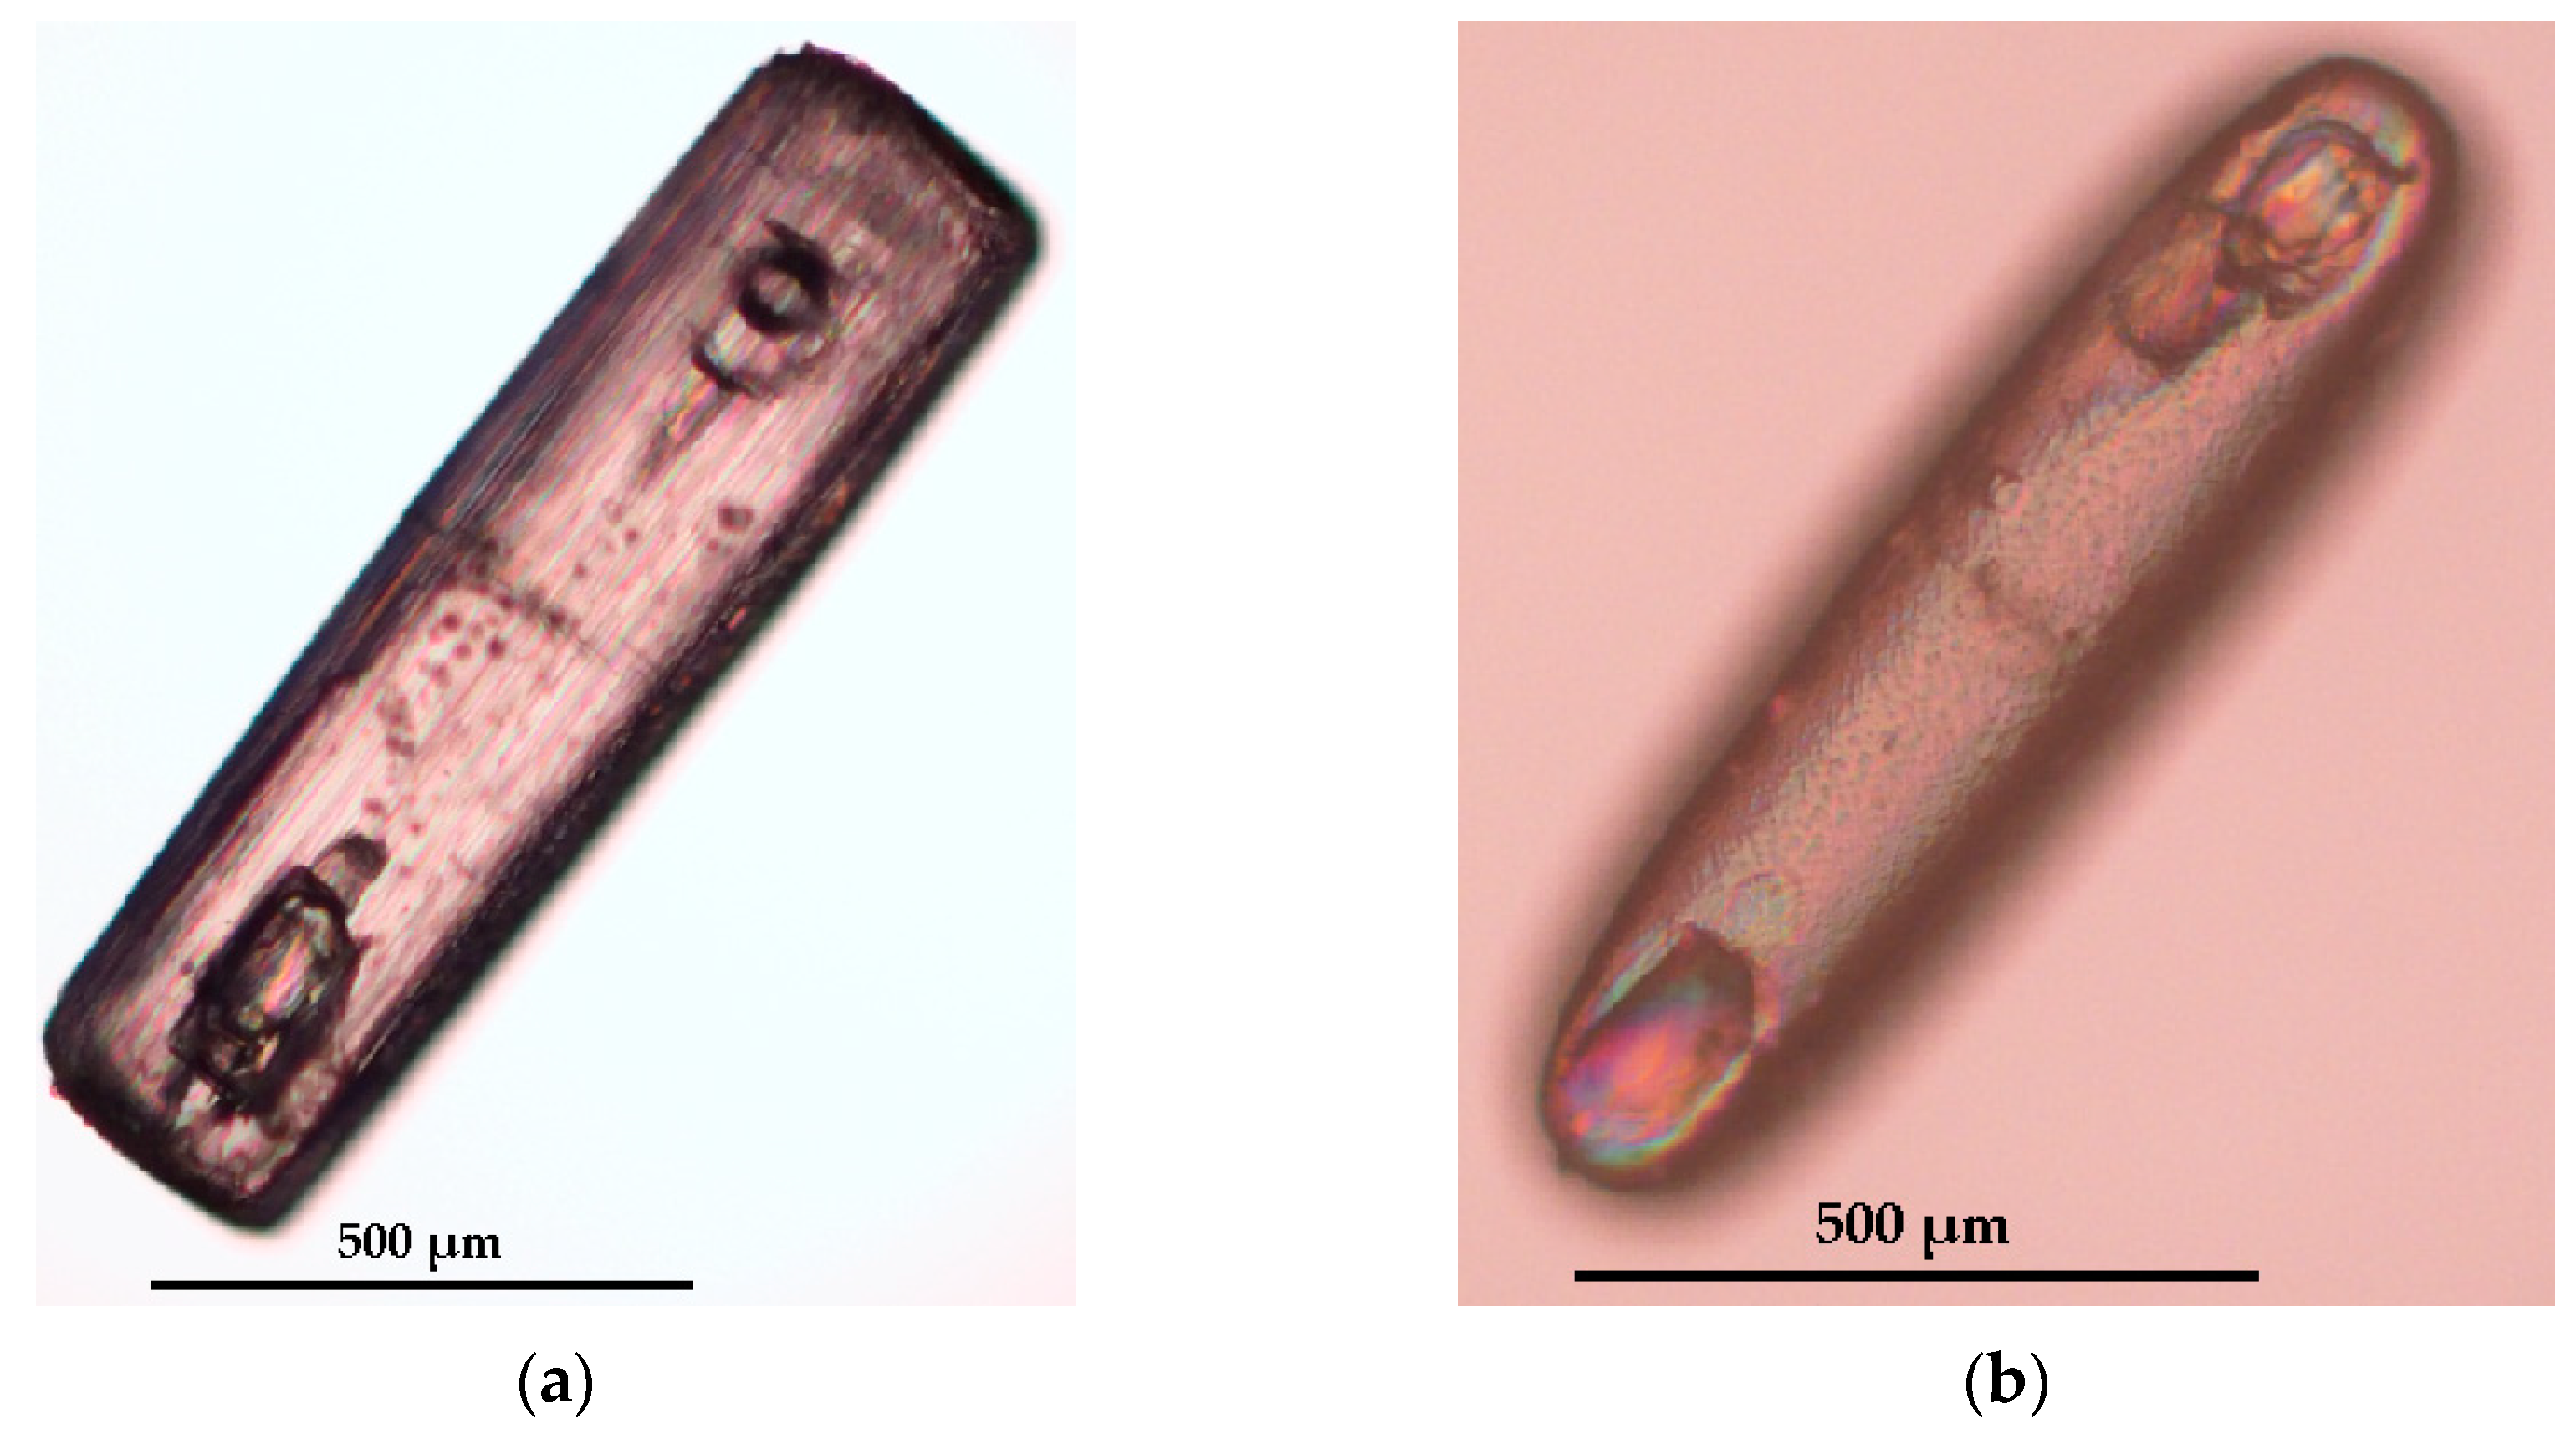
Figure 9.
Snapshots obtained by means of polarized light microscopy. (a) Particle obtained by cooling from 40 °C to 20 °C of pure S-IBU/S-αMBA in ethanol/water (80/20) mixture; the particle exhibits two colors with a clear dividing line, suggesting that it results in an association of two different crystals. (b) Particle obtained by cooling from 40 °C to 20 °C of pure S-IBU/S-αMBA in pure ethanol (99.8%).
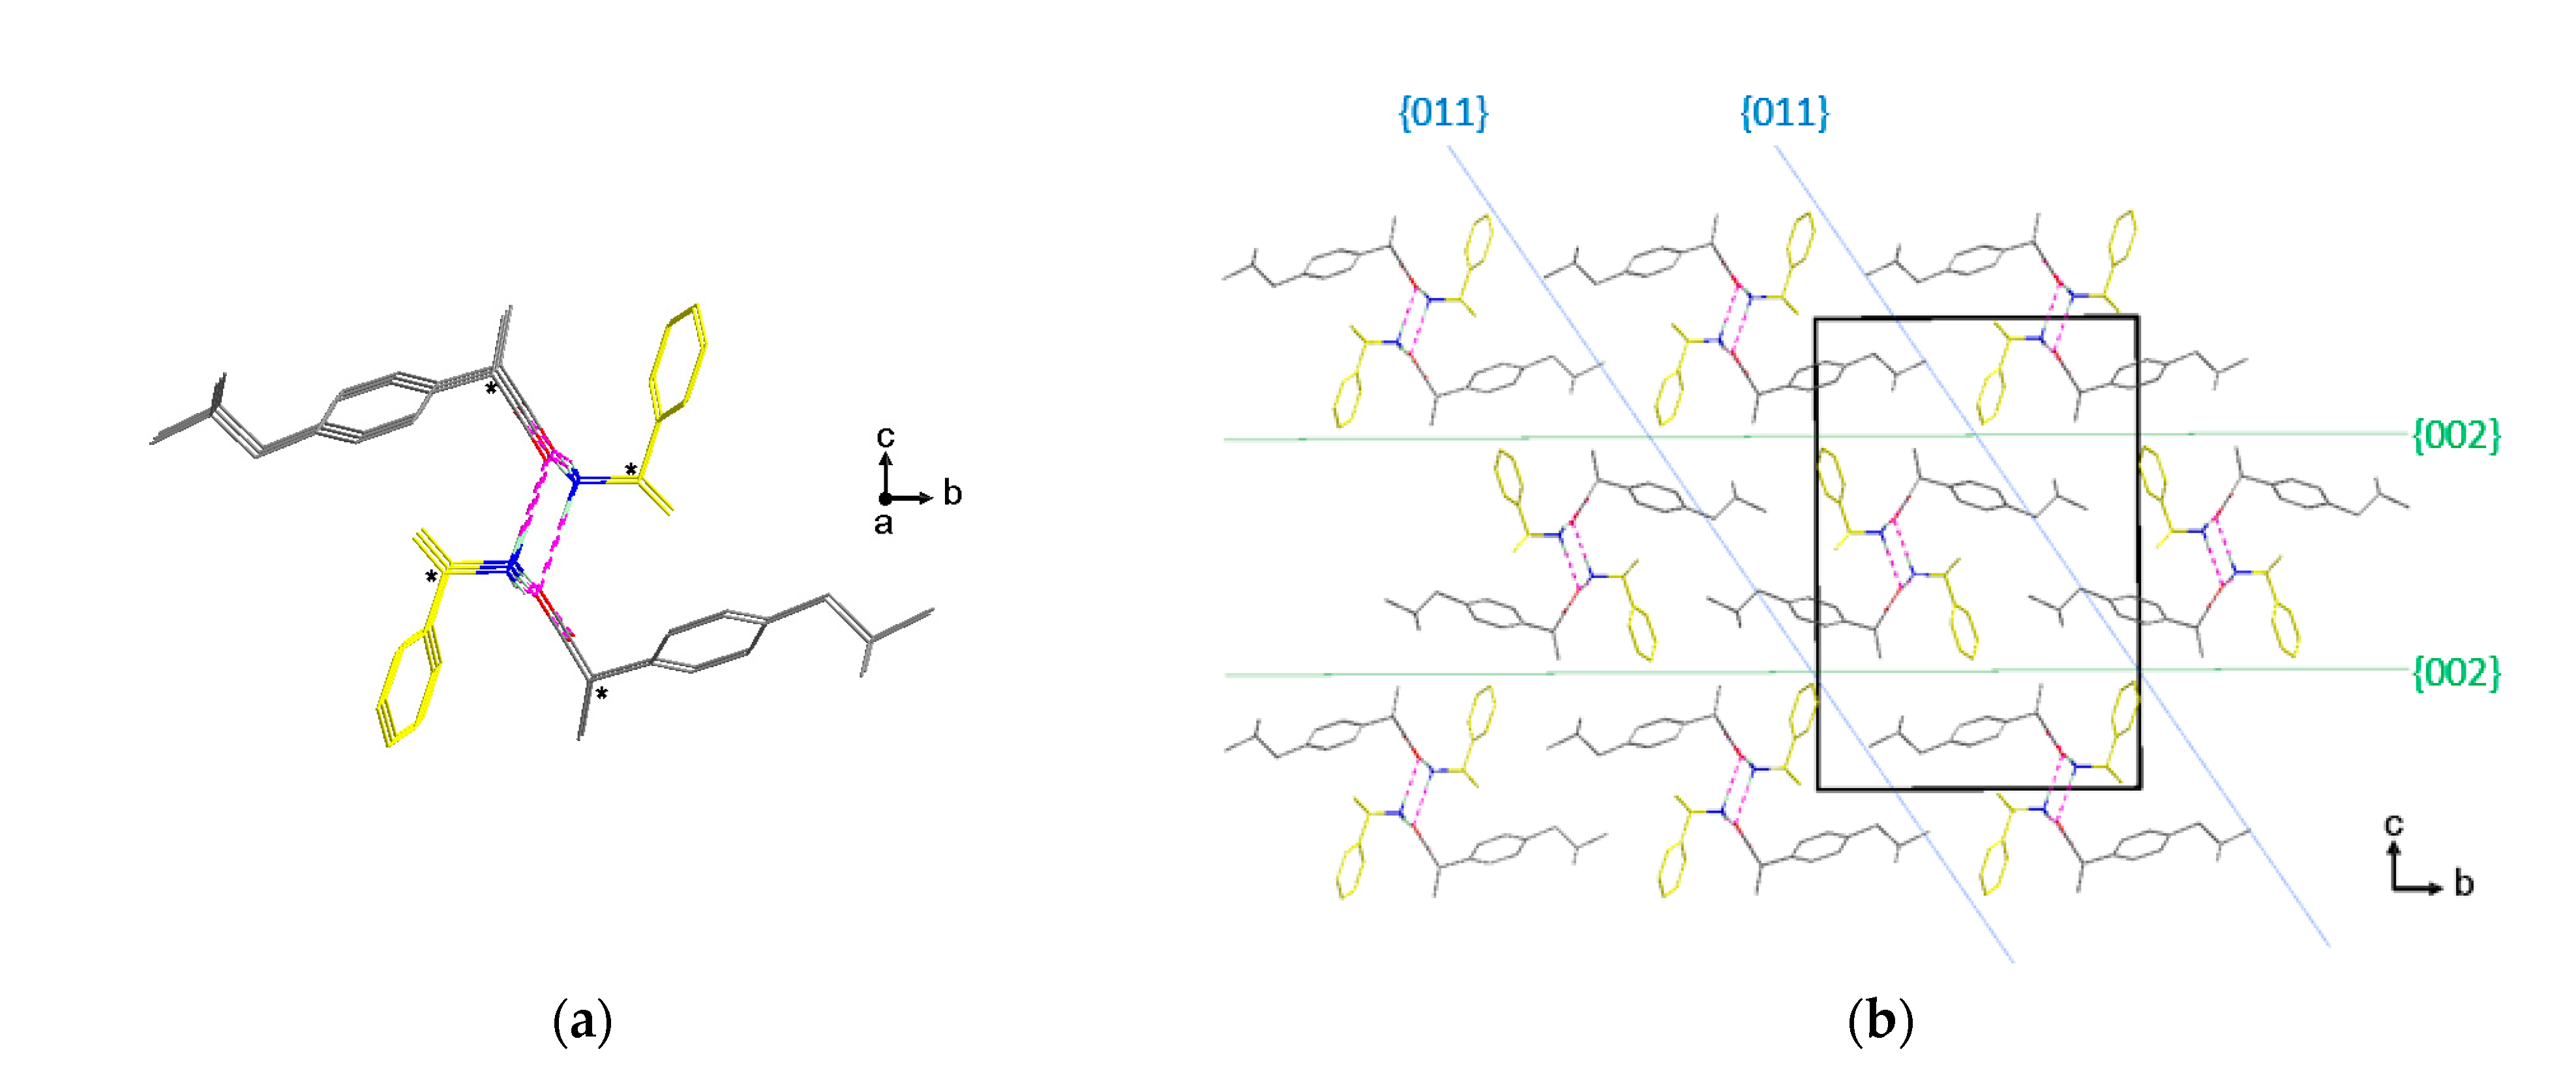
Figure 10.
(a) Molecular chain of S-IBU/S-α-MBA spreading along the ‘a’ axis. The carbon atoms are displayed in yellow for S-αMBA and in grey for S-IBU. Chiral carbon for both molecules is highlighted with an asterisk. (b) Projection along the ‘a’ axis of the S-IBU/S-α-MBA crystal structure. The slices {002} and {011} are shown; their surfaces are clearly hydrophobic.
Figure 11.
Photograph obtained by using polarized light microscopy showing the angle disruption in the conical shape fluid inclusion.
Figure 11.
Photograph obtained by using polarized light microscopy showing the angle disruption in the conical shape fluid inclusion.
Figure 12.
Fibrous crystal under heating (from 20 °C to 120 °C at 1 K/min) at two different stages: (a) at T = 20 °C; (b) at T = 120 °C. The heating up to 120 °C turns the initial crystal in a particle exhibiting a less fibrous micro-structure.
Figure 12.
Fibrous crystal under heating (from 20 °C to 120 °C at 1 K/min) at two different stages: (a) at T = 20 °C; (b) at T = 120 °C. The heating up to 120 °C turns the initial crystal in a particle exhibiting a less fibrous micro-structure.
Table 1.
Comparison between the lattice parameters of the ss-S-IBU/S-αMBA with a composition of XR-IBU/S-αMBA = 0.14 (powder), the single crystal (XR-IBU/S-αMBA ≈ 0.18), and the pure salt S-IBU/S-αMBA (powder). Data obtained from the software Material Studio.
Table 1.
Comparison between the lattice parameters of the ss-S-IBU/S-αMBA with a composition of XR-IBU/S-αMBA = 0.14 (powder), the single crystal (XR-IBU/S-αMBA ≈ 0.18), and the pure salt S-IBU/S-αMBA (powder). Data obtained from the software Material Studio.
| | a (Å) | b (Å) | c (Å) |
|---|
| XRS = 0.14 from powder diffraction | 5.96 ± 0.01 | 15.32 ± 0.03 | 23.53 ± 0.05 |
| Single crystal diffraction XRS ≈ 0.18 | 5.962(1) | 15.354(2) | 22.543(3) |
| Difference RS/Single crystal (Å) | 0 | −0.03 | −0.01 |
| Difference RS/Single crystal (%) | 0 | −0.20 | −0.04 |
| Pure Salt from powder diffraction | 5.93 ± 0.01 | 15.33 ± 0.03 | 22.62± 0.05 |
| Difference RS/Pure salt(Å) | −0.03 | +0.01 | −0.91 |
| Difference RS/Pure salt (%) | −0.51 | +0.07 | +4.02 |
| Publisher’s Note: MDPI stays neutral with regard to jurisdictional claims in published maps and institutional affiliations. |
© 2021 by the authors. Licensee MDPI, Basel, Switzerland. This article is an open access article distributed under the terms and conditions of the Creative Commons Attribution (CC BY) license (https://creativecommons.org/licenses/by/4.0/).


 ,
, 


