Article

Numerical Simulation of Adsorption of Organic Inhibitors on C-S-H Gel

1
College of Mechanics and Materials, Hohai University, Xikang Road 1#, Nanjing 210098, China
2
State Key Laboratory of Water Resources and Hydropower Engineering Science, Wuhan University, Donghu South Road 8#, Wuhan 430072, China
3
State Key Laboratory of Solidification Processing, School of Materials Science and Engineering, Northwestern Polytechnical University, Youyi West Road 127#, Xian 710072, China
4
Suzhou Concrete and Cement Products Research Institute Co., Ltd., Sanxiang Road 718#, Suzhou 215000, China
*
Author to whom correspondence should be addressed.
Crystals 2020, 10(9), 742; https://doi.org/10.3390/cryst10090742
Submission received: 18 July 2020 / Revised: 20 August 2020 / Accepted: 20 August 2020 / Published: 23 August 2020
(This article belongs to the Special Issue Numerical Study of Concrete)

Abstract

:
Corrosion inhibitors are one of the most effective anticorrosion techniques in reinforced concrete structures. Molecule dynamics (MD) was usually utilized to simulate the interaction between the inhibitor molecules and the surface of Fe to evaluate the inhibition effect, ignoring the influence of cement hydration products. In this paper, the adsorption characteristics of five types of common alkanol-amine inhibitors on C-S-H gel in the alkaline liquid environment were simulated via the MD and the grand canonical Monte Carlo (GCMC) methods. It is found that, in the MD system, the liquid phase environment had a certain impact on the adsorption configuration of compounds. According to the analysis of the energy, the binding ability of MEA on the surface of the C-S-H gel was the strongest. In the GCMC system, the adsorption of MEA was the largest at the same temperature. Furthermore, for the competitive adsorption in the GCMC system, the adsorption characteristics of the inhibitors on the C-S-H gel were to follow the order: MEA > DEA > TEA > NDE > DETA. Both MD and GCMC simulations confirmed that the C-S-H gel would adsorb the organic inhibitors to a different extent, which might have a considerable influence on the organic inhibitors to exert their inhibition effects.

1. Introduction

Corrosion inhibitors have been regarded as one of the most effective anticorrosion techniques applied in reinforced concrete structures [1,2]. Due to the relatively low biological toxicity and carcinogenicity, the organic inhibitors have attracted increasing attention of researchers in recent decades. However, the practical inhibition effects of many organic inhibitors are still unclear or disputable. Omellese et al. [3] tested 80 kinds of organic inhibitors and concluded that many amine inhibitors, e.g., DMEA (dimethylethanolamine), had almost no inhibition effect in concrete while the amino acid inhibitors had a certain effect, but they still could not meet the needs of industrial applications. E. Rakanta et al. [4] studied the effect of the organic corrosion inhibitor DMEA on the corrosion of steel bar in simulated concrete pore (SCP) solution, and pointed out that DMEA showed a good inhibition effect. Morris et al. [5] studied the inhibition effect of amine inhibitors on the corrosion of reinforcement in concrete and found that only when the concentration of chloride ions in concrete was less than 0.2% (mass fraction), this kind of corrosion inhibitor could exert its effect. Thus, it is still urgent to properly evaluate the inhibition effect of the organic inhibitors.
In recent years, molecular-scale simulations have been widely used in the field of anticorrosion towards metals in acid mediums. Many researchers utilized molecular dynamics (MD) methods to investigate the active sites, chemical reactivity and the interaction between inhibitors and the metal surface so as to evaluate the inhibition effectiveness [6,7,8,9]. Khaled et al. [7] simulated the adsorption of inhibitor molecules on the Fe (0 0 1) surface in an ideal aqueous liquid to investigate their anticorrosion behavior towards mild steel. Similarly, Dehghani et al. [8] adopted the ideal aqueous liquid environment to study the adsorption tendency, energy and affinity of selected inhibitors on the steel adsorbent (i.e., Fe (1 1 0)). Sulaiman et al. [9] made a further step and started to use an electrolyte with high ionic strength as a liquid environment to imitate the corrosion process that occurred in the practical acidic environment. It should be recognized that the simulations in the ideal aqueous liquid or electrolyte solutions can meet the corrosion situations in acid environments and possibly satisfy the requirements of the estimation of the inhibition effect. In the reinforced concrete, however, the corrosion situations largely differ. On the one hand, the exposure surface would be the passive layer due to the high pH concrete pore solution. On the other hand, the surrounding cement hydrated productions might also influence the exertion of the inhibition effect [10]. However, most of the related numerical studies merely considered the adsorption process between inhibitors and steel reinforcements. For instance, Alibakhshi et al. [11] built a setup to simulate the corrosion inhibition of mild steel occurred in the presence of solvent molecules. Ormellese et al. [12] studied the inhibition effect of five kinds of organic compounds on chloride-induced corrosion of concrete by theoretical methodology to discuss the influence of their interaction with passive film on the corrosion initiation. In these studies, the researchers usually simulated the adsorption process by placing inhibitor molecules above the surface of passive film in a water or SCP environment, ignoring the influence of hydration products in cement. However, the ignorance of the effect of cement hydrated productions may largely increase the gap between the simulation and practical results.
The hydration products of concrete can adsorb the nitrogen-containing organic inhibitors when these inhibitors transport in concrete [13]. Among these hydration products, the calcium-silicate-hydrate (C-S-H) gel was the main hydration product of concrete. Knowing this, this paper intended to adopt the calcium-silicate-hydrate (C-S-H) gel to construct the nanopore of concrete as a simulated adsorption circumstance [14]. Then the behavior and ability of C-S-H gel to adsorb different organic corrosion inhibitors were simulated by the method of grand canonical Monte Carlo (GCMC) [15,16]. Meanwhile, the adsorption characteristics of corrosion inhibitors on the C-S-H gel in alkaline liquid environment were studied by molecular dynamics. This paper aims to promote the understanding of the adsorption effect of organic inhibitors in cement-hydrated system, so as to make a contribution to the proper estimation or prediction of the inhibition effects of the common organic inhibitors.

2. Model Constructions and Computational Methods

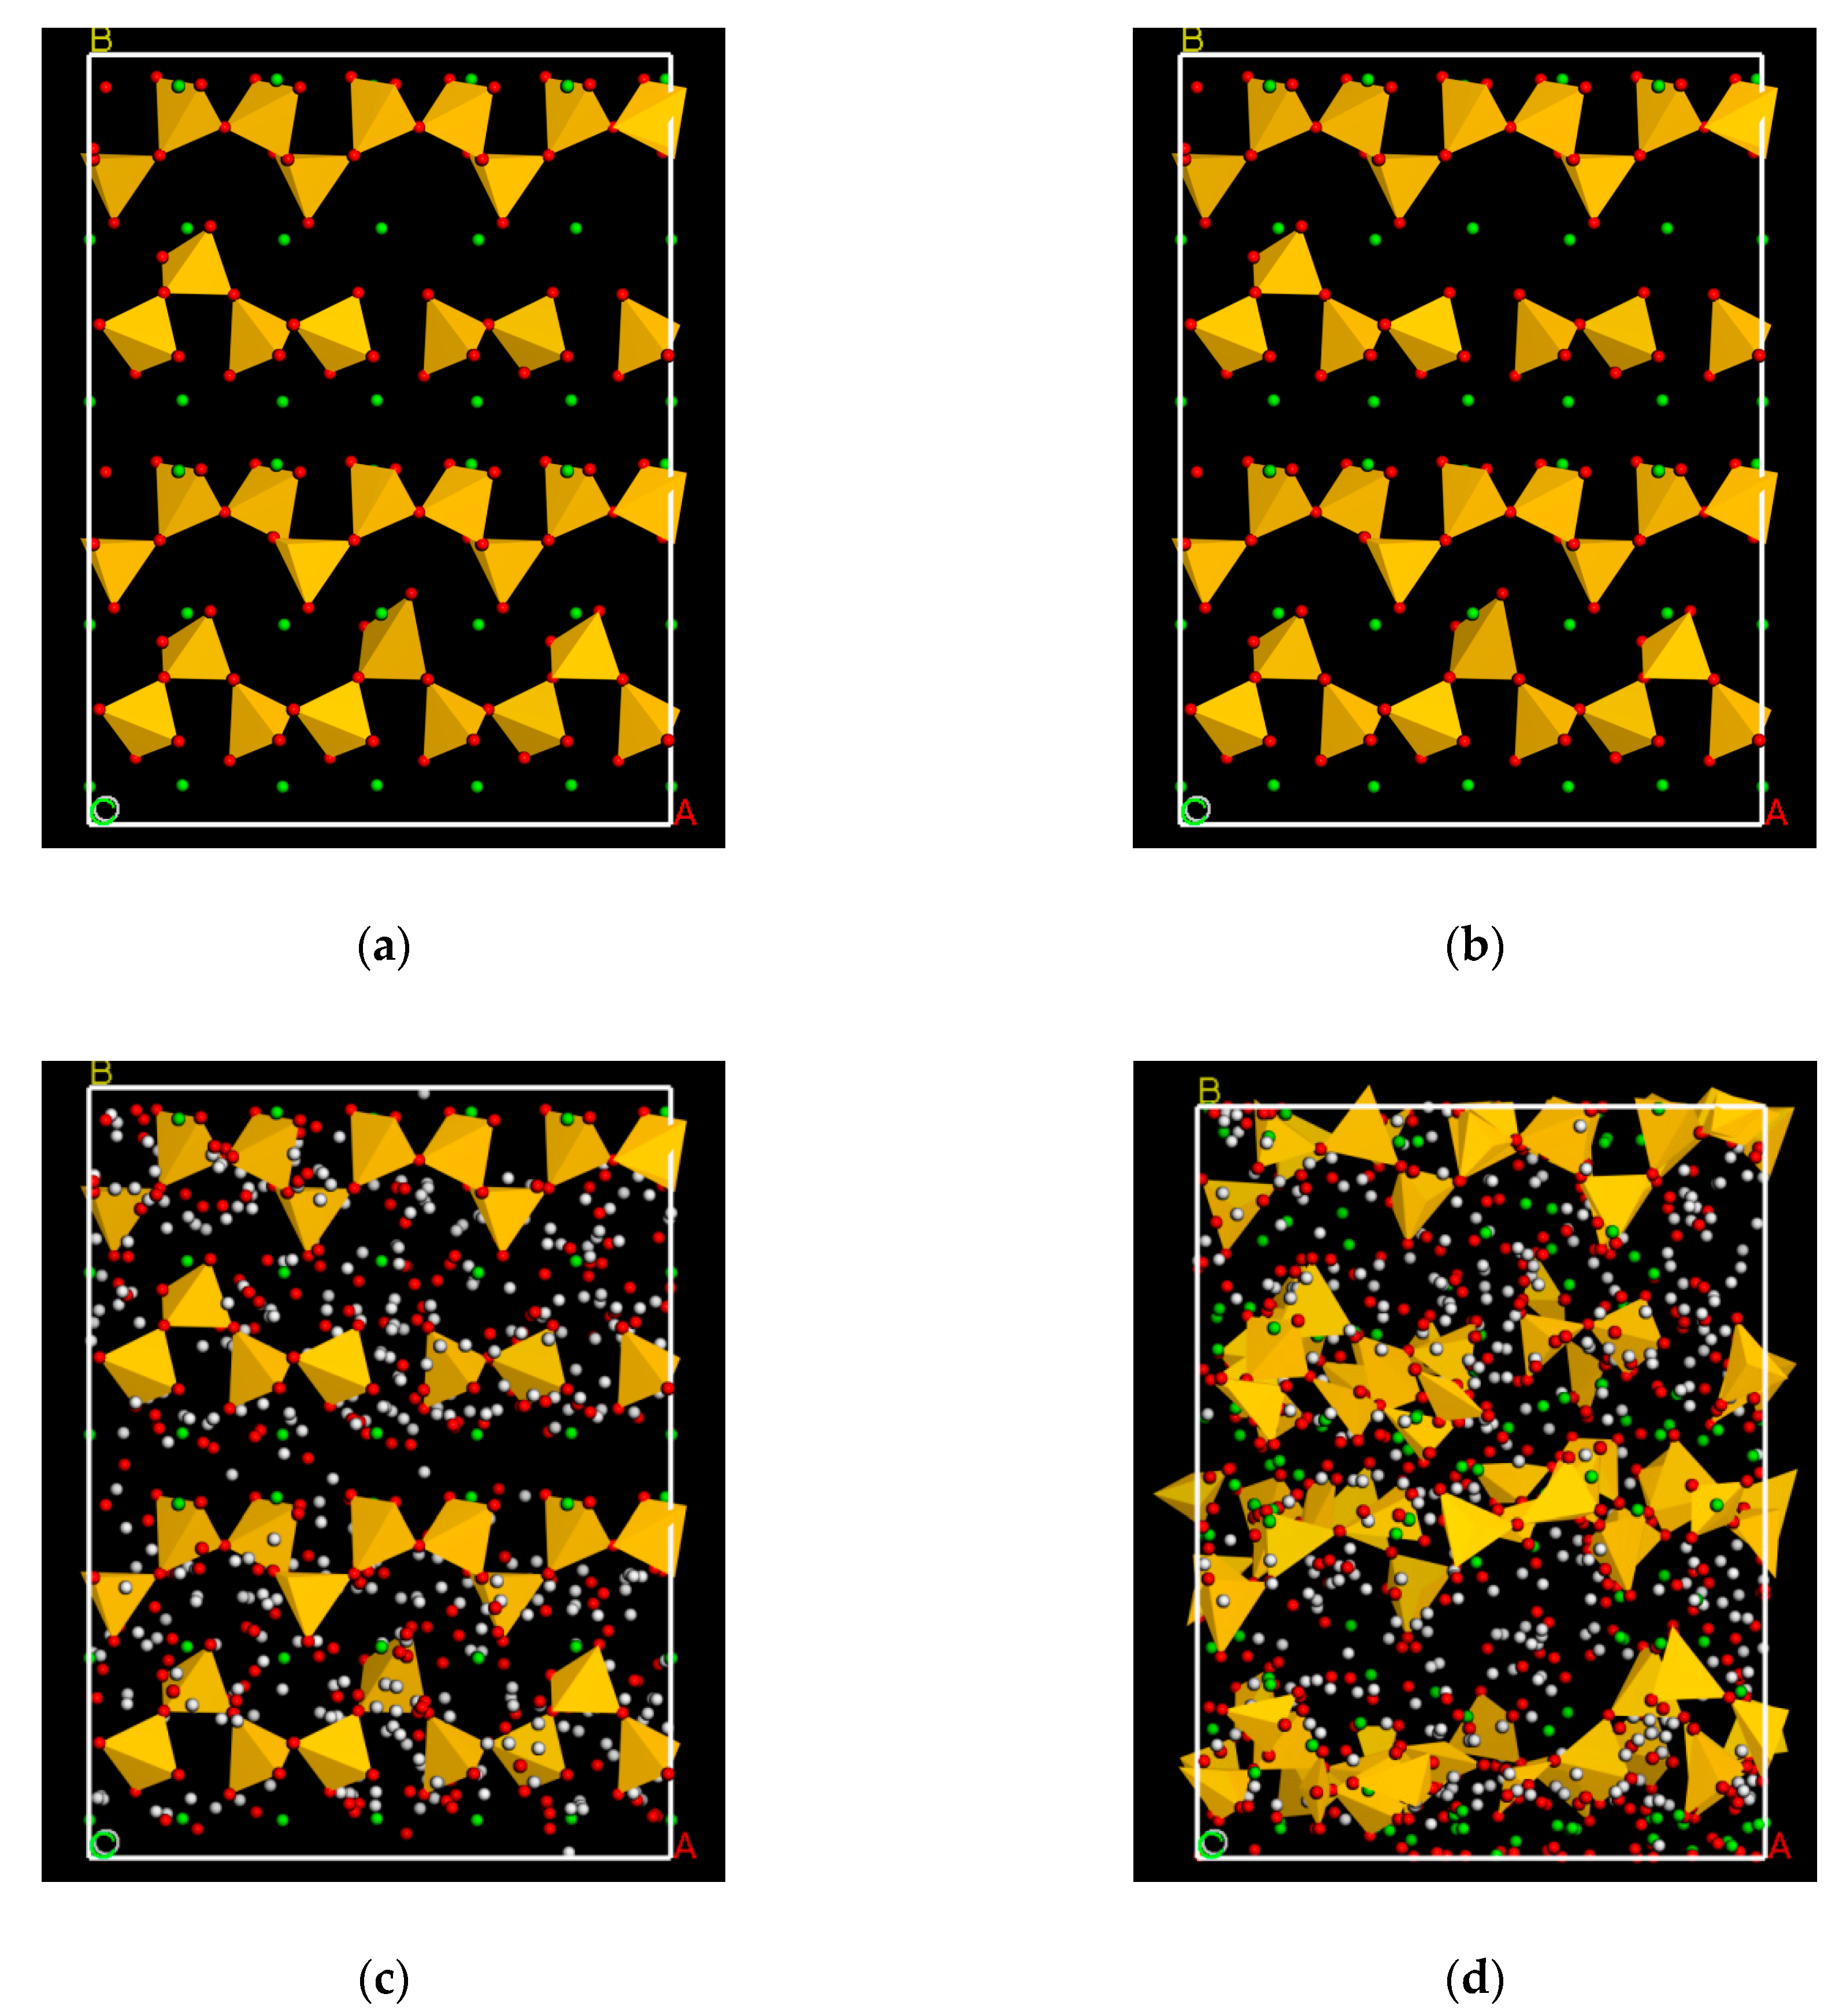
2.1. Model Constructions

The calcium-silicate-hydrate (C-S-H) gel, the most important component in concrete, accounts for the largest proportion about 60% of hydration products in cement paste, which also plays a dominate role in the structural and mechanical properties of concrete [17]. However, C-S-H gel at the nanoscale level is still not completely understood as it has complex and diverse structures. C-S-H gel is a non-stoichiometric compound in which CaO·SiO·H2O is represented in different proportions [16]. In recent years, with the development of research technologies, small angle X-ray diffraction (SAXS), small angle neutron scattering (SANS), inelastic neutron scattering (INS), extended X-ray absorption microstructural spectroscopy (EXAFS) and atomic force microscopy (AFM) have been applied to the study of the C-S-H gel and some common characteristics have been identified [18,19,20,21]. Based on the properties of the C-S-H gel obtained by XRD, NMR and SANS [22,23], Pellenq et al. [24] established a realistic model of C-S-H gel, which accorded with the true Qn distribution, density, chemical composition and characteristics similar to the jennite structure.
Based on the model construction procedures proposed by Pellenq [24], the C-S-H model was constructed by the following steps. Firstly, this paper utilized the tobermorite 11 Å structure as the initial configuration of the C-S-H gel [25,26,27]. Secondly, an amount of bridging SiO2 (/silicate chains) groups and silicate dimers were removed to satisfy the calcium-to-silicon ratio (C/S) of C-S-H gel and the Qn distribution of silicon chains [24,28]. Then the Ca/Si ratio of the configuration reached 1.44 and the model achieved Q0, Q1 and Q2 percentages of 9.7%, 19.3% and 71% respectively, which was consistent with the test result of NMR and other MD models of the C-S-H gel. In this way, the silicate skeleton structure in the dry state was obtained. Finally, the GCMC method, which is a simulation method specially used to study the adsorption, was utilized to make the dry calcium silicate skeleton absorb water. The simulation process was similar to water adsorption of the microporous structure (such as zeolite) [29]. The GCMC simulation is a dynamic process including 100,000 circles. The Compass II force field was chosen, the Ewald addition method was used for electrostatic interaction, and the atom-based method was used for the van der Waals effect and hydrogen bond interaction [30]. In this study, the ratios of water molecules exchange, conformation isomerization, rotation, translation and regeneration were set as 2, 1, 1, 1 and 0.1 respectively. After water absorption, the relaxation configuration and energy minimization were obtained and the water-to-silicon ratio of C-S-H gel reached 1.98 while its density reached 2.43 g/cm3. The C-S-H gel model construction process was shown in Figure 1.
Five types of common alkanol-amine compounds were selected as adsorbates. They all belong to the amino-alcohol based migrating corrosion inhibitors. The corrosion inhibitors migrate into the concrete through capillary and microcracks to adsorb and form films on the surface of steel bars so as to exert their inhibiting effect. Their molecular structures are given in Table 1. In this study, according to the molecular structure, the material visualizer module was used to draw the compounds and the compass II force field was utilized to optimize the geometry.

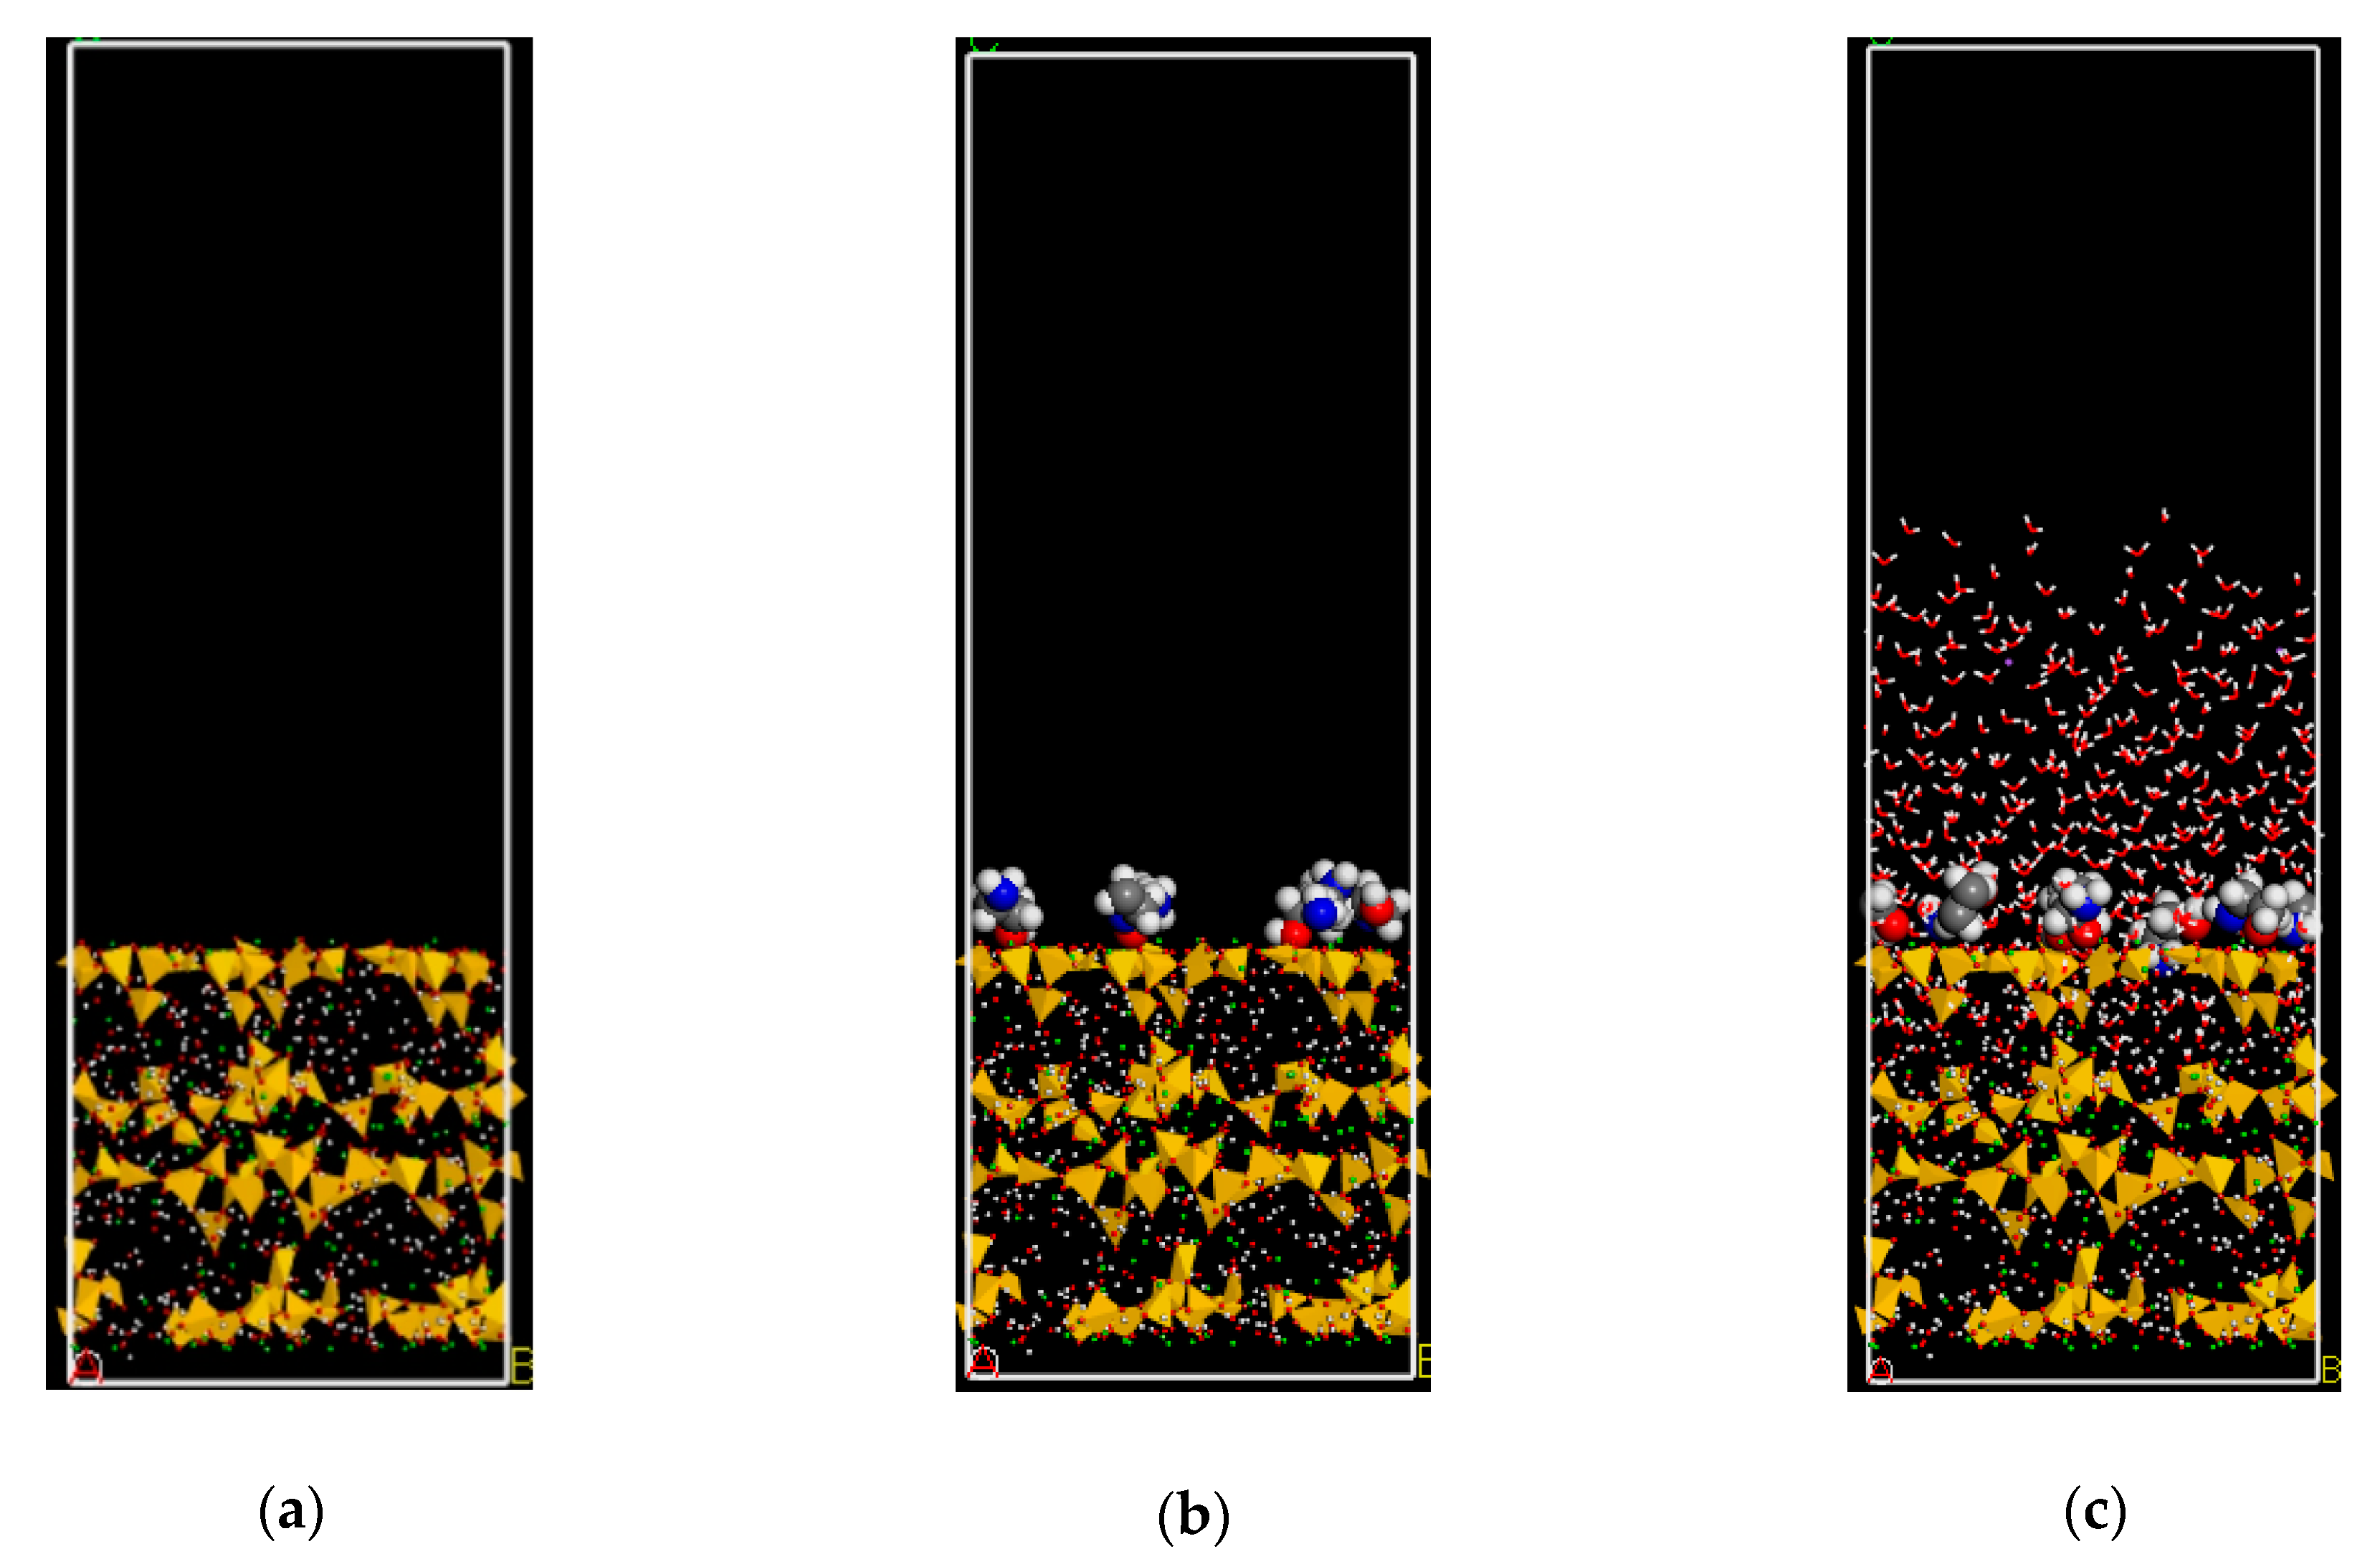
2.2. Surface Adsorption Test

In this study, the adsorption characteristics of the five types of alkanol-amine compounds on the C-S-H gel in alkaline liquid environment were studied by molecule dynamics. It is known that the carbonation and calcium leaching are two important processes that would occur on a concrete surface [31,32,33]. However, this paper is to study the adoption of organic inhibitors on the C-S-H gel, which usually occurs on the interface of cement hydration products and pore solution inside the concrete. Therefore, the effects of the carbonation and dissolution of calcium ions are preliminarily ignored in this study. Initially, the C-S-H gel was cleaved to show the surface along the (0 0 1) direction at 24.32 Å depth so as to simulate the non-bonded interaction between adsorbates and the surface of the C-S-H gel. Figure 2 shows the snapshots for the surface adsorption test. As shown in Figure 2, the lower part of the model consists of a fixed C-S-H gel with a thickness of 24.32 Å and 6 adsorbates were placed on the surface. The GCMC method was used to search for the best adsorption site in the range of 10 Å on the upper surface [34]. After that, 351 water molecules, 2 Na+ and OH- were added, in order to simulate the concrete pore solution environment with pH 13.5 including 1.0 mol/L adsorbates. The crystal cell adopted three-dimensional periodic boundary conditions. A vacuum space thicker than 25 Å was laid on the top layers so as to avoid the influence of the periodic cell above [35]. Finally, the MD simulations were carried out using the compass II force field and 20 ps NVT (isothermal-isasteric ensemble) running for the system.

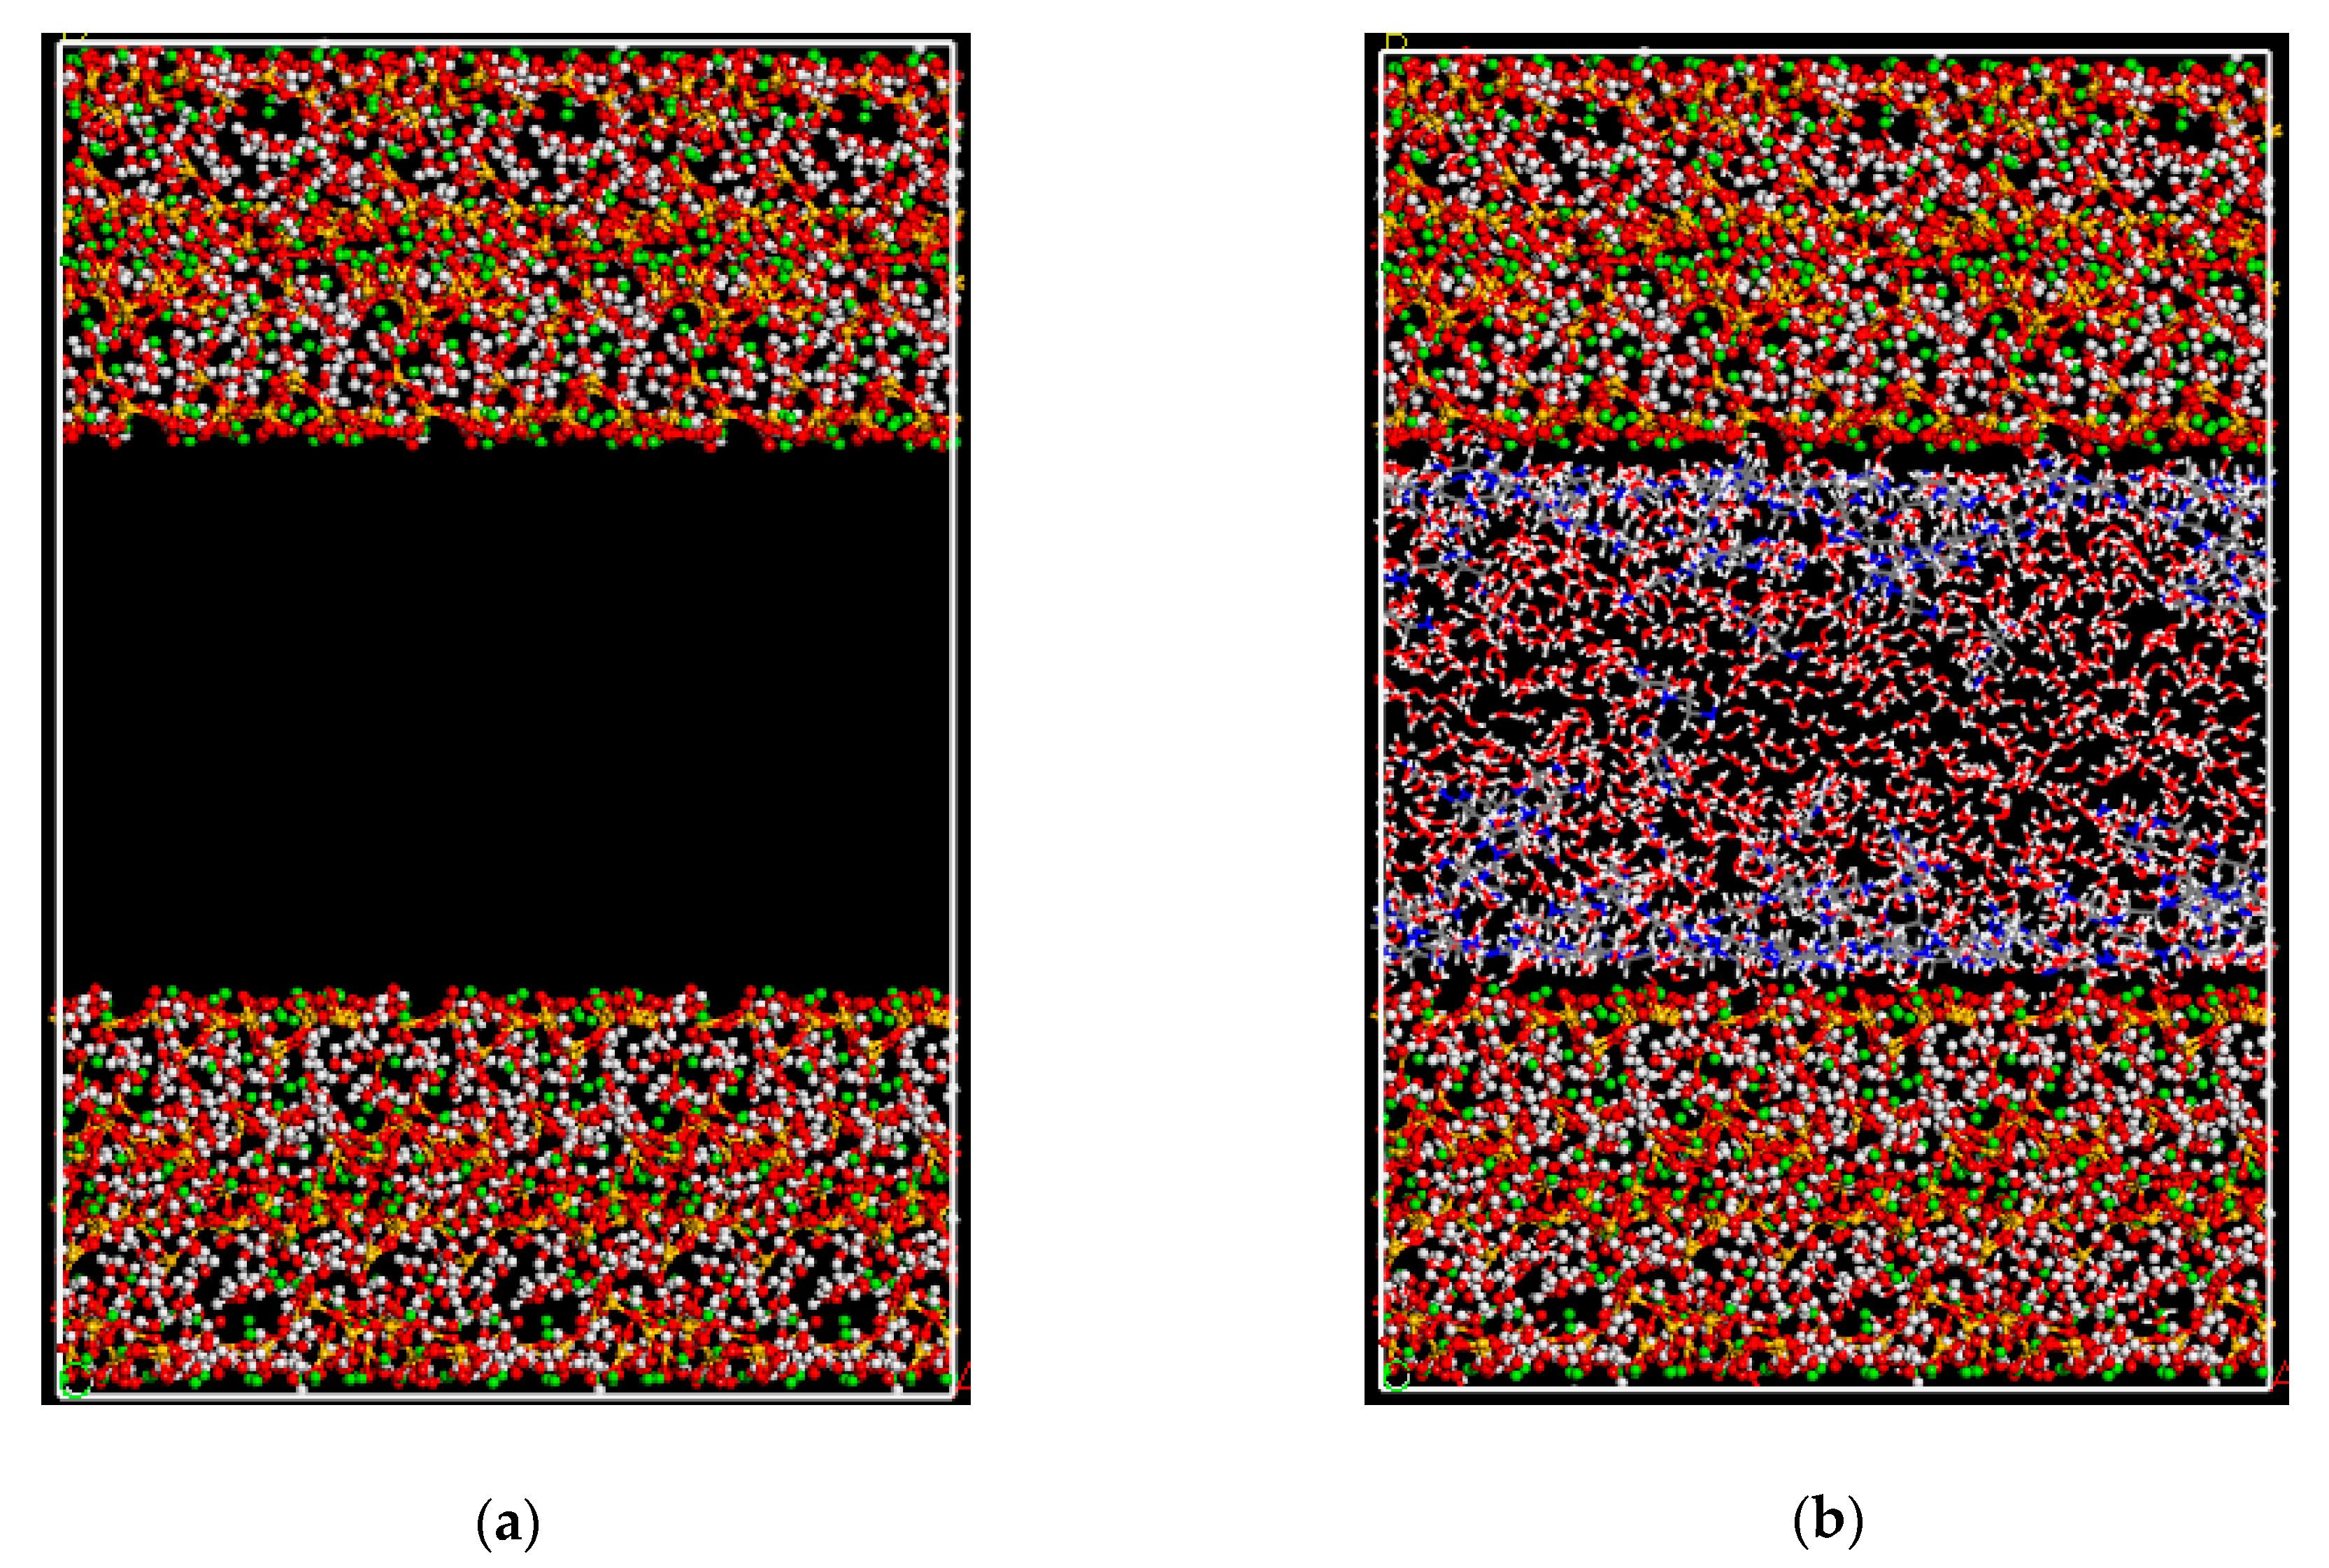
2.3. Pore Adsorption Test

In order to reduce the statistical errors caused by the size effect and make the simulation closer to the pore structure of concrete, a larger C-S-H gel channel was constructed. As depicted in Figure 3, under the condition of periodic boundary, the C-S-H pore consisted of two parallel layers of C-S-H gel with 24.32 Å thickness and the surface of C-S-H gel layer was 55.12 Å × 52.97 Å. The upper and lower gel surfaces were spaced 35 Å for simulating the concrete pore [36]. Subsequently, the GCMC simulations were applied into the structure and energy analysis [33]. The adsorbates and water molecules were regarded as stiff small molecules. According to the partial pressure of 1.0 mol/L adsorbate solution, the two-component adsorption simulations of five types of alkanol-amine compounds were carried out respectively. In order to observe the competitive strength of different component adsorption more intuitively, six-component adsorption simulation (H2O 110 kPa + MEA 2 kPa + DEA 2 kPa + TEA 2 kPa + NDE 2 kPa + DETA 2 kPa) were carried out. The minimum energy structure was output. In addition, this paper is to fundamentally study the adsorption of organic inhibitor molecules on C-S-H gel. In MD, we simulated the adsorption behavior of the single organic inhibitor molecule on C-S-H gel. In contrast, we simulated as many inhibitor molecules as possible to adsorb on the surface of C-S-H gel in GCMC to study the adsorption characteristics of organic inhibitor molecules.

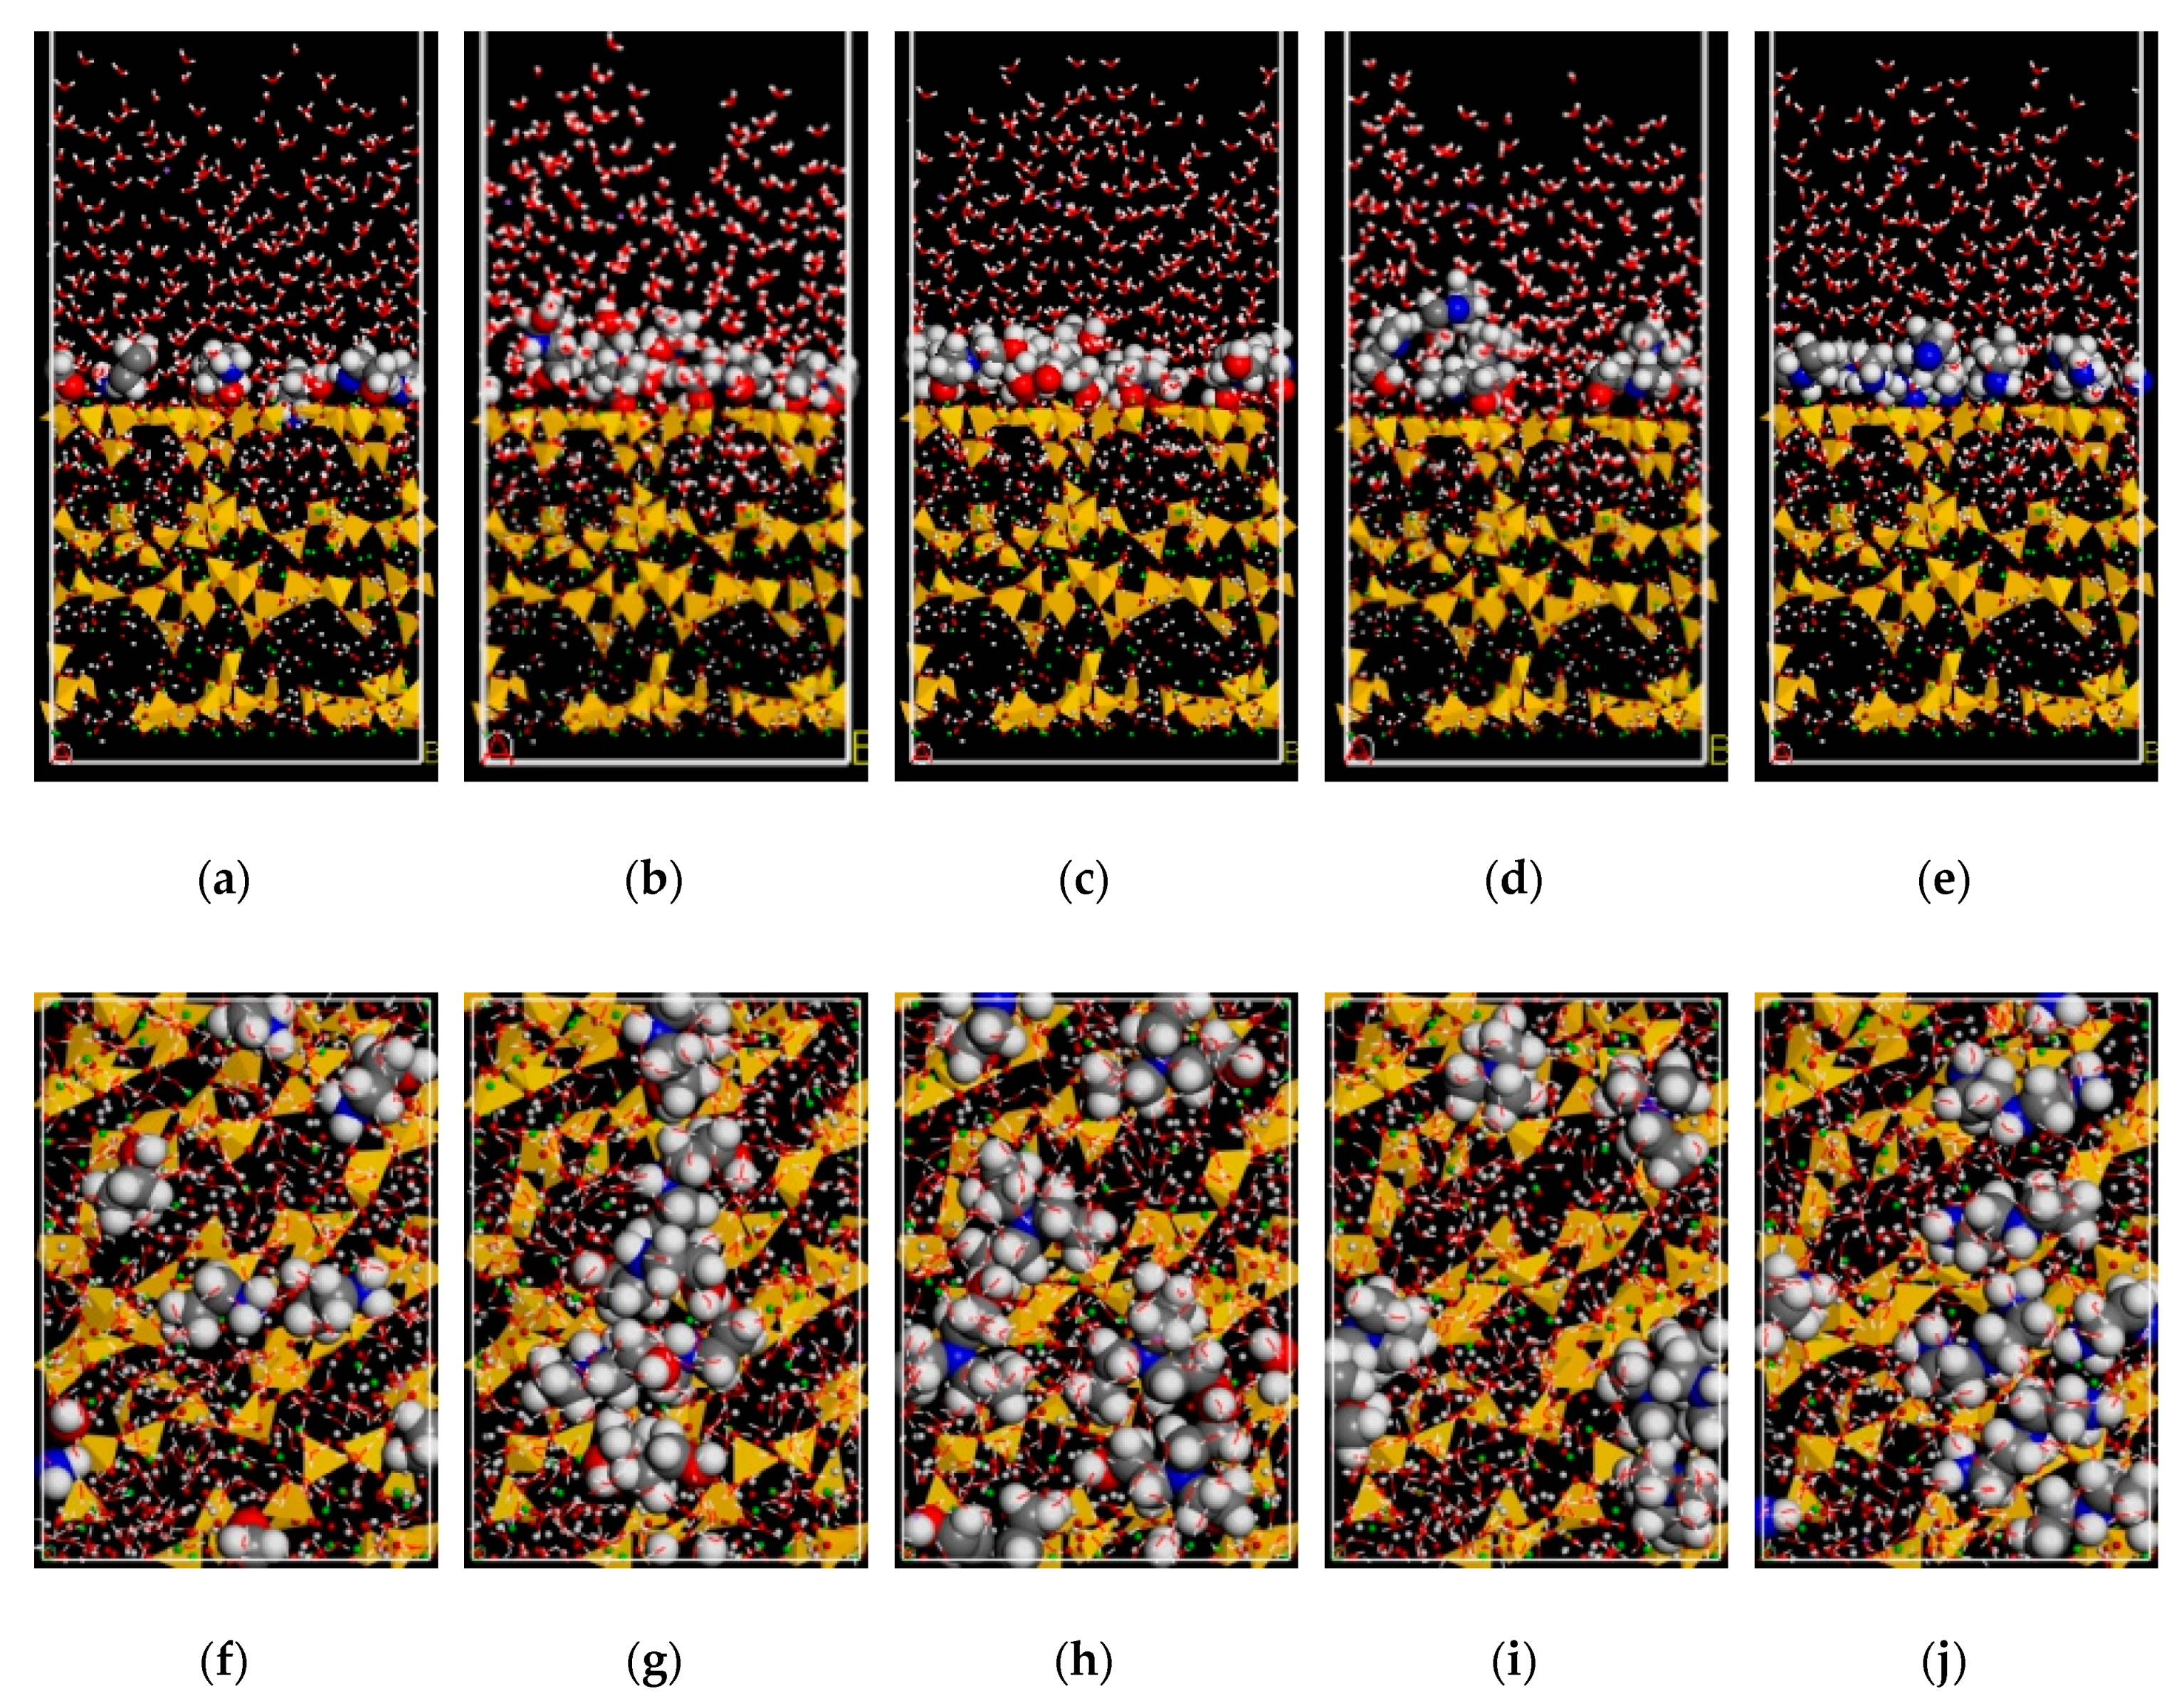
3. Simulation Results of Surface Adsorption System

3.1. Adsorption Morphology

The changes of energy with time are shown in Figure 4. It can be seen that the energy of the system decreased rapidly within 2 ps. Finally, the energy of the system remained basically unchanged, and the change range of total energy was less than 1‰. Therefore, it can be considered that the system had reached the equilibrium state. At the equilibrium state of dynamic simulations, the final interfacial configuration of the surface adsorbing inhibitor could be obtained. Figure 5 shows the final balancing snapshots of five types of alkanol-amine compounds after molecular dynamics simulation. As shown in Figure 5, the five types of inhibitor molecules have parallel adsorption on the surface of C-S-H gel in the way of flat orientations. It is found that their structures all have deformation phenomenon in different degrees. Most of the compounds were almost planar and parallel to the C-S-H gel surface. However, in the liquid phase, the compounds were affected both by the adsorption force of the C-S-H gel and the solvent. As a result, some compounds did not adhere to the surface of the C-S-H gel. The final equilibrated mode and the changes of the energy were different from those under vacuum condition [37], which indicated that the liquid phase environment would have a certain impact on the adsorption configuration of compounds. Hence, for making a more precise simulation, it is necessary to construct a solvent environment closer to the pore liquid of concrete.

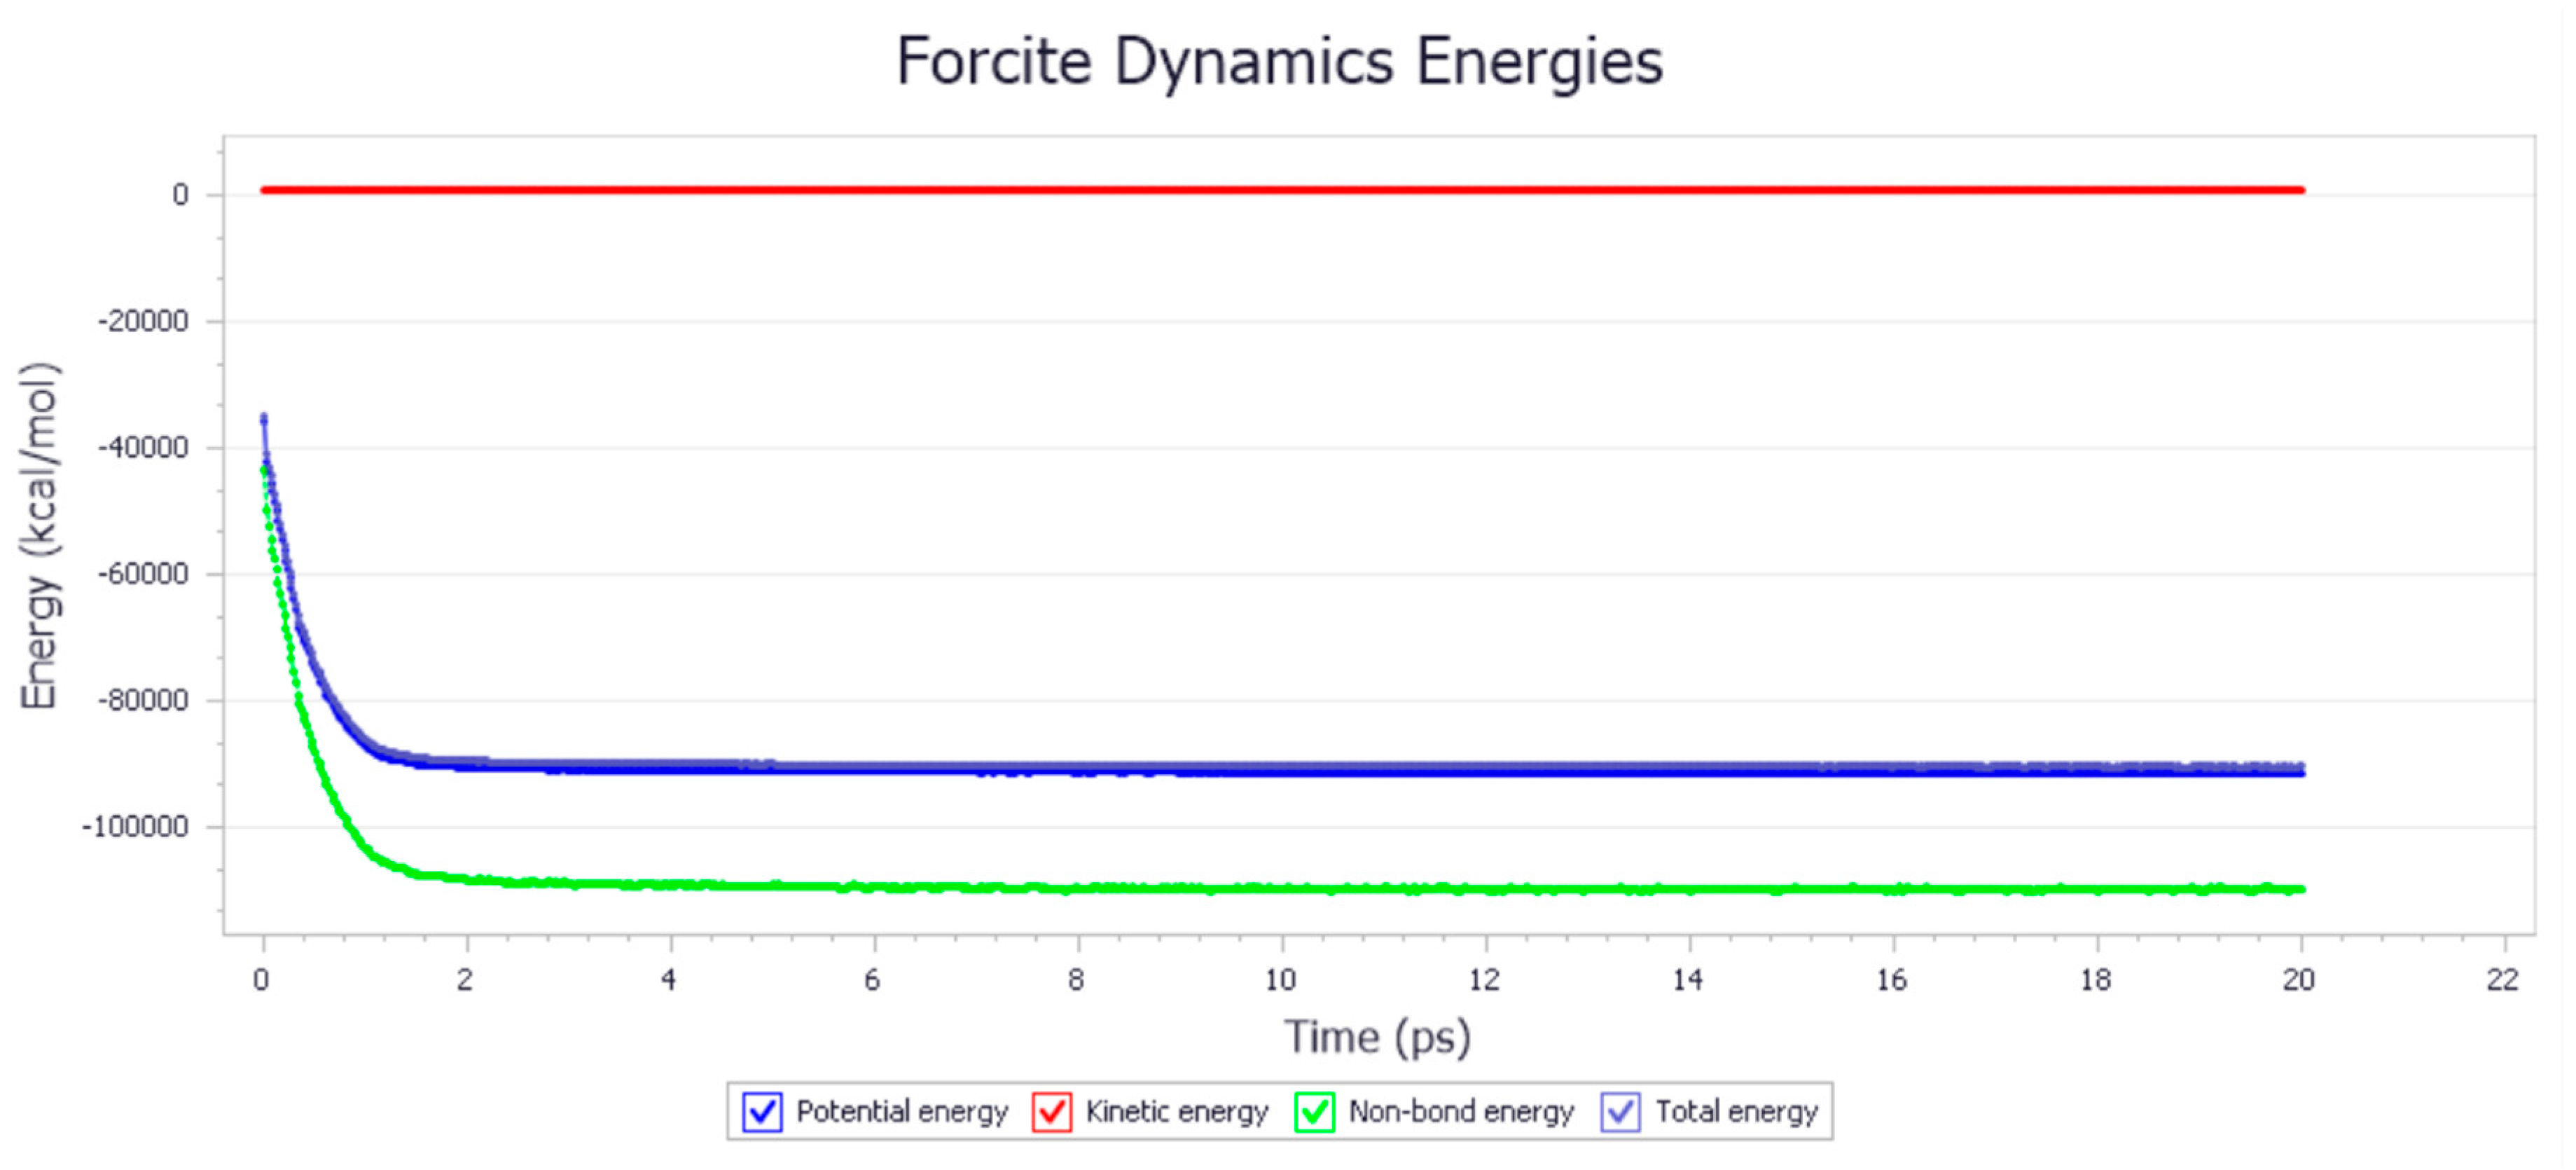
3.2. Energy Analysis

In order to quantitatively analyze the adsorption of the inhibitor molecules, the adsorption energy (EAds) is used to characterize the interaction strength between the molecules and the surface of the C-S-H gel [6]. While the solvation energy (Esol) is used to characterize the interaction between molecules and the concrete pore solution [38]. These three energies can be calculated by the following equations:
E A d s = E i n h i / c s h ( E i n h i + E c s h )
E s o l = E i n h i / w a t e r ( E i n h i + E w a t e r )
where, Einhi/CSH is the total potential energy of the whole simulated system without aqueous solution, Einhi is the internal energy of the inhibitor molecules after adsorption, ECSH is the surface energy of the isolated C-S-H gel, Einhi/water is the total potential energy of the whole simulated system without the C-S-H gel and Ewater is the energy of the solvent system. The above parameters were calculated by the first-principles using the Forcite module. The calculated results of the energy at their most stable conformation are shown in Table 2. From Table 2, it can be seen that the adsorption energy of the five types of inhibitors was all negative, indicating that the inhibitors could adsorb on the solid surface by reducing the system energy in order to achieve the maximization of the adsorption energy of system and the lowest state of the energy of the system [39]. The molecules could be spontaneously adsorbed on the surface of the solid. The more negative adsorption energy embodied the adsorption between molecules and the surface of C-S-H gel were more prone to occur and more difficult to be destroyed after adsorption [40]. The solvation energy of the inhibitors was also negative, which indicated that the inhibitors tend to dissolve in alkaline aqueous solution. It is noticed that the solvation energy was obviously more positive than the corresponding adsorption energy, indicating the dissolve process could not forbid the spontaneous occurrence of the adsorption process [38]. However, the combination of the inhibitors and the solvent could weaken its binding ability to the C-S-H gel surface. Hence, the difference between the adsorption energy and solvent energy could represent the binding ability of the inhibitor molecules and the surface of the C-S-H gel in alkaline concrete pore solution environment. It is found that, although the adsorption capacity of TEA was the largest, the binding effect of the solvent was also stronger, which led to the difficulty of the removal of the binding of water molecules. Thus, its binding ability to the surface of the C-S-H gel was not the strongest under the solvent environment. In the alkaline concrete pore solution environment, the binding ability between the five types of inhibitor molecules and the surface of C-S-H gel could be ranged according to the difference as: MEA > DEA > TEA > NDE > DETA. According to the Eads value, the trend became TEA > MEA > DEA > DETA > NDE. Thus, the liquid environment truly impacted the adsorption of inhibitor molecules on the C-S-H gel.

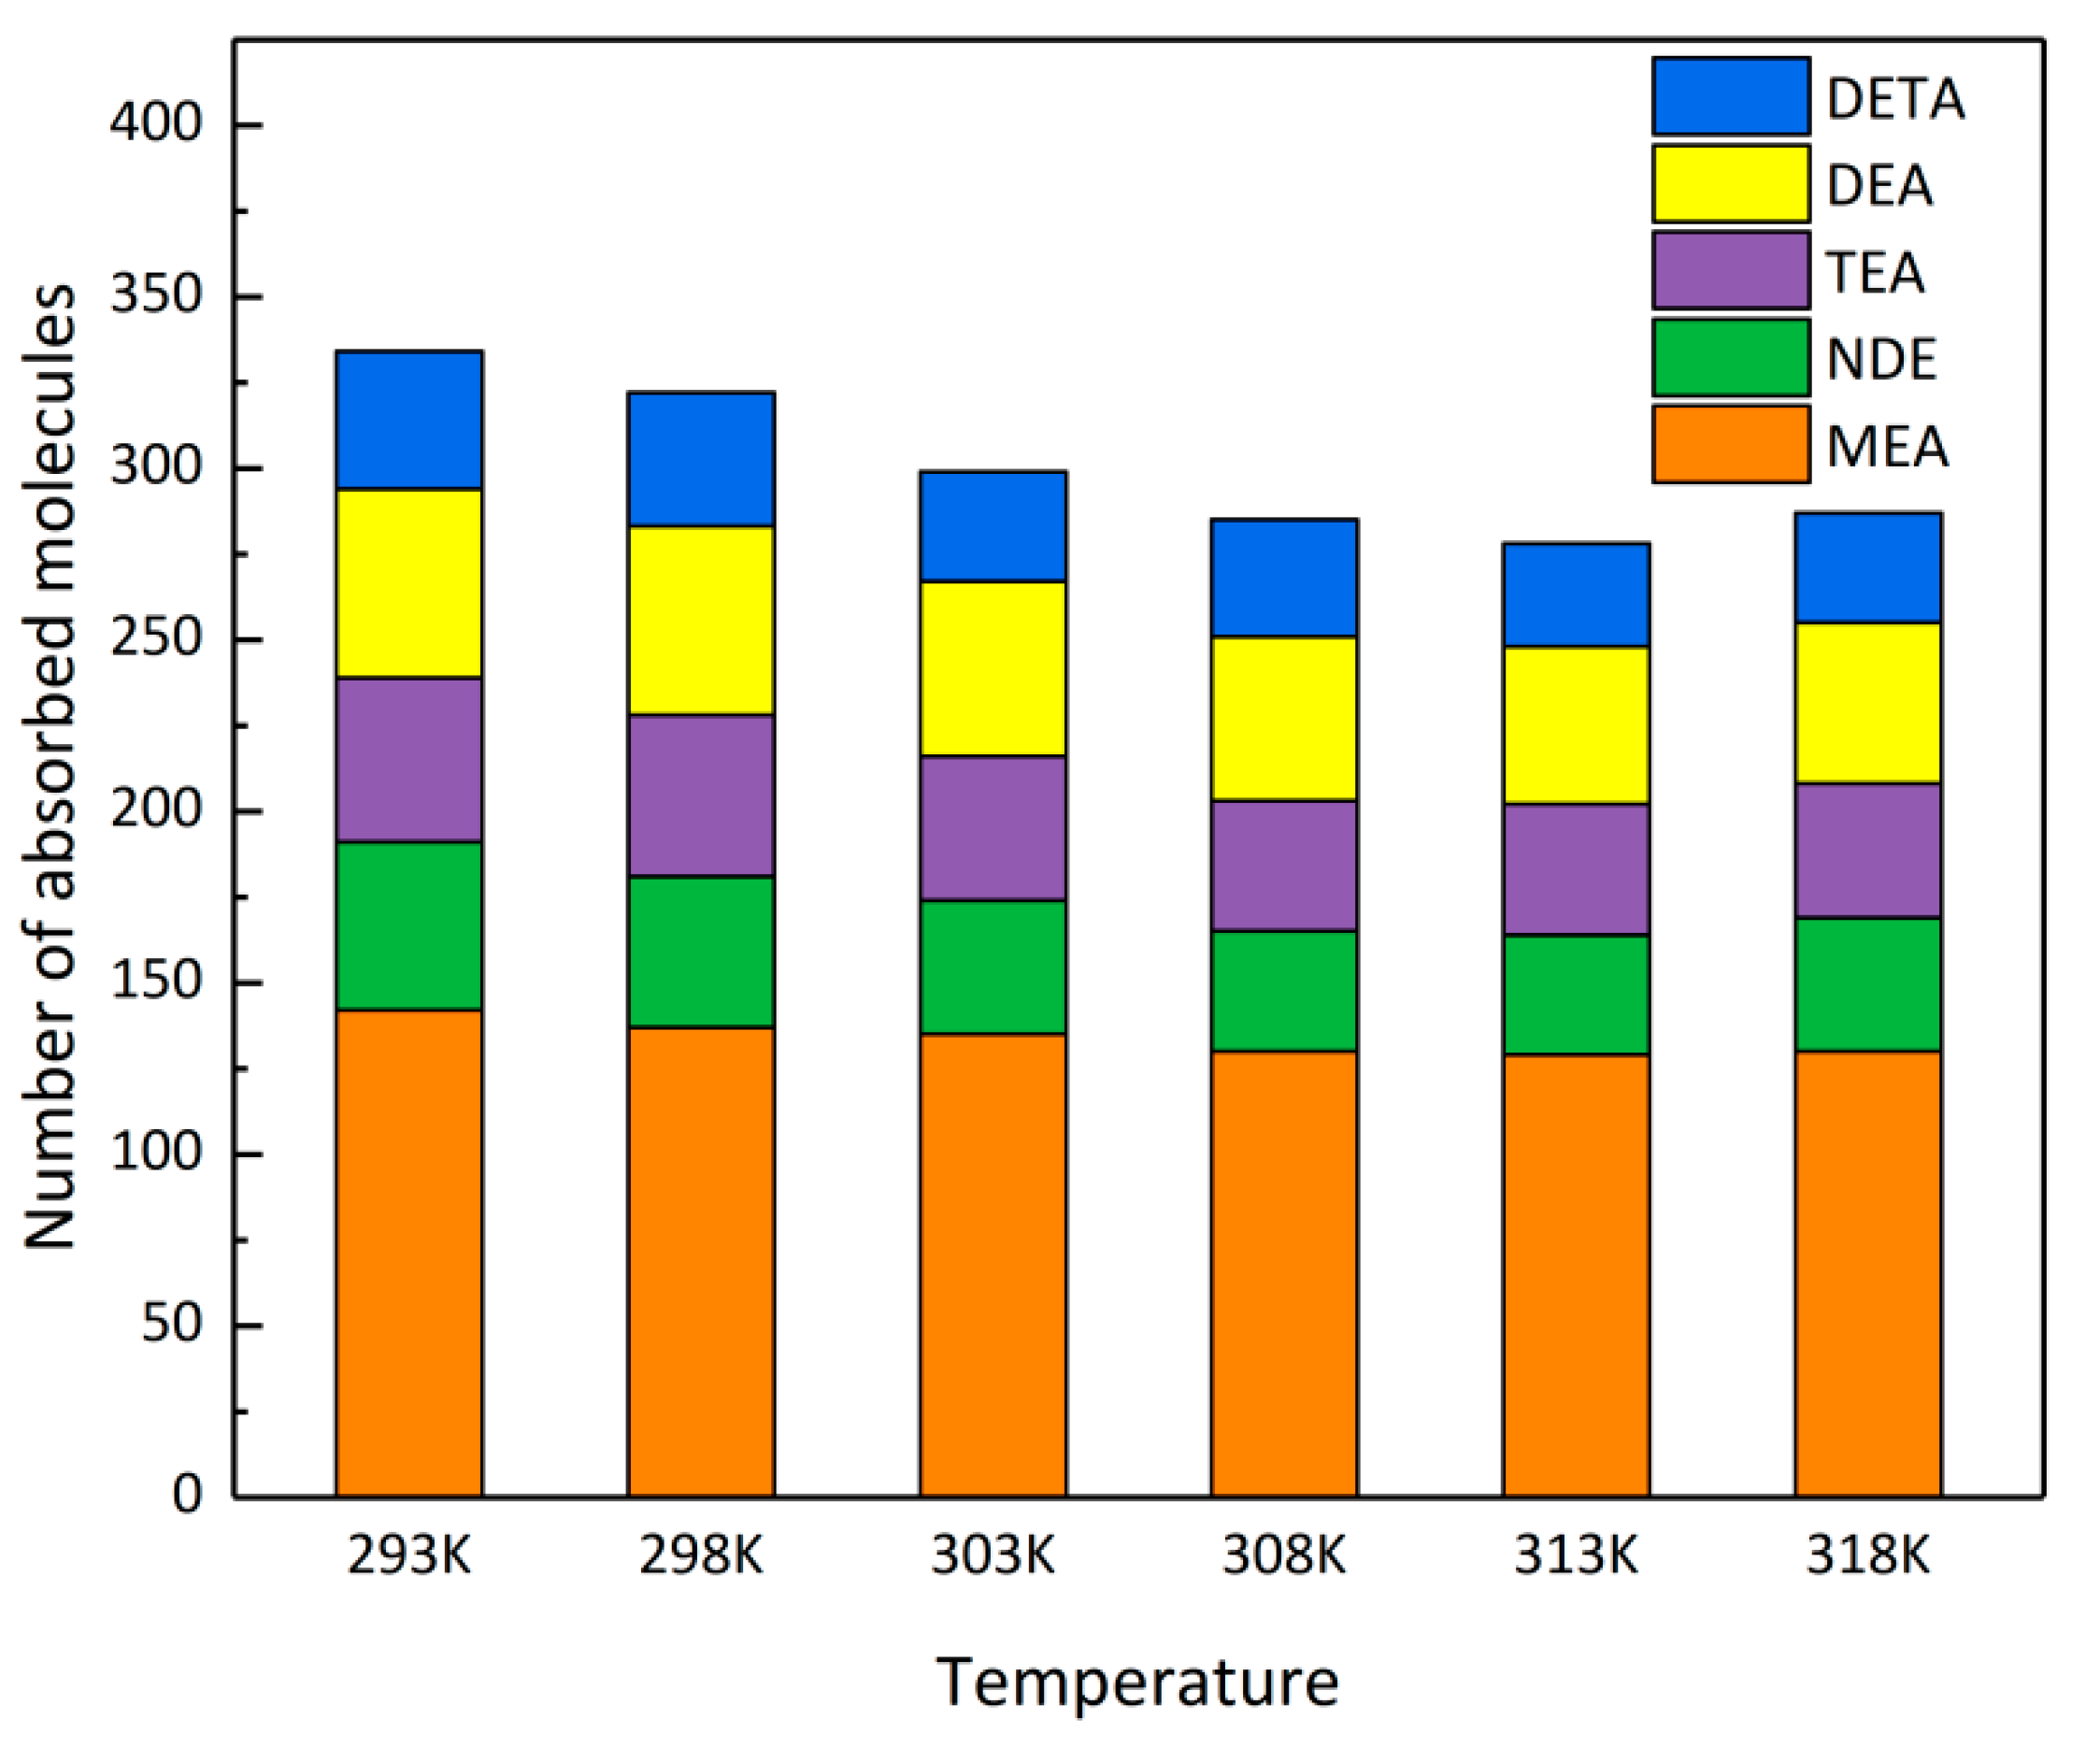
4. The Grant Canonical Monte Carlo System

4.1. Adsorption Quantity Analysis

Mixing different components together for adsorption could make a more intuitive comparison of the adsorption capacity of different components. Set the partial pressure of each adsorption component as: H2O 110 kPa, MEA 2 kPa, DEA 2 kPa, TEA 2 kPa, NDE 2 kPa and DETA 2 kPa. At the same time, in order to test the effect of temperature on adsorption, the set of simulations was carried out every 5 K in the temperature range of 293–318 K. The adsorption capacities of five types of alkanol-amine compounds at different temperature are shown in Figure 6. Adsorption selectivity of a to b can be calculated by the following equations:
S = x a / y a x b / y b
where, S is adsorption selectivity, xa is the concentration of a in the adsorbed phase, ya is the partial pressure of a in the adsorbed phase (2 kPa adopted in this research), xb is the concentration of b in the adsorbed phase and yb is the partial pressure of b in the adsorbed phase (2 kPa adopted in this research) [41]. The calculated results are shown in Table 3. The adsorption selectivity of each inhibitor molecules to water was greater than 1, indicating that they were easily precipitated from aqueous solution and adsorbed on the C-S-H gel. At the same temperature, the adsorption of the inhibitor MEA was the most and more than twice of the other four inhibitors, which indicated the adsorption of the inhibitor MEA was the largest. With the increase of the temperature, the adsorption of water molecules increased while that of inhibitor molecules presented decreasing tendency, indicating they were exothermic physical adsorption process. The five types of the inhibitor molecules placed at further distances with respect to each other resulting in weaker interactions at a higher temperature [42]. Therefore, if temperature increased from 298 to 333 K, the adsorption effect between the inhibitor molecules and the surface of the C-S-H gel decreased. It is found that the adsorption processes of five types of the inhibitor molecules were all spontaneous, which was exothermic at a different temperature, indicating that a high temperature was not conducive to adsorption.
Figure 6 presents the adsorption quantity at a different temperature. As shown in Figure 6, when the temperature was 318 K, the adsorption capacity increased slightly, this might be caused by the increase of the total amount of adsorbed materials. However, if we observe their adsorption selectivity to water in Table 3, it can be easily found that most of them decreased with the increase of temperature. According to the competitive adsorption quantity, the binding ability between the five types of inhibitor molecules and the surface of the C-S-H gel in the alkaline concrete pore fluid environment were to follow the order: MEA > DEA > TEA > NDE > DETA.

4.2. Energy Analysis

In order to verify the energy change trend in the relatively big system and get close to the structure of the internal channel in concrete, we used the method of GCMC to simulate the adsorption process in the larger C-S-H gel channel. Table 4 lists the changes of total energy, van der Waals energy, electrostatic energy and intramolecular energy before and after adsorption in each adsorbate system under a different temperature. As clearly shown in Table 4, with the increase of temperature, the absolute values of electrostatic force showed a downward trend. It also can be seen in the Table 4 that the negative value of the electrostatic energy is relatively high, which might be able to break the optimum state of the adsorption caused by the vdW (Van Der Waals) energy and the intramolecular energy. Then the values of the vdW energy and the intramolecular energy might become a little positive. The electrostatic energy was negative, which indicated that the adsorption process mainly depended on the electrostatic force, and the adsorption effect became stronger with the increase of the absolute values. Meanwhile, the absolute values of the total energies of five types of inhibitor molecules all decreased and the adsorption function diminished, which indicated the high temperature would restrain the physical adsorption. When adsorbing a single inhibitor molecule, van der Waals energy mainly came from dipole–dipole attraction, induction force and dispersion force caused by the reversal of permanent dipoles [43]. Van der Waals energy of inhibitor molecules MEA and TEA was strong. This might be because their spatial configurations were more conducive to their combination and adsorption on the C-S-H gel. For the intramolecular energy, the increase of the intramolecular energy reflected the amount of adsorption. It can be seen from Table 4 that with the increase of temperature, the intramolecular energy of each inhibitor molecule did not change much, which also showed that the adsorption of each inhibitor in Table 3 had little difference with the change of temperature. The magnitude of the total energy could reflect the level of stability of the equilibrium state of the system. Any system had a tendency to decrease energy. When the energy was growing smaller, the system became more stable. Meanwhile, the adsorption of the inhibitor molecules on the C-S-H gel was more likely to occur. At 298 K, the total energies of five types of inhibitor molecules MEA, NDE, TEA, DEA and DETA adsorbed by C-S-H gel were −64690.743 kcal·mol−1, −51813.292 kcal·mol−1, −53083.227 kcal·mol−1, −53338.167 kcal·mol−1 and −53106.886 kcal·mol−1 respectively. It is found that the adsorption system of MEA was the most stable.

5. Conclusions

In this study, the adsorption characteristics of the five alkanol-amine compounds on the C-S-H gel in the alkaline liquid environment were studied by molecule dynamics and GCMC. Conclusions can be summarized as follows:
(1) In the MD system, the five types of inhibitor molecules were almost planar and parallel to the surface of the C-S-H gel. It is found that their molecular structures all had the deformation phenomenon in different degrees. In the liquid phase, the compounds were affected both by the adsorption force of the C-S-H gel and the solvent. The liquid phase environment would have a certain impact on the adsorption configuration of compounds.
(2) According to the analysis of the energy in the MD system, it can be concluded that the inhibitors tended to dissolve in the alkaline aqueous solution. The solvation energy was obviously more positive than the corresponding adsorption energy and the dissolve process could not forbid the spontaneous occurrence of the adsorption process. In the alkaline concrete pore solution environment, the binding ability of MEA on the surface of C-S-H gel was the strongest. Considering the effect of the solvent, the binding ability of TEA on the surface of C-S-H gel was the strongest.
(3) In the GCMC system, it is found that all the five types of inhibitor molecules were easily precipitated from aqueous solution and adsorbed on the C-S-H gel. At the same temperature, the adsorption of the inhibitor MEA was the largest and more than twice of the other four inhibitors. When the temperature increased from 298 to 333 K, the adsorption of water molecules increased while that of inhibitor molecules presented a decreasing tendency.
(4) For the competitive adsorption of different types of inhibitor molecules in the GCMC system, the binding ability among the five types of inhibitor molecules on the C-S-H gel were to follow the order: MEA > DEA > TEA > NDE > DETA.

Author Contributions

Conceptualization, Z.S. and Q.L.; Data curation, H.C. and X.L.; Formal analysis, H.C. and Y.Z.; Funding acquisition, Z.S. and Q.P.; Investigation, Q.L. and Y.Z.; Methodology, Z.S. and Q.L.; Project administration, Z.S. and X.L.; Resources, Z.S. and Q.P.; Software, X.L.; Writing—original draft, H.C. and N.X.; Writing—review and editing, Z.S. and Q.L. All authors have read and agreed to the published version of the manuscript.

Funding

This investigation is financed by the National Natural Science Foundation of China (Nos.51609075 and 51778209), the National Key Research and Development Program of China (2018YFC15087040), the Fundamental Research Funds for the Central Universities (B200202123), the Open Research Fund of Guangxi Key Laboratory of Water Engineering Materials and Structures (GXHRI-WEMS-2019-04, GXHRI-WEMS-2019-05).

Acknowledgments

We also wish to thank Jiajia Wang, College of mechanics and materials, Hohai University, for his guidance to some of our numerical work.

Conflicts of Interest

All authors of this article declare no conflicts of interest.

References

  1. Bertolini, L.; Elsener, B.; Pedeferri, P.; Redaelli, E.; Polder, R.B. Corrosion of Steel in Concrete: Prevention, Diagnosis, Repair; Wiley-VCH Verlag GmbH & Co. KGaA: Weinheim, Germany, 2013; Volume 49, pp. 4113–4133. [Google Scholar]
  2. Liu, Q.Y.; Song, Z.J.; Cai, H.C.; Zhou, A.P.; Wang, W.Y.; Jiang, L.H.; Liu, Y.Q.; Zhang, Y.J.; Xu, N. Effect of Ultrasonic Parameters on Electrochemical Chloride Removal and Rebar Repassivation of Reinforced Concrete. Materials 2019, 12, 2774. [Google Scholar] [CrossRef] [Green Version]
  3. Ormellese, M.; Lazzari, L.; Goidanich, S.; Fumagalli, G.; Brenna, A. A study of organic substances as inhibitors for chloride-induced corrosion in concrete. Corros. Sci. 2009, 51, 2959–2968. [Google Scholar] [CrossRef]
  4. Rakanta, E.; Zafeiropoulou, T.; Batis, G. Corrosion protection of steel with DMEA-based organic inhibitor. Constr. Build. Mater. 2013, 44, 507–513. [Google Scholar] [CrossRef]
  5. Morris, W.; Vico, A.; Vazquze, M. Corrosion of reinforcing steel by means of concrete resistively measurements. Corros. Sci. 2002, 44, 81–99. [Google Scholar] [CrossRef]
  6. Liu, Q.Y.; Song, Z.J.; Han, H. A novel green reinforcement corrosion inhibitor extracted from waste Platanus acerifolia leaves. Constr. Build. Mater. 2020, 260, 119695. [Google Scholar] [CrossRef]
  7. Khaled, K.F.; El-Maghraby, A. Experimental, Monte Carlo and molecular dynamics simulations to investigate corrosion inhibition of mild steel in hydrochloric acid solutions. Arab. J. Chem. 2014, 7, 319–326. [Google Scholar] [CrossRef]
  8. Dehghani, A.; Bahlakeh, G.; Ramezanzadeh, B.; Karati, M.R. Potential role of a novel green eco-friendly inhibitor in corrosion inhibition of mild steel in HCl solution: Detailed macro/micro-scale experimental and computational explorations. Constr. Build. Mater. 2020, 245, 118464. [Google Scholar] [CrossRef]
  9. Sulaiman, K.O.; Onawole, A.T.; Faye, O.; Shuaib, D.T. Understanding the corrosion inhibition of mild steel by selected green compounds using chemical quantum based assessments and molecular dynamics simulations. J. Mol. Liq. 2019, 279, 342–350. [Google Scholar] [CrossRef]
  10. Zhu, Y.Y.; Ma, Y.W.; Hu, J.; Zhang, Z.M.; Huang, J.Z.; Wang, Y.Y.; Wang, H.; Cai, W.X.; Huang, H.L.; Yu, Q.J.; et al. Adsorption of organic core-shell corrosion inhibitors on cement particles and their influence on early age properties of fresh cement paste. Cem. Concr. Res. 2020, 130, 106000. [Google Scholar] [CrossRef]
  11. Alibakhshi, E.; Ramezanzadeh, M.; Bahlakeh, G.; Ramezanzadeh, B.; Mahdavian, M.; Motamedi, M. Glycyrrhiza glabra leaves extract as a green corrosion inhibitor for mild steel in 1 M hydrochloric acid solution: Experimental, molecular dynamics, Monte Carlo and quantum mechanics study. J. Mol. Liq. 2018, 255, 185–198. [Google Scholar] [CrossRef]
  12. Ormellese, M.; Perez, E.A.; Raffaini, G.; Ganazzoli, F.; Lazzari, L. Inhibition mechanism in concrete by organic substances: An experimental and theoretical study. J. Mater. Sci. Eng. 2010, 13, 66–77. [Google Scholar]
  13. Zheng, H.; Li, W.; Ma, F.; Kong, Q. The performance of a surface-applied corrosion inhibitor for the carbon steel in saturated Ca(OH)2 solutions. Cem. Concr. Res. 2014, 55, 102–108. [Google Scholar] [CrossRef]
  14. Li, Z. Structure of concrete. In Proceedings of the Advanced Concrete Technology; John Wiley & Sons Inc.: Hoboken, NJ, USA, 2011; pp. 140–163. [Google Scholar]
  15. Puibasset, J.; Pellenq, J.M. Water adsorption on hydrophilic mesoporous and plane silica substrates: A grand canonical Monte Carlo simulation study. J. Chem. Phys. 2003, 118, 5613–5622. [Google Scholar] [CrossRef]
  16. Ma, H.; Li, Z. Realistic pore structure of Portland cementpaste: Experimental study and numerical simulation. Comput. Concr. 2013, 11, 317–336. [Google Scholar] [CrossRef]
  17. Mehta, P.K.; Paulo, J.M. Concrete: Microstructure, Properties, and Materials; Prentice-Hall: Upper Saddle River, NJ, USA, 2013. [Google Scholar]
  18. Allen, A.J.; Thomas, J.J. Analysis of C–S–H gel and cement paste by small-angle neutron scattering. Cem. Concr. Res. 2007, 37, 319–324. [Google Scholar] [CrossRef] [Green Version]
  19. Ji, Q.; Pellenq, J.M.; Vliet, K.J.V. Comparison of computational water models for simulation of calcium-silicate-hydrate. Comput. Mater. Sci. 2012, 53, 234–240. [Google Scholar] [CrossRef]
  20. Bonhoure, I.; Wieland, E.; Scheidegger, A.M.; Ochs, M.; Kunz, D. EXAFS study of Sn(IV) immobilization by hardened cement paste and calcium silicate hydrates. Environ. Sci. Technol. 2003, 37, 2184–2191. [Google Scholar] [CrossRef]
  21. Gauffinet, S.; Finot, E.; Lesniewska, E.; Nonat, A. Studies of CSH growth on C3S surface during its early hydration. In Proceedings of the 20th International Conference on Cement Microscopy, Guadalajara, Mexico, 19–23 April 1998. [Google Scholar]
  22. Grangeon, S.; Claret, F.; Linard, Y.; Chiaberge, C. X-ray diffraction: A powerful tool to probe and understand the structure of nanocrystalline calcium silicate hydrates. Acta Crystallogr. B Struct. Sci. Cryst. Eng. Mater. 2013, 69, 465–473. [Google Scholar] [CrossRef] [Green Version]
  23. Cong, X.; Kirkpatrick, R. 29Si MAS NMR study of the structure of calcium silicate hydrate. Adv. Cem. Based Mater. 1996, 3, 144–156. [Google Scholar] [CrossRef]
  24. Pellenq, R.J.; Kushima, A.; Shahsavari, R.; Van Vliet, K.; Buehler, M.J.; Yip, S.; Ulm, F.-J. A realistic molecular model of cement hydrates. Proc. Natl. Acad. Sci. USA 2009, 106, 16102–16107. [Google Scholar] [CrossRef] [Green Version]
  25. Hamid, S. The crystal structure of the 11 Å natural tobermorite Ca2.25 Si3 O7.5 (OH)1.5 1H2 O. Z. Fur Krist. 1981, 154, 189–198. [Google Scholar]
  26. Murray, S.J.; Subramani, V.J.; Selvam, R.P.; Hall, K.D. Molecular dynamics to understand the mechanical behavior of cement Paste. J. Transp. Res. Board 2010, 2142, 75–82. [Google Scholar] [CrossRef]
  27. Selvam, R.P.; Subramani, V.J.; Murray, S.; Hall, K.D. Potential Application of Nanotechnology on Cement Based Materials; The National Academies of Sciences, Engineering, and Medicine: Keck Center, DC, USA, 2009. [Google Scholar]
  28. Manzano, H.; Moeini, S.; Marinelli, F.; van Duin, A.C.T.; Ulm, F.-J.; Pellenq, R.J.-M. Confined water dissociation in microporous defective silicates: Mechanism, dipole distribution, and impact on substrate properties. J. Am. Chem. Soc. 2011, 134, 2208–2215. [Google Scholar] [CrossRef] [PubMed]
  29. Puibasset, J.; Pellenq, R. Grand canonical monte carlo simulation study of water adsorption in silicalite at 300 K. J. Phys. Chem. B 2008, 112, 6390–6397. [Google Scholar] [CrossRef]
  30. Valleau, J.P.; Cohen, L.K. Primitive model electrolytes. I. Grand canonical Monte Carlo computations. J. Chem. Phys. 1980, 72, 5935–5941. [Google Scholar] [CrossRef]
  31. Oelkers, E.H.; Golubev, S.V.; Chairat, C.; Pokrovsky, O.S.; Schott, J. The surface chemistry of multi-oxide silicates. Geochim. Et Cosmochim. Acta 2009, 73, 4617–4634. [Google Scholar] [CrossRef]
  32. Longo, R.; Cho, K.; Brüner, P.; Welle, A.; Gerdes, A.; Thissen, P. Carbonation of wollastonite(001) competing hydration: Microscopic insights from ion spectroscopy and density functional theory. ACS Appl. Mater. Interfaces 2015, 7, 4706–4712. [Google Scholar] [CrossRef]
  33. Giraudo, N.; Thissen, P. Carbonation Competing Functionalization on Calcium-Silicate-Hydrates: Investigation of Four Promising Surface-Activation Techniques. ACS Sustain. Chem. Eng. 2016, 4, 3985–3994. [Google Scholar] [CrossRef]
  34. Sun, H. Simulation of organic adsorption on metallic materials. J. Phys. Chem. B 1998, 102, 7338. [Google Scholar] [CrossRef]
  35. Musa, A.Y.; Jalgham, R.T.T.; Mohamad, A.B. Molecular dynamic and quantum chemical calculations for phthalazine derivatives as corrosion inhibitors of mild steel in 1M HCl. Corros. Sci. 2012, 56, 176–183. [Google Scholar] [CrossRef]
  36. Hou, D.; Jia, Y.; Yu, J.; Wang, P.; Liu, Q.F. Transport Properties of Sulfate and Chloride Ions Confined between Calcium Silicate Hydrate Surfaces: A Molecular Dynamics Study. J. Phys. Chem. C 2018, 122, 28021–28032. [Google Scholar] [CrossRef]
  37. Diamanti, M.V.; Pérez Rosales, E.A.; Raffaini, G.; Ganazzoli, F.; Brenna, A.; Pedeferri, M.; Ormellese, M. Molecular modelling and electrochemical evaluation of organic inhibitors in concrete. Corros. Sci. 2015, 100, 231–241. [Google Scholar] [CrossRef] [Green Version]
  38. Mendonca, G.L.F.; Costa, S.N.; Freire, V.N.; Casciano, P.N.S.; Correia, A.N.; de Lima-Neto, P. Understanding the corrosion inhibition of carbon steel and copper in sulphuric acid medium by amino acids using electrochemical techniques allied to molecular modelling methods. Corros. Sci. 2017, 115, 41–55. [Google Scholar] [CrossRef]
  39. Gustincic, D.; Kokalj, A. DFT Study of Azole Corrosion Inhibitors on Cu2O Model of Oxidized Copper Surfaces: I. Molecule-Surface and Cl-Surface Bonding. Metals 2018, 8, 311. [Google Scholar] [CrossRef] [Green Version]
  40. Guo, L.; Tan, J.; Kaya, S.; Leng, S.; Li, Q.; Zhang, F. Multidimensional insights into the corrosion inhibition of 3,3-dithiodipropionic acid on Q235 steel in H2SO4 medium: A combined experimental and in silico investigation. J. Colloid Interface Sci. 2020, 570, 116–124. [Google Scholar] [CrossRef]
  41. Zhu, Z.-S.; Li, L.-Q.; Gao, Y.-C.; Zhang, J.-F.; Song, J.-F.; Qin, Y.-X.; Liu, X.-Y. Analysis of Multi-component Organic Gas Adsorption Behaviors and Selectivity of Adsorbent. Nat. Gas Chem. Ind. 2008, 33, 47–51. [Google Scholar]
  42. Abdollahi, F.; Razmkhah, M.; Moosavi, F. The role of hydrogen bond interaction on molecular orientation of alkanolamines through temperature and pressure variation: A mixed molecular dynamics and quantum mechanics study. Comput. Mater. Sci. 2017, 131, 239–249. [Google Scholar] [CrossRef]
  43. Button, J.K.; Gubbins, K.E.; Tanaka, H.; Nakanishi, K. Molecular dynamics simulation of hydrogen bonding in monoethanolamine. Fluid Phase Equilibria 1996, 116, 320–325. [Google Scholar] [CrossRef]
Figure 1. The C-S-H gel model construction process (Red ball: oxygen atom; green ball: calcium atom; white ball: hydrogen atom; yellow tetrahedral: silicate tetrahedral): (a) initial tobermorite 11 Å structure without water molecules. Cell parameters: a = 18.37 Å, b = 24.32 Å, c = 26.48 Å, α, β, γ, equal to 90°; (b) removal of the bridging silicate tetrahedral, where Qn represents n species of silicate tetrahedral, n corresponds to the number of bridging oxygen atoms (BO) in one silicate tetrahedral; (c) grand canonical Monte Carlo (GCMC) water adsorption and (d) C-S-H structure finality achieved.
Crystals 10 00742 g001
Figure 2. Snapshots for the surface adsorption test (red ball: oxygen atom; green ball: calcium atom; white ball: hydrogen atom; yellow tetrahedral: silicate tetrahedral; violet ball: sodium atom; blue ball: nitrogen atom and grey ball: carbon atom): (a) C-S-H surface. Cell parameters: a = 18.37 Å, b = 26.48 Å, c = 78.72 Å, α, β, γ, equal to 90°; (b) GCMC adsorbents placed and (c) final balancing snapshots.
Crystals 10 00742 g002
Figure 3. Snapshots for the pore adsorption test (red ball: oxygen atom; green ball: calcium atom; white ball: hydrogen atom; yellow ball: silicate atom; violet ball: sodium atom; blue ball: nitrogen atom; grey ball: carbon atom): (a) C-S-H pore. Cell parameters: a = 18.37 Å, b = 26.48 Å, c = 78.72 Å, α, β, γ, equal to 90°; (b) GCMC adsorption.
Crystals 10 00742 g003
Figure 4. The change of energy with time in the molecular dynamics simulation.
Crystals 10 00742 g004
Figure 5. The final equilibrated snapshots (red ball: oxygen atom; green ball: calcium atom; white ball: hydrogen atom; yellow tetrahedral: silicate tetrahedral; violet ball: sodium atom; blue ball: nitrogen atom and grey ball: carbon atom): (a) main view of MEA; (b) main view of DEA; (c) main view of TEA; (d) main view of NDE; (e) main view of DETA; (f) top view of MEA; (g) top view of DEA; (h) top view of TEA; (i) top view of NDE and (j) top view of DETA.
Crystals 10 00742 g005
Figure 6. Adsorption quantity at a different temperature.
Crystals 10 00742 g006
Table 1. The molecule structures of the compounds.
NameAbbreviationMolecular FormulaMolecular MassMolecular Structure
EthanolamineMEAC2HNO61.08 Crystals 10 00742 i001
DiethanolamineDEAC4H11NO2105.14 Crystals 10 00742 i002
TriethylolamineTEAC6H15NO3149.19 Crystals 10 00742 i003
N,N-dimethylethanolamineNDEC4H11NO89.14 Crystals 10 00742 i004
DiethyleneteiamineDETAC4H13N3103.17 Crystals 10 00742 i005
Table 2. Adsorption and solvation energy of five molecules. (kcal/mol).
MoleculeEAdsEsolEAdsEsol
MEA−697.496064−92.595926−604.900138
NDE−629.069637−143.23066−485.838977
TEA−756.114049−199.036085−557.077964
DEA−671.377916−105.307953−566.069963
DETA−658.629254−188.678217−469.951037
Table 3. Adsorption selectivity of alkanol-amine compounds to H2O at different temperature.
Molecule293 K298 K303 K308 K313 K318 K
MEA to H2O12.9312.5412.1911.6811.4611.12
NDE to H2O4.464.033.523.153.113.16
TEA to H2O4.374.303.793.423.383.34
DEA to H2O5.015.034.614.314.094.02
DETA to H2O3.643.572.893.062.672.65
Table 4. Total energy, van der Waals energy, electrostatic energy and intramolecular energy of every system in different temperatures (kcal/mol).
MoleculeTemperatureTotal EnergyVan Der Waals EnergyElectrostatic EnergyIntramolecular Energy
MEA298 K−64690.743242951.46269−78902.7802811260.57435
303 K−64530.306972898.92290−78303.2134711073.98360
308 K−64075.015702467.56340−77464.3223010921.74313
313 K−63639.922842366.96724−76879.9999910873.10984
NDE298 K−51813.292182257.08450−65106.4041111036.02744
303 K−51011.187742247.36929−63938.8783911080.32136
308 K−49461.251522175.76475−62563.4132710926.39701
313 K−49008.362332068.31950−61393.3924810316.71066
TEA298 K−53083.227062715.29208−67080.0996711281.58053
303 K−52678.752862680.23054−66935.3824211206.39902
308 K−52069.377832615.87605−65897.4776711012.22379
313 K−52092.914532677.50214−65938.4044511067.98778
DEA298 K−53338.166692593.65200−66600.7947011208.97600
303 K−53020.399332603.99637−65289.8522811065.45658
308 K−52974.724702544.07300−64940.2260610721.42836
313 K−51087.924602507.73629−64016.2058610830.54496
DETA298 K−53106.886042703.01003−64217.2012211448.15528
303 K−51976.236482604.64465−63585.4850111004.60387
308 K−508903.831102592.05362−62751.7100911525.82537
313 K−50057.240122562.15990−61100.0488111021.49893

