Communication

Solving Noise Pollution Issue Using Plenum Window with Perforated Thin Box

1
Center for Research on Leading Technology of Special Equipment, School of Mechanical and Electrical Engineering, Guangzhou University, 230 Wai Huan Xi Road, Guangzhou 510006, China
2
Department of Mechanical Engineering, National University of Singapore, 9 Engineering Drive 1, Singapore 117575, Singapore
3
School of Mechanical and Electrical Engineering, Guangzhou University, 230 Wai Huan Xi Road, Guangzhou 510006, China
*
Author to whom correspondence should be addressed.
Crystals 2020, 10(7), 614; https://doi.org/10.3390/cryst10070614
Submission received: 22 June 2020 / Revised: 9 July 2020 / Accepted: 10 July 2020 / Published: 14 July 2020
(This article belongs to the Special Issue Recent Advances in Phononic Crystals and Acoustic Metamaterials)

Abstract

:
In the present study, a conventional plenum window was incorporated with perforated thin box in order to enhance its performance at frequency range which centralized at 1000 Hz as most of the common noise sources at city nowadays are centralizing around this frequency. The entire studies were conducted in a reverberation room. The effectiveness of jagged flap on mitigating diffracted sound was also studied. Three types of noises were examined in the current study—white noise, traffic noise and construction noises. The experimental results showed that the plenum window with perforated thin box could reduce 8.4 dBA, 8.7 dBA and 6.9 dBA of white, traffic and construction noises, respectively. The jagged flaps did not have significant effect on the plenum window’s noise mitigation performance. When frequencies were ranging from 800 Hz to 1250 Hz, when compared with the case of without perforated thin box, it was found that the perforated thin box had good acoustic performance where it was able to reduce additional 1.6 dBA, 1.6 dBA and 1.2 dBA of white, construction and traffic noises, respectively.

1. Introduction

According to the definition from Ford and Kerry [1], the outer and inner openings of a plenum window are staggered in order to prevent sound passes through it directly. Outdoor air can pass through the gap between the two glass panes of a plenum window and this allows natural ventilation for the residential unit. Tang et al. [2] concluded that additional noise reduction about 12 dBA to 13 dBA could be provided by a plenum window compared to the common openable window. Their results also showed that additional 2 dBA of insertion loss (IL) could be obtained by modifying the top internal surface of the window cavity through attaching sound absorption material on it. In a semi-anechoic chamber, the acoustic IL of a plenum window was investigated by Tong and Tang [3]. When position of the line source relative to the building facade was fixed, the plenum window obtained maximum IL of about 14 dB. In a housing area, Yueng et al. [4] applied sound absorbtion material on the plenum window and obtained noise mitigation of 8 dBA. The effect of small inclination of the window pane on the sound insulation performance of the plenum window was investigated by Tang [5]. He claimed that there was a 2 dB sound insulation increment when the window panes were non-parallel and the source was close to the window. Tong et al. [6] measured the acoustic IL of a plenum window through a full scale field experiment. Compared to side hung casement window, they claimed that plenum window was able to achieve 7.1 dBA to 9.5 dBA of IL. A series of experiments were conducted by Tang et al. [7] to study the effect of an active noise control system on the plenum window’s acoustic performance. The active noise control system was found to has the best performance when the two loudspeakers were directly faced the incoming noise source and were placed symmetrically along the plenum cavity horizontal centreline.
Du et al. [8] investigated the influences of the air-gap spacing between two glass panes, the panel thickness and the opening size on the sound transmission loss of a plenum window. They found that when the half wavelength of impinged sound was smaller than the air-gap spacing, the transmission loss could be improved by the increment of the glass thickness and decrement of the opening sizes but varies little with changes in air-gap spacing. A parametric study was carried out by Li et al. [9] inside the building acoustics testing chambers of the Hong Kong Polytechnic University in an attempt to develop a simple empirical prediction model for the traffic noise transmission loss across plenum windows. Their results showed that a model which assumed frequency-independent diffraction directivity and percentage reverberant field attenuation gave the best prediction of traffic noise transmission loss. The acoustic performances of a plenum window and a louver window were compared by Ji et al. [10] where these two windows had similar ventilation performance. The effectiveness of the plenum window in attenuating environmental noise was found to be better than louver window. Chan and Yeung [11] designed various plenum windows and tested their traffic noise mitigation efficiency in a laboratory and in a site. Results showed that those designs were successful in mitigating traffic noise. Yu et al. [12] proposed a simulation model to estimate the sound insulation performance of a double glazing window. Their results showed that the sound reduction index of the double glazing window was mainly controlled by the cavity resonance effect in the low-to-mid frequency range.
Nowadays, population density is very high in big cities. Therefore, due to shortage of the available land, noise barriers which built close to the highways, factories and construction sites are also built at those areas which are very near the residential area. As a result, those noise barriers will prevent the wind and sunshine from flowing and shining toward the residential area, respectively. Residents will feel very stuffy and they are covered by darkness if the air conditioner and light are not turned on. Other than this, a large space area is needed to build an effective noise barrier because noise barriers usually are built to cover the whole construction site or are built along highway with long perimeter. From the literature studies, it can be seen that plenum window is more reliable for practical application compared to noise barrier because it still allows air to pass through its gap while it is fully staggered. It is transparent and it also can be installed on the window frame of a residential unit. Unfortunately, conventional plenum window cannot mitigate noise based on certain frequency range such as 1000 Hz as construction and traffic noises are normally centralized at frequency range around 1000 Hz [13]. From our preliminary studies, it was found that at 1000 Hz, compared with the case of without window, conventional plenum window was able to reduce about 8.1 dBA and 7.7 dBA of traffic noise and construction noise, respectively. Therefore, a perforated thin box using the concept of Helmholtz resonance is installed on a plenum window in the present study in order to enhance the performance of the plenum window at 1000 Hz. In addition, some other previous studies also claimed that noise barrier with jagged edge had greater noise attenuation ability than straight edge [14,15,16,17]. Therefore, in the present study, since sound diffraction might be occurred over the gap or edge of the plenum window’s glass pane, jagged flaps with different angles were installed on the edge of the glass pane in order to reduce the energy of the diffracted sound.

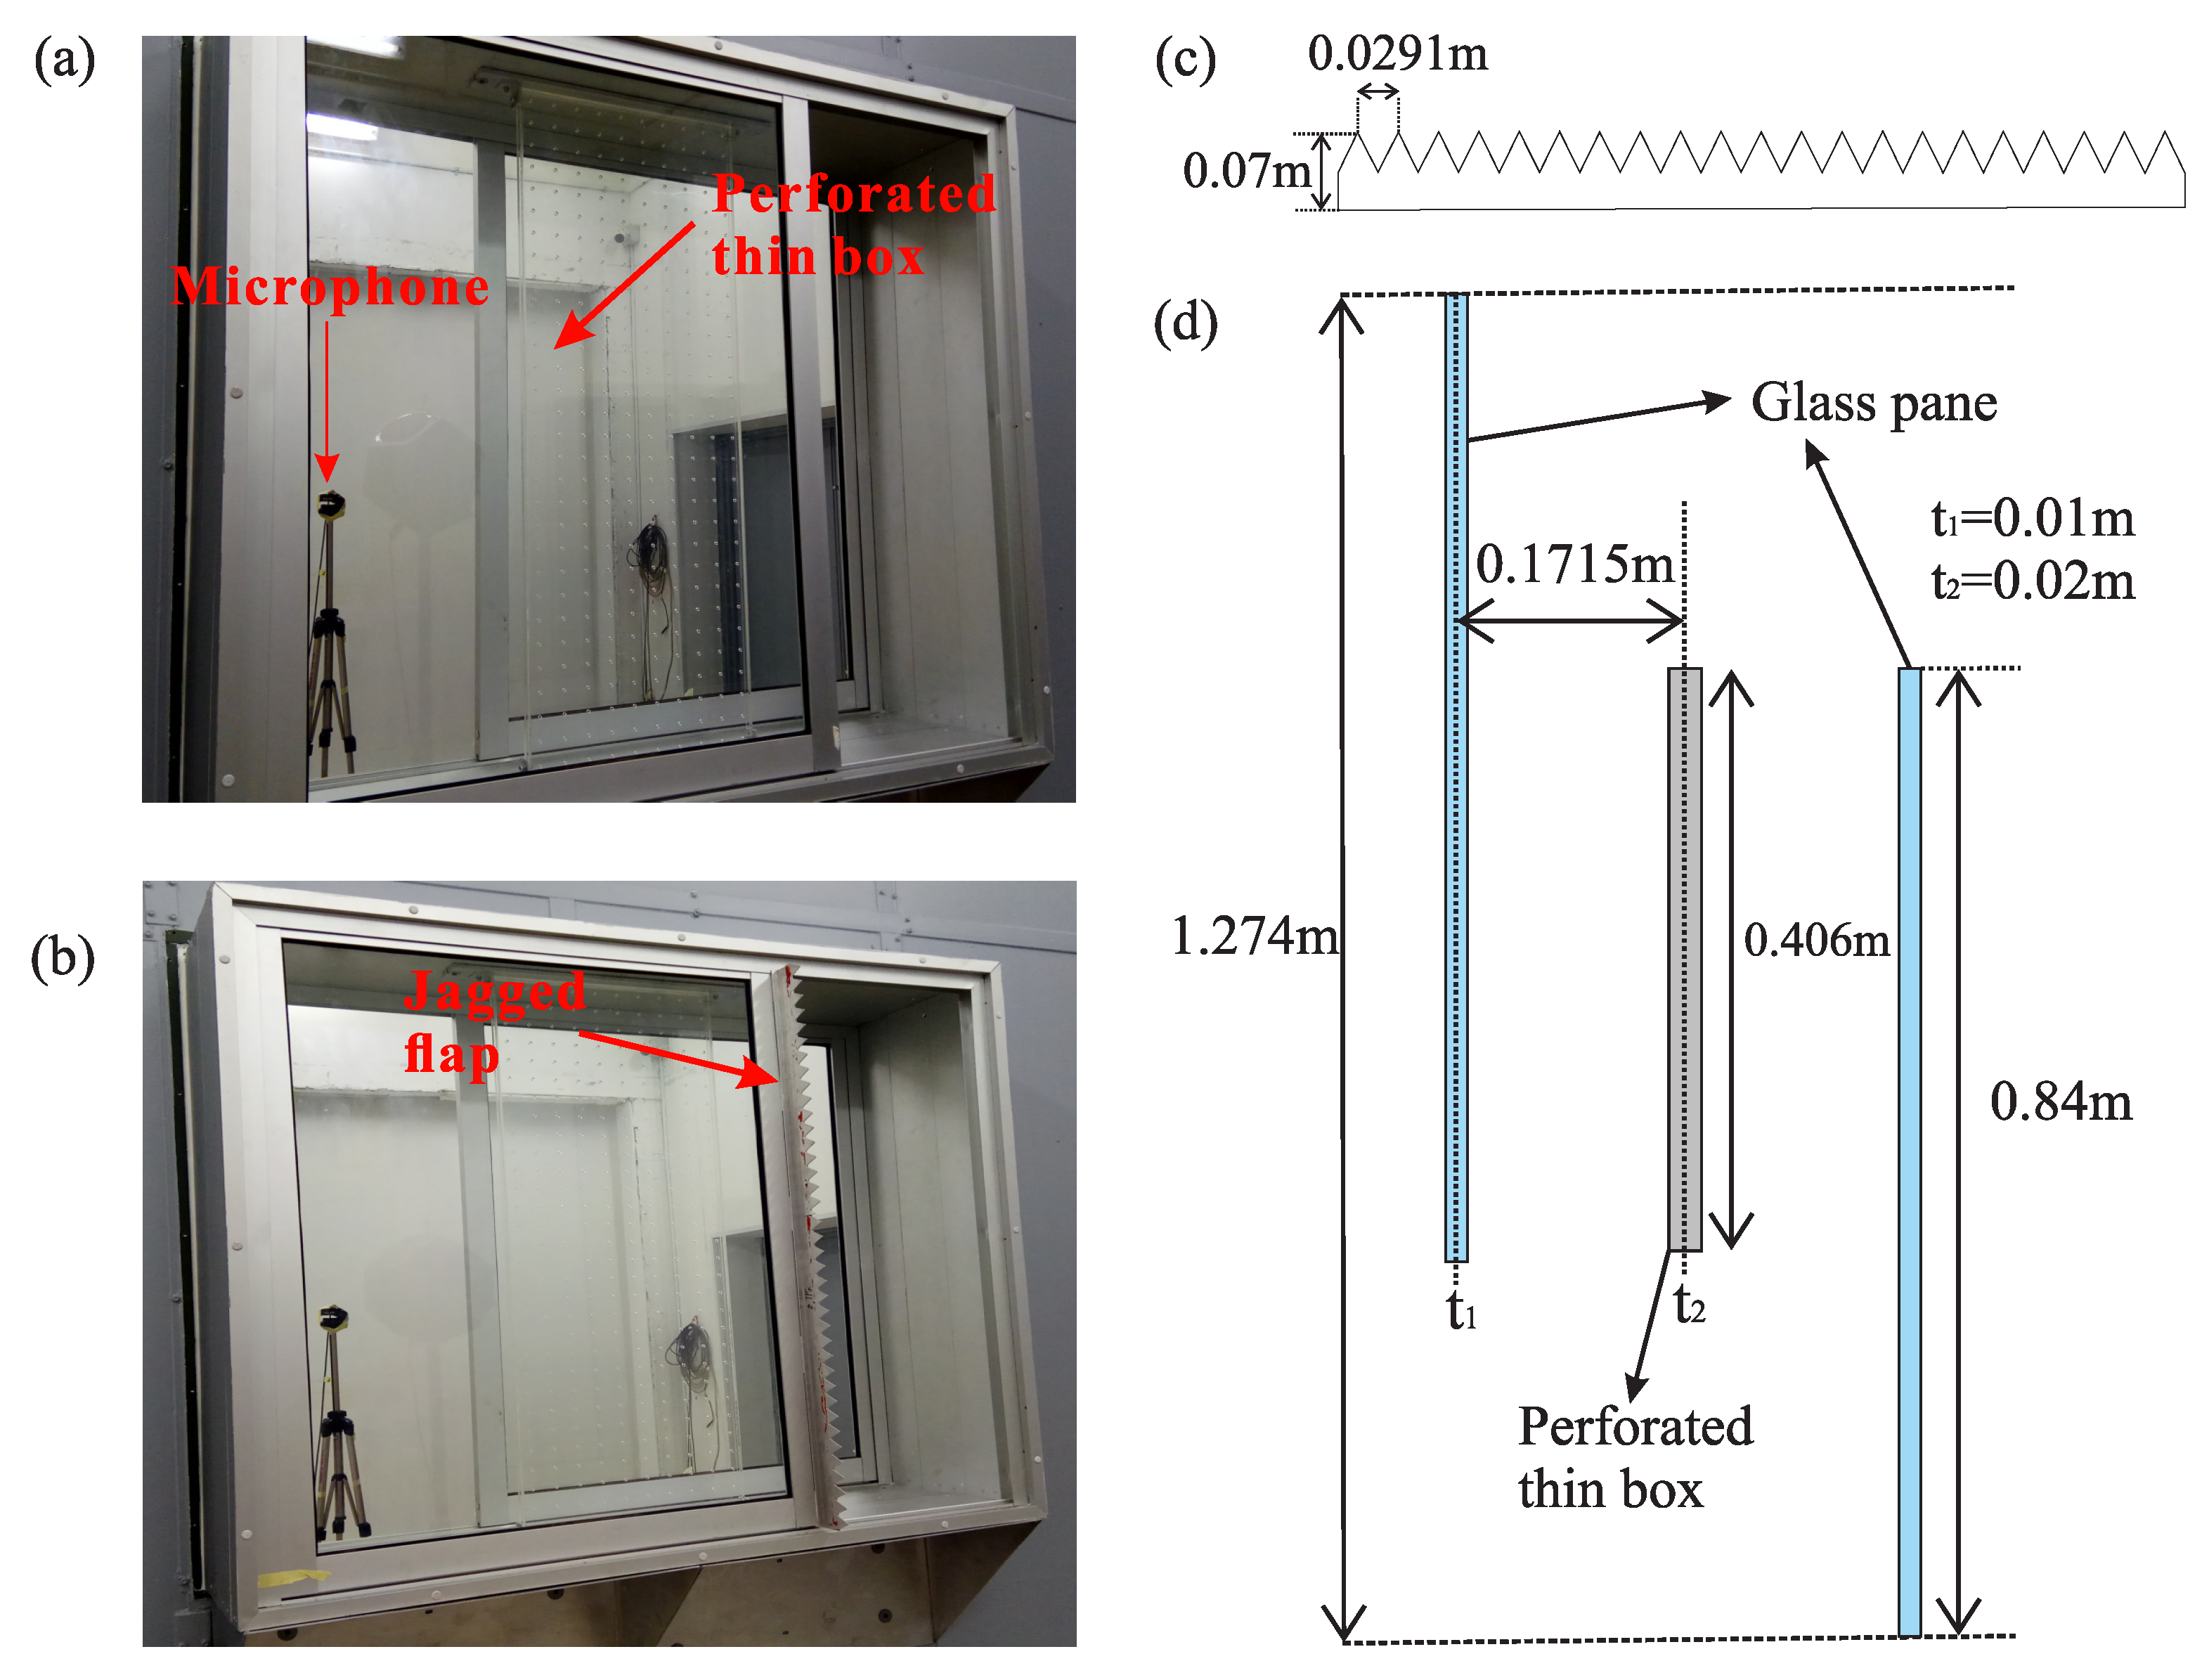
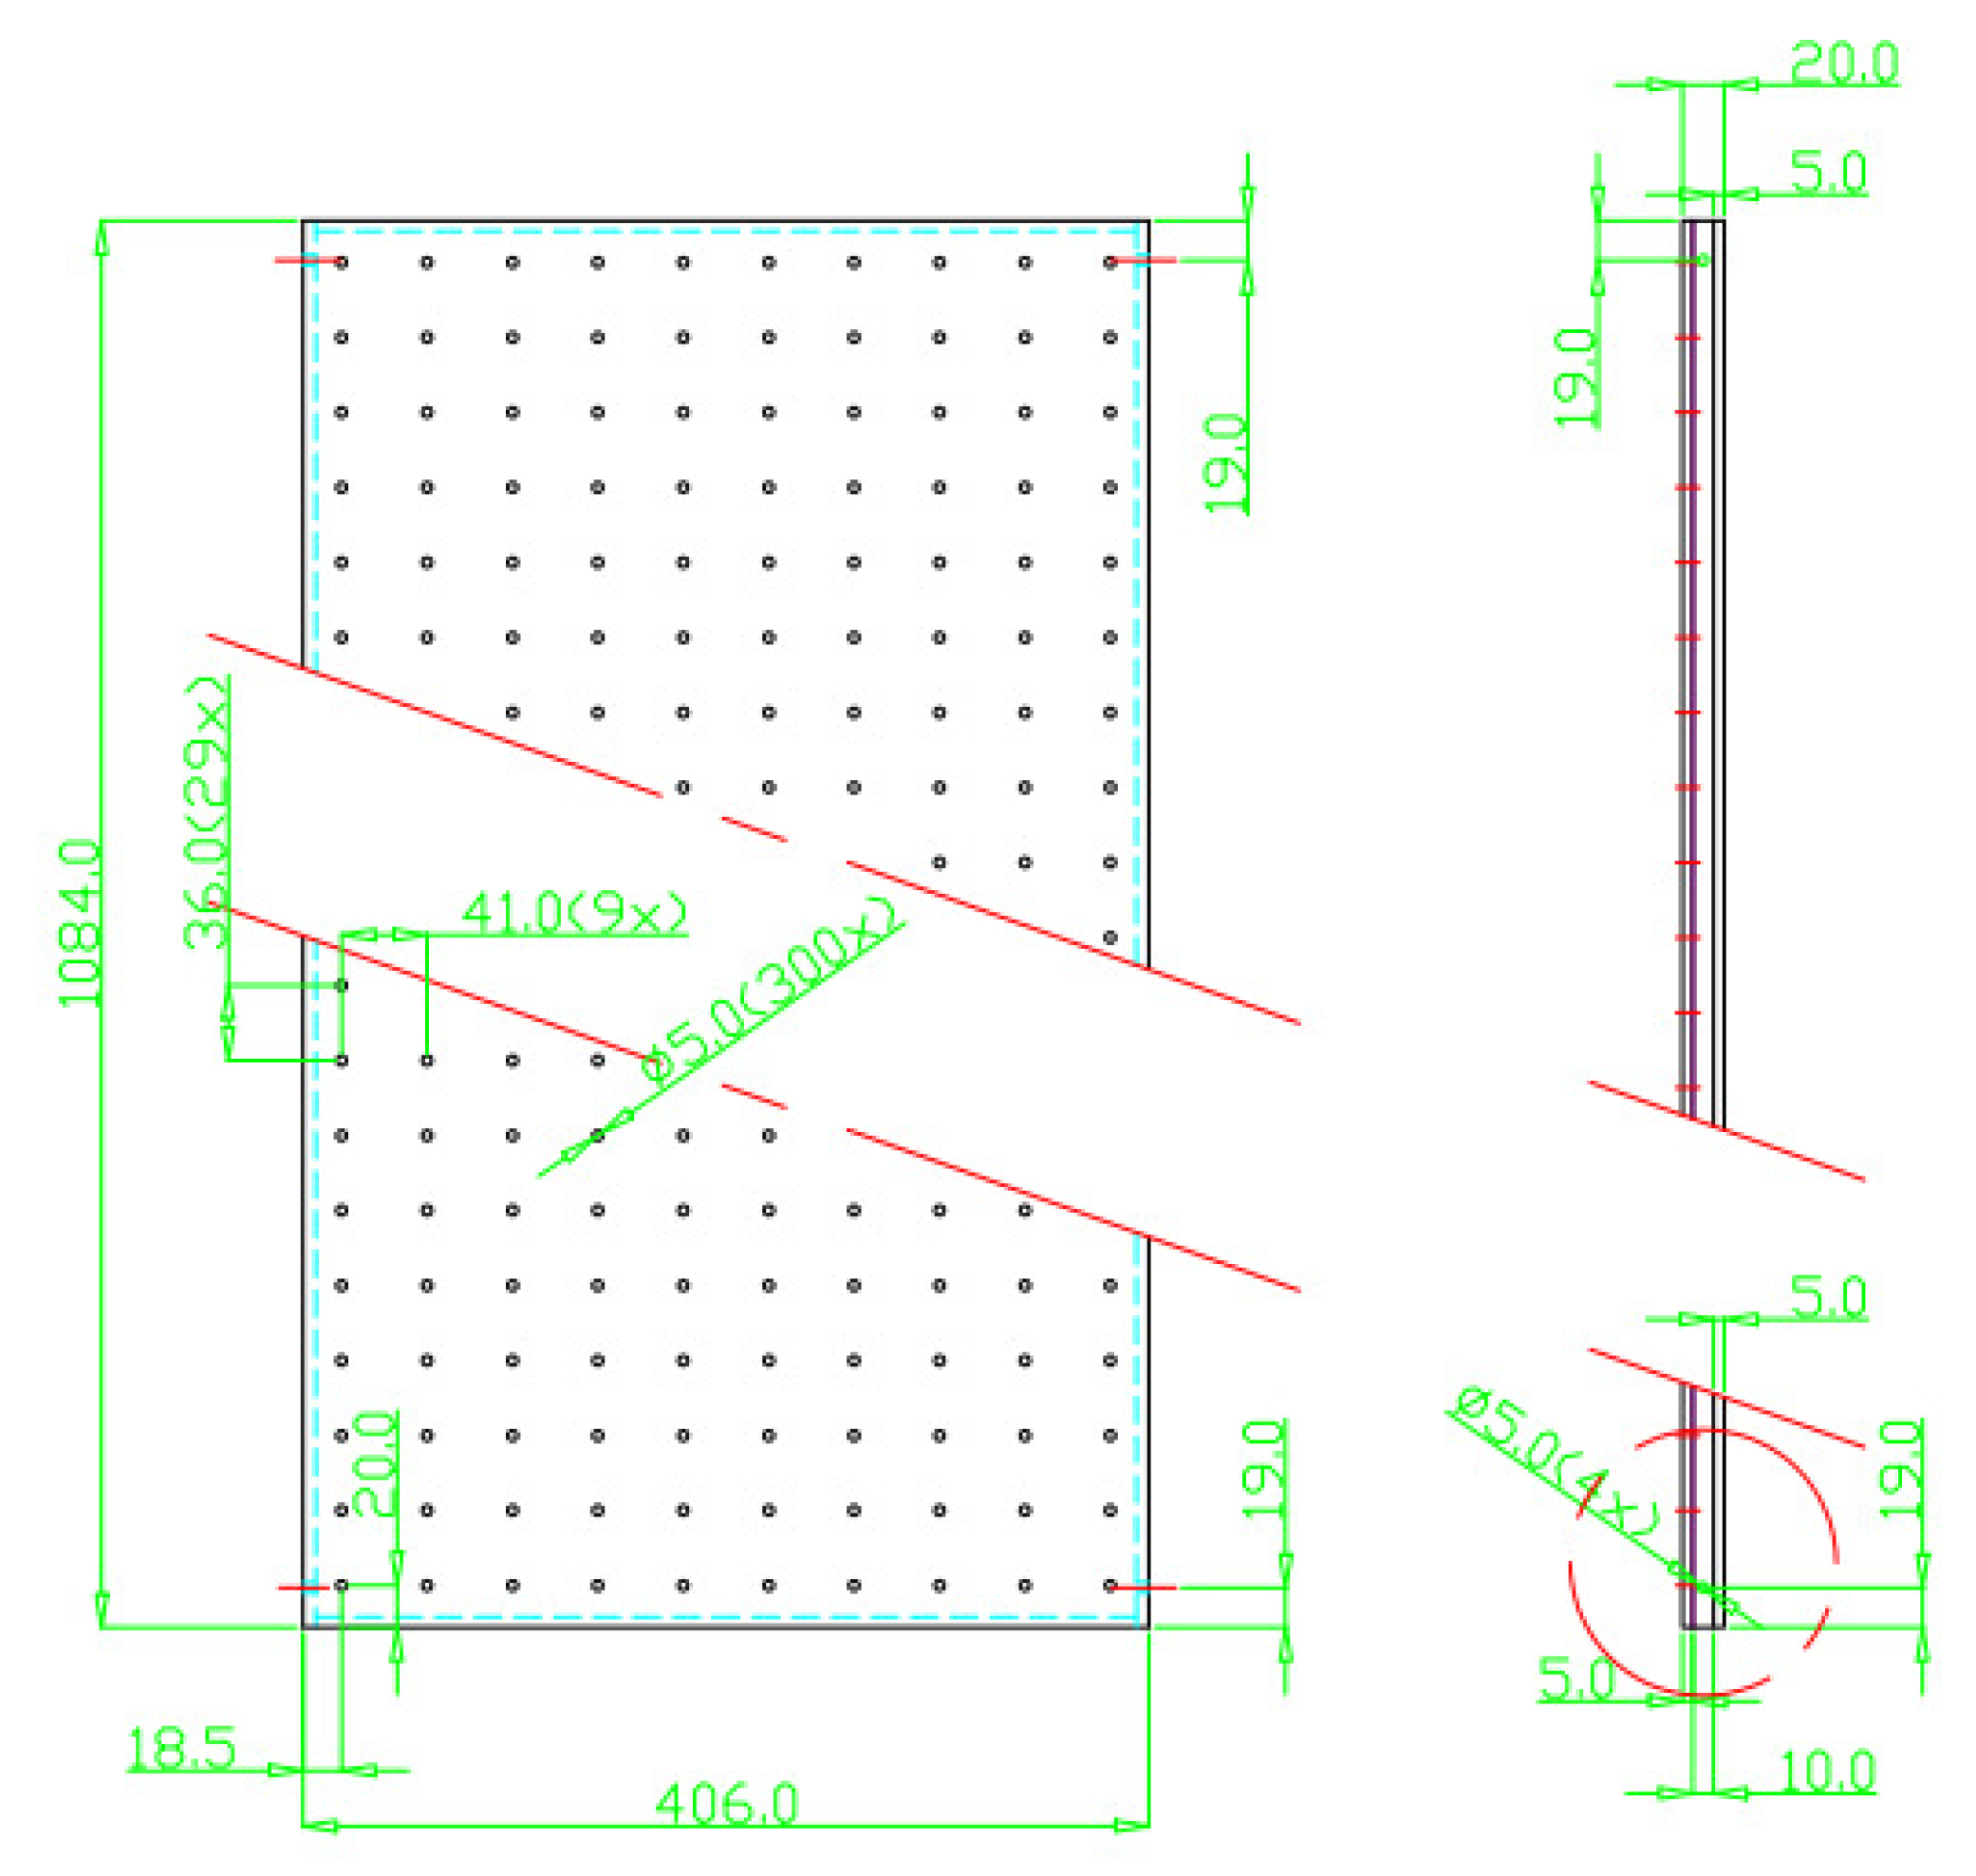
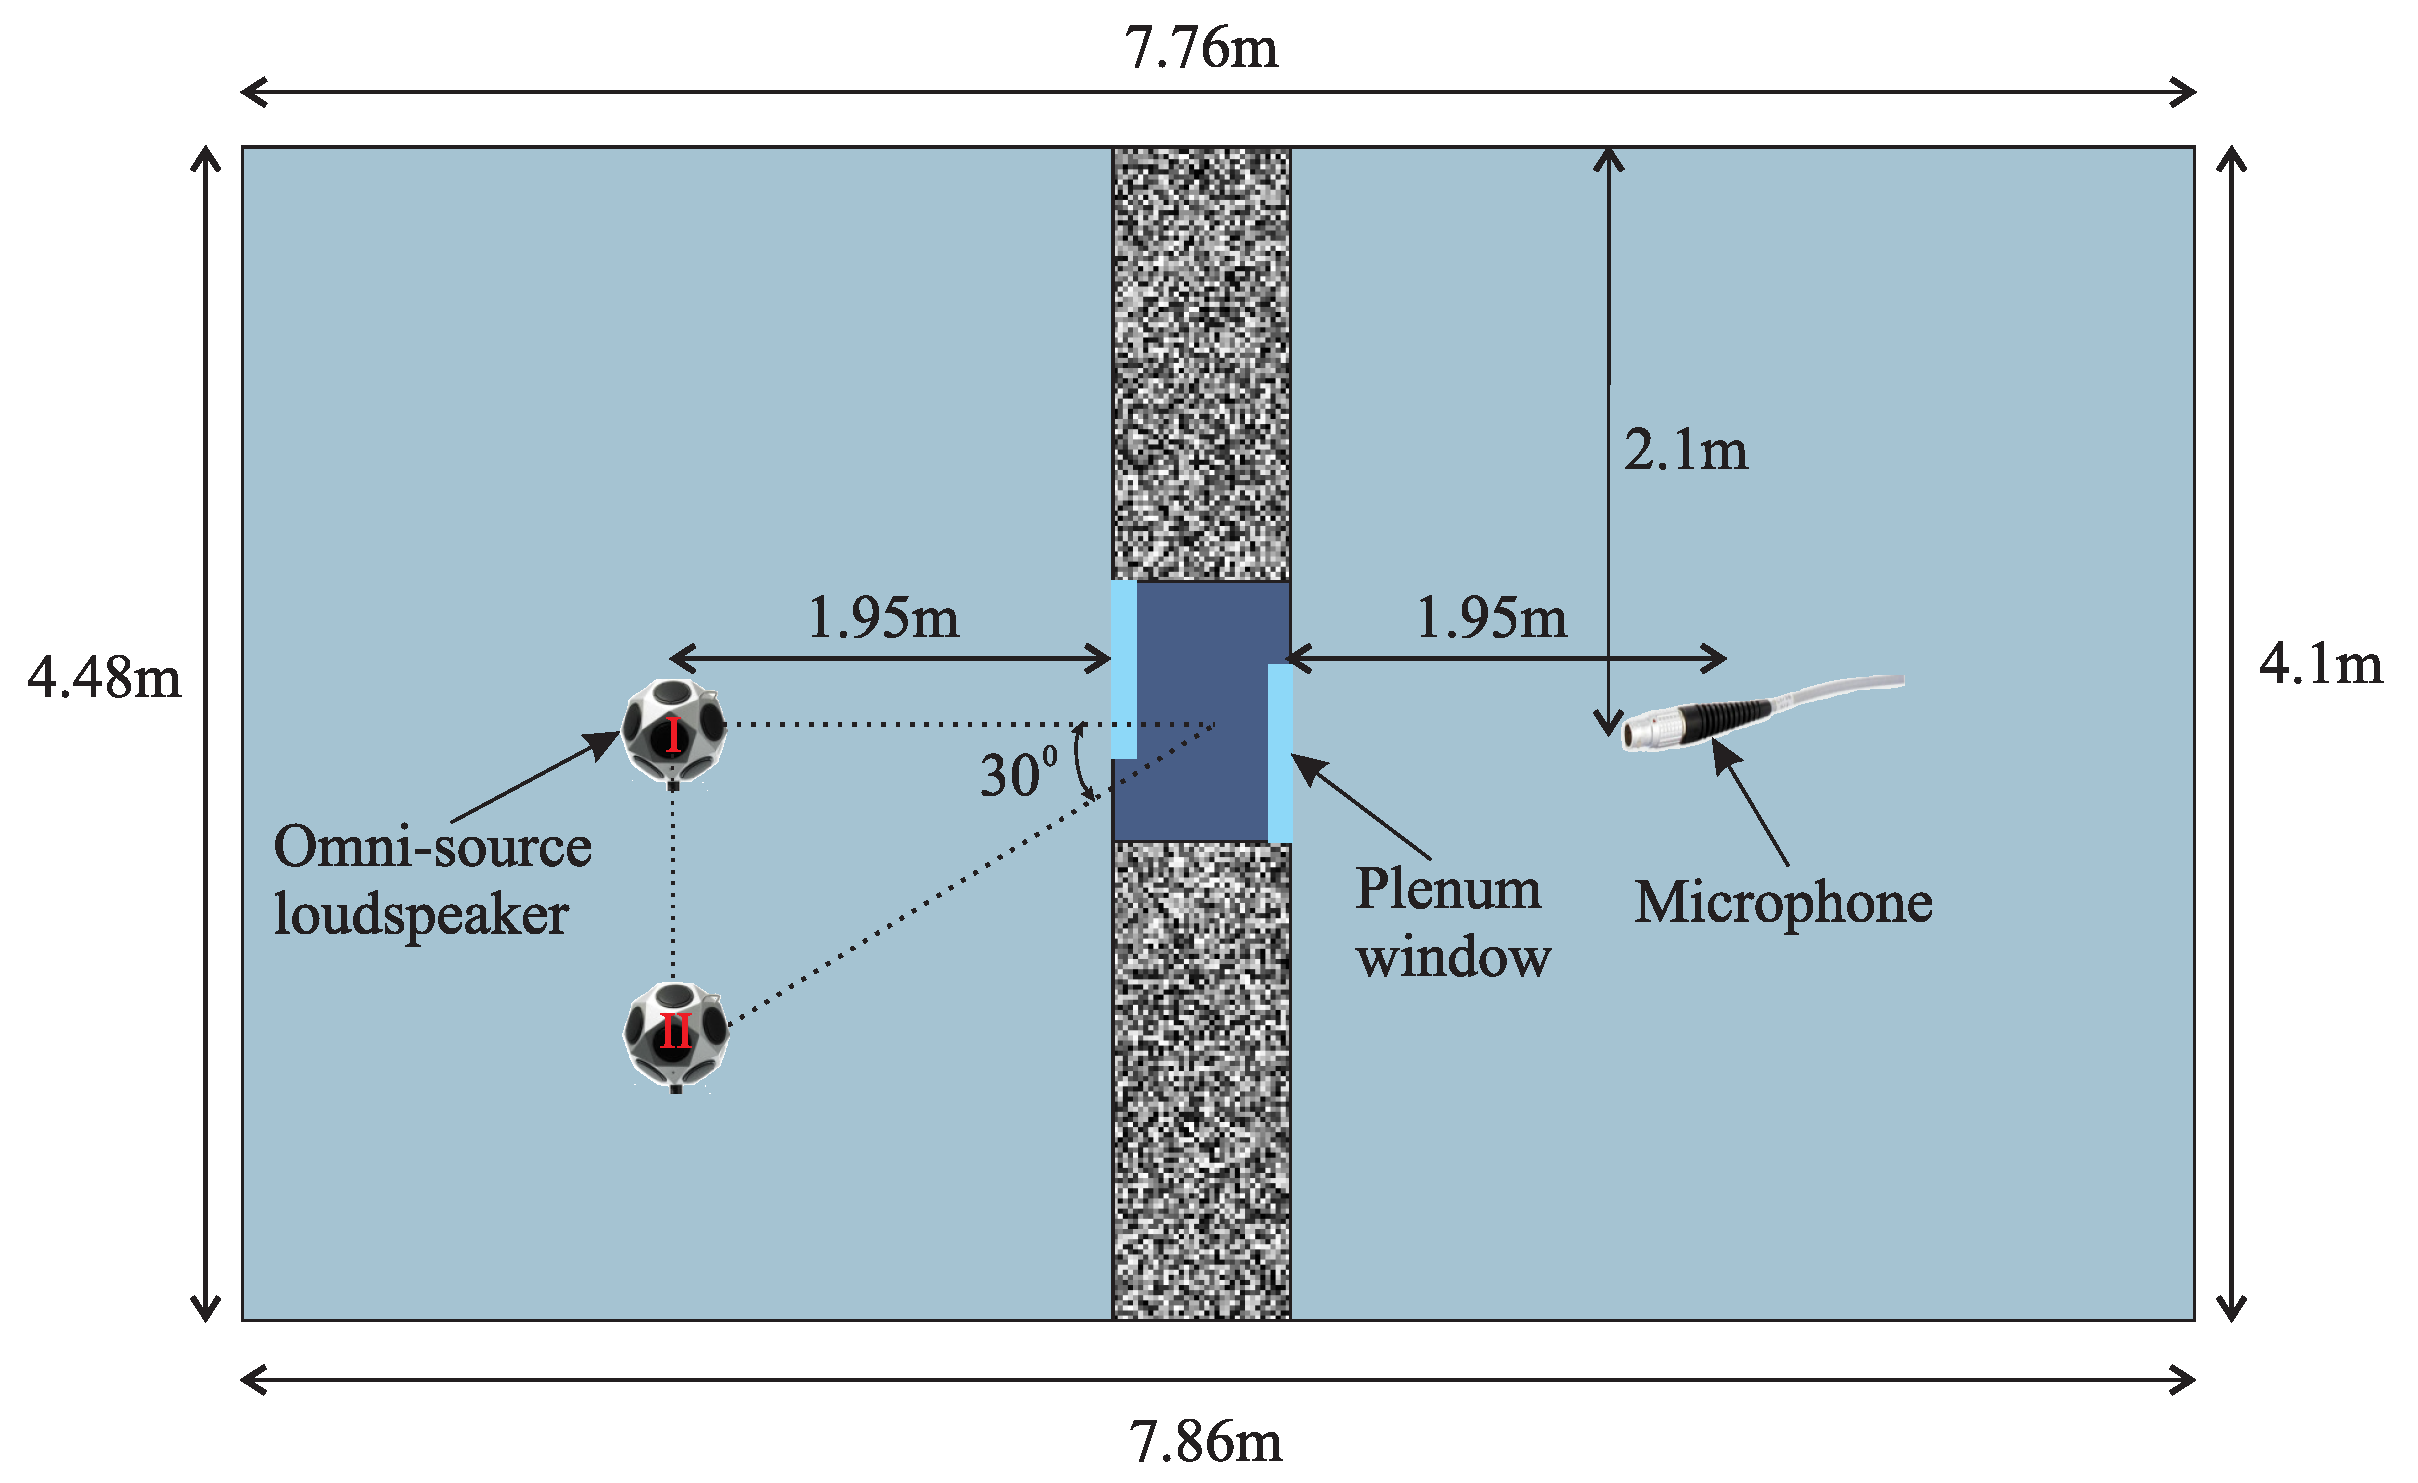
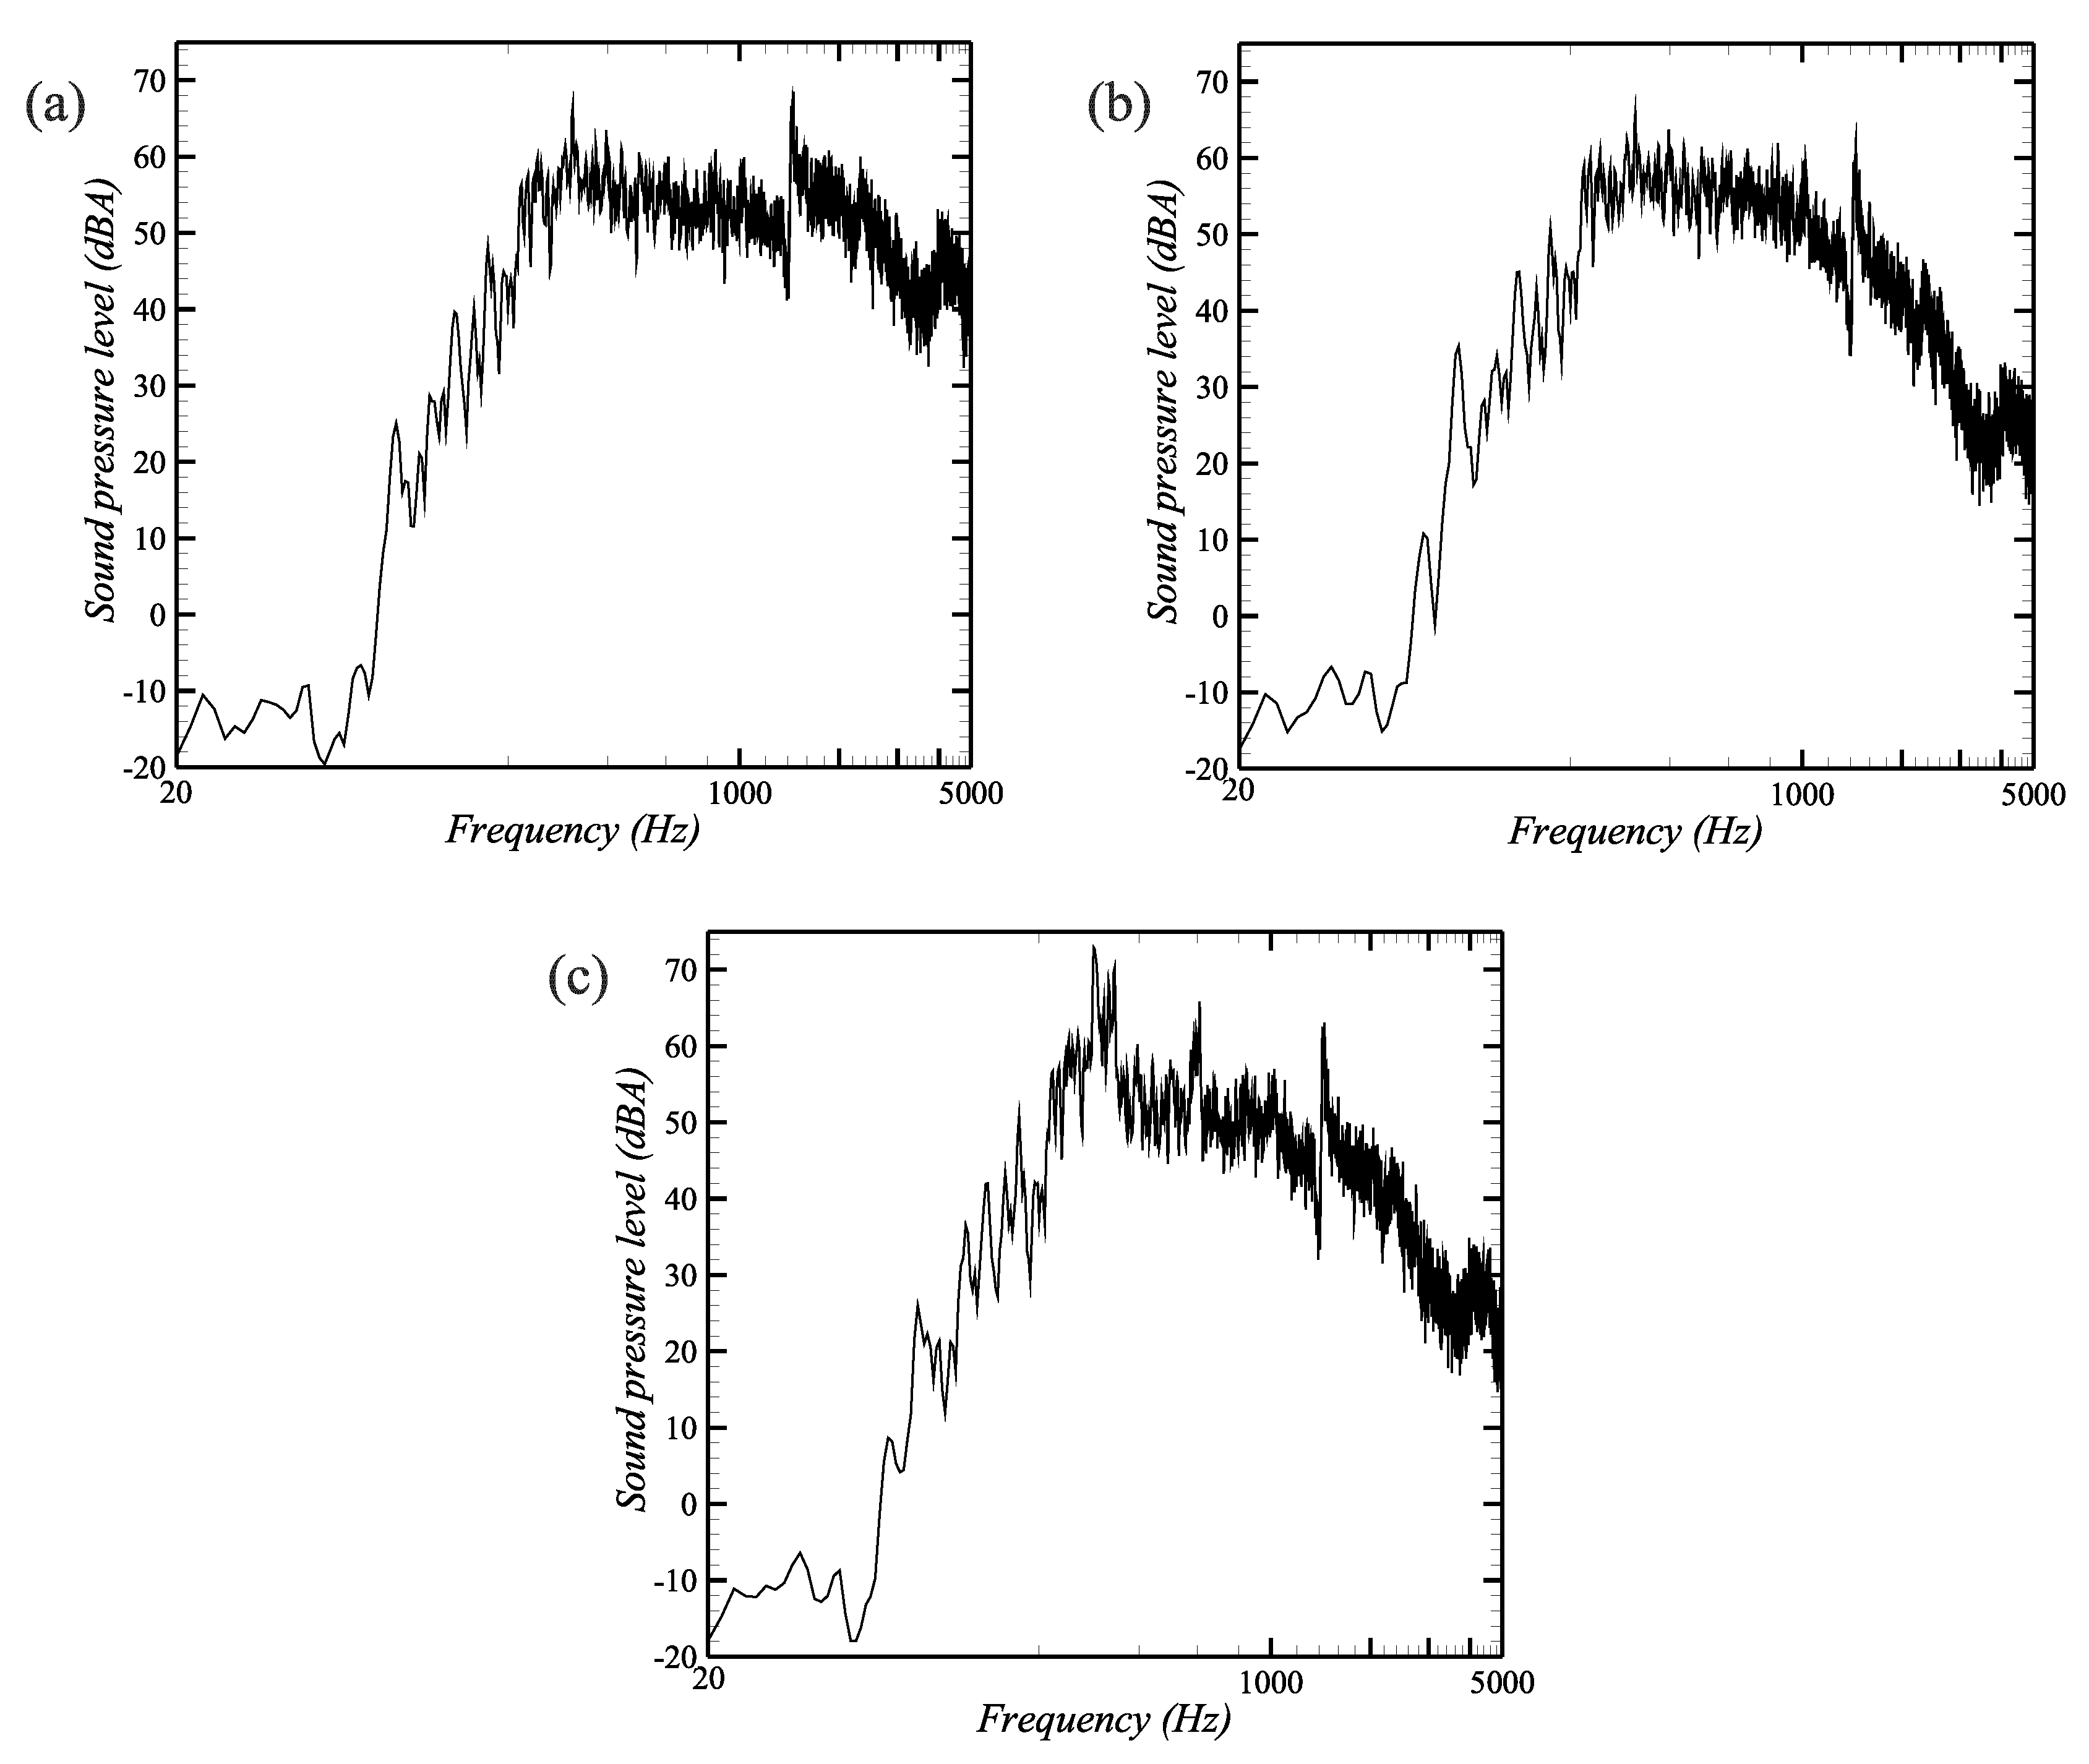
2. Experimental Set-up

The plenum window with perforated thin box was installed and was tested in a reverberation room (see Figure 1). The dimension of each glass pane is about 0.84 m × 1.084 m × 0.01 m (width × height × thickness). The dimension of the whole plenum window was selected based on the actual dimension of conventional glass window at Singapore. This is because according to ASTM E90-09, the size of the test specimen is preferable to be the same with its size in actual environment. The perforated thin box was made by Perspex because Perspex is easy to be fabricated and it is transparent. Thus, the thin box will not affect the daylighting performance of the plenum window. The front side of the box consisted of 30 rows and 10 columns of circular holes with diameter of 5 mm each as shown in Figure 2. The dimension of the box is about 0.406 m × 1.084 m × 0.02 m (width × height × thickness). With thickness of 0.02 m, the thin box will only have minimal effect on the plenum window’s ventilation performance. The geometry of the box was expected to produce resonant frequency ( f r ) of 654 Hz based on Equation (1) [18]:
f r = c 2 π A V ( l + 0.9 σ ) ,
where A is the cross sectional area of the resonator opening, V is the volume of the resonator, l is the length of neck and σ is the diameter of the hole. Based on the results from our previous studies, it was found that the estimated value of f r was normally lower than those that will be obtained from experiment. Since traffic noise is normally centralized at 1000 Hz, so the perforated thin box was purposely be designed with a lower value in order to let the thin box obtains good acoustic performance around 1000 Hz during experiment.
The measuring equipment consisted of a Bruel & Kjaer (B&K) power amplifier (model 2734-A), a Larson Davis Omni-source loudspeaker (model BAS001), a PCB Piezotronics microphone (model 377B02) and a SONY boombox (model ZR-RS70BT). A CD was used to save traffic, white and construction noises. These noises were played using the SONY boombox. The noise spectrums of white, traffic and construction noises are shown in Figure A1 in the Appendix A. Loudspeaker and amplifier were used to make those noises propagated in omni-direction and to amplify the volume of those noises, respectively. According to ASTM E90-09, noise source should preferably be omni-directional at all measurement frequencies to excite the sound field in the reverberation room as uniformly as possible. Two types of experiments were conducted in the reverberation room with different locations of loudspeaker. For experiment I, the microphone and loudspeaker were positioned at the central of the reverberation room and central of the plenum window (see Figure 3). The distances between the microphone and the plenum window or any adjacent walls are greater than 1.5 m in the present study as according to ASTM E90-09, in the receiver room, microphone shall be placed more than 1.5 m from the test partition. In addition, the shortest distance from any microphone position to any major extended surface shall be greater than 1 m. For experiment II, the loudspeaker was diverged 30 ° away from its original position in experiment I in order to investigate the effect of noise source position on the noise attenuation performance of the plenum window. For both experiments I and II, a jagged flap was installed perpendicularly on the edge of the glass pane as shown in Figure 1b,c in order to lower the energy of possible diffracted sound. The jagged flap was bend 45 ° towards the direction of the glass pane in order to investigate the effect of the flap’s angle on the acoustic performance of the plenum window. All tested conditions can be found in Table 1.
The microphone was calibrated before the start of each set of measurement as this is one of the standard test methods as required in ASTM E90-09. Microphone was used to record all data from 20 Hz to 5000 Hz (narrow band with step of 2 Hz and one third octave band). B&K Sonoscout software was used to analyze these data. For each data set, 3 samples were measured and were averaged. The sampling time for each sample is 65 s as according to ASTM E90-09, the minimum required sampling time for 95% confidence limits of 0.5 dB is 62 s at 20 Hz. Sound pressure levels (SPLs) for experiment without plenum window (there was just an opening on the wall) were measured in order to compute IL 1 using Equation (2). IL 2 which computed the differences of SPLs between cases of with and without perforated thin box was obtained using Equation (3). The equivalent SPL ( L A e q ) and reduction of L A e q ( Δ L A e q ) were also obtained for all experiments using Equations (4)–(6).
IL 1 = SPL without window SPL with window and box .
IL 2 = SPL window without box SPL window with box .
L A e q = 10 l o g ( i = 1 n t i 10 ( S P L i 10 ) ) ,
Δ L A e q 1 = L A e q ( without window ) L A e q ( with window and box ) .
Δ L A e q 2 = L A e q ( window without box ) L A e q ( window with box ) .
where t i is a fractional number for the time period where the noise has a sound pressure level of SPL i . All other important details of the experiments are shown in Table 2.

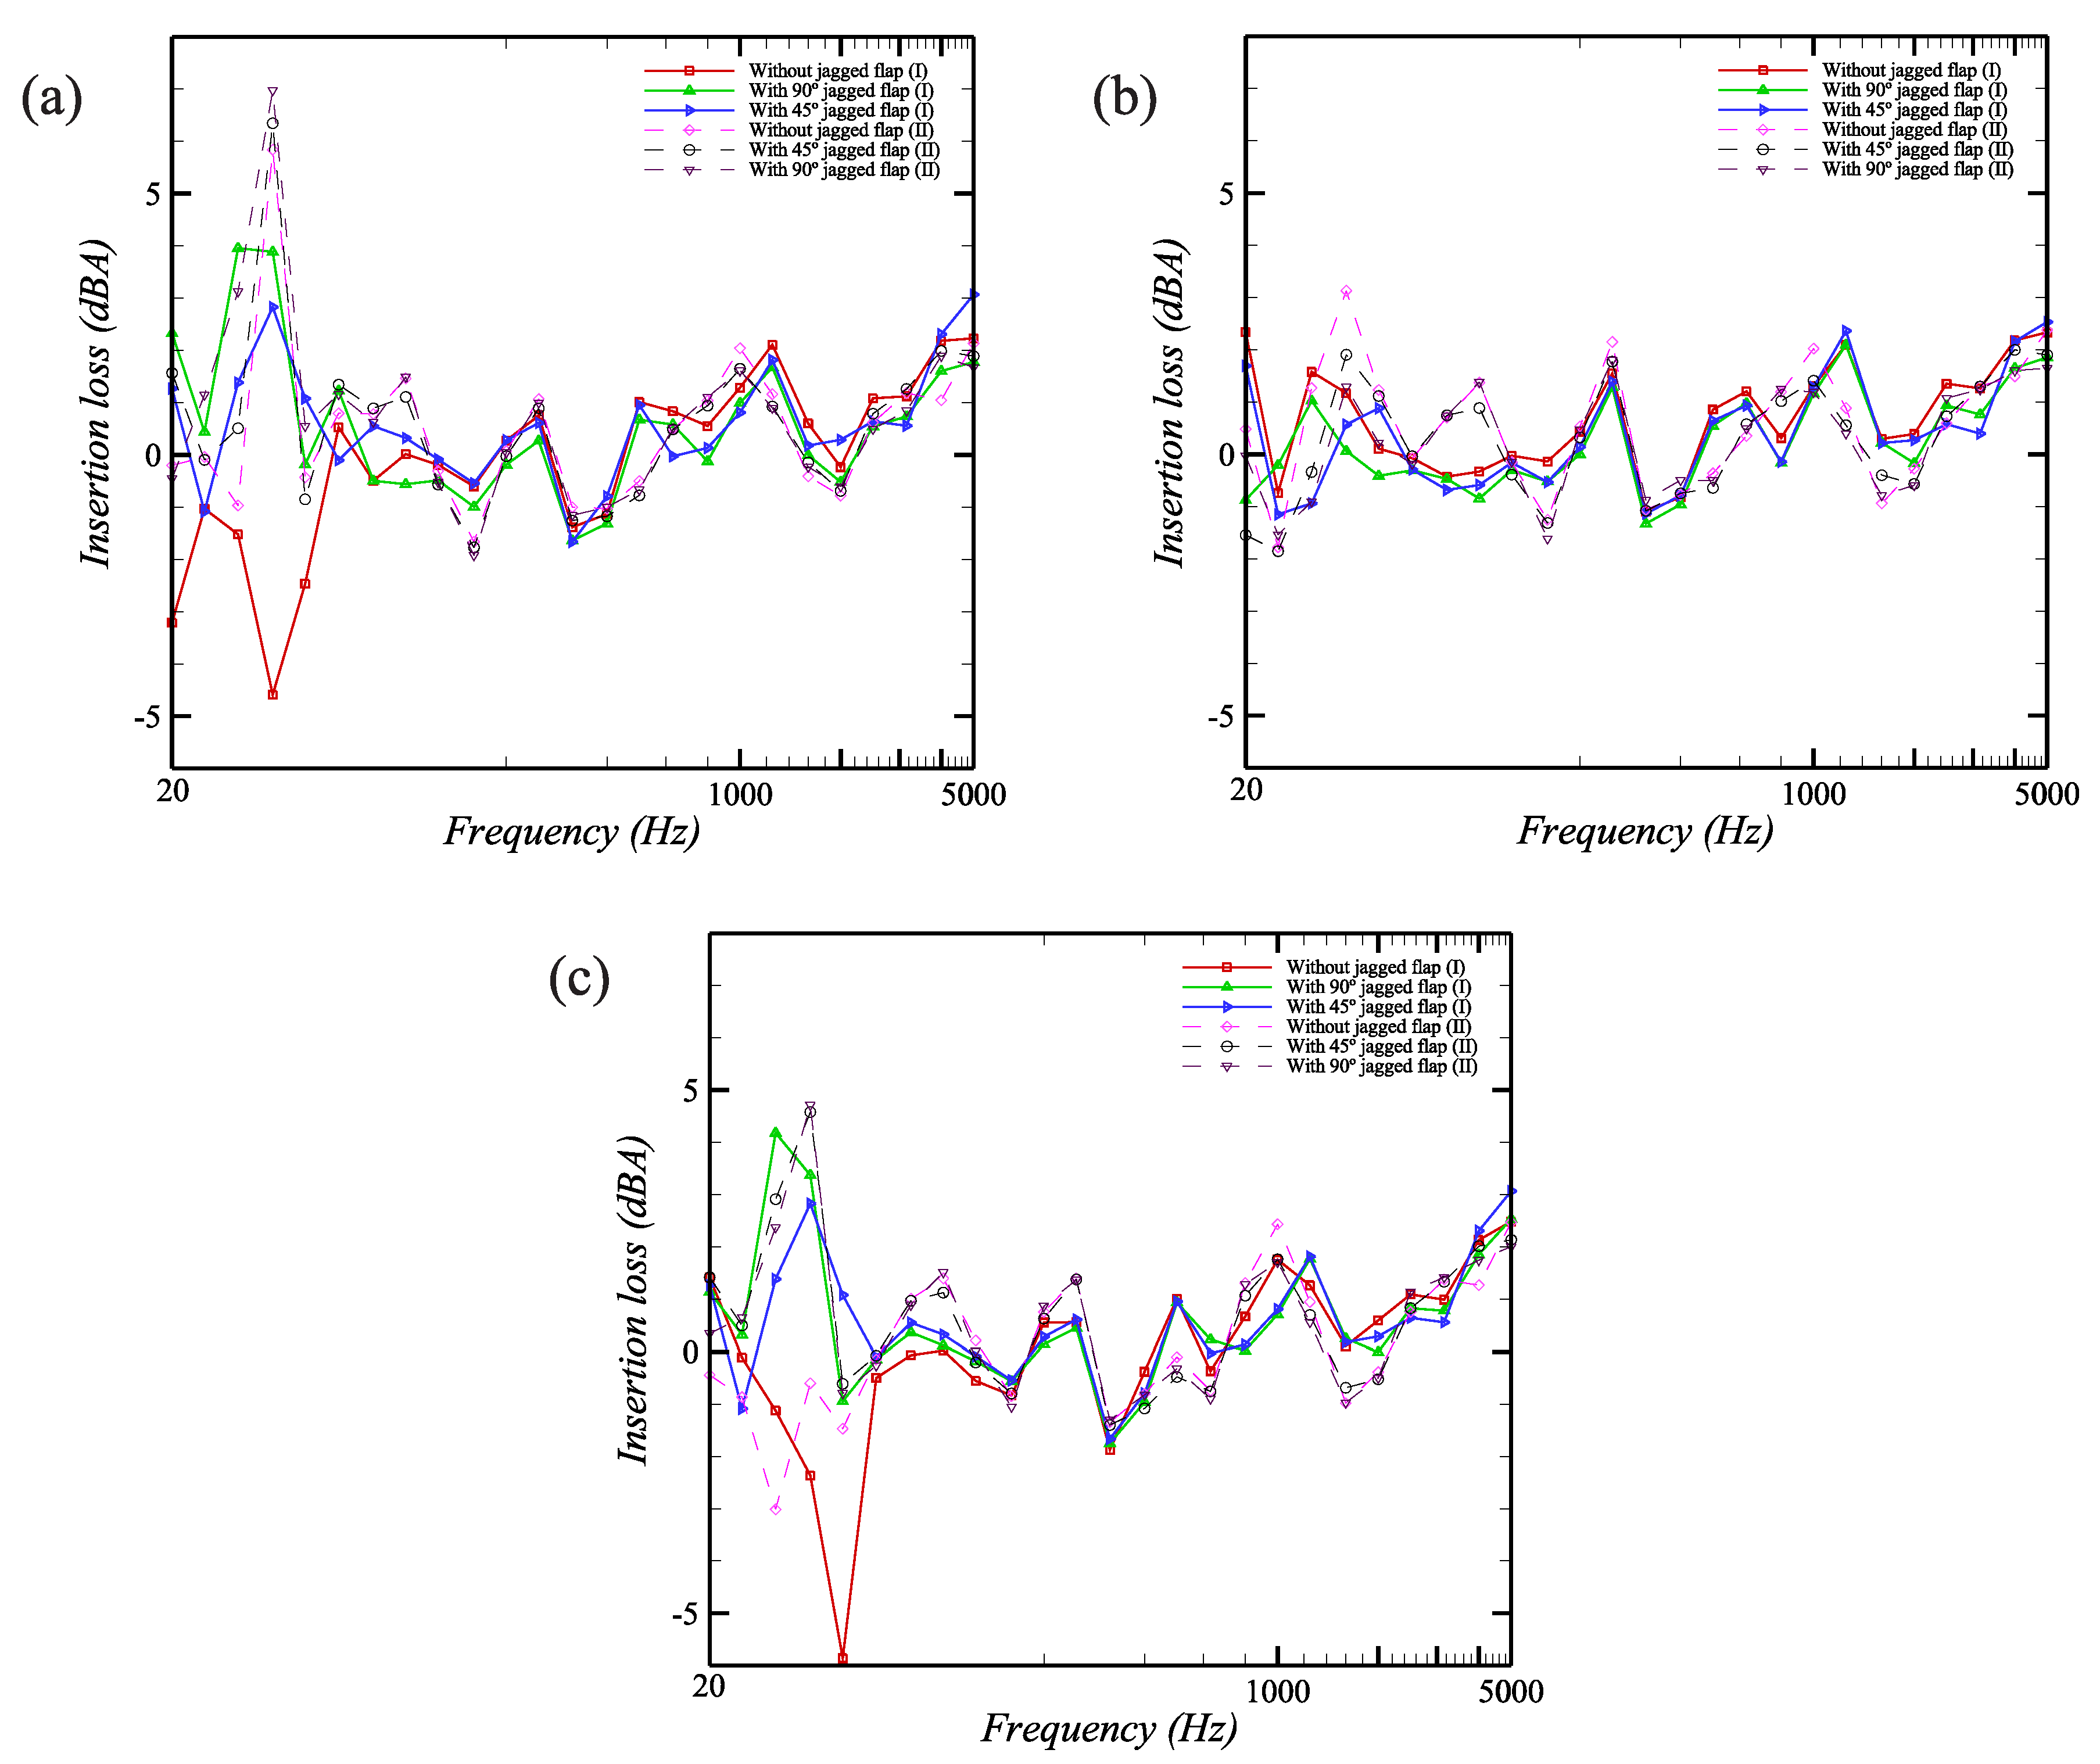
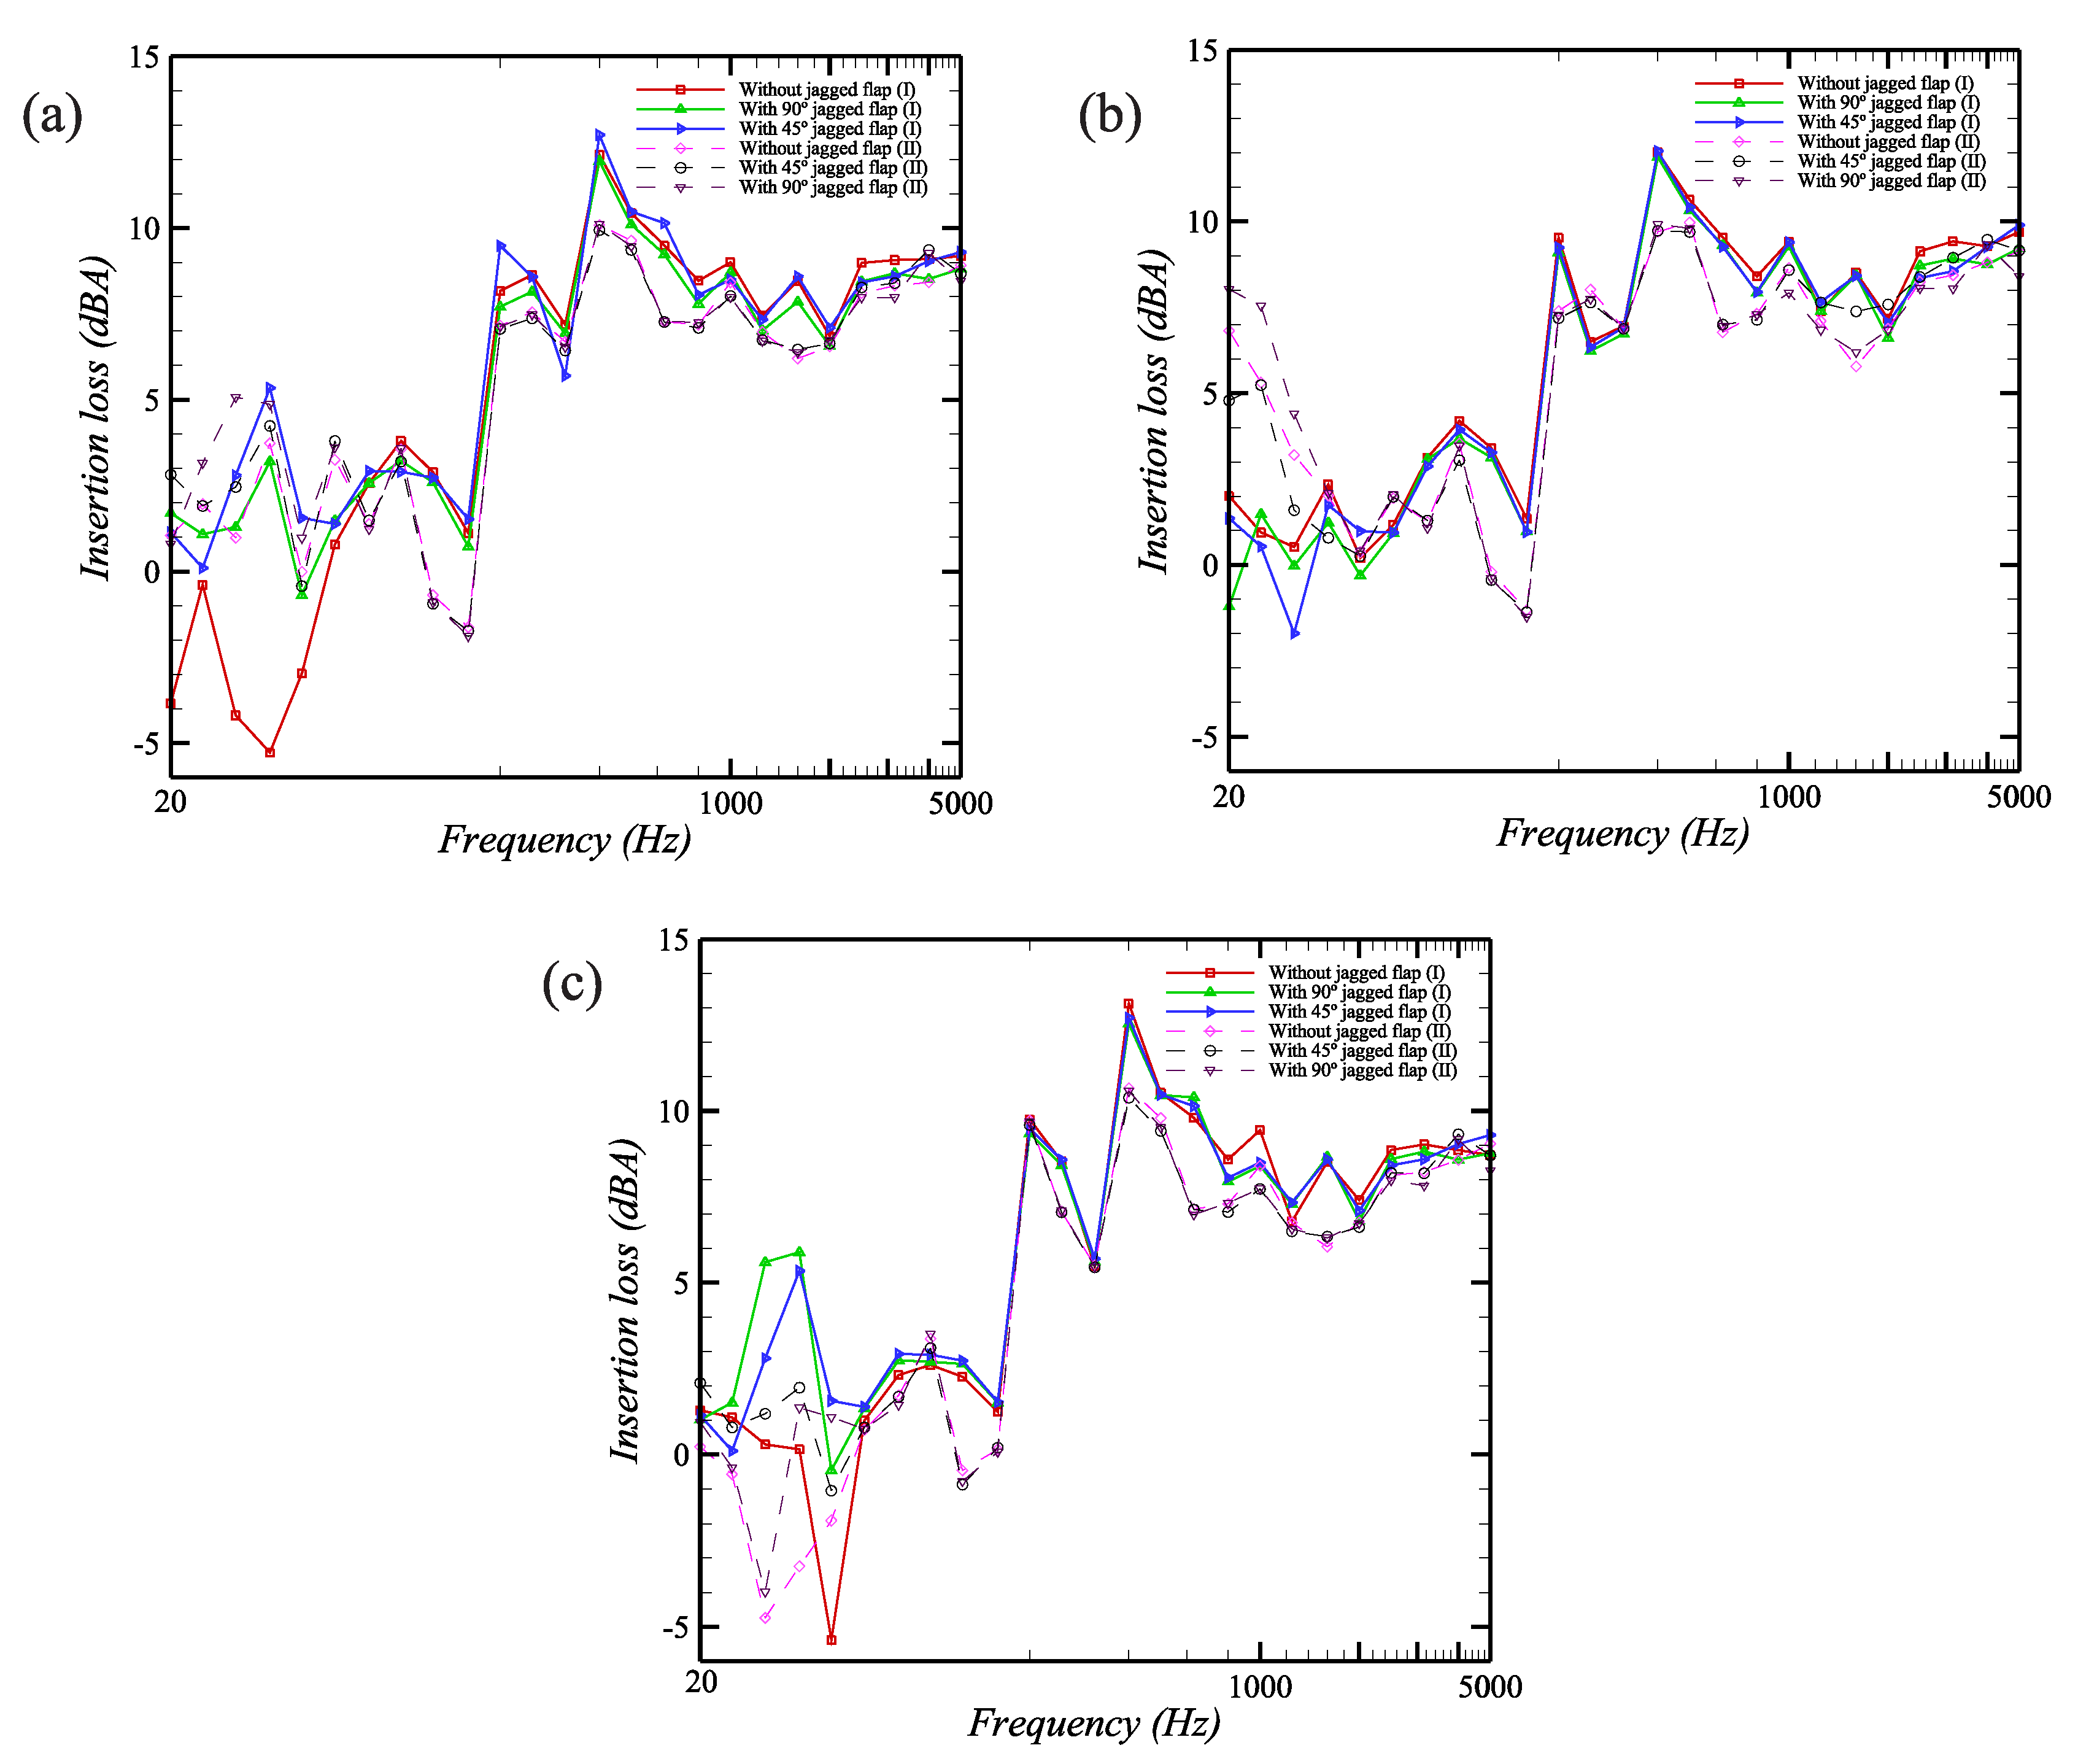
3. Results and Discussion

When frequencies are ranging from 20 Hz to 5000 Hz, Δ L A e q 1 that obtained by the plenum window with perforated thin box (compared with the case of without plenum window) is shown in Table 3. For experiment I (without jagged flap), plenum window with perforated thin box manages to reduce 8.4 dBA, 8.7 dBA and 6.9 dBA of white, traffic and construction noises, respectively. For the case where noise source faces the opening of the plenum window directly (experiment II, without jagged flap), the plenum window manages to reduce 7.2 dBA, 7.7 dBA and 6.5 dBA of white, traffic and construction noises, respectively. It is found that when the noise source is located at the central line of the plenum window, the amount of noise that attenuated by the plenum window is slightly higher than the case where noise source faces the opening of the plenum window directly even the data in the present study are measured in a reverberation room. This phenomenon might be due to the condition where for experiment I, some of the noises are blocked and are reflected back by the glass pane while for experiment II, some of the noises directly propagate through the opening of the plenum window before they have chance to be reflected by the glass pane and wall of the reverberation room. It can be concluded from Table 3 that, for frequencies ranging from 20 Hz to 5000 Hz, the effects of both 45 ° and 90 ° jagged flaps on the plenum window’s noise mitigation performance are not significant for both experiments and for all noises. This observation might be due to two reasons. First, only little noise diffraction might occur because the edge of the glass pane is around 1.08m and the gap between two glass panes is around 0.34m which means only noise with frequencies lower than 316 Hz and 1000 Hz might be diffracted over the edge and gap, respectively. Second, the geometry of the jagged flap in the current study is not optimised yet such that further investigation should be conducted to optimise the design parameters such as angle, height and length of the jagged segment.
Figure 4 shows the IL that gained by the plenum window with perforated thin box (compared with the case of without thin box) for experiments I and II and for all noises. For frequencies below 63 Hz, for the cases of white noise and construction noise without jagged flap, obvious trends of negative IL are observed. This phenomenon is due to the condition where wavelength for low frequency noise is large. These large wavelength noises are diffracted through the gap and edge of the glass panes. After these noises pass through the plenum window, their energy are enhanced due to the diffraction and this is the reason why negative IL is observed. After that, their trends are quite similar over whole frequency range except for those of experiments II with 45 ° and 90 ° jagged flap. For experiment I without any jagged flap, at frequency (630 Hz) close to the design frequency ( f r , 654 Hz), the plenum window with perforated thin box manages to reduce extra 0.8 dBA and 1.2 dBA of white and traffic noises, respectively, compared to case of without thin box. It is found that the perforated thin box has good acoustic performance in the frequency region between 800 Hz to 1250 Hz and therefore, the additional noise mitigation obtained by the thin box at this region is computed and is shown in Table 4. As expected, this frequency region is slightly higher than the f r that predicted from Equation (1). The possible reason is because the theory of Helmholtz resonance assumes that the sound propagates through the resonators directly without any obstacle in between the receiver and the sound source. However, for the present work, the existence of the glass panes acts as an obstacle to prevent the direct noise propagation from source to the receiver. When frequencies are ranging from 800 Hz to 1250 Hz (see Table 4), for experiment I if compared with the case of without thin box, the plenum window with perforated thin box is able to reduce additional 1.6 dBA, 1.2 dBA and 1.6 dBA of white, traffic and construction noises, respectively. Compared with those cases at wide frequency range (20 Hz to 5000 Hz), in this narrow frequency range, the same observation is found for experiment II and for the cases with attached jagged flap where the effect of jagged flap is also not obvious. The IL obtained by the plenum window with perforated thin box for both experiments I and II (attached 45 ° and 90 ° jagged flaps, compared with the case of without plenum window) are shown Figure A2 in Appendix A.

4. Conclusions

In the current study, conventional plenum window was incorporated with perforated thin box in order to enhance its performance at frequency range which centralized around 1000 Hz. The entire studies were conducted in a reverberation room. The effectiveness of jagged flap on mitigating strength of diffracted sound was also studied. Two types of experiments were conducted by varying the positions of the noise source. Three types of noises were examined in current studies where they were white, traffic and construction noises. For the case where noise source was positioned at the central of the plenum window, compared with the case of without plenum window, the plenum window with perforated thin box was able to attenuate 8.4 dBA, 6.9 dBA and 8.7 dBA of white, construction and traffic noises, respectively. The test results for the case where noise source faced the opening of the plenum window directly were poorer. This was because some of the noises might be propagated through the gap of the glass panes directly before they were reflected by the glass pane and the walls of reverberation room. The jagged flaps did not show significant effect on the plenum window’s noise mitigation performance. This phenomenon might be due to little amount of diffracted noise and non-optimise geometry of the jagged flap. The perforated thin box had good acoustic performance when frequencies were ranging from 800 Hz to 1250 Hz which was slightly higher than predicted resonant frequency due existence of the glass pane which blocked the direct sound propagation from source to the receiver. In this narrow frequency range, compared with the case of without perforated thin box, the plenum window with perforated thin box was able to reduce additional 1.6 dBA, 1.2 dBA and 1.6 dBA of white, traffic and construction noises, respectively. Further investigations are required to study the effects of jagged flap and also the perforated thin box with various geometrical parameters such as diameter of hole and thickness of box on the plenum window’s acoustic performance. In addition, the performance of this system when installed in real properties might be slightly different with the laboratory test results because in actual indoor environment, the walls of the room cannot be fully reverberant as those of reverberation chamber. Thus, a field experiment is required to study the performance of this system in actual indoor environment.

Author Contributions

Formal analysis, writing—original draft, writing—review & editing: H.M.L.; data curation, methodology: A.H.; resources, visualization: K.M.L.; software: J.X.; conceptualization, investigation, project administration: H.P.L.; funding acquisition: H.P.L., H.M.L. and J.X. All authors have read and agreed to the published version of the manuscript.

Funding

This research was funded by Singapore Ministry of National Development and National Research Foundation [L2NICCFP1-2013-8]; National Natural Science Foundation of China [51908142]; and Natural Science Foundation of Guangdong Province [2019A1515012223, 2018A030313878].

Conflicts of Interest

The authors declare no conflict of interest.

Appendix A

Figure A1. Noise spectrum. (a) White noise (b) traffic noise (c) construction noise. Results are presented using narrow frequency band with step of 2 Hz in log scale.
Crystals 10 00614 g0a1
Figure A2. IL 1 gained by the plenum window with perforated thin box (compared with the case of without window) for experiments I and II. (a) White noise (b) traffic noise (c) construction noise. Results are presented using one third octave frequency band in log scale.
Crystals 10 00614 g0a2

References

  1. Ford, R.; Kerry, G. The sound insulation of partially open double glazing. Appl. Acoust. 1973, 6, 57–72. [Google Scholar] [CrossRef]
  2. Tang, S.; Suen, D.; Chan, S. Parametric study of the sound insulation performance of a plenum window. In Proceedings of the 24th National Conference on Noise Control Engineering, Baltimore, MD, USA, 19–21 April 2010; Volume 3, pp. 1835–1842. [Google Scholar]
  3. Tong, Y.G.; Tang, S.K. Plenum window insertion loss in the presence of a line source-A scale model study. J. Acoust. Soc. Am. 2013, 133, 1458–1467. [Google Scholar] [CrossRef] [PubMed]
  4. Yeung, M.; Ng, I.; Lam, J.; Tang, S.; Lo, D.; Yeung, D. Tackling Traffic Noise Through Plenum Windows—An Application in Hong Kong; Inter-Noise: Melbourne, Australia, 2014. [Google Scholar]
  5. Tang, S.K. Sound Transmission across Plenum Windows with Non-Parallel Glass Panes; Inter-Noise: Hamburg, Germany, 2016. [Google Scholar] [CrossRef]
  6. Tong, Y.G.; Tang, S.K.; Kang, J.; Fung, A.; Yeung, M.K.L. Full scale field study of sound transmission across plenum windows. Appl. Acoust. 2015, 89, 244–253. [Google Scholar] [CrossRef]
  7. Tang, S.K.; Tong, Y.G.; Tsui, K.L. Sound transmission across a plenum window with an active noise cancellation system. Noise Control Eng. J. 2016, 64, 423–431. [Google Scholar] [CrossRef]
  8. Du, L.; Lau, S.K.; Lee, S.E. Experimental study on sound transmission loss of plenum windows. J. Acoust. Soc. Am. 2019, 146, EL489–EL495. [Google Scholar] [CrossRef] [PubMed]
  9. Li, X.; Tong, Y.; Tang, S.; Lau, K. Empirical prediction of traffic noise transmission loss across plenum windows. Appl. Acoust. 2019, 151, 45–54. [Google Scholar] [CrossRef]
  10. Ji, W.G.; Yang, H.S.; Kim, T.M.; Kim, G.T. Development of Natural Ventilation Devices Attached to Building Envelope to Reduce Traffic Noise; Inter-Noise: Madrid, Spain, 2019; pp. 1–11. [Google Scholar]
  11. Chan, M.C.; Yeung, D.B. The Development of an Innovative Noise Mitigation Measure for a Luxury Seaview Residential Development; Inter-Noise: Madrid, Spain, 2019; pp. 1–8. [Google Scholar]
  12. Yu, X.; Lau, S.K.; Cheng, L.; Cui, F. A numerical investigation on the sound insulation of ventilation windows. Appl. Acoust. 2017, 117, 113–121. [Google Scholar] [CrossRef]
  13. Sandberg, U. The multi-coincidence peak around 1000 Hz in tyre/road noise spectra. In Proceedings of the 5th European Conference on Noise Control and AIA 2003 (Euronoise 2003), Naples, Italy, 19–21 May 2003; Volume 498, pp. 1–8. [Google Scholar]
  14. Menounou, P.; Busch-Vishniac, I. Jagged edge noise barriers. Build. Acoust. 2000, 7, 179–200. [Google Scholar] [CrossRef]
  15. Menounou, P.; You, J. Design of a jagged-edge noise barrier: Numerical and experimental study. Noise Control Eng. J. 2004, 52, 210–224. [Google Scholar] [CrossRef]
  16. Menounou, P.; You, J. Experimental study of the diffracted sound field around jagged edge noise barriers. J. Acoust. Soc. Am. 2004, 116, 2843–2854. [Google Scholar] [CrossRef]
  17. Wang, Z.; Lim, K.M.; Prachee, P.; Lee, H.P. Applications of noise barriers with a slanted flat-tip jagged cantilever for noise attenuation on a construction site. J. Vib. Control 2018, 24, 5225–5232. [Google Scholar] [CrossRef]
  18. Everest, F.A.; Pohlmann, K.C. Master Handbook of Acoustics, 5th ed.; Mc Graw Hill: New York, NY, USA, 2009. [Google Scholar]
Figure 1. (a) Experimental set-up of the plenum window with perforated thin box at reverberation room. (b) Plenum window with attached 90 ° jagged flap. (c) Geometry of the jagged flap. (d) Schematic diagram of the experiment set up (top view, t = thickness, detailed geometry of the perforated thin box is shown in Figure 2).
Crystals 10 00614 g001
Figure 2. Geometry of the perforated thin box, only 15 rows of the holes are shown for brevity (all units are in mm). (a) Front view (b) side view.
Crystals 10 00614 g002
Figure 3. Experimental set-up of experiments I and II (schematic diagram, top view, without perforated thin box).
Crystals 10 00614 g003
Figure 4. IL 2 gained by the plenum window with perforated thin box (compared with the case of without thin box) for experiments I and II. (a) White noise (b) traffic noise (c) construction noise. Results are presented using one third octave frequency band in log scale.
Crystals 10 00614 g004
Table 1. All tested conditions.
ExperimentDistance Between Noise Source and Plenum WindowJagged FlapNoise Source
I1.95 mWithout, 45 ° and 90 ° White, traffic and construction noises
IIDiverged 30 ° Without, 45 ° and 90 ° White, traffic and construction noises
Table 2. Important details of the experiment.
Experiment DetailsASTM E90-09 StandardPresent Studies
Volume of each reverberation room>80 m 3 ∼84 m3
Variations of temperature during measurements≤±3 ° C≤±2 ° C
Measurement range100 Hz to 5000 Hz20 Hz to 5000 Hz
Class of microphoneClass 1Class 1
Function of the windowWindow specimens shall be able to open and close in a normal mannerPlenum window could be opened and closed normally
Table 3. Δ L A e q 1 (dBA) for experiments I and II when frequencies are ranging from 20 Hz to 5000 Hz. W, T and C represent white, traffic and construction noises, respectively. Results are computed using narrow frequency band with step of 2 Hz.
ExperimentI (W)II (W)I (T)II (T)I (C)II (C)
Without jagged flap8.47.28.77.76.96.5
With 90 ° jagged flap8.07.38.57.66.96.5
With 45 ° jagged flap8.27.38.67.77.06.5
Table 4. Δ L A e q 2 ( dBA) for experiments I and II when frequencies are ranging from 800 Hz to 1250 Hz. W, T and C represent white, traffic and construction noises, respectively.Results are computed using narrow frequency band with step of 2 Hz.
ExperimentI (W)II (W)I (T)II (T)I (C)II (C)
Without jagged flap1.61.91.21.81.62.1
With 90 ° jagged flap1.21.61.01.40.91.6
With 45 ° jagged flap1.31.61.11.30.91.6

