Article

Influence of the Aggregate Surface Conditions on the Strength of Quick-Converting Track Concrete

1
Department of Civil and Environmental Engineering, Sejong University, 98 Gunja-Dong, Gwangjin-Gu, Seoul 05006, Korea
2
Korea Railroad Research Institute, 176 Railroad Museum Road, Uiwang-si, Gyeonggi-do 16105, Korea
3
School of Urban and Environmental Engineering, Ulsan National Institute of Sciences and Technology (UNIST), 50 UNIST-gil, Ulju-gun, Ulsan 44919, Korea
*
Authors to whom correspondence should be addressed.
Crystals 2020, 10(6), 543; https://doi.org/10.3390/cryst10060543
Submission received: 25 May 2020 / Revised: 15 June 2020 / Accepted: 17 June 2020 / Published: 24 June 2020

Abstract

:
This experimental study investigates the effects of the aggregate surface conditions on the compressive strength of quick-converting track concrete (QTC). The compressive strength of QTC and interfacial fracture toughness (IFT) were investigated by changing the amount of fine abrasion dust particles (FADPs) on the aggregate surface from 0.00 to 0.15 wt% and the aggregate water saturation from 0 to 100%. The effects of aggregate water saturation on the compressive strength of the QTC and IFT were notably different, corresponding to the amount of FADPs. As the aggregate water saturation increased from 0 to 100%, in the case of 0.00 wt% FADPs, the IFT decreased from 0.91 to 0.58 MPa∙mm1/2, and thus, the compressive strength of the QTC decreased from 34.8 to 31.4 MPa because the aggregate water saturation increased the water/cement ratio at the interface and, consequently, the interfacial porosity. However, as the aggregate water saturation increased from 0 to 100%, in the case of 0.15 wt% FADPs, the compressive strength increased from 24.6 to 28.1 MPa, while the IFT increased from 0.41 to 0.88 MPa∙mm1/2 because the water/cement ratio at the interface was reduced as a result of the absorption by the FADPs on the surface of the aggregates and the cleaning effects of the aggregate surface.

1. Introduction

The traditional track system, a ballasted track, is still widely regarded as one of the favored options for new railway construction projects due to low construction costs and easy maintenance. However, this type of track requires frequent repairs as a result of periodic train loads [1,2,3]. Lee and Pyo [1] developed a quickly converting track system that converts ballasted railway tracks into concrete tracks using quick-hardening materials.
During the service time of ballasted railway tracks, fine abrasion dust particles (FADPs) of aggregates are generated from the deterioration of aggregates under repeated train loads [2]. Lee et al. [2] experimentally evaluated the influence of FADPs at the interface on the strength of quick-converting track concrete (QTC). They concluded that surface cleaning of aggregates is necessary in order to achieve target strength. Lee et al. [4] additionally assessed the effects of FADPs on interfacial fracture toughness (IFT) between quick-hardening mortar (QM) and ballast aggregates in order to develop a suitable QM with high IFT. They revealed that the use of coarser silica sands and silica fume could produce the required QTC strength with a minimum cleaning process of existing ballast aggregates.
However, the effects of FADPs on the IFT between the aggregate and the QM—and subsequently on the strength of QTC—are not yet fully understood. For instance, ballast aggregates are generally placed in an outside environment and can be easily exposed to water through rain or snow. It is well known that the amount of water in mixing concrete should be adjusted to correspond to the content of water saturation and surface condition of aggregates because the W/C ratio would change if water saturation of the aggregate is not constant [5]. Thus, it can be expected that the water saturation content of the aggregate would substantially affect the compressive strength of QTC.
This experimental study aims to further understand the effects of the aggregate surface condition on the strength development of QTC. The detailed purposes are to experimentally evaluate the effects of FADPs that are adhered to the surface of aggregates and the effects of different water saturation content of the aggregate on the IFT between the aggregate and the QM and, subsequently, on the strength development of QTC.

2. Aggregate Conditions and the Properties of Concrete

Many studies have been carried out to characterize the influence of aggregate conditions, e.g., aggregate moisture content, type, roughness, and surface deformation, on the mechanical properties of concrete [6,7,8,9,10,11,12,13,14,15,16,17,18]. Aggregate water saturation generally produces negative effects on the interfacial bonding between the matrix (cement paste or mortar) and inclusions (coarse aggregate) [6,7]. Oliveira and Vazquez [6] investigated the influence of the moisture of recycled aggregate on the strength and durability of concrete and reported that saturated aggregates showed lower flexural strength. Poon et al. [7] revealed that air-dried aggregates produce a better compressive strength than that of water-saturated aggregates. On the other hand, Lee and Lee [8] reported that saturated surface-dry aggregates exhibit higher concrete strength than air-dried and sun-dried aggregates because oil palm shell aggregates are more efficient for internal curing because of the higher absorption capacity of oil palm shell aggregate.
The aggregate type also significantly affects concrete strength [9,10,11,12,13]. Ozturan and Cecen [9] claimed that basalt and limestone generate higher concrete strength than gravel aggregates. The effects of aggregate type on concrete strength show significantly different results in high-strength concrete [10], where crushed quartzite aggregates indicate higher concrete strength than marble aggregates. Beshr et al. [11] also reported that the influences of the type of aggregate on concrete strength are considerable in high-strength concrete. Petros et al. [12] investigated the interpretation of the adverse effects of the secondary products in two types of rocks during their performance as concrete aggregates. They reported that abnormal hydration reactions and considerable swelling of the smectite result in the appearance of defects in the concrete, hence contributing to its low performance. Petros et al. [13] investigated the effects of the aggregate type on concrete strength. They reported that the mineralogy and microstructure of the coarse aggregates affected the strength of concrete.
Aggregate surface roughness [14,15] and the aggregate shapes [16] also have substantial effects on the mechanical properties of concrete. Rao et al. [14] reported that an increase of the roughness of aggregates contributes to an increase in the interfacial bonding between the aggregate and mortar. In addition, Hong et al. [15] revealed that concrete strength variation would correspond to the roughness of the aggregate. Rocco and Elices [16] reported that the concrete that uses crushed aggregates shows better mechanical properties of concrete than the concrete that uses spherical aggregates.
In addition, surface-coating of the aggregate with pozzolanic materials produces noticeable effects on concrete properties [17,18,19]. Kong et al. [17] concluded that the surface-coating of the aggregate with pozzolanic particles consumes calcium hydroxide (CH) in the pores and interface between the aggregate and mortar, thus forming new hydration products. This phenomenon improves the microstructures around interfacial transition areas, further enhancing the strength and durability of concrete using the recycled aggregate. Choi et al. [19] revealed that the aggregate coated with inorganic powder strengthens the interfacial transition zone, thereby preventing micro-cracking and improving the mechanical performance of the concrete. Petros et al. [20] investigated the effects of three types of recycled materials (beer green glass, waste tile and asphalt) on concrete strength. In addition, the effects of beer green glass with quartz primer and waste tile with quartz primer on the concrete were studied. They reported that the material coated with quartz primer was suitable for obtaining optimal compressive strength results.
Pyo et al. [21] investigated the mechanical properties of ultra high performance concrete (UHPC) incorporating coarser fine aggregates with maximum particle size of 5 mm. They reported that the UHPC mixtures with dolomite and steel fibers with more than one volume percent achieved more than 150 MPa of compressive strength at the age 56 days, and showed strain hardening behavior and limited decrease in tensile strength compared to typical UHPC without coarser fine aggregates.
As many research studies found in the literature point out, the condition of aggregates is a critical factor for the properties of cement-based materials. However, the effects of aggregate conditions on the QTC strength, especially using quick-hardening mortar, are not fully understood. Specifically, investigation is needed of how aggregate water saturation affects the strength development of QTC. It is important to clarify the influence of aggregate water saturation on QTC strength to obtain the target strength of railway tracks using the proposed quick-converting method because ballast aggregates are under various climate conditions.

3. Materials and Methods

Figure 1 illustrates the detailed experimental series for clarifying the effects of aggregate surface conditions on IFT and then on the compressive strength of QTC. As shown in the figure, the first terms, “C” and “F,” indicate the compressive and IFT tests, respectively. The second terms (“00” and “15”) designate the content (0.00 and 0.15 wt%) of FADPs adhered to the surface of the aggregate with the weight ratio. Furthermore, the last term represents the aggregate water saturation content: “50” indicates a 50% aggregate water saturation content. For example, C-15-100 refers to the compressive test on the specimen using aggregates with 0.15 wt% of the FADP amount and a 100% aggregate water saturation content.

3.1. Raw Materials and Fabrication

Table 1 shows the composition of the QM matrix. Note that high early strength cement was used in this research for the purpose of the fast construction of the converting track. Polycarboxylic acid superplistizer was used as a high-range water-reducing agent (HRWRA), produced by DongNam Co., Ltd. in South Korea. The setting retarder was provided by SsangYong Co. Ltd. in South Korea. The FADPs were produced containing aggregate powder as by-products during granite processing. The maximum particle size of FADPs is 0.075 mm, which is larger than that of cement (0.005~0.03 mm). The chemical components of the used materials are summarized in Table 2. The fineness of the quick hardening cement is 5400 cm2/g, which is greater than 3200 cm2/g for normal cement type Ⅰ, and the specific gravity is 2.85, which is less than 3.15 for normal cement type Ⅰ. Both types of sand contained a large amount of SiO2. The initial setting time of this quick-hardening mortar was 30 min, and more than 30 MPa of compressive strength can be obtained after two hours of curing, as shown in Table 3. It should also be noted that the dosage of the used setting retarder would change, according to the mixing environment and the target curing time.
Cylinder specimens (100 mm in diameter and 200 mm in height) were prepared for the compressive QTC strength tests conducted according to ASTM C 39 [22]. QTC specimens were prepared by pre-filling the granite coarse aggregate with a size of 22.4 to 63 mm inside the mold and then injecting the QM. It should be noted that a series of compressive strength tests were carried out because compressive strength is one of the direct indications of overall strength of the ballastless track system. To attach the FADPs onto the aggregate surface, the following steps were conducted: the required weight of FADPs was first measured and mixed with wet coarse aggregate; then, the wet aggregate was fully dried. Saturated aggregates were prepared after immersing the aggregates, in which FADPs were applied according to the parameters in water and removing excess moisture. Although loss of FADPs may occur through this process, it is considered to be a similar condition to the actual track system, e.g., under a meteorological phenomenon.
Figure 2 illustrates the geometry of the IFT samples, and Figure 3 provides photos that show the surface condition of aggregates that correspond to different amounts of FADPs and different aggregate water saturations. The granite aggregate was collected from railway ballast. It can be seen that there is about half of the moisture remaining in the aggregate without FADPs and 50% water saturation of the aggregate surface (Figure 3b). In addition, for the aggregate with 100% water saturation, the entire surface is wet. As the content of aggregate water saturation increases, it can be seen that FADPs are mixed with water on the aggregate surface (Figure 3d–f). All the sliced aggregates were assumed to have identical roughness based on the use of the same cutting method. All specimens were cured at room temperature to create the same environment as the actual track system.
The QM mixture was prepared using a laboratory planetary mixer with a 20 L capacity. The mixing process for QM can be found in Lee et al. [4]. The digital image correlation (DIC) method was adopted in this research to characterize the interfacial crack. Random speckles were applied on the surface of IFT samples for the DIC analysis, and Figure 4 shows the prepared IFT samples before and after the stone spray application.

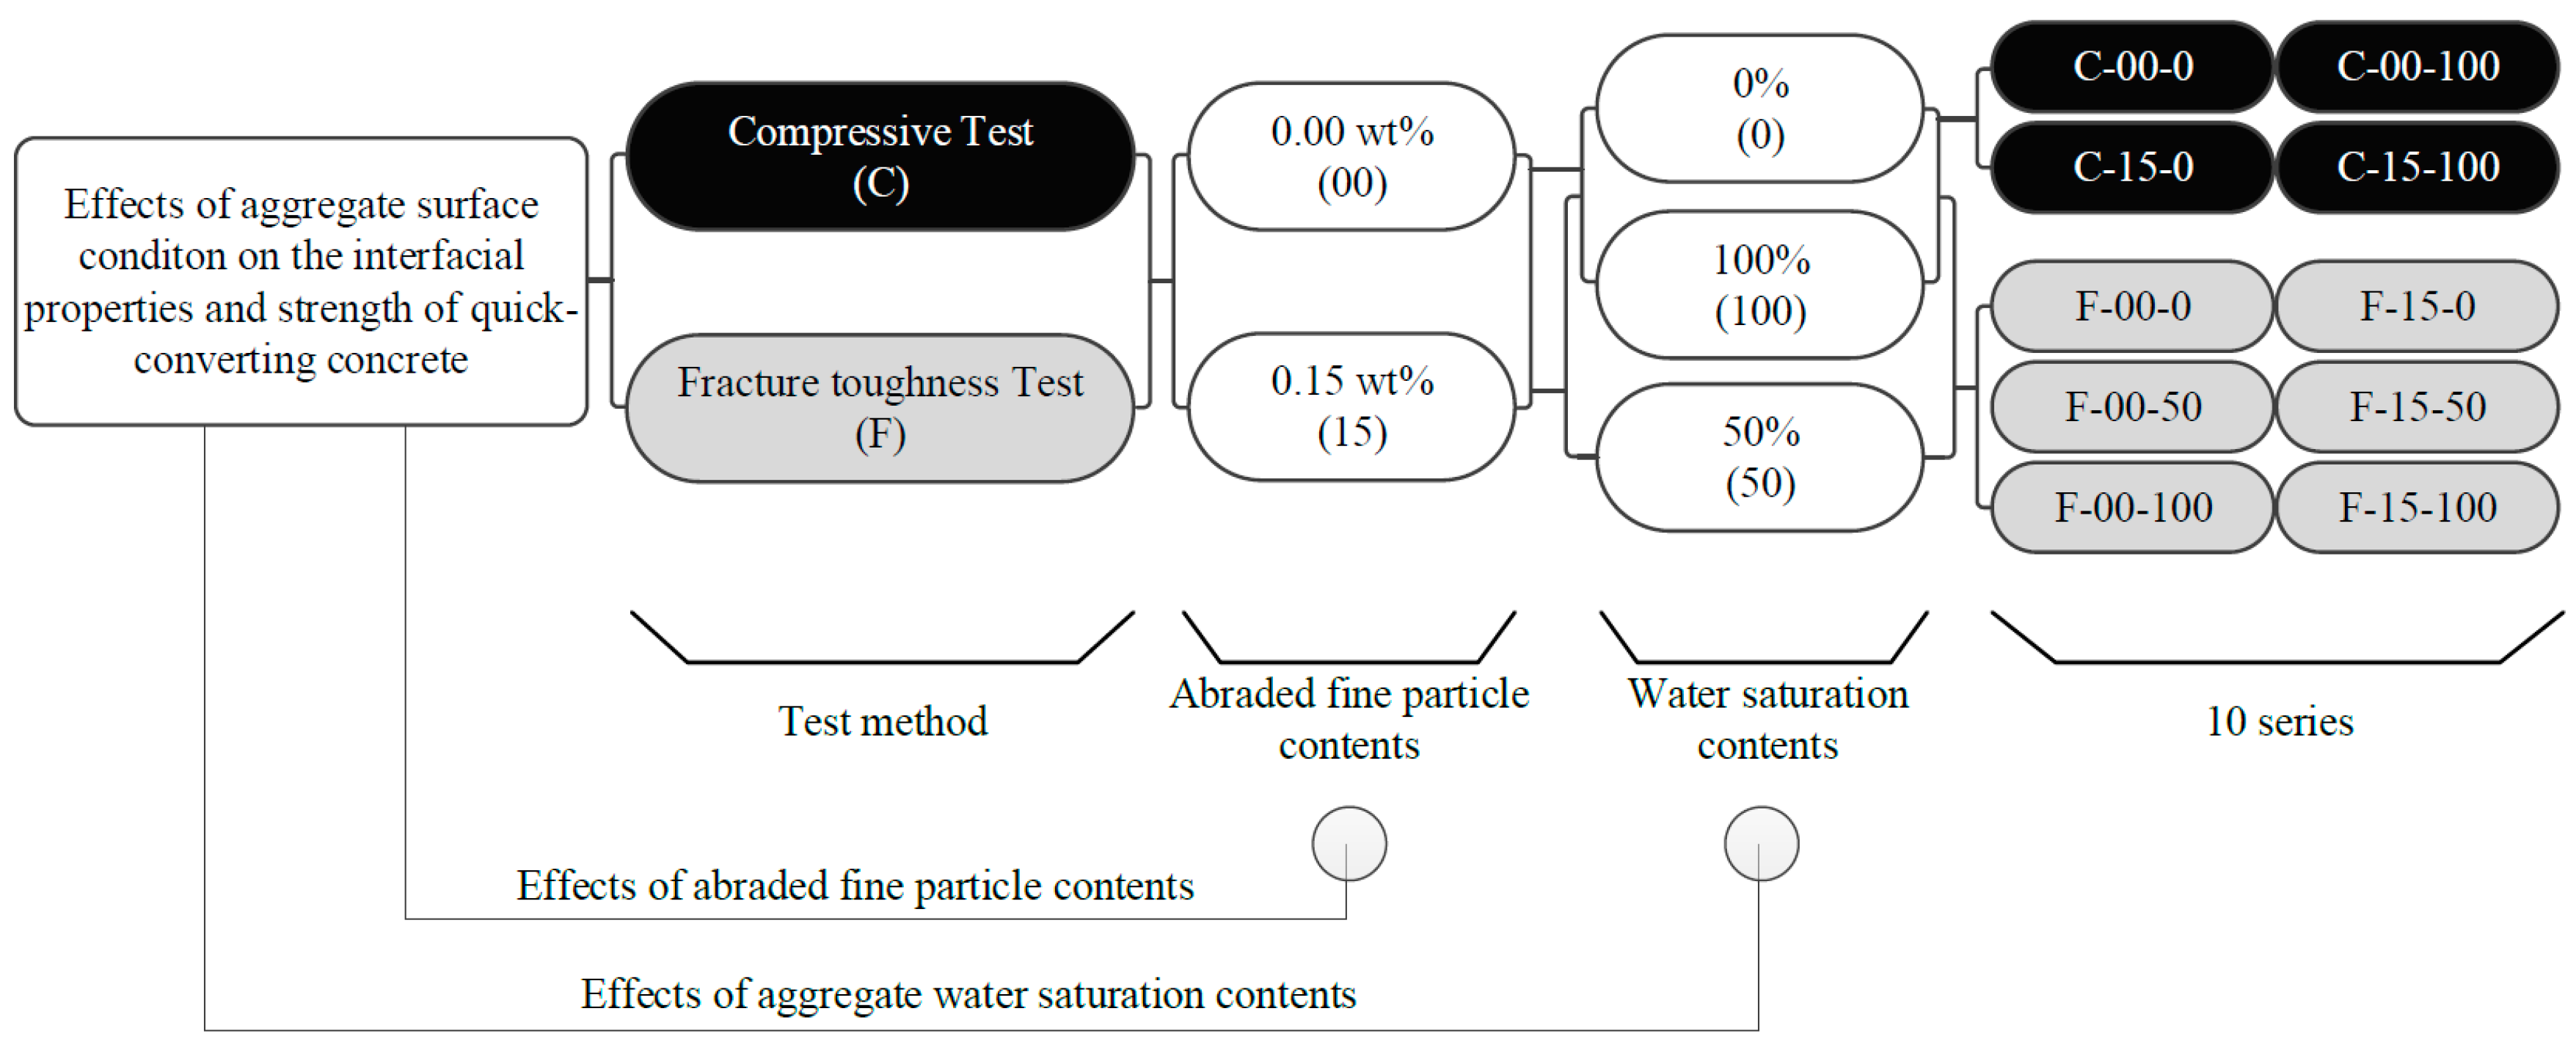
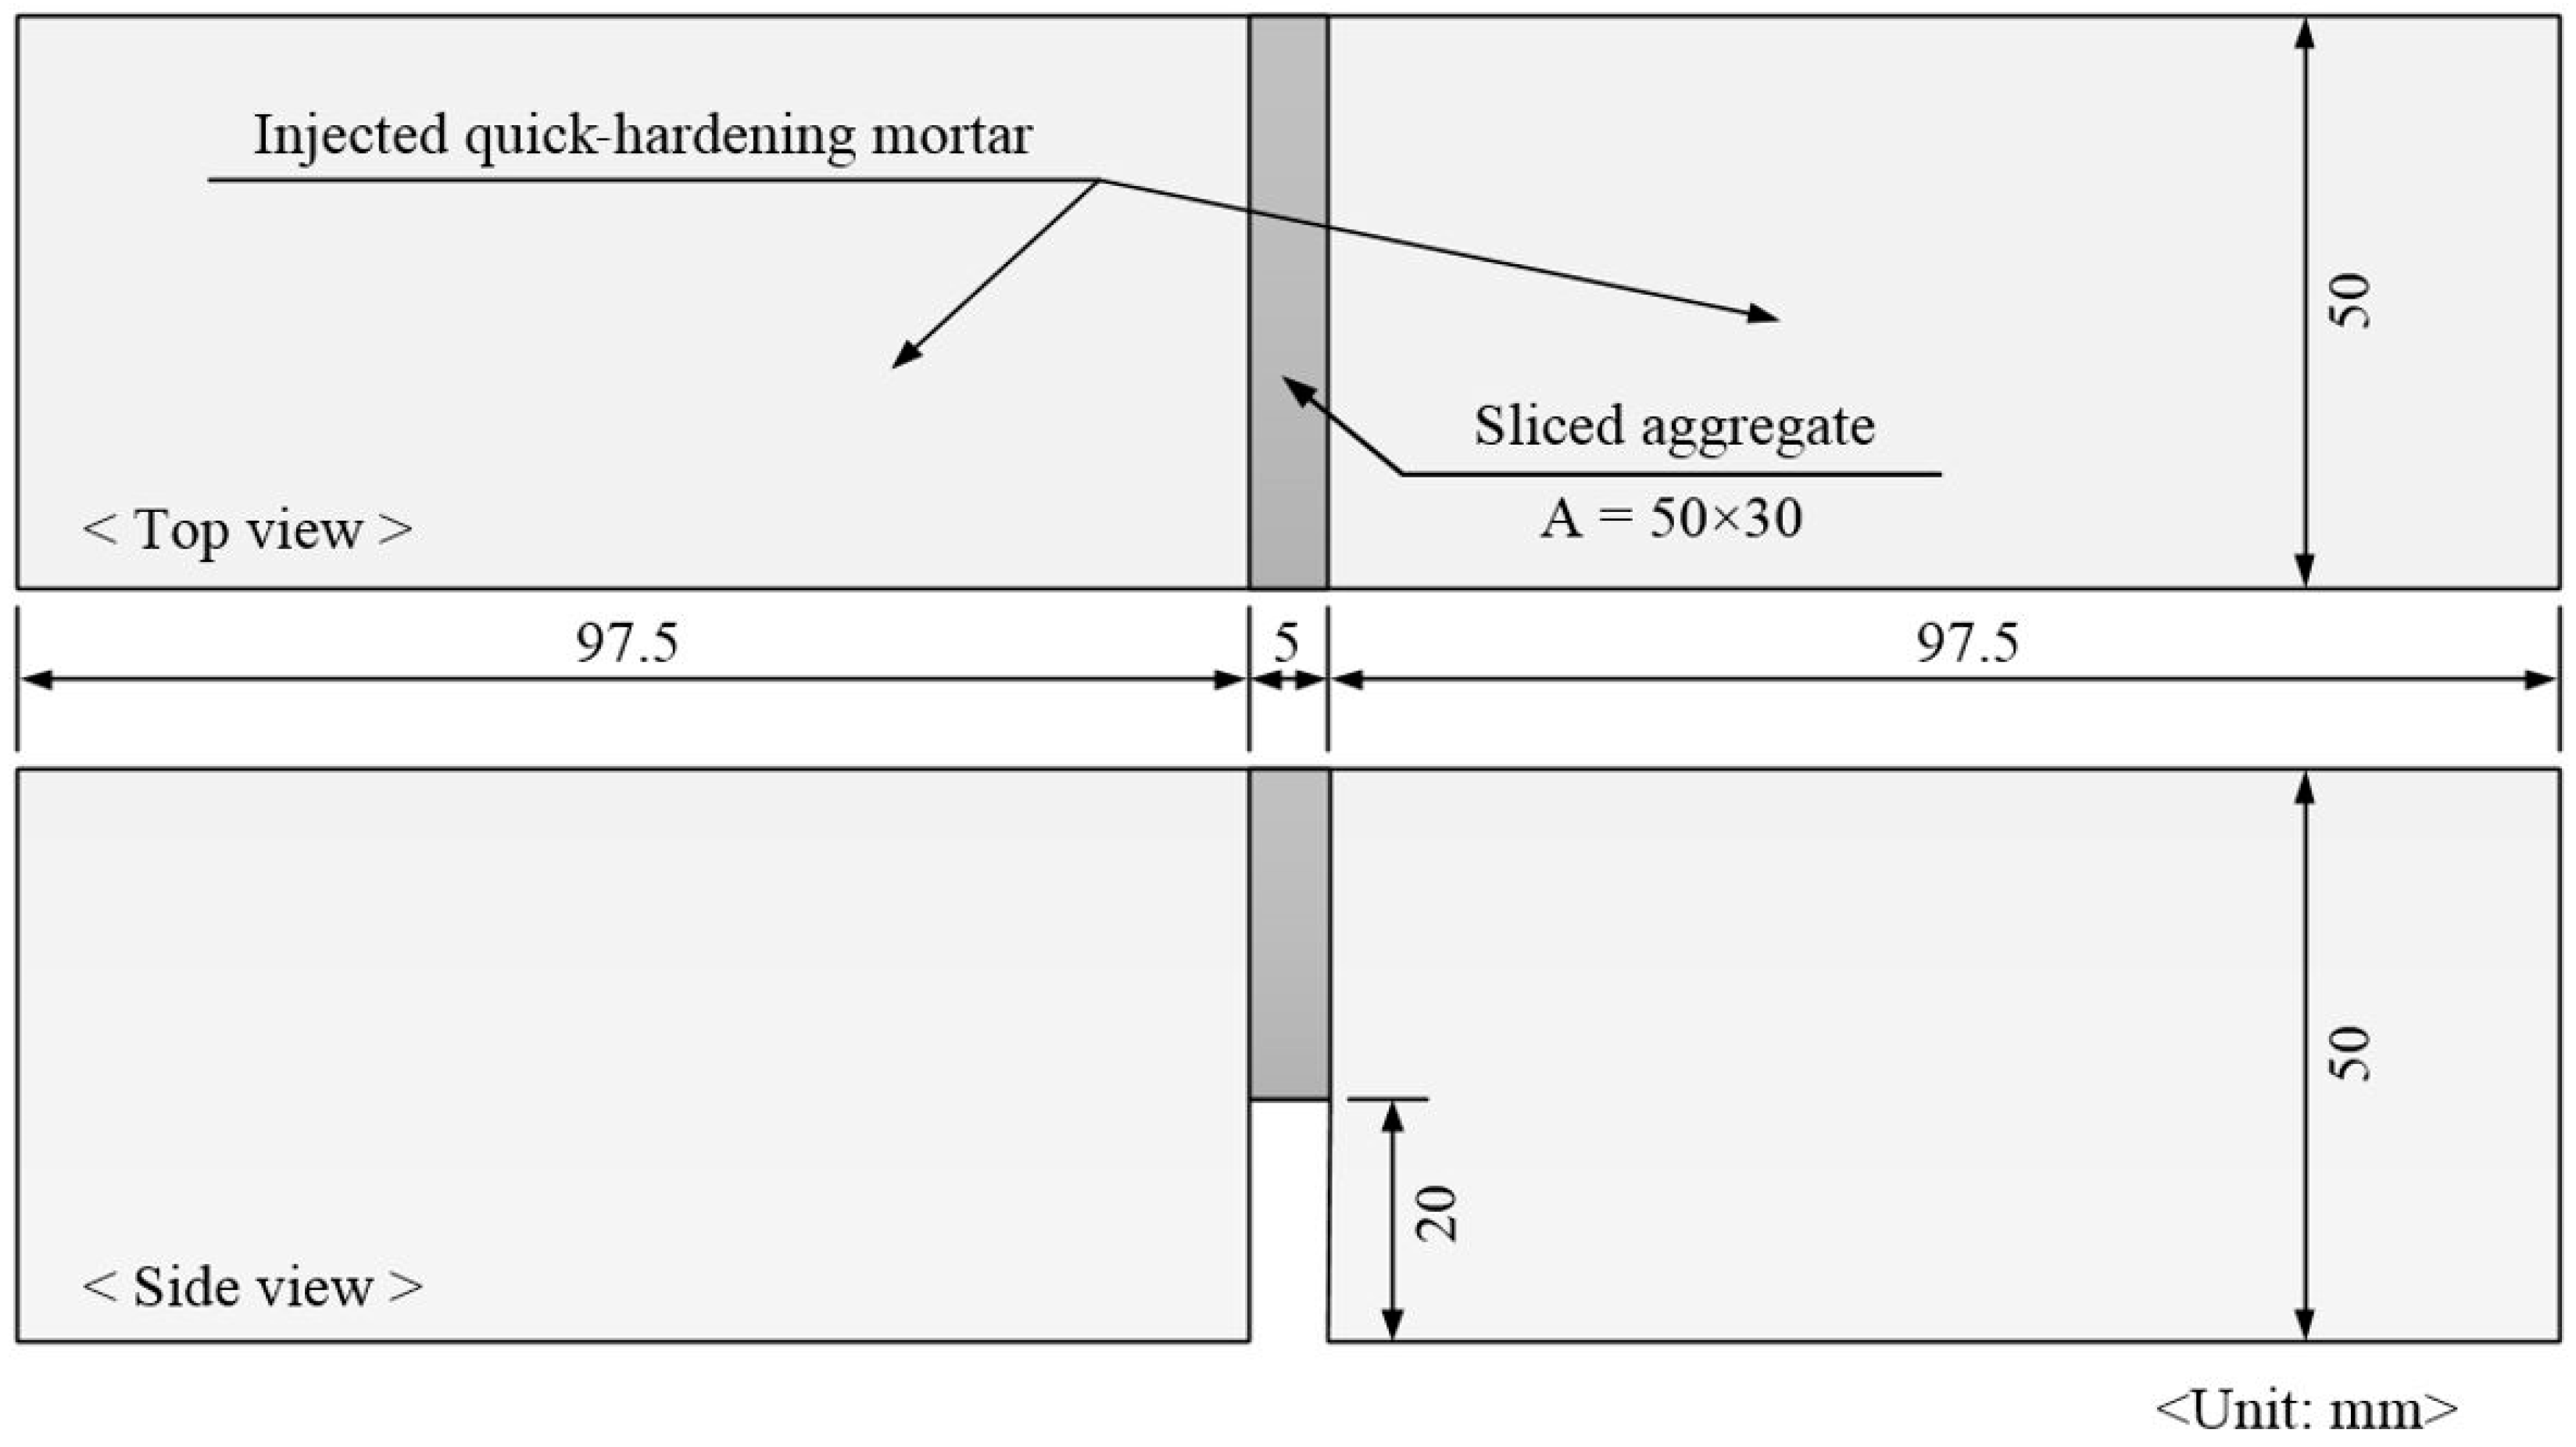
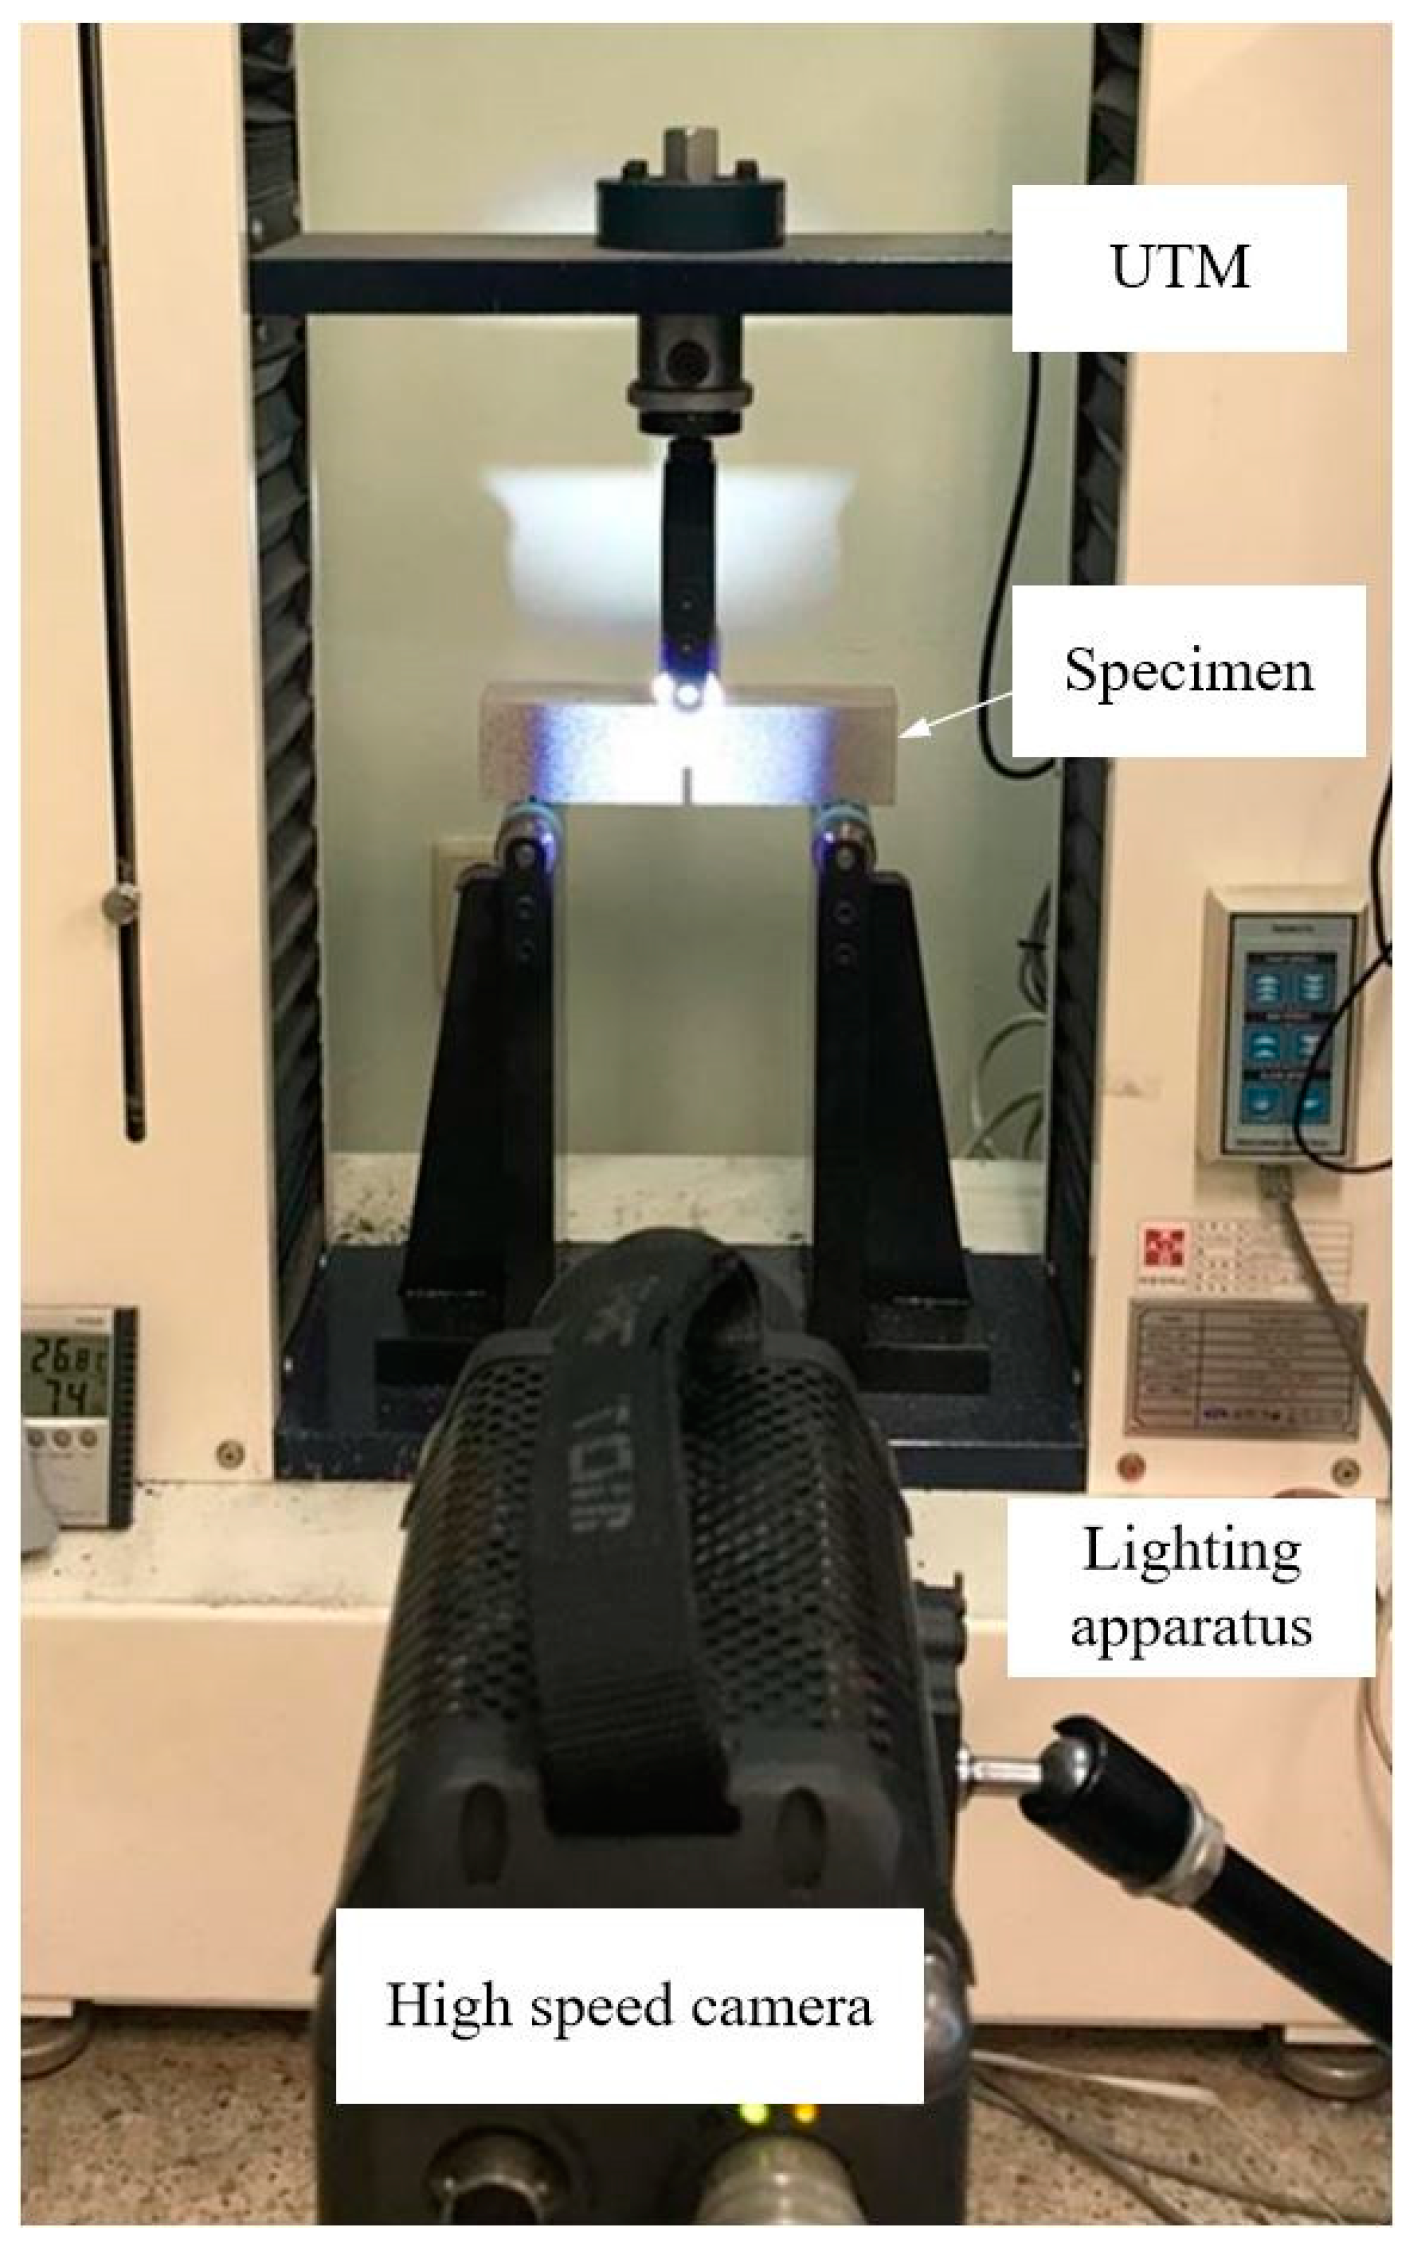
3.2. Experimental Setup and Procedure

The compressive strength of QTC was measured at the age of 7 d, under a 1.0 mm/min machine displacement rate, using a universal testing machine (UTM) with a 3000 kN capacity. The IFT test was carried out at 7 days of curing, following the same procedure used by Lee et al. [4]. A UTM with a 5 kN capacity was used and the load was applied with a speed of 0.5 mm/min using the displacement control, and the test setup is shown in Figure 5. Images for the DIC analysis were recorded using a high-speed camera and the DIC analysis after testing was performed using commercial DIC software (Tracking Eye Motion Analysis). In both tests, at least three specimens were prepared and tested.

4. Results

Table 3 provides the compressive strength of the QM used in this study, while Table 4 provides the strength of QTC that corresponds to different surface conditions of the aggregate. Figure 6 summarizes the influences of contents and of water saturation contents on the IFT. The IFT was calculated using the formula found in Lee et al. [4], which is also given in fracture mechanics by Anderson [23].

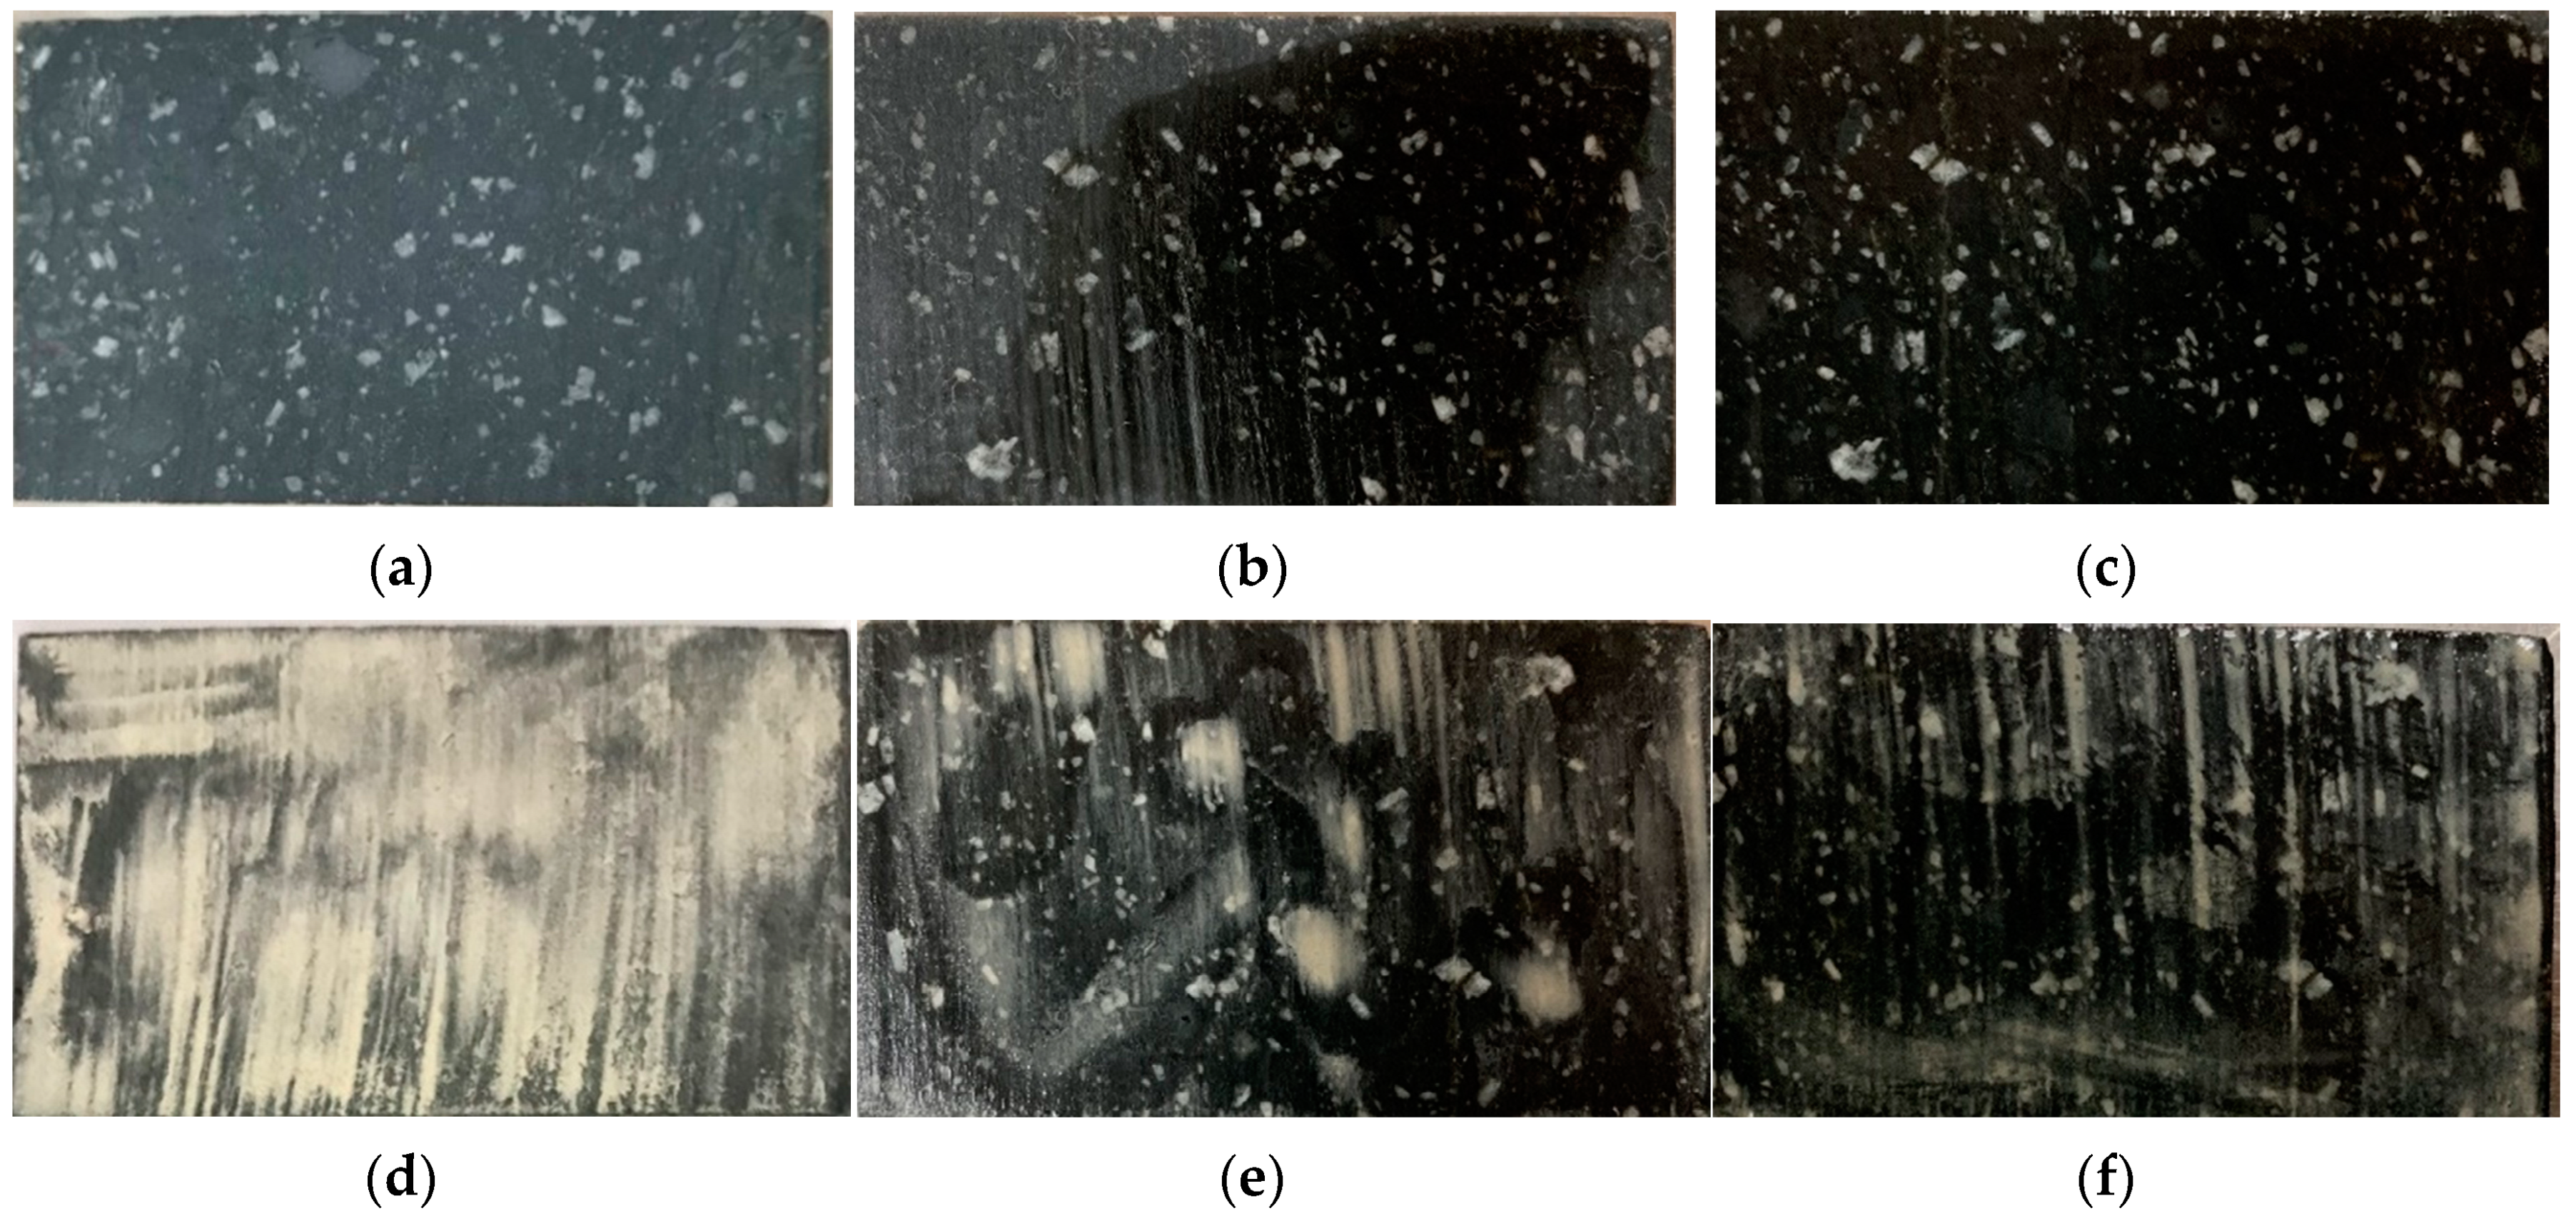
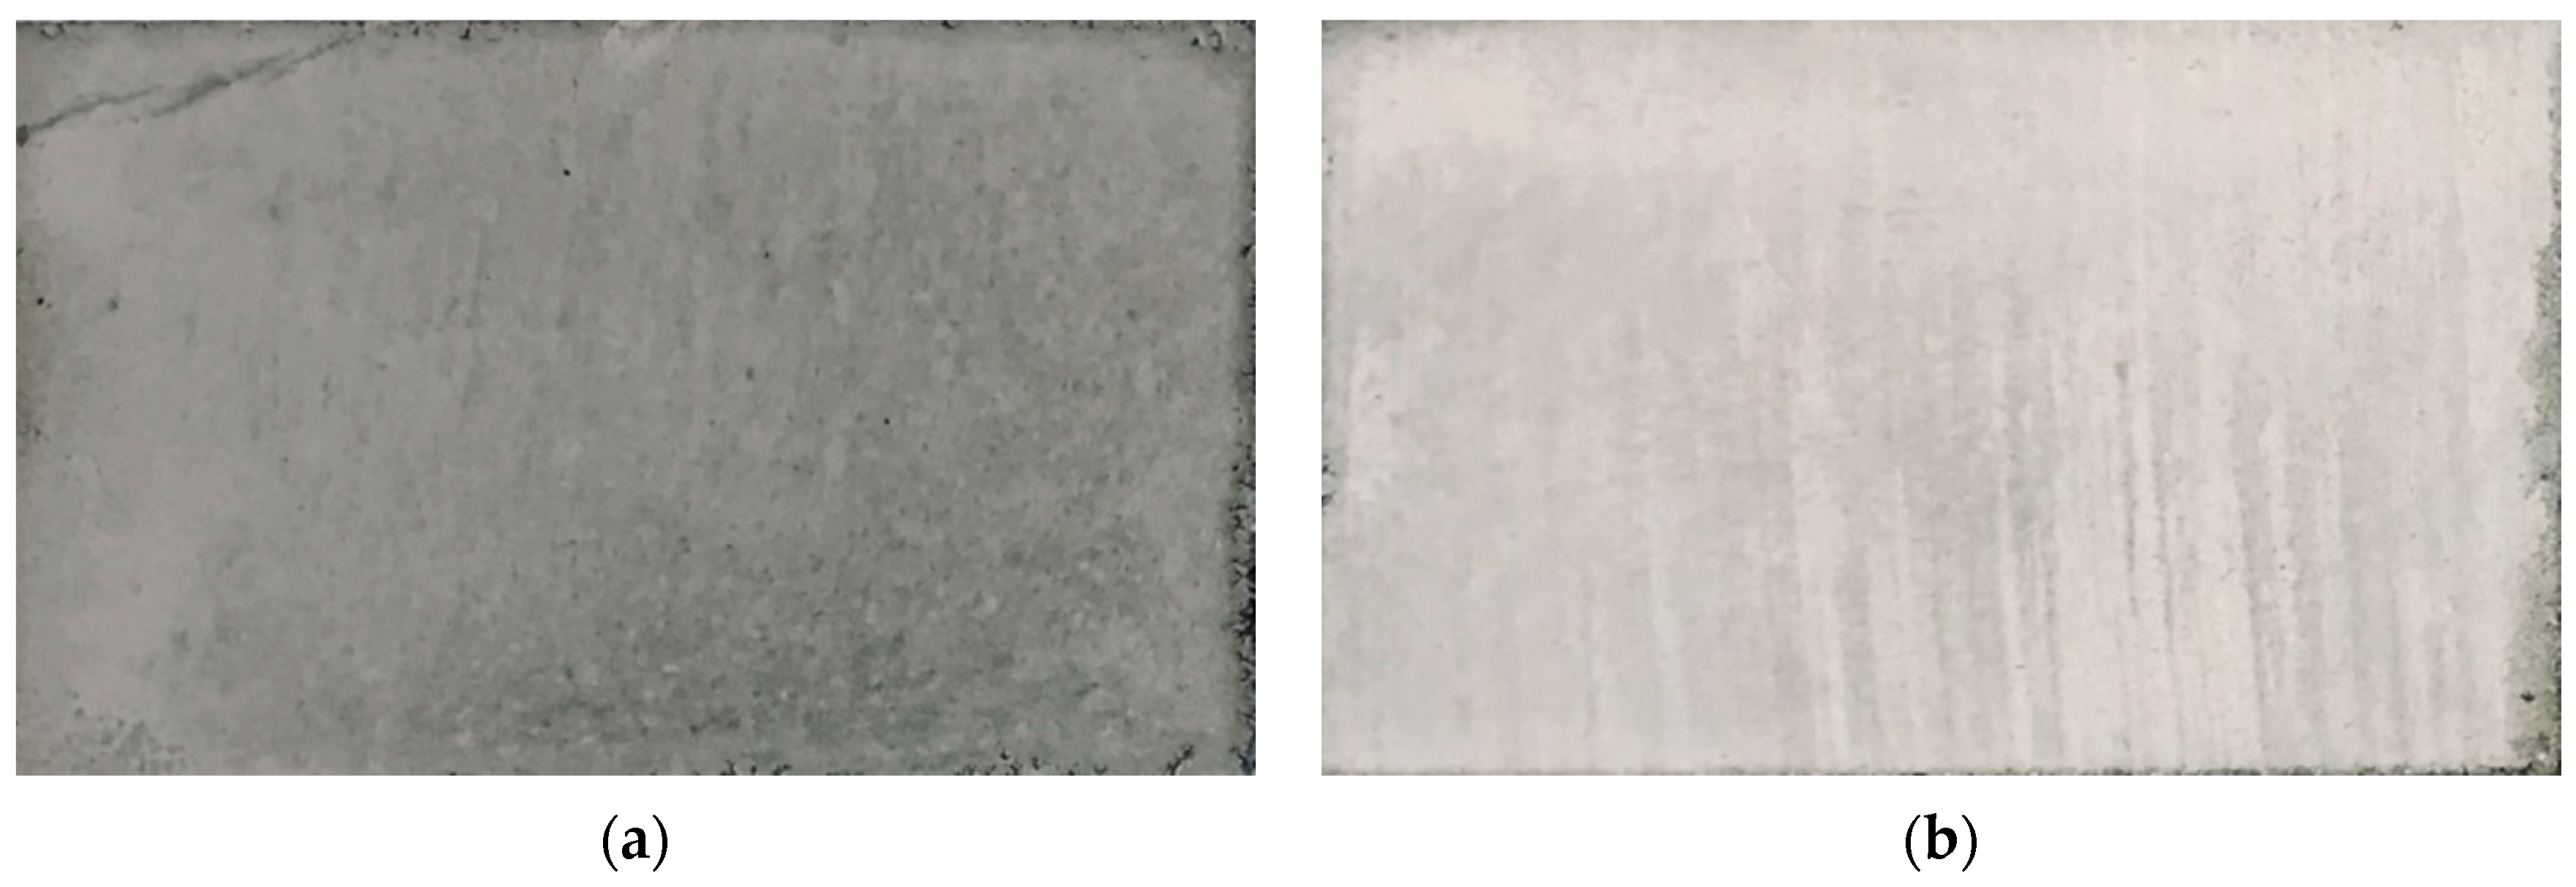
4.1. Influence of Fine Abrasion Dust Particles

As the amount of FADPs on the aggregate surface increased from 0.00 to 0.15 wt%, the compressive strength of QTC decreased from 34.8 to 24.6 MPa (Table 4) because the FADPs decreased the IFT between the sliced aggregate and QM. In addition, increasing the amount of FADPs, from 0.00 to 0.15 wt%, resulted in a decrease of IFT, from 0.91 to 0.41 MPa∙mm1/2, respectively (Figure 6). Although the effects of FADPs on both QTC strength and IFT were similar, the IFT was more sensitive to the FADPs. In Figure 6, the IFT results corresponding to 50% aggregate water saturation showed a large deviation because the location of evaporation of aggregate water saturation would be different. As can be seen in Figure 3b, it is considered that the water saturation on the aggregate surface is inhomogeneous for each specimen, which would result in a high deviation. However, the specimens with 0 and 100% aggregate water saturation produced consistent values of the IFT with smaller deviation because both aggregates with a water saturation of 0% (Figure 3a,d) and aggregate water saturation of 100% (Figure 3c,f) have the same moisture state on the aggregate surface of each specimen. The IFT of the specimens with the aggregate of abraded fine particle contents over 0.20 wt% could not be successfully tested due to premature failure near the interfaces during the casting process and hardening of the specimens. It was also difficult to measure the amount of FADPs less than 0.15 wt%.
Examples of failed surface of the interfaces between the aggregate and QM after the IFT test are shown in Figure 7. F-00-0 without FADPs on the aggregate surface showed no contaminants on the surface of the interface after the test (Figure 7a). On the other hand, as can be seen in Figure 7b, FADPs remained on the surface of the interface after tests, which is a clear indication of the fact that the reduction of IFT was the result of a decrease in IFT between the aggregate and QM. Moreover, Lee et al. [2] concluded that the strength of concrete decreased with increased FADPs because the FADPs deteriorated the interfacial bonding between the aggregate and QM. During the compression tests, the crack propagated in Mode II and/or III as well unlike the Mode I propagation of interfacial cracking during the IFT tests because the shear resistance based on the friction at the interface between the aggregate and matrix influenced the fracture modes. Thus, FADPs at the interface influenced the interfacial friction and consequently deteriorated the compressive strength of the QTC.

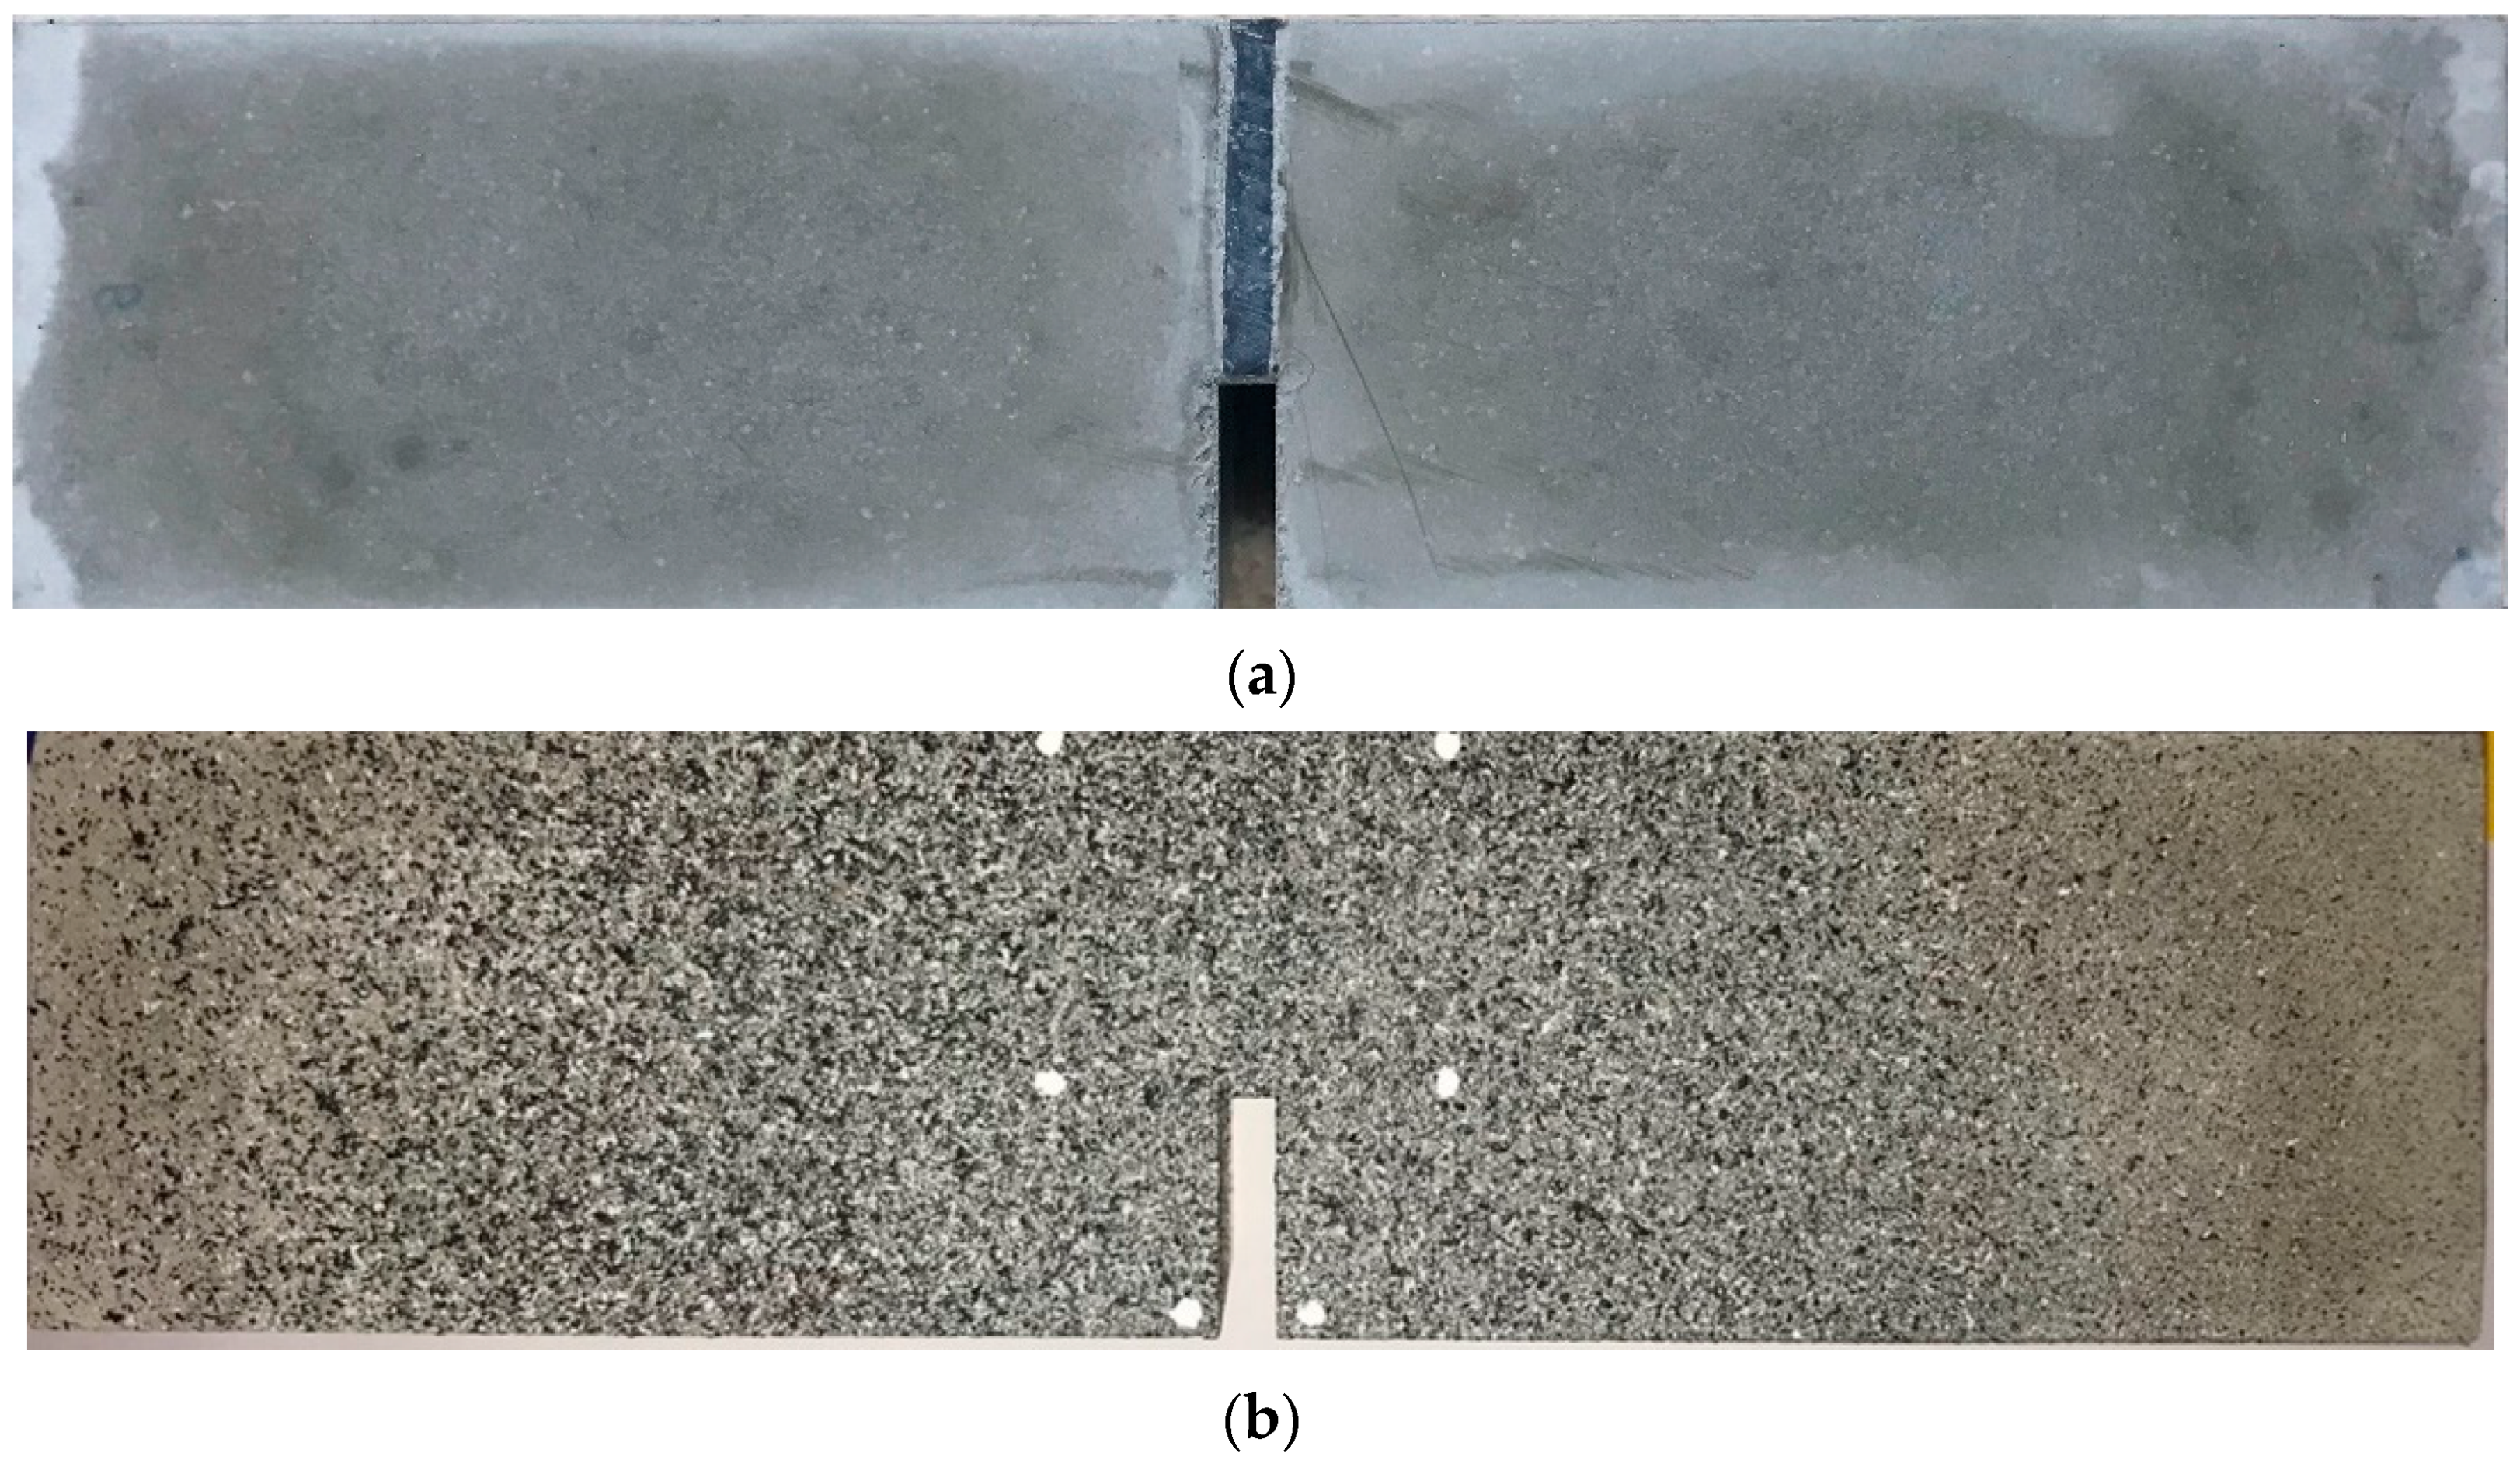
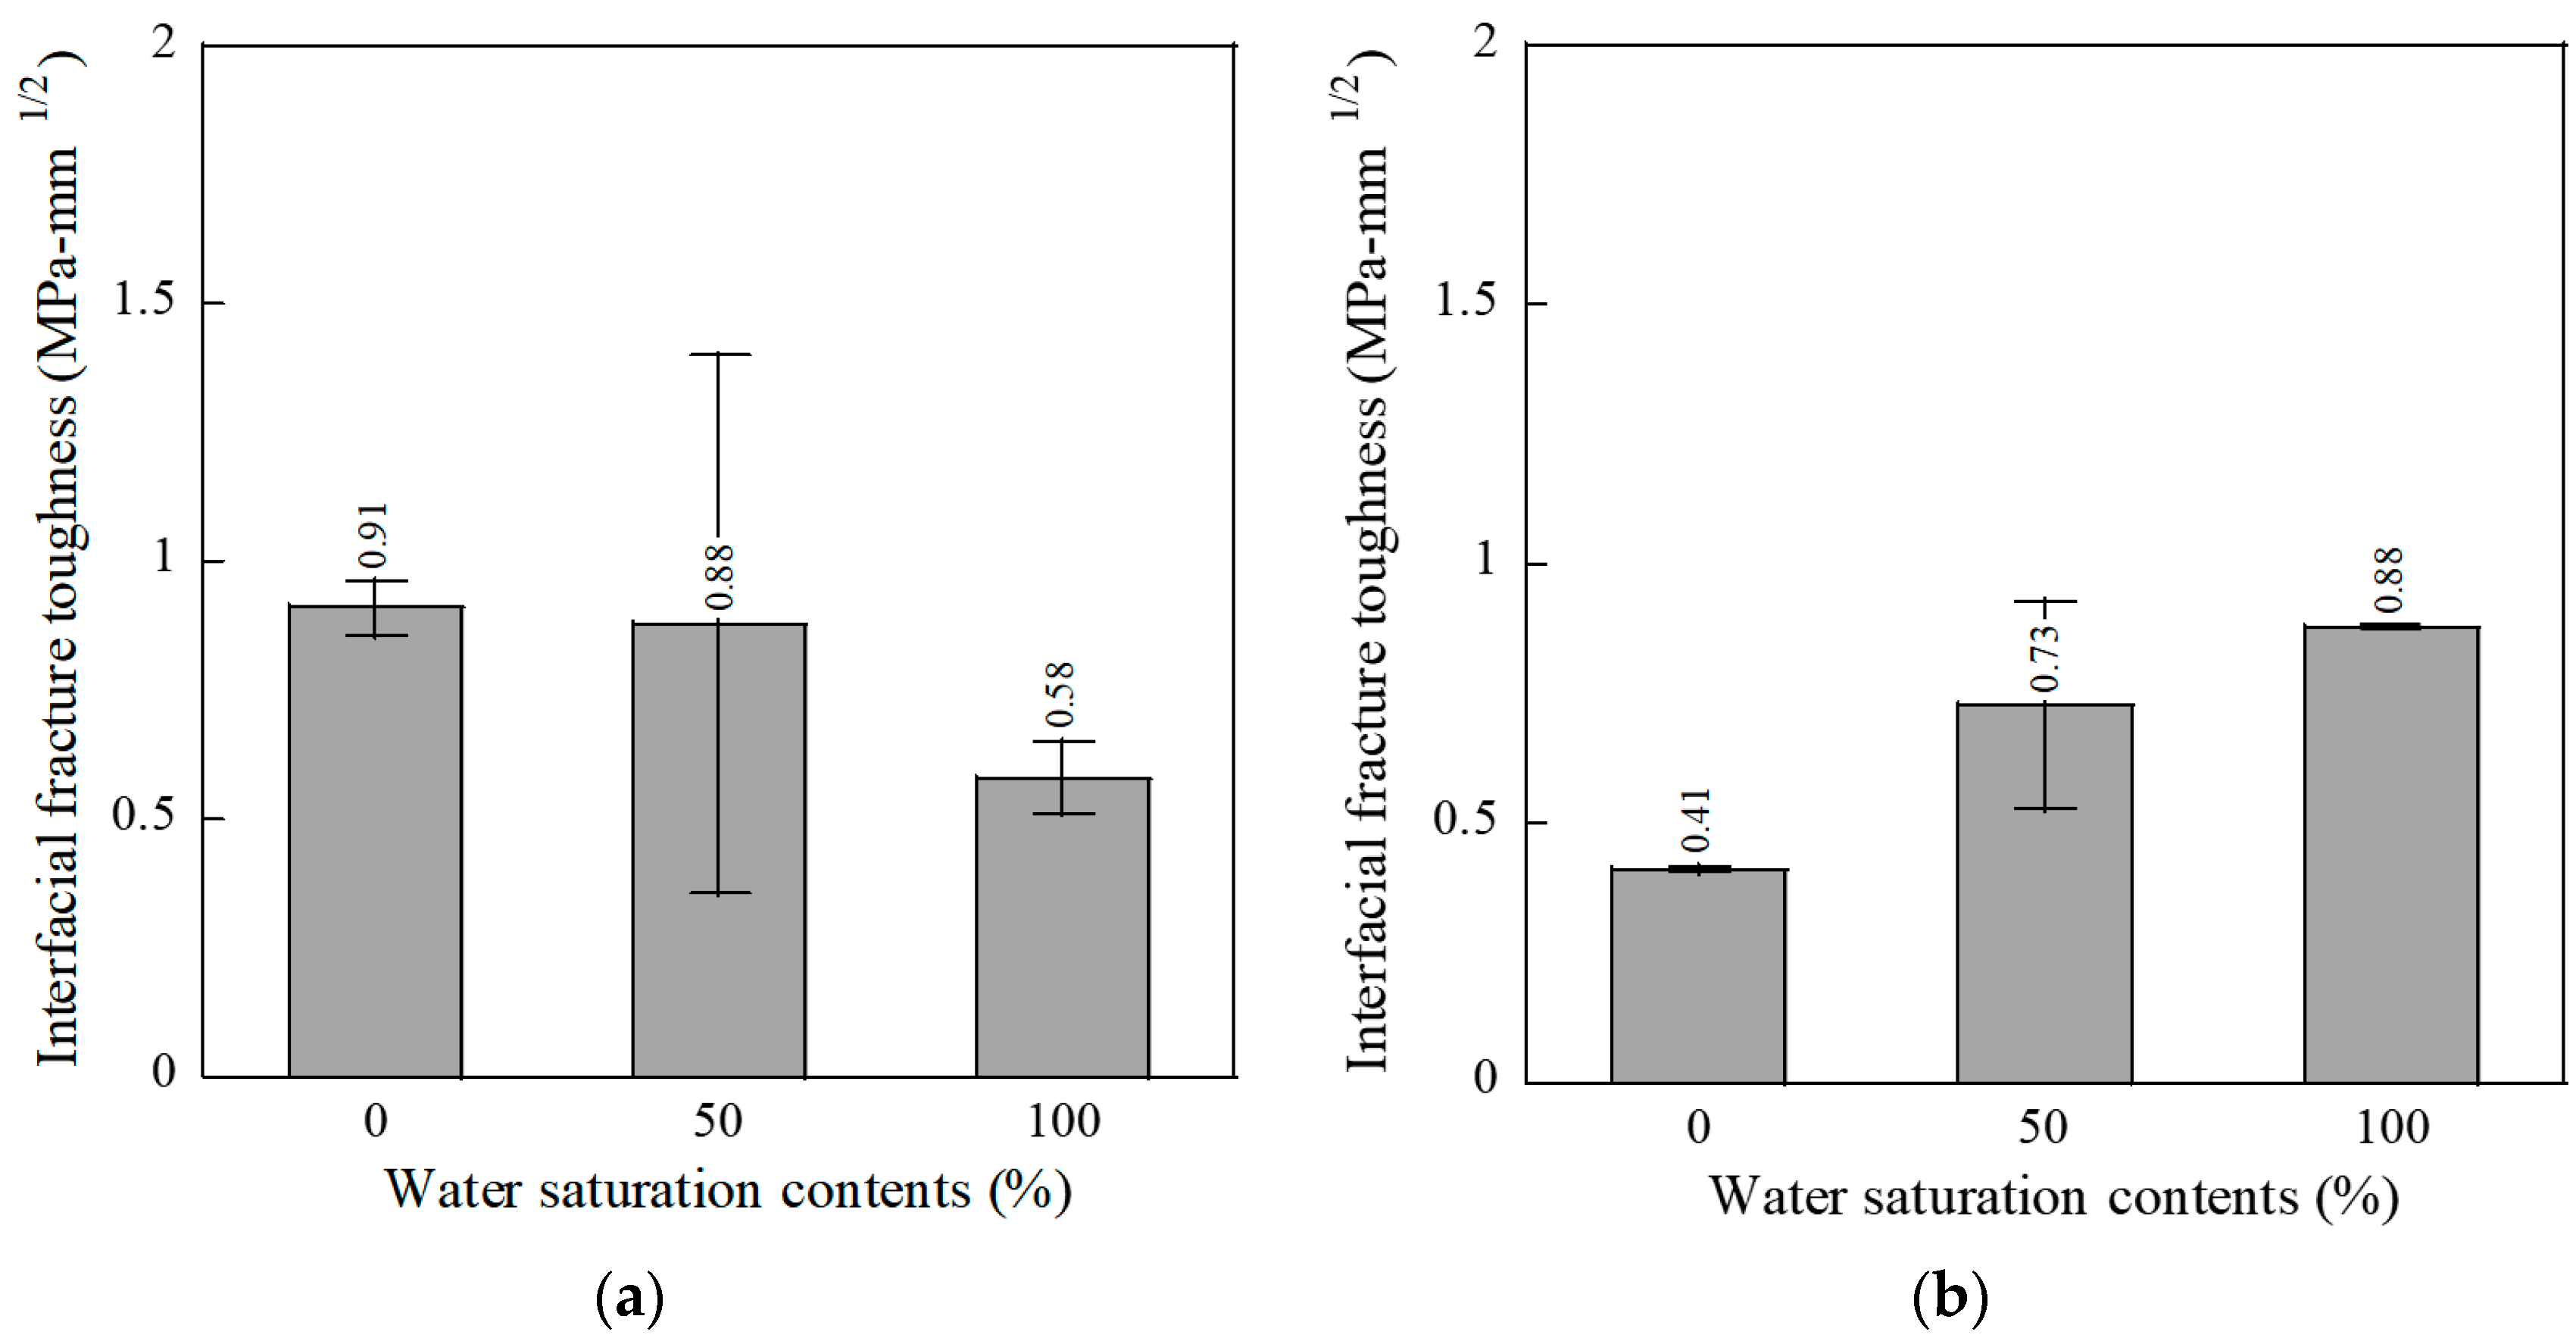
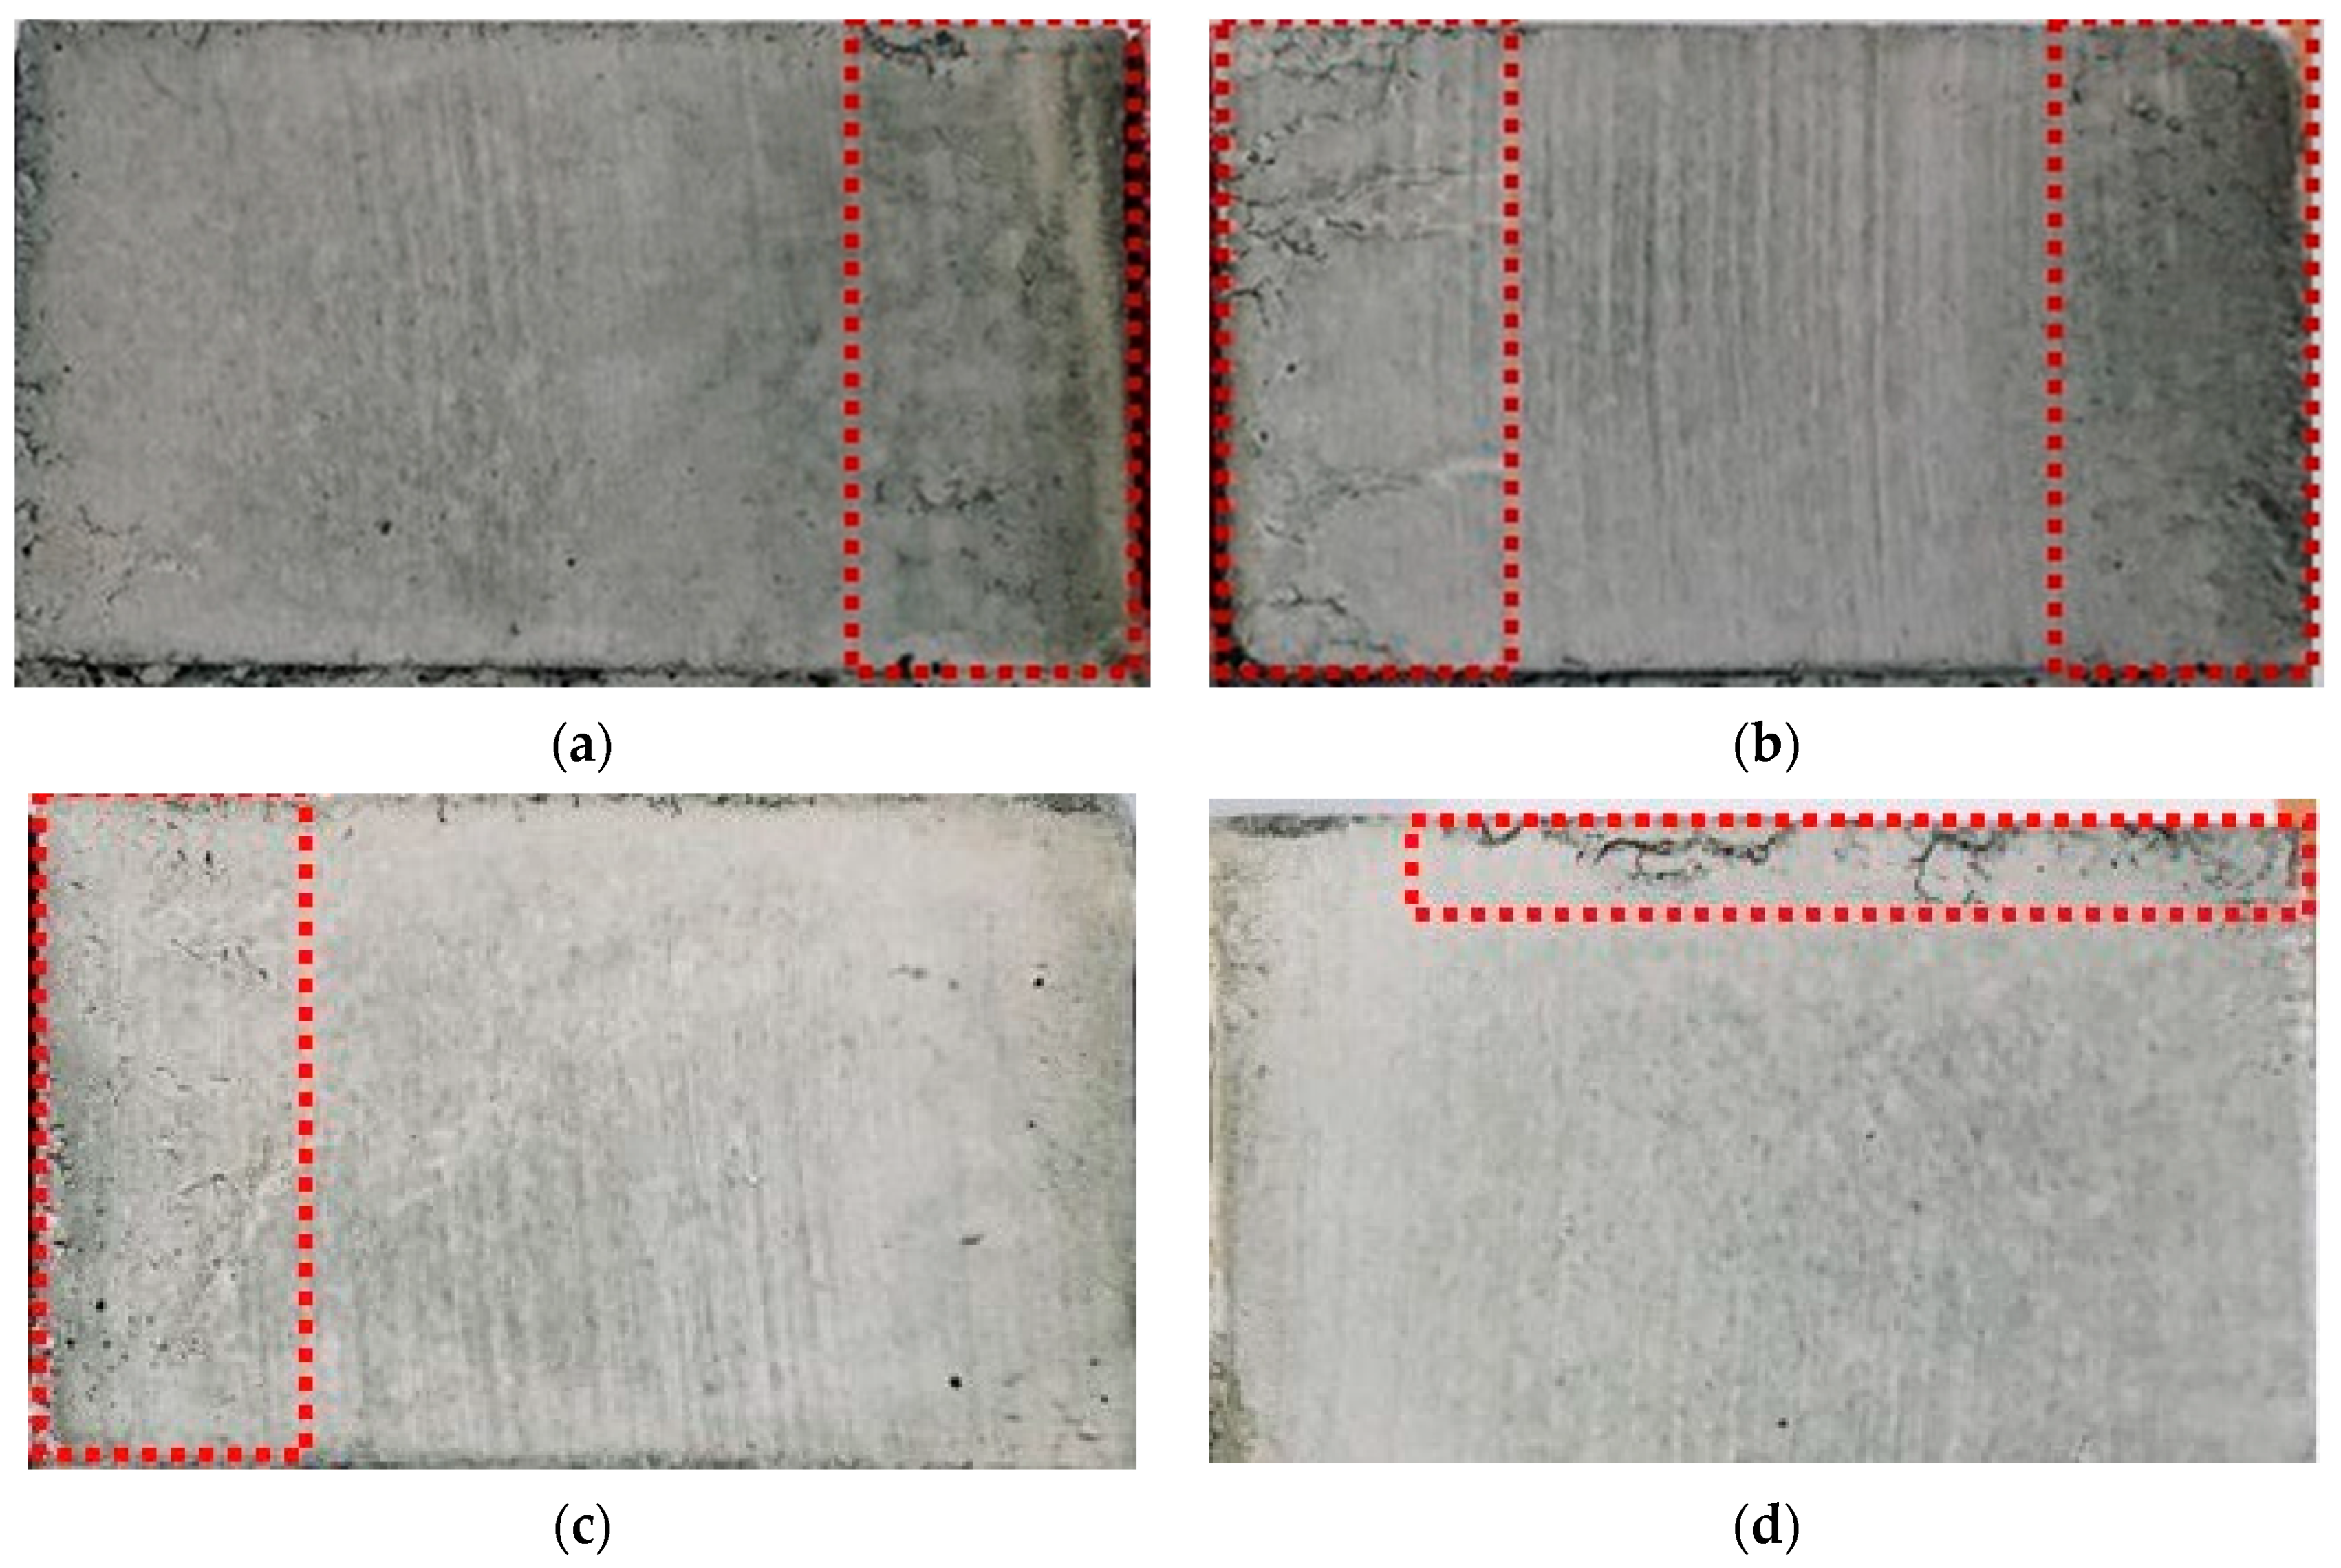
4.2. Influence of Aggregate Water Saturation

It is worth noting the different effects of aggregate water saturation on the compressive strength of QTC, which corresponded to the FADP content on the surface of the aggregate. For the specimens without any FADPs, the compressive strength of the QTC decreased from 34.8 to 31.4 MPa (10%) as aggregate water saturation increased from 0 to 100%. However, the compressive strength of the QTC (using the aggregate with 0.15 wt% FADPs) increased from 24.6 to 28.1 MPa (14%) as the aggregate water saturation increased from 0 to 100%.
The influence of water saturation content on the IFT between the aggregate and QM is summarized in Figure 6. The influence of aggregate water saturation on the IFT was similar to the influence on the compressive strength of the QTC. For the samples without any FADPs on the surface of the aggregate, the IFT decreased from 0.91 to 0.58 MPa∙mm1/2 (36%) as aggregate water saturation increased from 0 to 100%. However, the increase of aggregate water saturation, from 0 to 100%, resulted in an increase of IFT (using the aggregate with 0.15 wt% FADPs) from 0.41 to 0.88 MPa∙mm1/2 (115%).
Figure 8 shows the fractured interface, after IFT tests, between the aggregate and QM, which corresponds to different water saturations of the aggregate. In the figure, the red boxes indicate the area where pores occurred at the interface. For the specimens without any FADPs on the aggregate surfaces, aggregate water saturation caused an increment of the water/cement ratio of the concrete [5], and consequently, the porosity in the concrete increased [24]. However, for the specimens using the aggregate with 0.15 wt% FADPs, the water/cement ratio at the interface was reduced because of the water absorption by the FADPs on the surface of the aggregates and the cleaning effects of the aggregate surface.
Figure 9 shows photos of the specimens after compressive tests. As shown in Figure 9c, the C-15-0 specimen had a large number of FADPs on the aggregate surface, and thus, porosity occurred at the interface between the coarse aggregate and QM. However, the C-15-100 specimen did not have many FADPs on the aggregate surface, similar to the C-0-100 specimen. All the specimens, except C-15-0, showed similar surface conditions. For the C-15-0 specimen, the interface between aggregate and mortar was clearly separated in comparison with other specimens. Figure 10 illustrates the correlation between the IFT and compressive strength, which indicates that the concrete strength was proportional to the IFT. As the compressive strength of concrete increases, the IFT increases. It is considered that the compressive strength of concrete and IFT are related. However, F(C)-15-100 shows a different tendency. The reason is the moisture and FADPs were removed from interfacial transition zone (ITZ), so that the interfacial bonding was strengthened, but it is considered that the strength of the mortar decreased because the moisture moved to the mortar.
Figure 11 shows the transverse strain contour during IFT tests. The first set of images shows the state of the specimen under the peak load and the second set of images shows the interfacial crack propagation, taking 0.3 s after peak loads. The last set of images shows the state of the fracture. In the first set of images (peak load), all specimens were unchanged in transverse strain contour. As shown in the second set of images, DIC analysis indicates that the initial crack quickly propagates with decreasing IFT. For the specimens without any FADPs, the crack propagated faster as the contents of aggregate water saturation increased from 0 to 100% (Figure 11a–c). This phenomenon can be explained by the reduced interfacial adhesion due to the increased W/C ratio in ITZ as the aggregate water saturation increased. However, the crack propagation (using the sliced aggregate with 0.15 wt% FADPs) decreased as the content of aggregate water saturation was increased from 0 to 100% (Figure 11d–f). The reduction in the W/C ratio at the interface resulted from the absorption of water by the FADPs on the surface of the aggregate and the cleaning effects of the aggregate surface. It should be noted that crack propagation of the whole series occurred exactly at the interface between the aggregate and QM because the IFT value is significantly low. If it had a high IFT, the adhesion between the aggregate and mortar would have been strengthened, and the crack would have propagated into the mortar. Lee et al. [4] also reported that the higher IFT specimens show that the cracks propagate through the QM.

5. Conclusions

The compressive strength of QTC and IFT between the aggregates and QM was investigated by changing the amount of FADPs on the surface of the aggregate and the content of aggregate water saturation. The key conclusions can be summarized as:
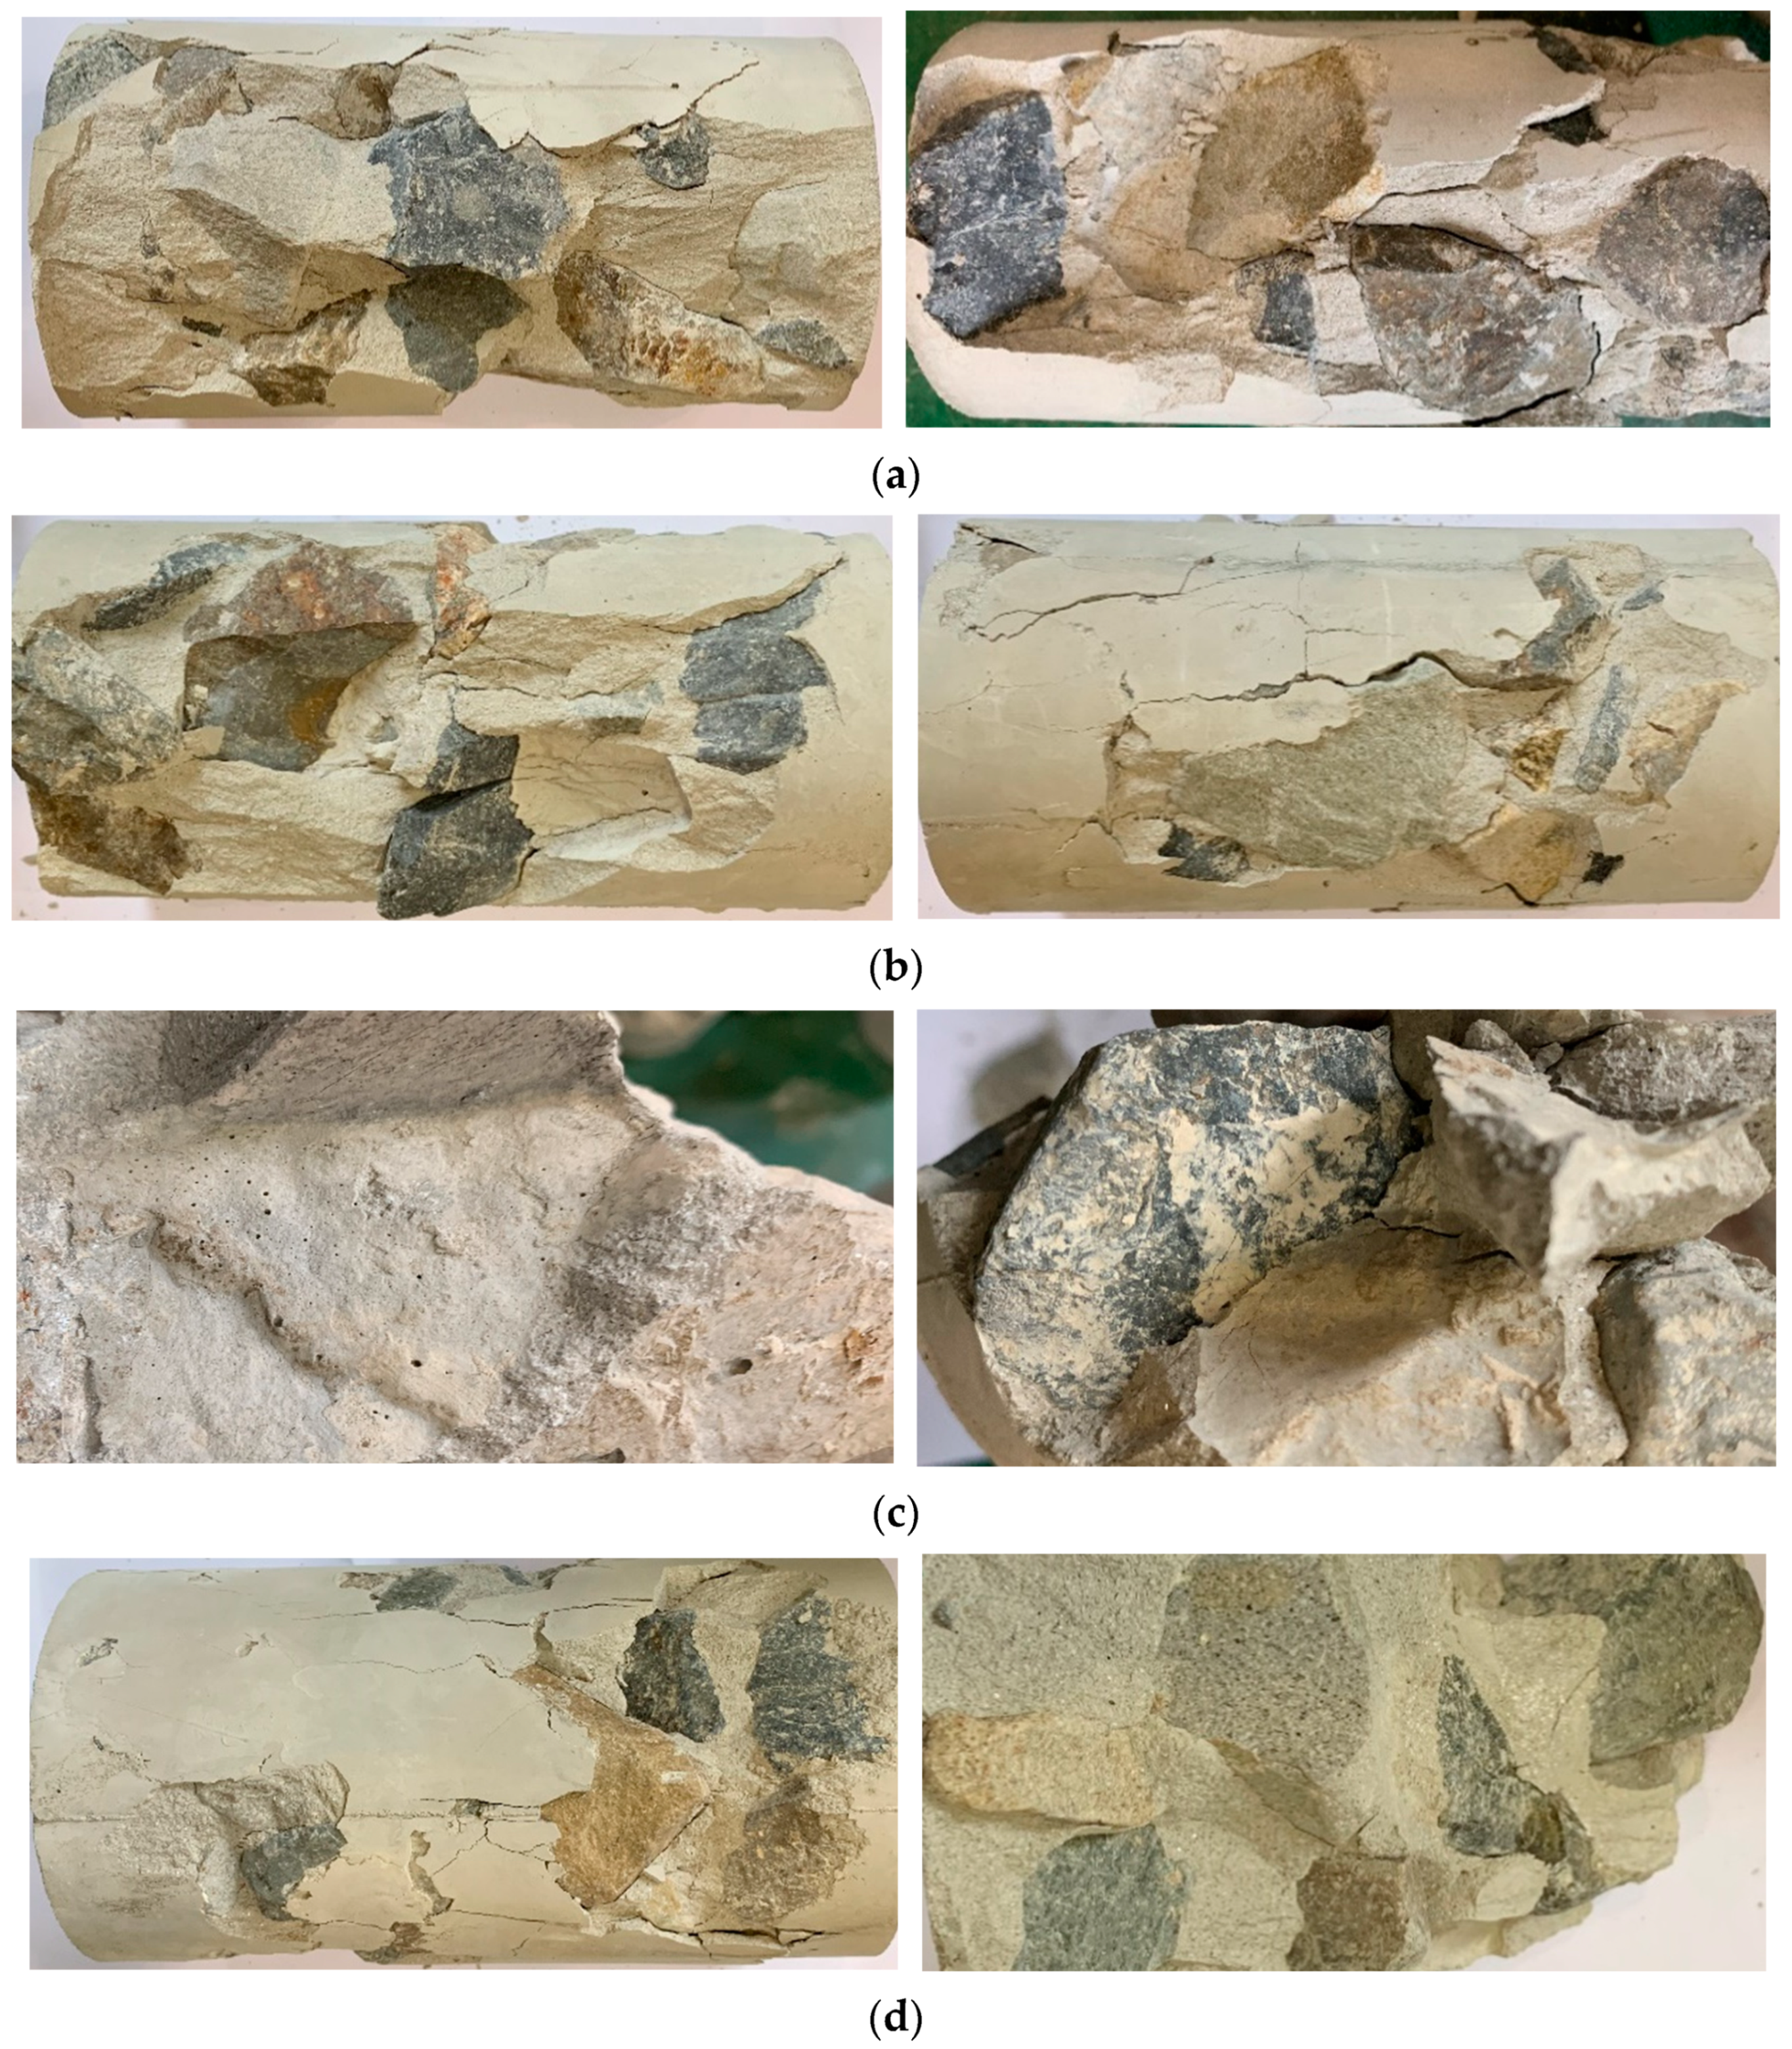
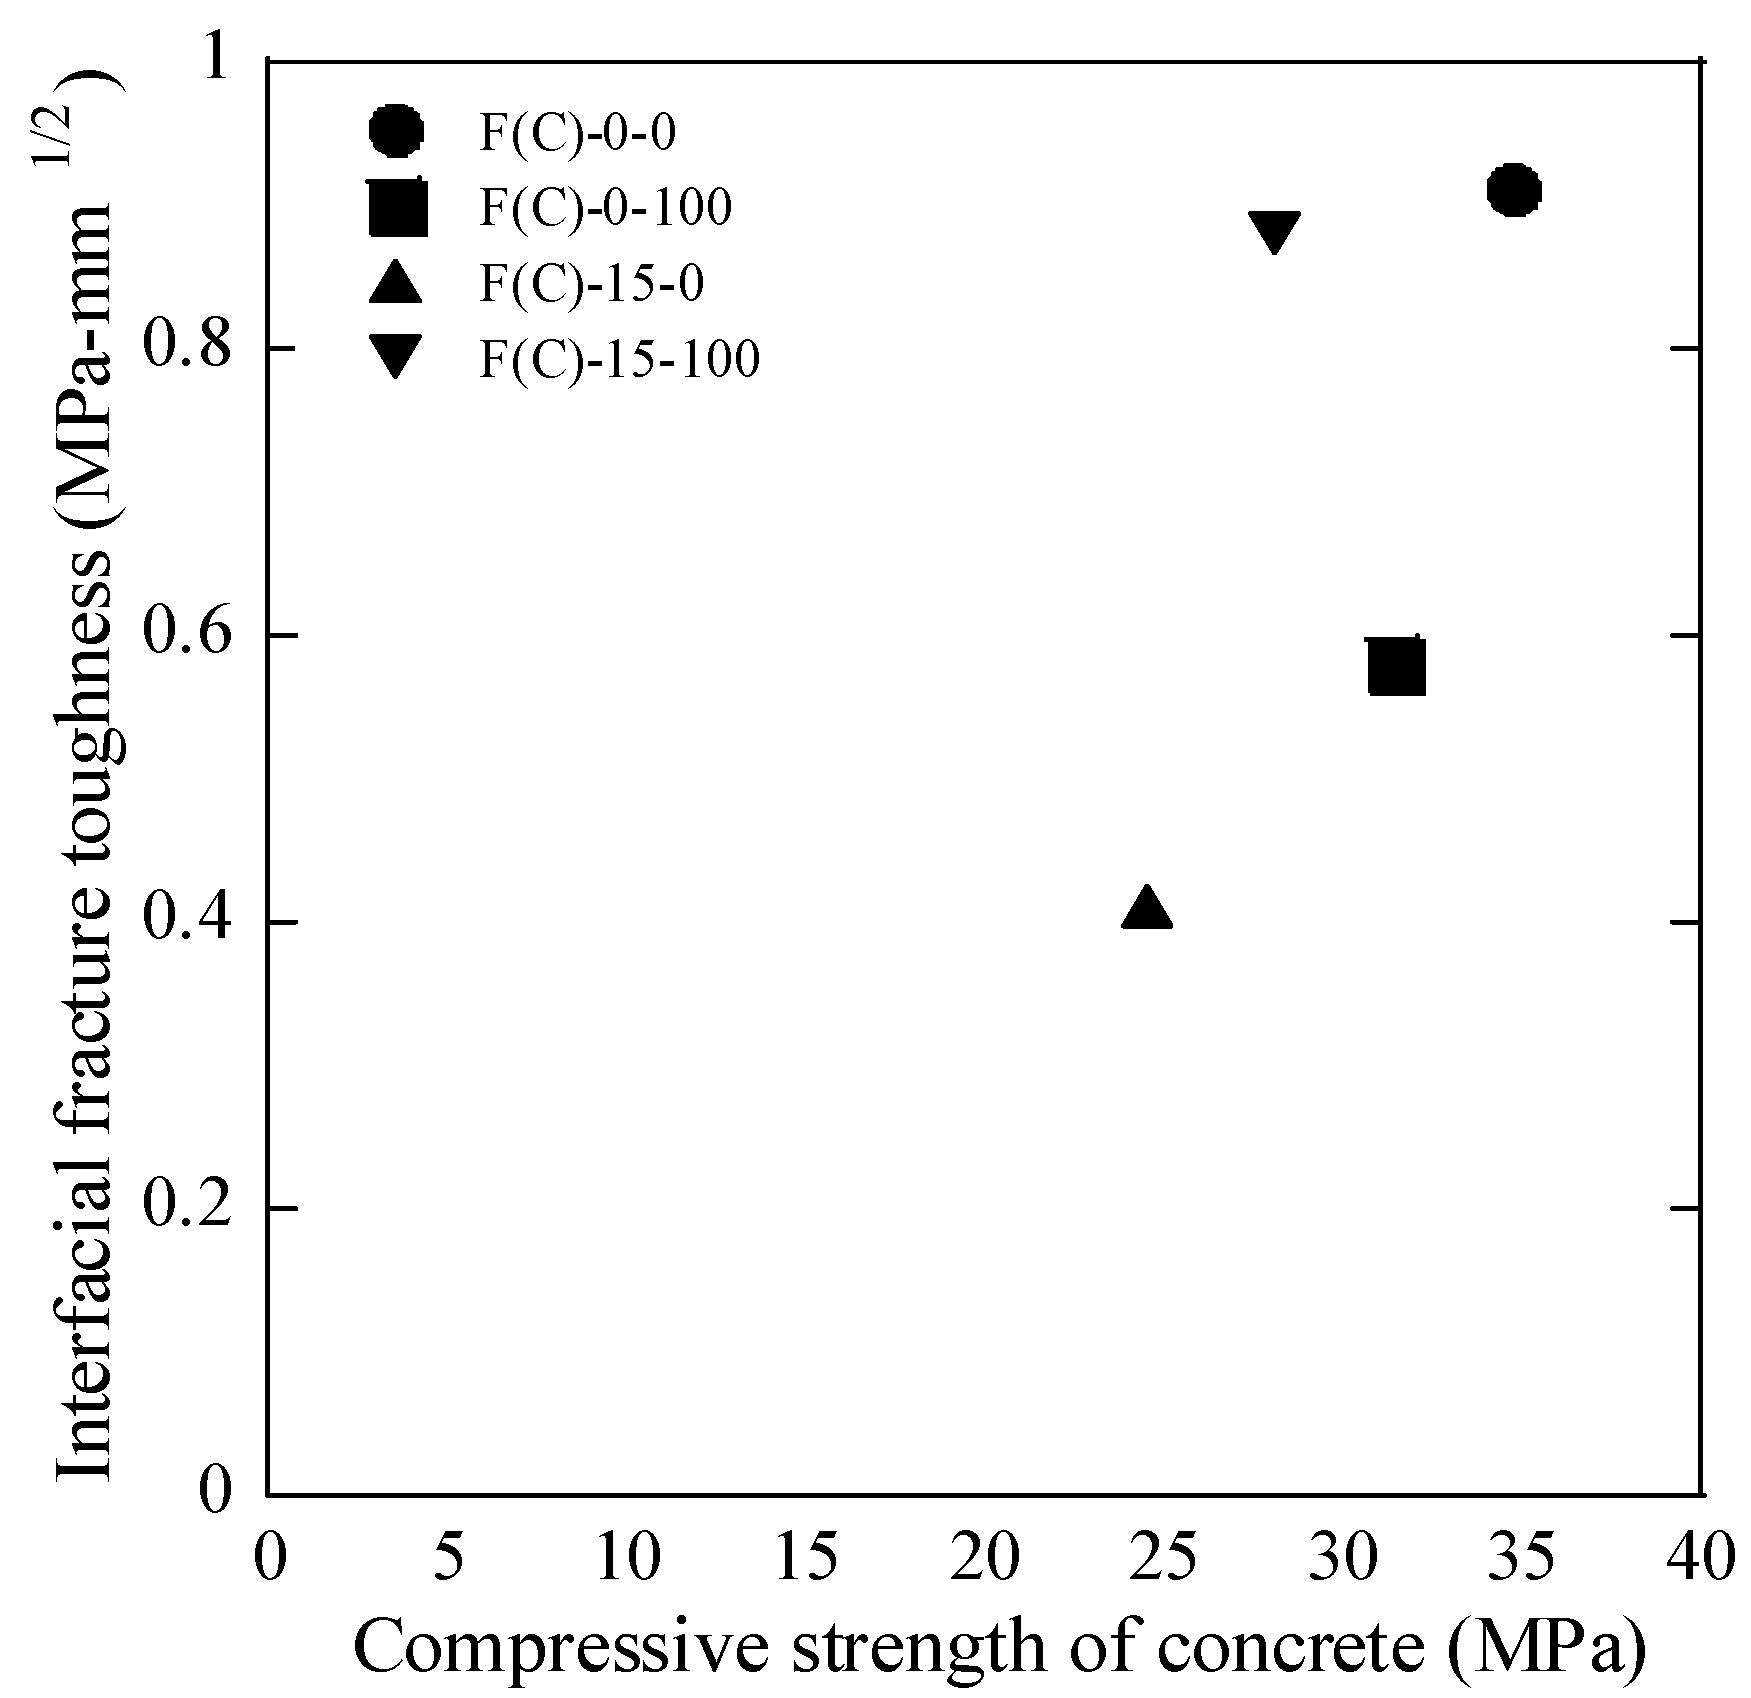
  • FADPs attached on the aggregate surface deteriorated the interfacial bonding between the aggregate and QM. Accordingly, the compressive strength and IFT decreased as FADPs increased.
  • For the specimen without any FADPs on the aggregate surface, the IFT decreased as the content of aggregate water saturation increased. The compressive strength of the QTC was also reduced because the porosity at the interface increased due to aggregate water saturation.
  • However, in the case of 0.15 wt% FADPs on the aggregate surface, both the compressive strength and IFT increased as the content of aggregate water saturation increased. The reduction in the W/C ratio at the interface resulted from the absorption of water by the particles on the surface of the aggregate, and the cleaning effects of the aggregate surface increased the compressive strength as well as IFT.
The results obtained in this study provide fundamental knowledge of the importance of the aggregate surface conditions for the strength development of QTC. Therefore, in order to efficiently apply the quick-converting method, further research is required to improve interfacial bond strength according to aggregate surface conditions. Therefore, research with additional variables is essential. The effects of precipitation on the strength of QTC during the curing period in the actual track system should be investigated in addition to the effects of aggregate water saturation.

Author Contributions

Experiments, Formal analysis, Visualization, Writing original draft, R.H.; I.-W.L.: Supervision, Writing-review and editing, I.-W.L.; Supervision, Formal analysis, Writing-review and editing, S.P.; Supervision, Formal analysis, Writing-review and editing, D.J.K. All authors have read and agreed to the published version of the manuscript.

Funding

The research described herein was sponsored by a grant from the R&D Program of the Korea Railroad Research Institute, Korea. This work was also supported by the National Research Foundation of Korea (NRF) grant funded by the Korea government (MSIT) (No. NRF-2019R1F1A1060906). The opinions expressed in this paper are those of the authors and do not necessarily reflect the views of the sponsors.

Conflicts of Interest

The authors declare no conflicts of interest.

References

  1. Lee, I.W.; Pyo, S. Experimental investigation on the application of quick-hardening mortar for converting railway ballasted track to concrete track on operating line. Constr. Build. Mater. 2017, 133, 154–162. [Google Scholar] [CrossRef]
  2. Lee, I.; Park, J.; Kim, D.J.; Pyo, S. Effects of abraded fine particle content on strength of quick-hardening concrete. Cem. Concr. Compos. 2019, 96, 225–237. [Google Scholar] [CrossRef]
  3. Lee, I.W.; Pyo, S.; Jung, Y.H. Development of quick-hardening infilling materials for composite railroad tracks to strengthen existing ballasted track. Compos. Part B Eng. 2016, 92, 37–45. [Google Scholar] [CrossRef]
  4. Lee, I.W.; Hwang, R.; Kim, D.J.; Pyo, S. Interfacial fracture toughness between aggregates and injected quick-hardening mortar. Cem. Concr. Comp. 2020, 106, 103485. [Google Scholar] [CrossRef]
  5. Kosmatka, S.H.; Kerkhoff, B.; Panarese, W.C. Design and Control of Concrete Mixtures, 14th ed.; Pertland Cement Association: Skosie, IL, USA, 2002. [Google Scholar]
  6. de Oliveira, M.B.; Vazquez, E. The influence of retained moisture in aggregates from recycling on the properties of new hardened concrete. Waste Manag. 1996, 16, 113–117. [Google Scholar] [CrossRef]
  7. Poon, C.S.; Shui, Z.H.; Lam, L.; Fok, H.; Kou, S.C. Influence of moisture states of natural and recycled aggregates on the slump and compressive strength of concrete. Cem. Concr. Res. 2004, 34, 31–36. [Google Scholar] [CrossRef]
  8. Lee, D.T.C.; Lee, T.S. The effect of aggregate condition during mixing on the mechanical properties of oil palm sheel (OPS) concrete. In MATEC Web of Conferences; EDP Sciences: Sarawak, Malaysia, 2017; Volume 87. [Google Scholar] [CrossRef] [Green Version]
  9. Ozturan, T.; Cecen, C. Effects of coarse aggregate type on mechanical properties of concretes with different strengths. Cem. Concr. Res. 1997, 27, 165–170. [Google Scholar] [CrossRef]
  10. Wu, K.R.; Chen, B.; Yao, W.; Zhang, D. Effect of coarse aggregate type on mechanical properties of high-performance concrete. Cem. Concr. Res. 2001, 31, 1421–1425. [Google Scholar] [CrossRef]
  11. Beshr, H.; Almusallam, A.A.; Maslehuddin, M. Effect of coarse aggregate quality on the mechanical properties of high strength concrete. Constr. Build. Mater. 2003, 17, 97–103. [Google Scholar] [CrossRef]
  12. Petrounias, P.; Giannakopoulou, P.P.; Rogkala, A.; Stamatis, P.M.; Tsikouras, B.; Papoulis, D.; Hatzipanagiotou, K. The influence of alteration of aggregates on the quality of the concrete: A case study from serpentinites and andesites from central Macedonia (North Greece). Geosciences 2018, 8, 115. [Google Scholar] [CrossRef] [Green Version]
  13. Petrounias, P.; Giannakopoulou, P.P.; Rogkala, A.; Stamatis, P.M.; Lampropoulou, P.; Tsikouras, B.; Hatzipanagiotou, K. The Effect of petrographic characteristics and physico-mechanical properties of aggregates on the quality of concrete. Minerals 2018, 8, 577. [Google Scholar] [CrossRef] [Green Version]
  14. Rao, G.A.; Prasad, B.K.R. Influence of the roughness of aggregate sirface on the interface bond strength. Cem. Concr. Res. 2002, 32, 253–257. [Google Scholar] [CrossRef]
  15. Hong, L.; Gu, X.; Lin, F. Influence of aggregate surface roughness on mechanical properties of interface and concrete. Constr. Build. Mater. 2014, 65, 338–349. [Google Scholar] [CrossRef]
  16. Rocco, C.G.; Elices, M. Effect of aggregate shape on the mechanical properties of a simple concrete. Eng. Fract. Mech. 2009, 76, 286–298. [Google Scholar] [CrossRef]
  17. Kong, D.; Lei, T.; Zheng, J.; Ma, C.; Jiang, J.; Jiang, J. Effect and mechanism of surface-coating pozalanics materials around aggregate on properties and ITZ microstructure of recycled aggregate concrete. Constr. Build. Mater. 2010, 24, 701–708. [Google Scholar] [CrossRef]
  18. Li, J.; Xiao, H.; Zhou, Y. Influence of coating recycled aggregate surface with pozzolanic powder on properties of recycled aggregate concrete. Constr. Build. Mater. 2009, 23, 1287–1291. [Google Scholar] [CrossRef]
  19. Choi, H.; Choi, H.; Lim, M.; Inoue, M.; Kitagaki, R.; Noguchi, T. Evaluation on the mechanical performance of low-quality recycled aggregate through interface enhancement between cement matrix and coarse aggregate by surface modification technology. Int. J. Concr. Struct. Mater. 2016, 10, 87–97. [Google Scholar] [CrossRef] [Green Version]
  20. Petrounias, P.; Giannakopoulou, P.P.; Rogkala, A.; Lampropoulou, P.; Tsikouras, B.; Rigopoulos, I.; Hatzipanagiotou, K. Petrographic and Mechanical Characteristics of Concrete Produced by Different Type of Recycled Materials. Geosciences 2019, 9, 264. [Google Scholar] [CrossRef] [Green Version]
  21. Pyo, S.; Kim, H.K.; Lee, B.Y. Effects of coarser fine aggregate on tensile properties of ultra high performance concrete. Cem. Concr. Compos. 2017, 84, 28–35. [Google Scholar] [CrossRef]
  22. ASTM C 39. Standard Test Method for Compressive Strength of Cylindrical Concrete Specimens; ASTM International: West Conshohoken, PA, USA, 2018. [Google Scholar]
  23. Anderson, T.L. Fracture Mechanics Fundamentals and Applications; Taylor & Francis: Boca Raton, FL, USA, 1991. [Google Scholar]
  24. Sakai, E.; Sugita, J. Composite mechanism of polymer modified cement. Cem. Concr. Res. 1995, 25, 127–135. [Google Scholar] [CrossRef]
Figure 1. Details of the experimental program.
Crystals 10 00543 g001
Figure 2. Geometry of the interfacial fracture toughness (IFT) specimens [4].
Crystals 10 00543 g002
Figure 3. Surface of the aggregates used in this study (a) F-00-0, (b) F-00-50, (c) F-00-100, (d) F-15-0, (e) F-15-50, (f) F-15-100.
Crystals 10 00543 g003
Figure 4. Specimen preparation for the digital image correlation (DIC) analysis [4]. (a) Surface of the fracture toughness test specimen; (b) surface of the fracture toughness test specimen with the applied stone spray.
Crystals 10 00543 g004
Figure 5. Test setup for the IFT test [4].
Crystals 10 00543 g005
Figure 6. Effects of the water saturation contents on the IFT; (a) 0.0 wt% abraded fine particle, (b) 0.15 wt% abraded fine particle
Crystals 10 00543 g006
Figure 7. Failure surface of the interface between the aggregate and the QM after the IFT test (effects of the amount of FADPs); (a) F-00-0, (b) F-15-0.
Crystals 10 00543 g007
Figure 8. Fractured interface between the aggregate and the QM after the IFT test (effects of the aggregate water saturation content); (a) F-0-50, (b) F-0-100, (c) F-15-50, (d) F-15-100.
Crystals 10 00543 g008
Figure 9. Failure surface of concrete specimens after compressive tests; (a) C-0-0, (b) C-0-100, (c) C-15-0, (d) C-15-100.
Crystals 10 00543 g009
Figure 10. Correlation between the compressive strength and the IFT.
Crystals 10 00543 g010
Figure 11. Transverse strain contour of IFT specimens; (a) F-00-0, (b) F-00-50, (c) F-00-100, (d) F-15-0, (e) F-15-50, (f) F-15-100.
Crystals 10 00543 g011aCrystals 10 00543 g011b
Table 1. Composition of quick-hardening mortar matrix.
CementWaterHRWRA §Sand A Sand B Setting Retarder *
1.000.400.0270.330.340.0025
§ HRWRA: high-range water-reducing agent. Maximum grain size of Sand A: 1.20 mm. Maximum grain size of Sand B: 0.42 mm. * The amount of setting retarder depends on the temperature at mixing.
Table 2. Chemical component of materials.
CementSand ASand BFADP
SiO213.4099.099.9372.04
Al2O315.00.031314.42
Fe2O31.900.120.01241.22
CaO51.200.350.00171.82
MgO1.790.350.71
K2O0.434.12
SO312.90
Na2O0.133.69
TiO20.02780.30
FeO1.68
P2O50.12
MnO0.05
Ig Loss3.250.20
Table 3. Compressive strength of mortar.
TypeSpecimensCompressive Strength (MPa)
2 h7 d
MortarSP132.758.3
SP232.358.2
SP332.157.3
Average32.457.9
Table 4. Compressive strength of quick-converting track concrete.
Test SeriesFine Particle Contents (wt%)Water Saturation Contents (%)Compressive Strength (MPa)
C-00-00.00034.8
C-00-10010031.4
C-15-00.15024.6
C-15-10010028.1

