Effect of Bi Substitution on Structural and AC Magnetic Susceptibility Properties of Nd1−xBixMnO3


 ,
,
Abstract
:
1. Introduction
2. Materials and Methods
3. Results
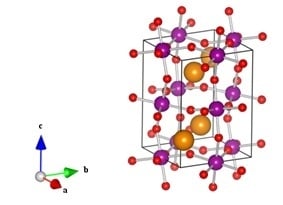
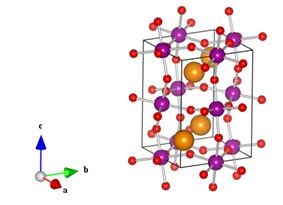
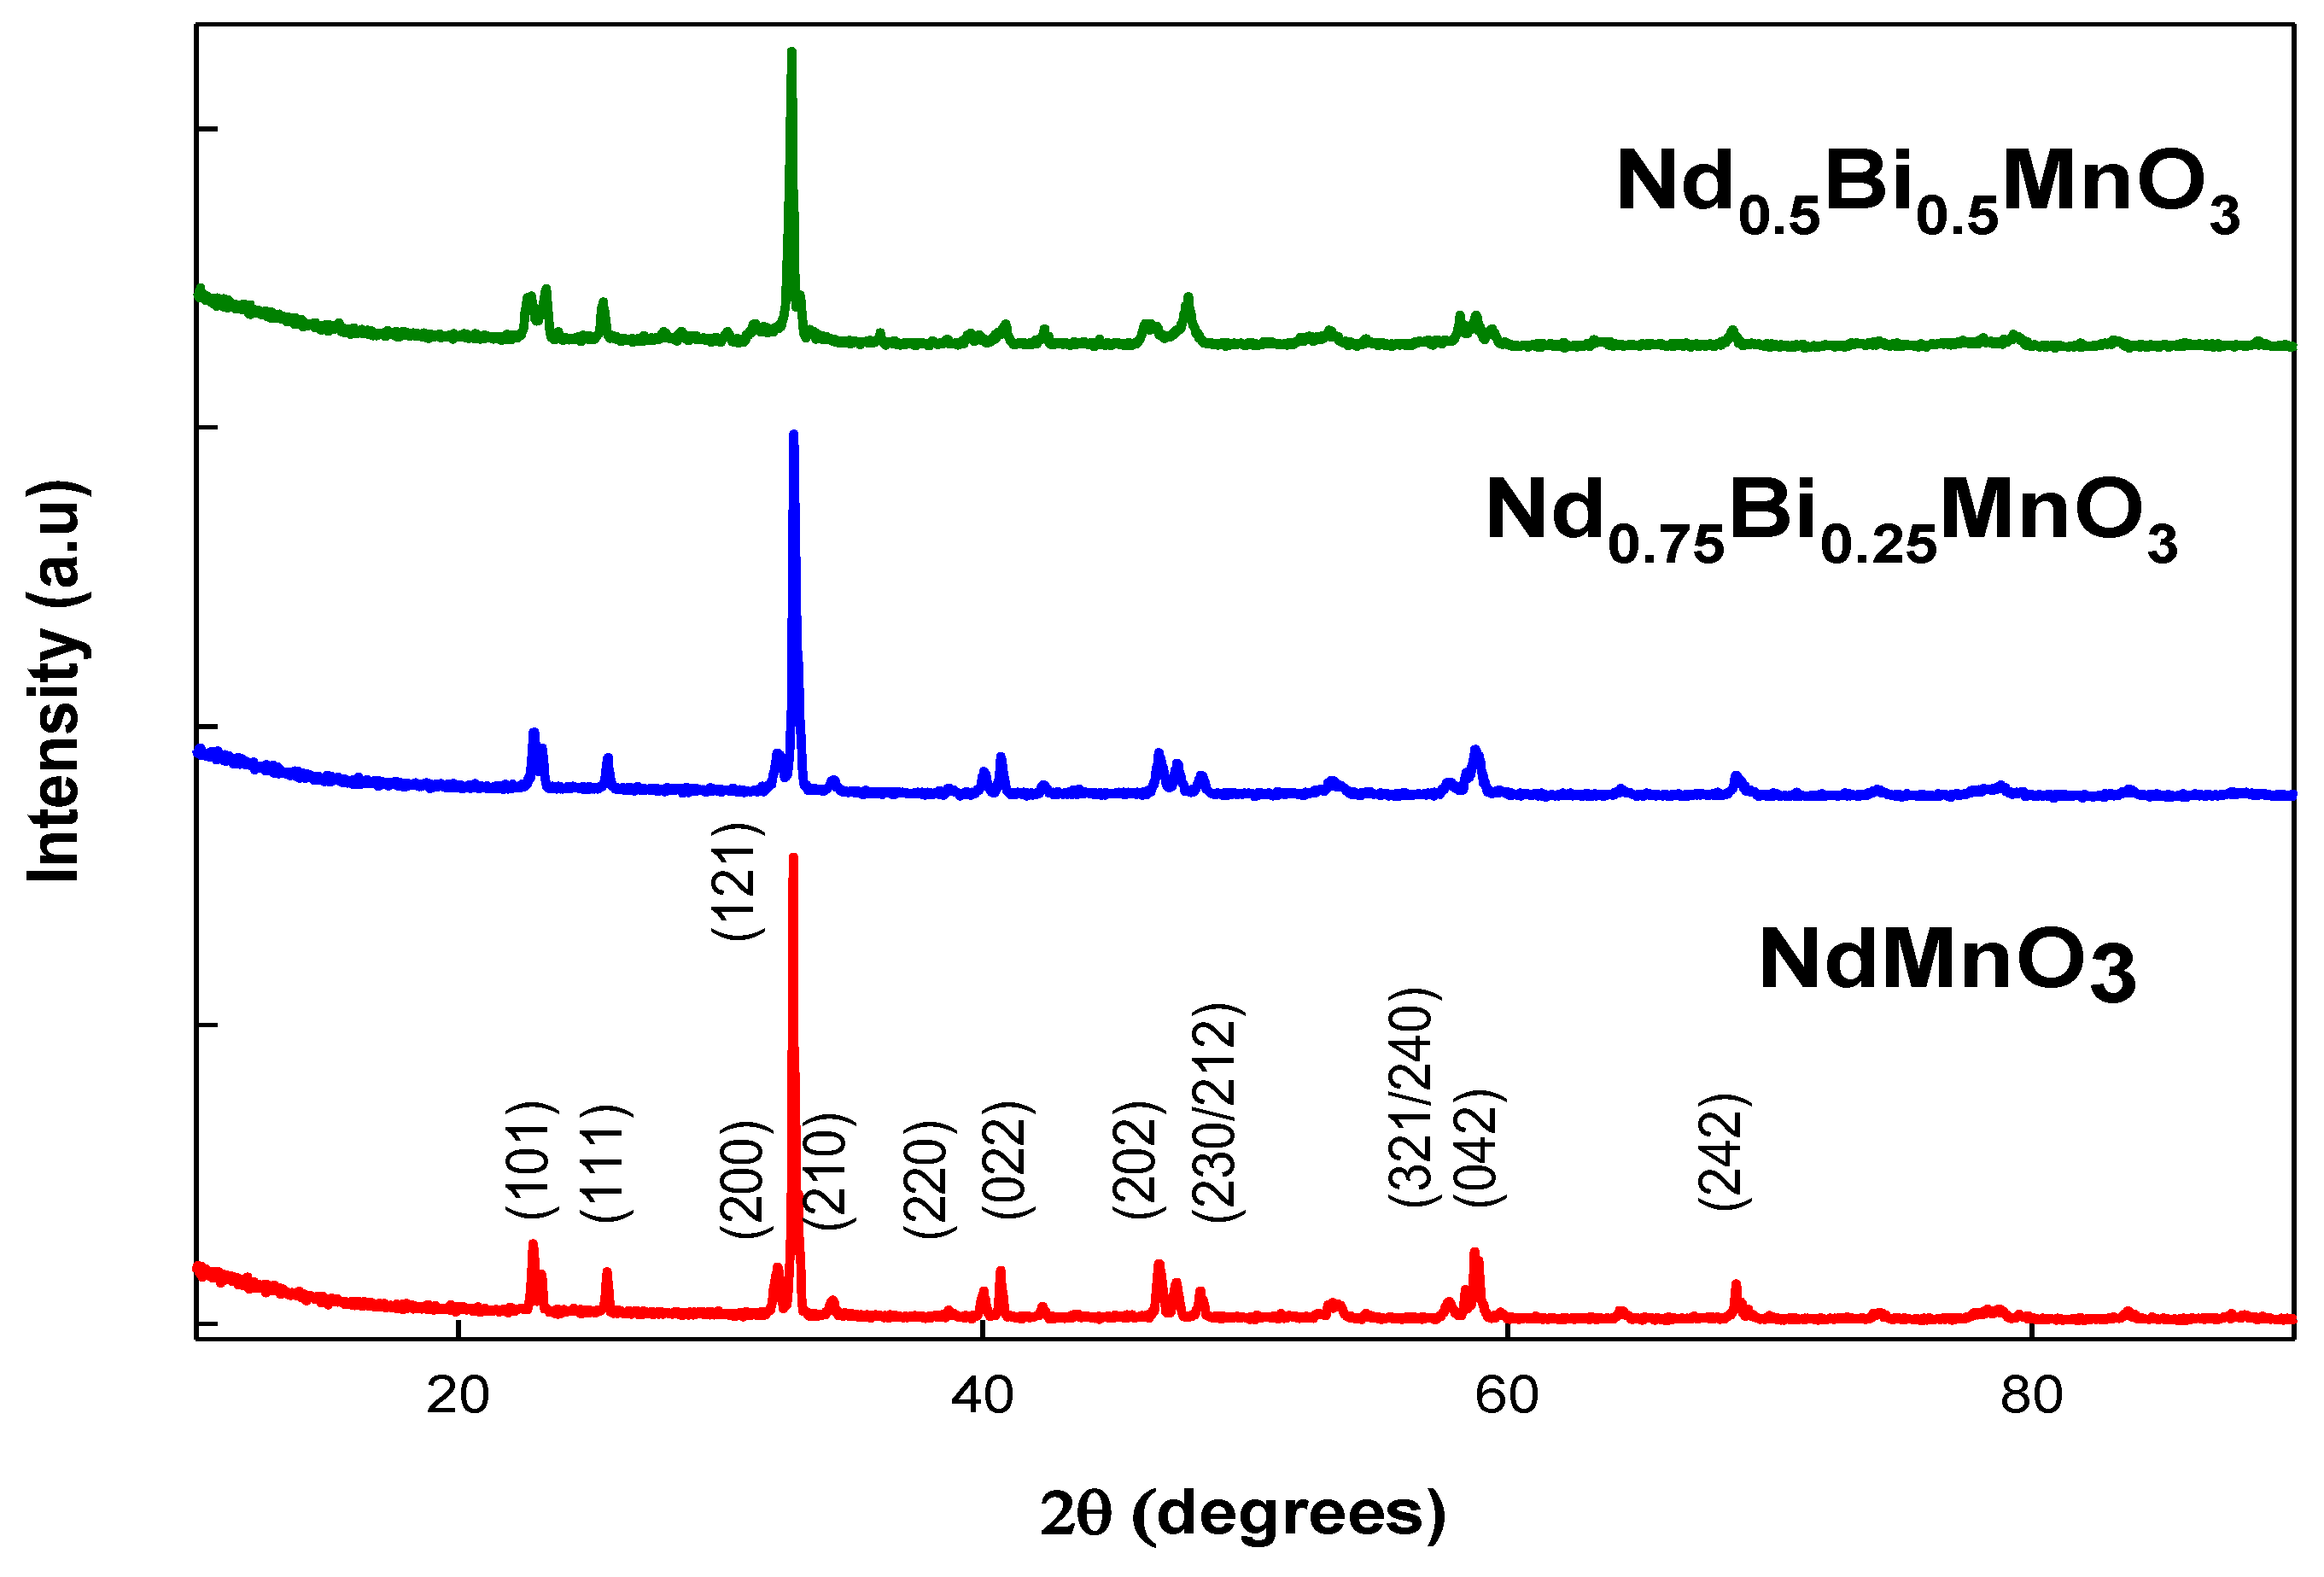
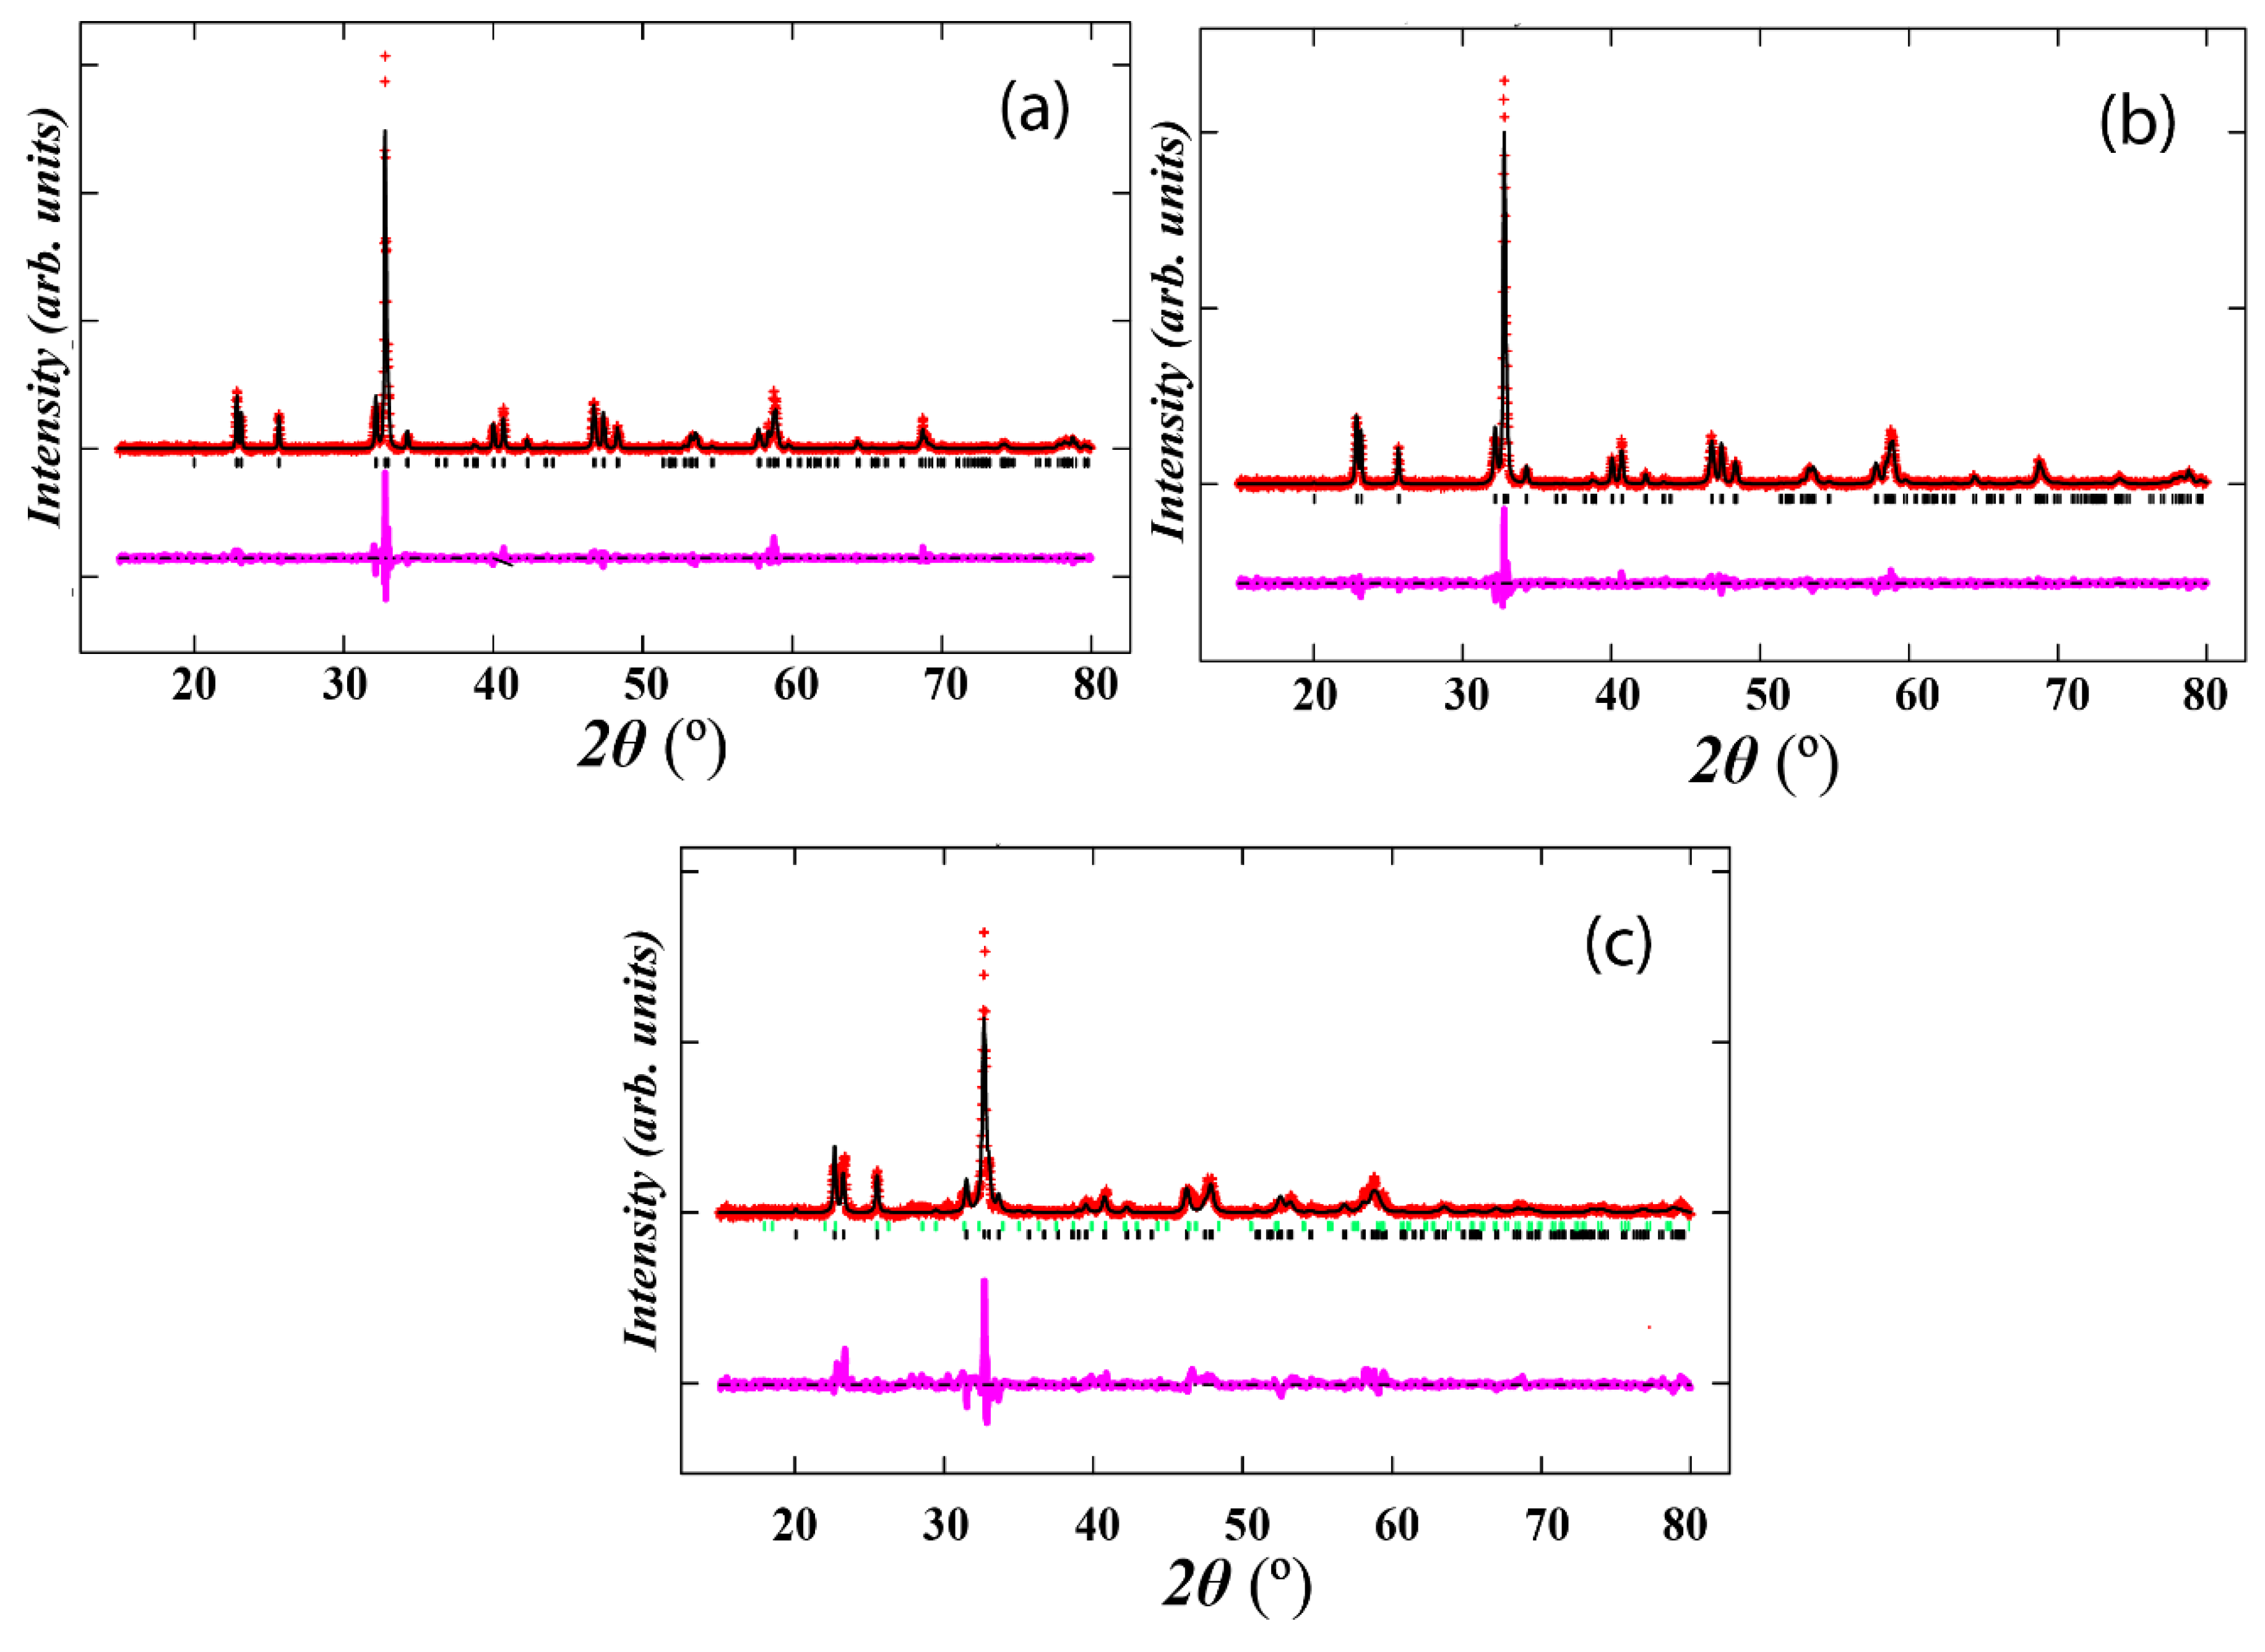
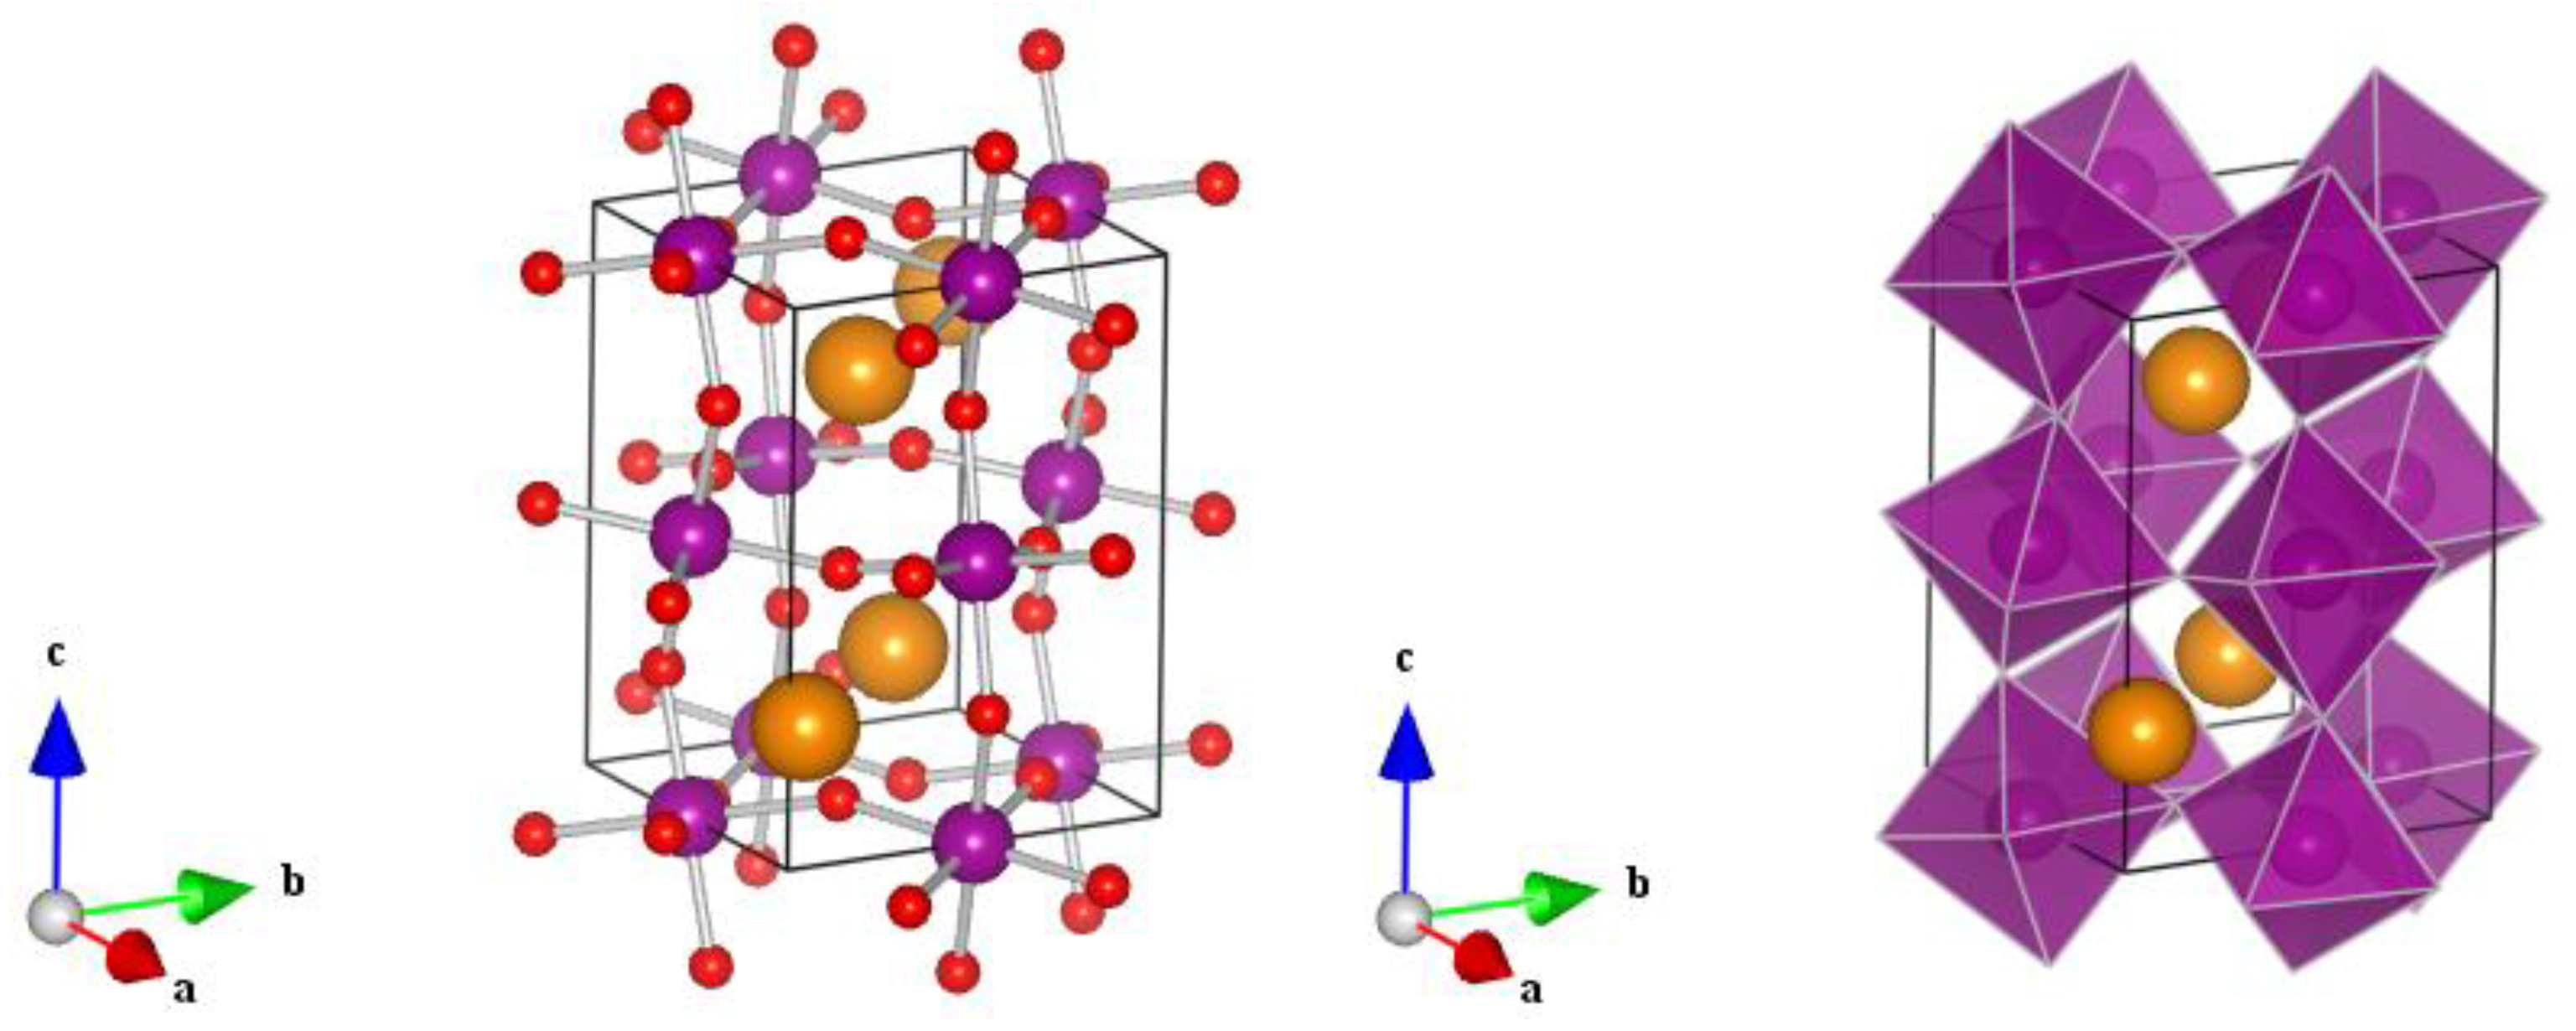
3.1. Structural Analysis
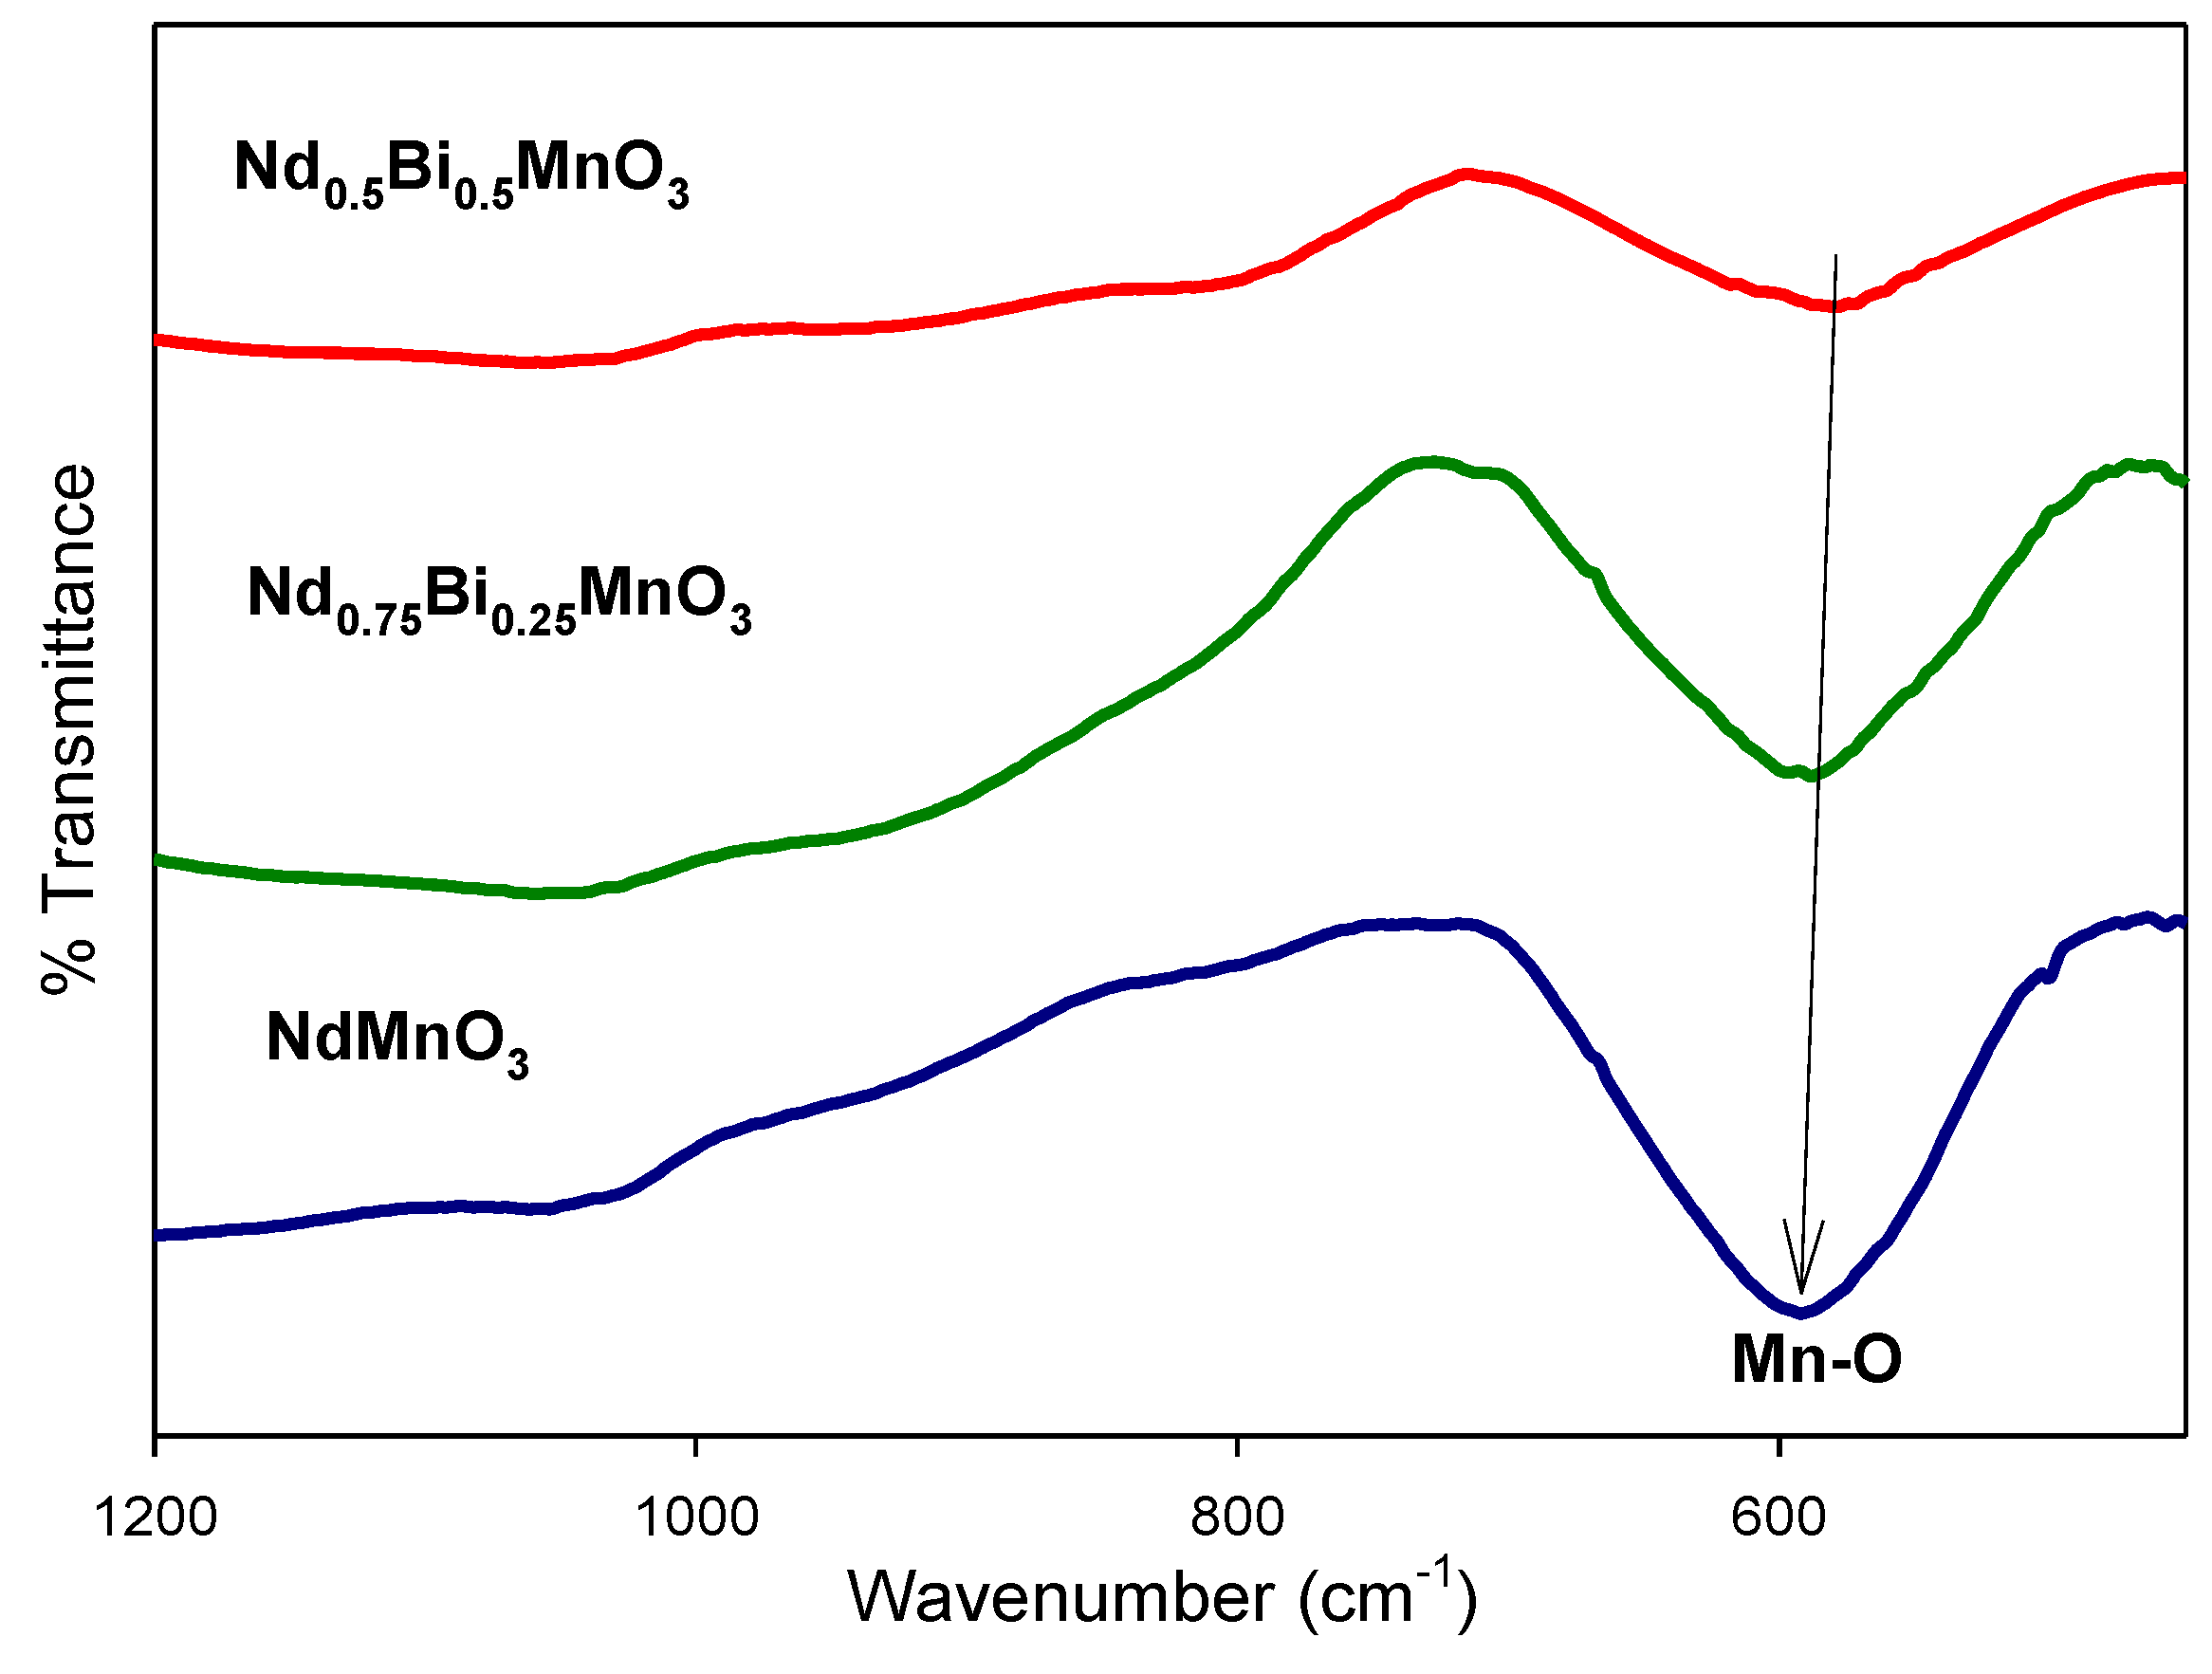
3.2. FTIR Spectra
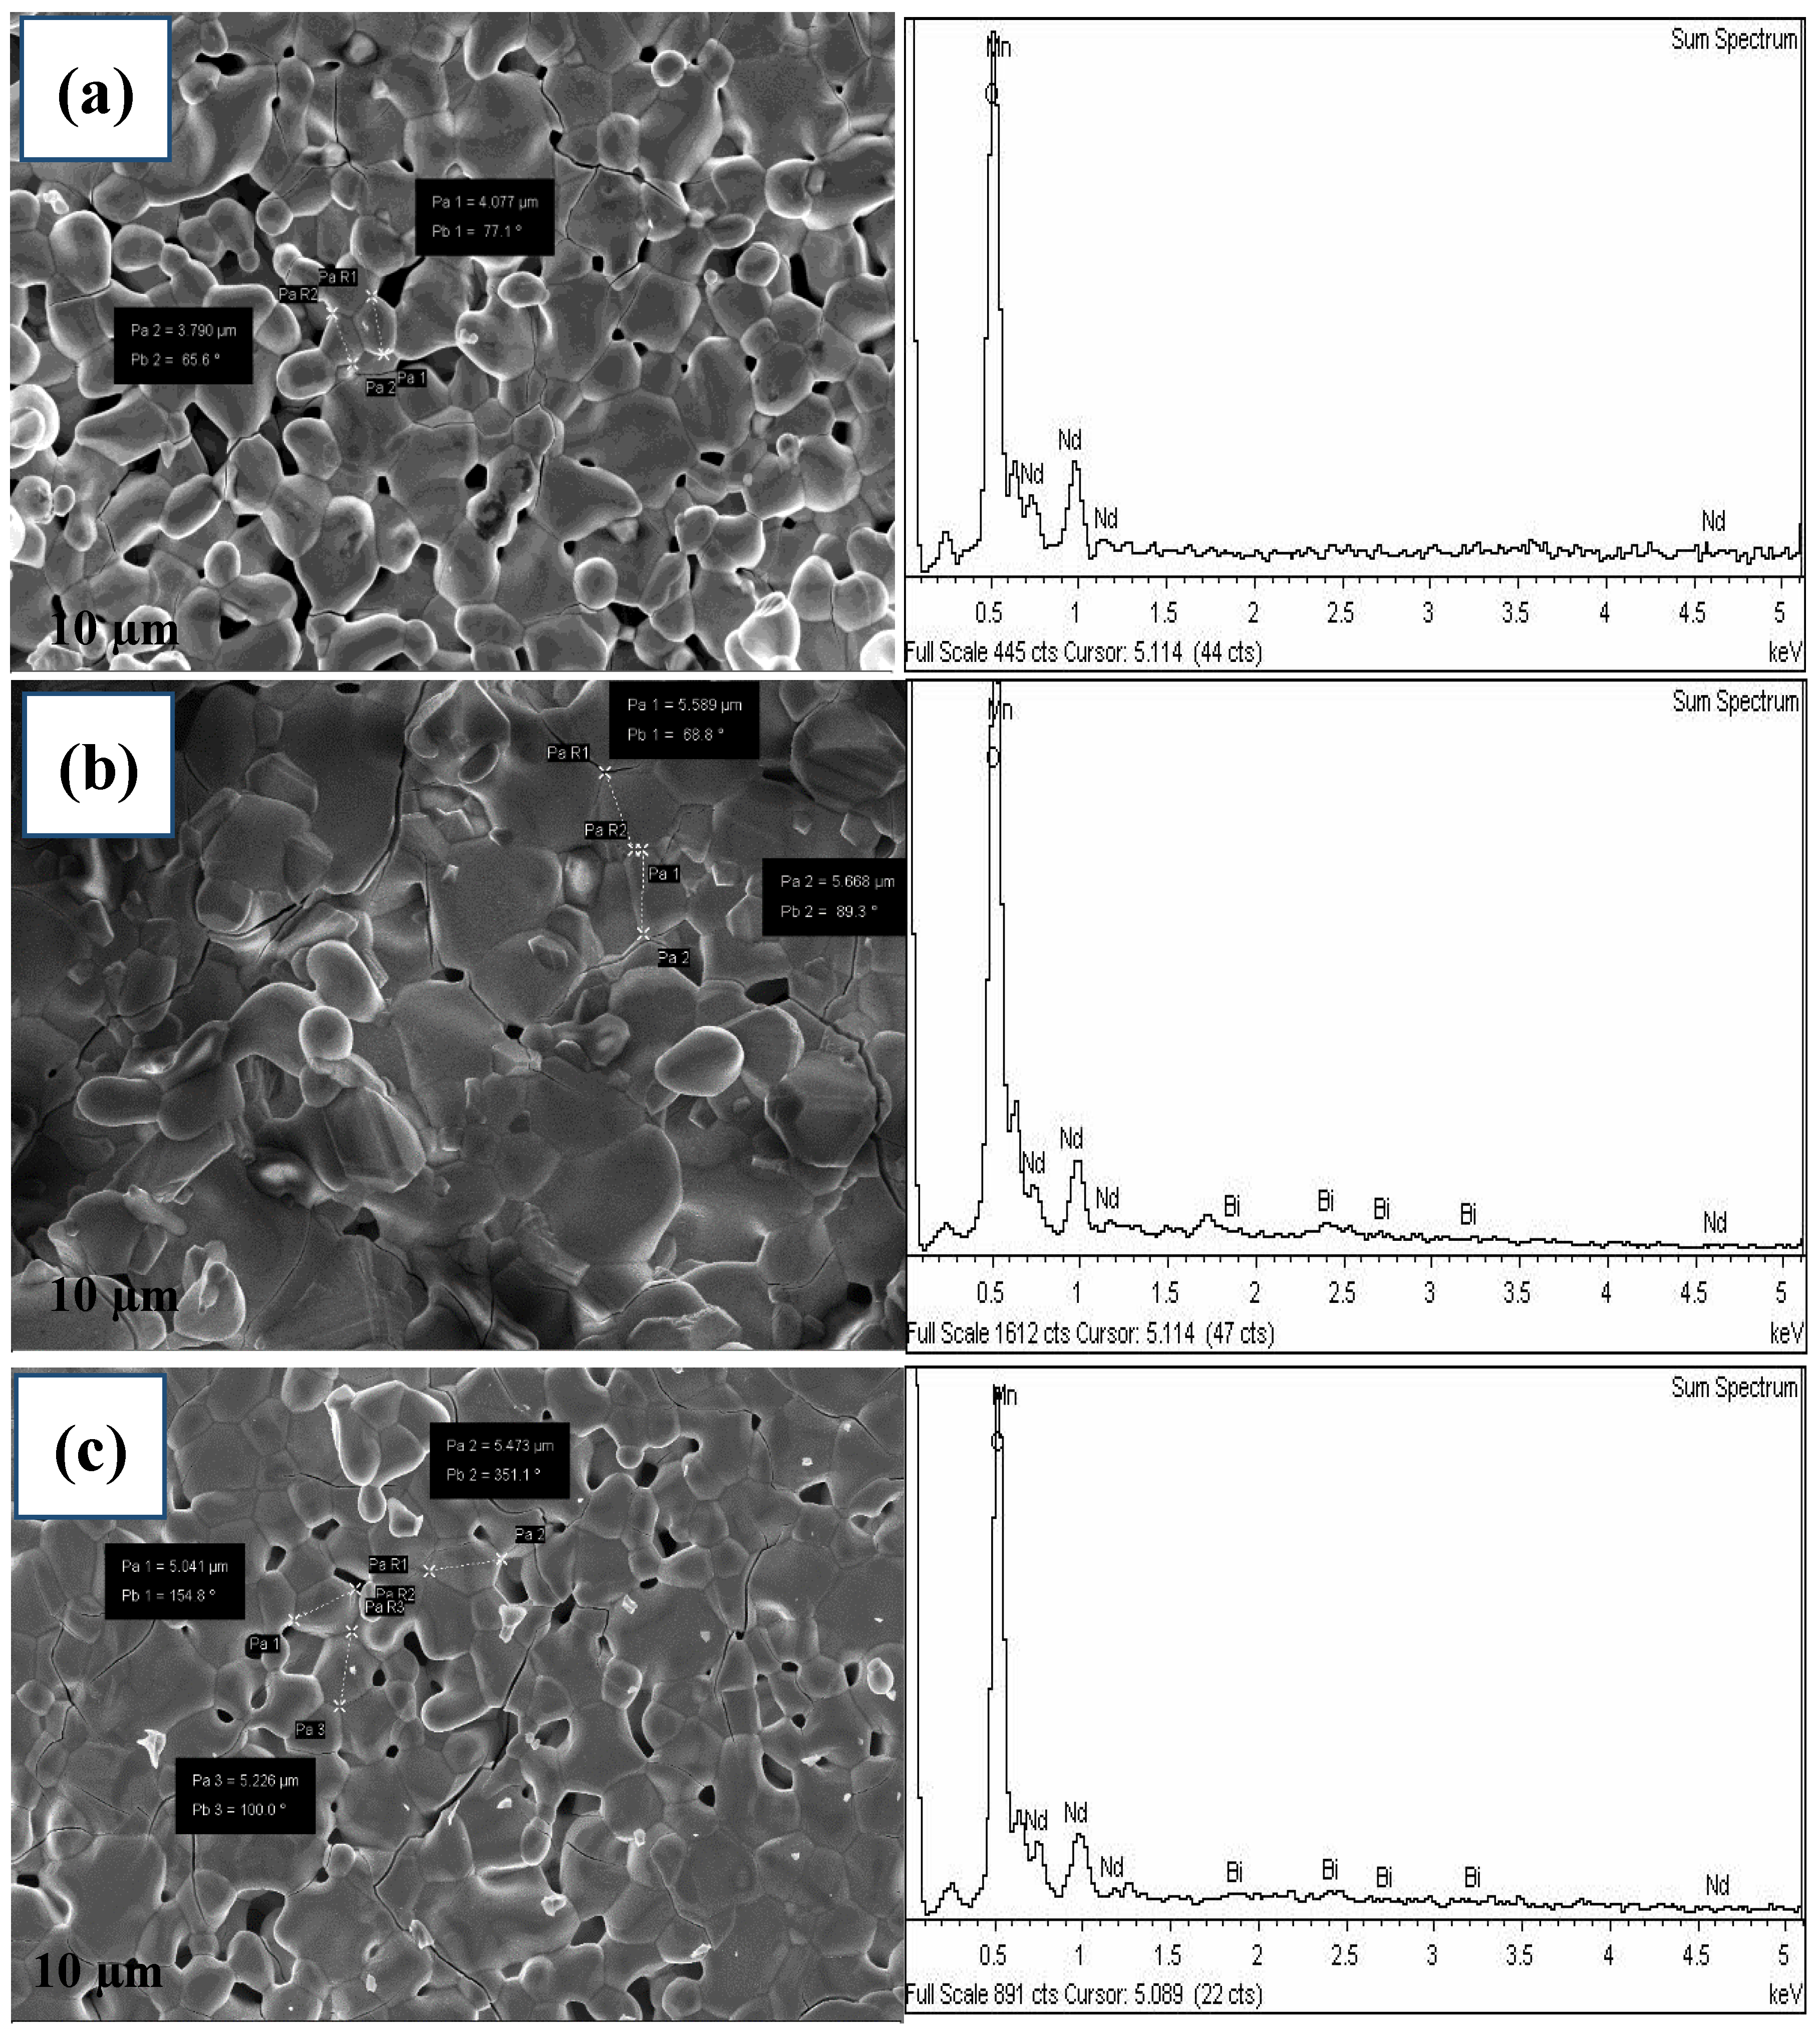
3.3. Morphology
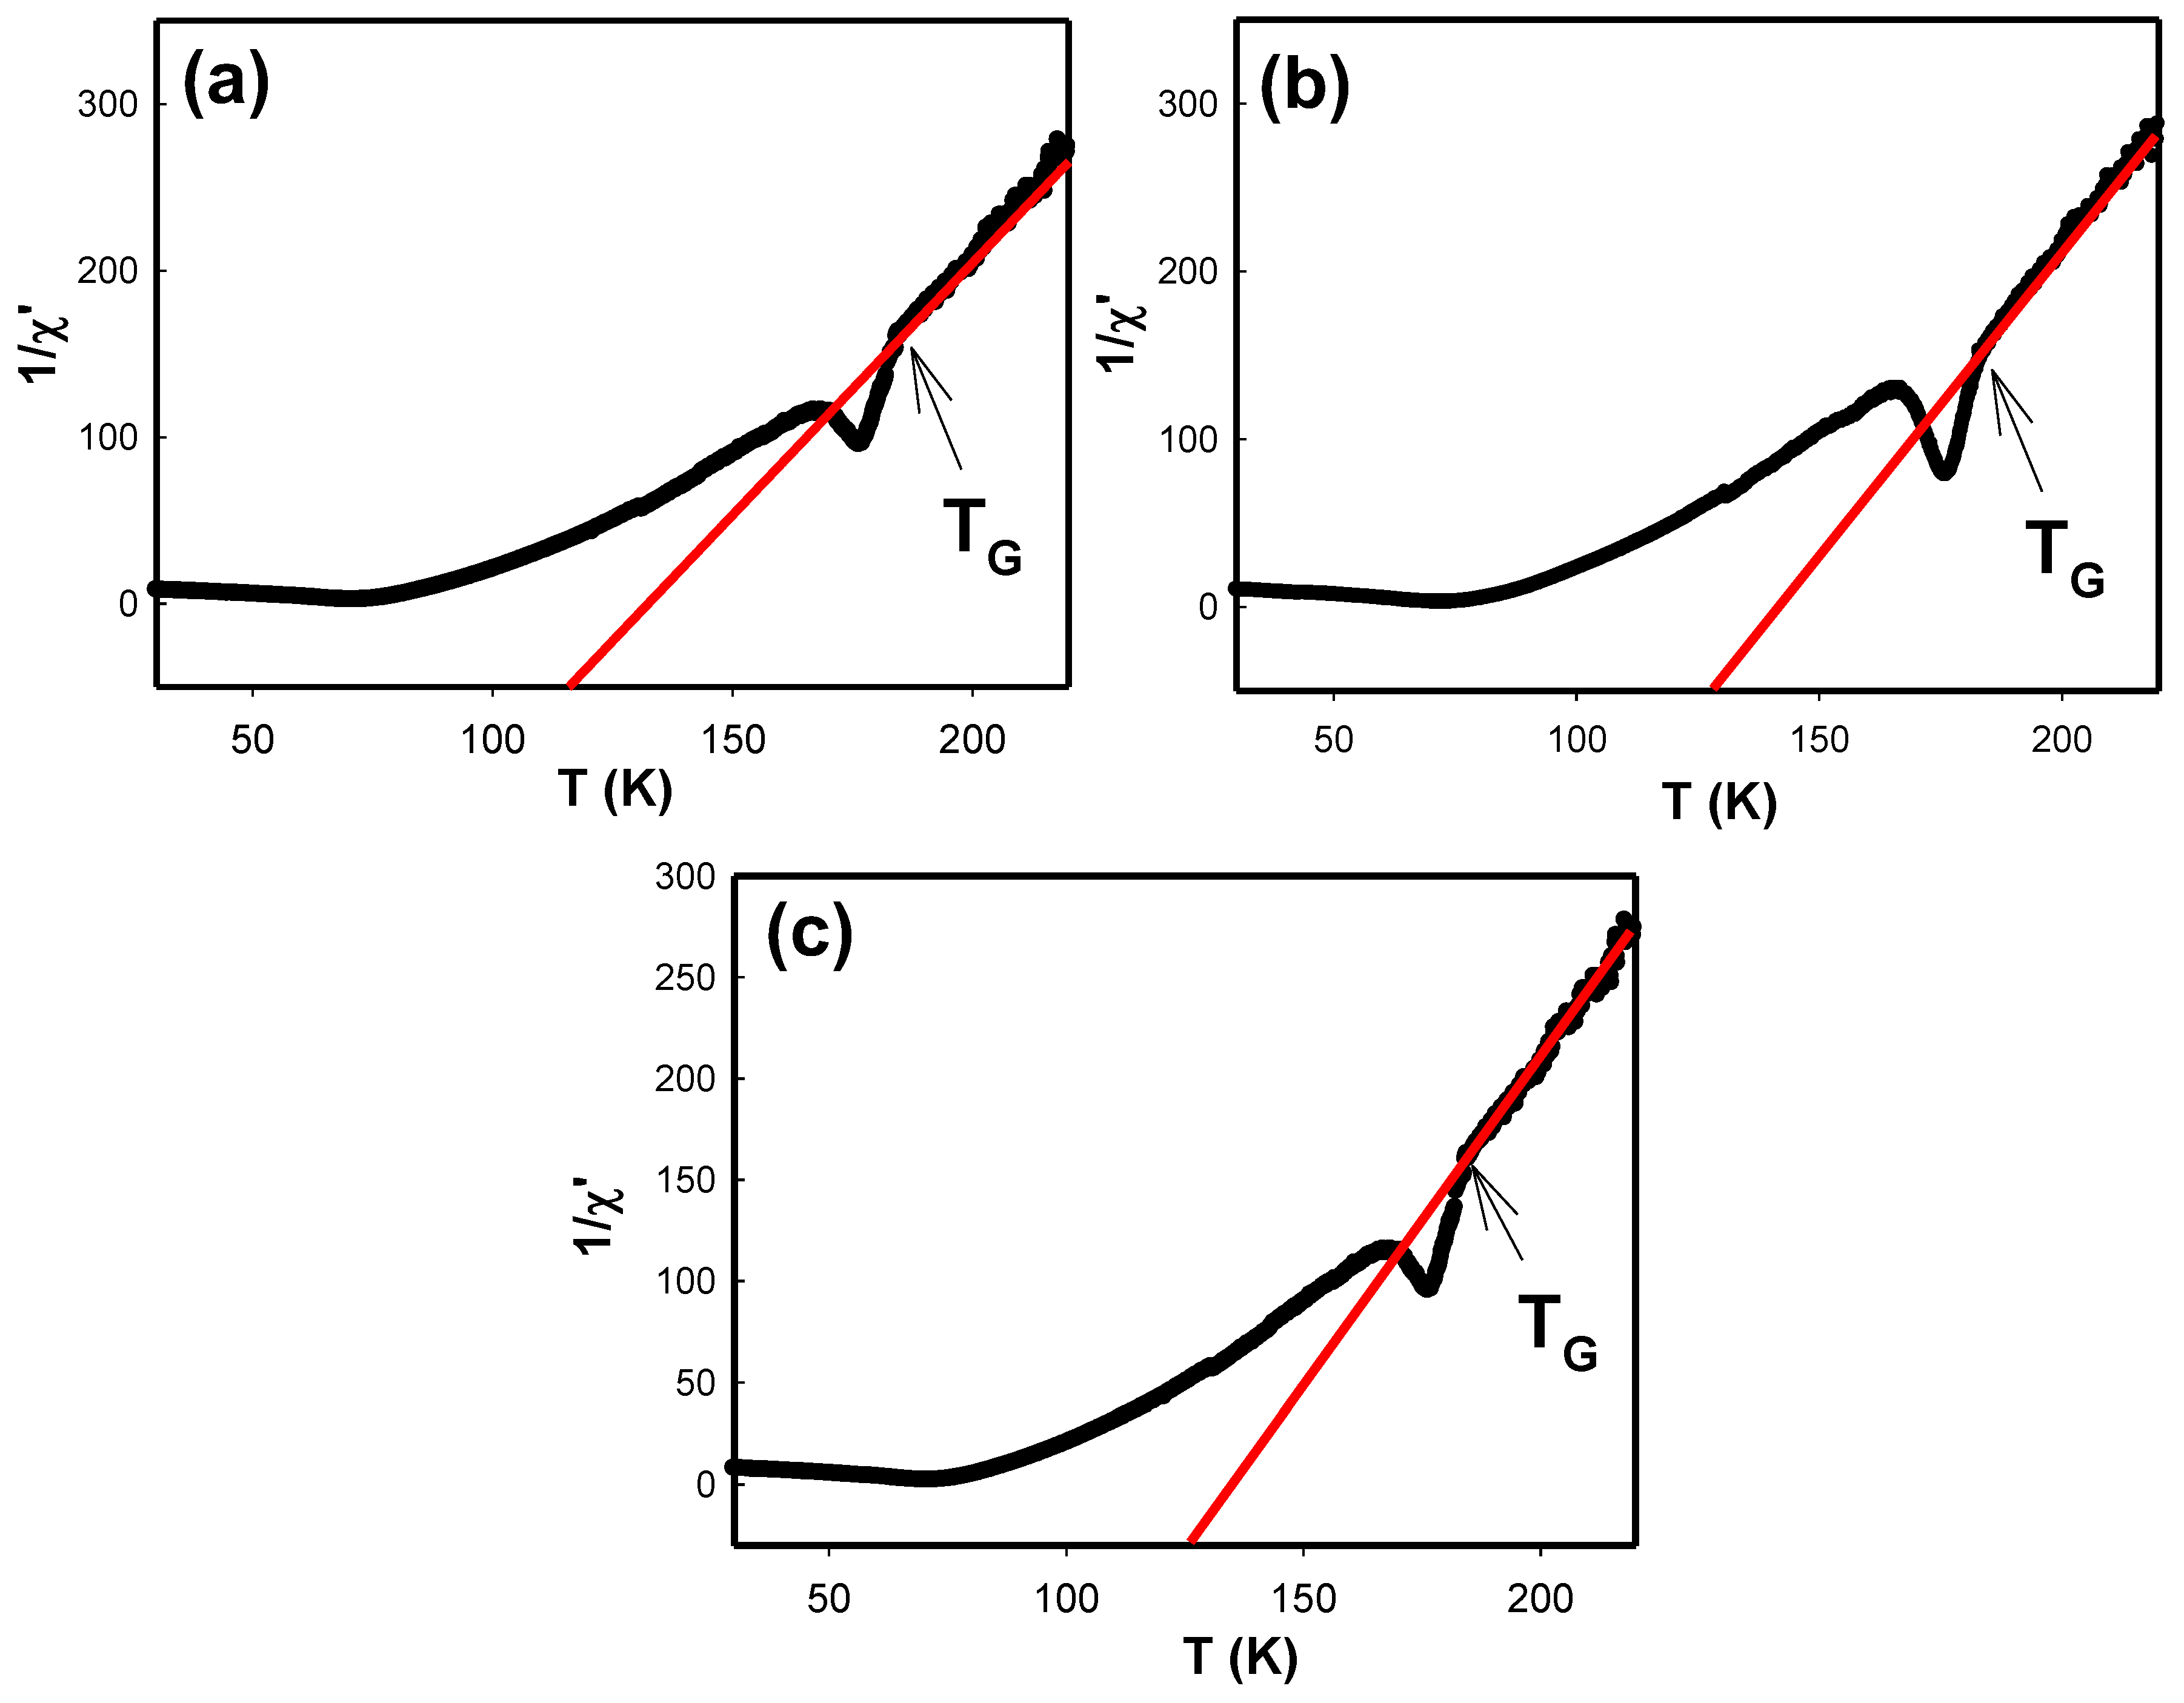
3.4. AC Susceptibility Measurement
4. Conclusions
Author Contributions
Funding
Acknowledgments
Conflicts of Interest
References
- Massa, N.E.; Campo, L.; Meneses, D.D.S.; Martínez-lope, M.J.; Alonso, J.A. High temperature far infrared dynamics of orthorhombic NdMnO3; emissivity and reflectivity. J. Phys. Condens. Matter. 2013, 25, 235603. [Google Scholar] [CrossRef] [PubMed] [Green Version]
- Renwen, Q.; Zhe, L.; Jun, F. Influence of Bi3+ doping on electronic transport properties of La0.5xBixCa0.5MnO3 manganites. Phys. B Phys. Condens. Matter. 2011, 406, 1312–1316. [Google Scholar]
- Hernández, E.; Sagredo, V.; Delgado, G.E. Synthesis and magnetic characterization of LaMnO3 nanoparticles. Rev. Mex. Fis. 2015, 61, 166–169. [Google Scholar]
- Ahmadvand, H.; Salamati, H.; Kameli, P. The effect of grain boundaries on the domain wall dynamics in Pr1−xAgxMnO3 manganites. J. Appl. Phys. 2010, 107, 083913. [Google Scholar] [CrossRef] [Green Version]
- Nandy, A.; Roychowdhury, A.; Das, D.; Pradhan, S.K. Structural and magnetic characterizations of undoped and K-doped NdMnO3 single crystals synthesized by sol-gel route: A comparative study. Powder Technol. 2014, 254, 538–547. [Google Scholar] [CrossRef]
- Chatterji, T.; Ouladdiaf, B.; Bhattacharya, D. Neutron diffraction investigation of the magnetic structure and magnetoelastic effects in NdMnO3. J. Phys. Condens. Matter. 2009, 21, 1–6. [Google Scholar] [CrossRef]
- Liu, K.; Wu, X.W.; Ahn, K.H.; Sulchek, T.; Chien, C.L.; Xiao, J.Q. Charge ordering and magnetoresistance in Nd1−xCaxMnO3 due to reduced double exchange. Phys. Rev. B 1996, 54, 3007. [Google Scholar] [CrossRef] [Green Version]
- Wu, S.Y.; Hwang, S.R.; Li, W.; Lee, K.C.; Lynn, J.W.; Liu, R.S. Jahn-Teller distortion, charge ordering, and magnetic transitions in Ca-Doped NdMnO3. J. Phys. 2000, 38, 354–359. [Google Scholar]
- Arifin, M.; Ibrahim, N.; Mohamed, Z.; Yahya, A.K.; Khan, N.A.; Khan, M.N. Revival of metal-insulator and ferromagnetic-paramagnetic transitions by Ni substitution at Mn site in charge-ordered monovalent doped Nd0.75Na0.25MnO3 manganites. J. Supercond. Nov. Magn. 2018, 31, 2851–2868. [Google Scholar] [CrossRef]
- Tang, T.; Tien, C.; Hou, B.Y. Electrical transport and magnetic properties of Nd1−xNaxMnO3 manganites. J. Alloys Compd. 2008, 461, 42–47. [Google Scholar] [CrossRef]
- Chiba, H.; Atou, T.; Syono, Y. Magnetic and Electrical Properties of Bi1−xSrxMnO3: Hole-Doping Effect on Ferromagnetic Perovskite BiMnO3. J. Solid State Chem. 1997, 132, 139–143. [Google Scholar] [CrossRef]
- Ghani, M.A.; Mohamed, Z.; Yahya, A.K. Effects of Bi substitution on magnetic and transport properties of La0.7−xBixAg0.3MnO3 ceramics. J. Supercond. Nov. Magn. 2012, 25, 2395–2402. [Google Scholar] [CrossRef]
- Zhao, Y.D.; Park, J.; Jung, R.J.; Noh, H.J.; Oh, S.J. Structure, magnetic and transport properties of La1−xBixMnO3. J. Magn. Magn. Matter. 2004, 280, 404–411. [Google Scholar] [CrossRef]
- Sugawara, F.; Iiida, S. Magnetic properties and crystal distortions of BiMnO3 and BiCrO3. J. Phys. Soc. Jpn. 1968, 25, 1553–1558. [Google Scholar] [CrossRef]
- Lalitha, G.; Reddy, P.V. Low temperature resistivity anomalies in bismuth doped manganites. J. Alloys Compd. 2010, 494, 476–482. [Google Scholar] [CrossRef]
- Alonso, J.A.; Martínez-Lope, M.J.; Casais, M.T.; Fernández-Díaz, M.T. Evolution of the Jahn-Teller distortion of MnO6 octahedra in RMnO3 perovskites (R = Pr, Nd, Dy, Tb, Ho, Er, Y): A neutron diffraction study. Inorg. Chem. 2000, 39, 917–923. [Google Scholar] [CrossRef]
- Srivastava, S.R.S.K. Magnetic properties of Nd1−xAgxMnO3 compounds. J. Phys. Condens. Matter. 2008, 20, 505212. [Google Scholar] [CrossRef]
- Sangale, M.D.; Gaikwad, D.N.; Sonawane, D.V.; Suryavanshi, D.M. Synthesis and characteristic properties of perovskite-type NdMnO3 nanocrystal materials via a co-precipitation method. J. Chem. Phys. Sci. 2018, 7, 291–296. [Google Scholar]
- Somvanshi, A.; Husain, S. Study of structural, dielectric and optical properties of NdMnO3. AIP Conf. Proc. 2018, 1953, 1–5. [Google Scholar]
- Turky, A.O.; Rashad, M.M.; Hassan, A.M.; Elnaggar, E.M.; Bechelany, M. Optical, electrical and magnetic properties of lanthanum strontium manganite La1−xSrxMnO3 synthesized through the citrate combustion method. Phys. Chem. Chem. Phys. 2017, 19, 6878–6886. [Google Scholar] [CrossRef]
- Mohamed, Z.; Shahron, I.S.; Ibrahim, N.; Maulud, M.F. Influence of ruthenium doping on the crystal structure and magnetic properties of Pr0.67Ba0.33Mn1−xRuxO3 Manganites. Crystal 2020, 10, 295. [Google Scholar] [CrossRef] [Green Version]
- Wu, S.Y.; Kuo, C.M.; Wang, H.Y.; Li, W.-H.; Lee, K.C. Magnetic structure and spin reorientation of the Mn ions in NdMnO3. J. Appl. Phys. 2000, 87, 5822–5824. [Google Scholar] [CrossRef]
- Asmira, N.; Ibrahim, N.; Mohamed, Z.; Yahya, A.K. Effect of Cr3+ substitution at Mn-site on electrical and magnetic properties of charge ordered Bi0.3Pr0.3Ca0.4MnO3 manganites. Phys. B Condens. Matter. 2018, 544, 34–46. [Google Scholar] [CrossRef]
- Manjunatha, S.O.; Rao, A.; Poornesh, P.; Lin, W.J.; Kuo, Y.K. Magnetic inhomogeneity and Griffiths phase in Bi substituted La0.65−xBixCa0.35MnO3 manganites. Phys. B Condens. Matter. 2016, 498, 82–91. [Google Scholar] [CrossRef]
- Zheng, X.; Gao, T.; Jing, W.; Wang, X.Y.; Liu, Y.S.; Chen, B.; Dong, H.L.; Chen, Z.Q.; Cao, S.X.; Cai, C.B.; et al. Evolution of Griffiths phase and spin reorientation in perovskite manganites. J. Magn. Magn. Mater. 2019, 491, 165611. [Google Scholar] [CrossRef]
- Pȩkała, M.; Szydłowska, J.; Pȩkała, K.; Drozd, V. Griffiths like phase in nanocrystalline manganite La0.50Ca0.50MnO3 studied by magnetic susceptibility and electron spin resonance. J. Alloys Compd. 2016, 685, 237–241. [Google Scholar] [CrossRef]
- Elyana, E.; Mohamed, Z.; Kamil, S.A.; Supardan, S.N.; Chen, S.K.; Yahya, A.K. Revival of ferromagnetic behavior in charge-ordered Pr0. 75Na0. 25MnO3 manganite by ruthenium doping at Mn site and its MR effect. J. Solid State Chem. 2018, 258, 191–200. [Google Scholar] [CrossRef]


| Doping Content (x) | 0.0 | 0.25 | 0.50 |
|---|---|---|---|
| Space group | Pbnm | Pbnm | Pbnm |
| Symmetry | Orthorhombic | Orthorhombic | Orthorhombic |
| a (Å) | 5.4240 | 5.4292 | 5.4321 |
| b (Å) | 5.5570 | 5.6534 | 5.7712 |
| c (Å) | 7.6648 | 7.6323 | 7.8536 |
| α = β = γ | 90 | 90 | 90 |
| Volume (Å3) | 231.03 | 234.27 | 236.25 |
| Doping Content (x) | 0 | 0.25 | 0.50 |
|---|---|---|---|
| Mn–O1 (Å) | 1.9903 (5) | 2.0407 (7) | 1.9874 (4) |
| Mn–O2 (Å) | 2.0256 (5) | 1.9685 (6) | 1.9289 (3) |
| < Mn–O > (Å) | 2.0080 (5) | 2.0046 (6) | 1.9581 (2) |
| Mn–O1–Mn (°) | 148.62(1) | 138.45 (3) | 148.58 (9) |
| Mn–O2–Mn (°) | 154.61(1) | 149.36 (12) | 154.08 (4) |
| < Mn–O–Mn > (°) | 151.62 (1) | 143.91 (2) | 151.33 (6) |
| χ2 | 1.038 | 2.581 | 3.812 |
| RP (%) | 8.27 | 16.76 | 14.37 |
| RWP (%) | 10.98 | 21.10 | 19.87 |
| < rA > (Å) | 1.109 | 1.142 | 1.175 |
| τ | 0.515 | 0.522 | 0.529 |
| x | 0 | 0.25 | 0.50 |
|---|---|---|---|
| TN (K) | 64 | 64 | 55 |
| TC (K) | 76 | 75 | 67 |
| TG (K) | 181 | 198 | 182 |
| GP (K) | 138 | 164 | 171 |
© 2020 by the authors. Licensee MDPI, Basel, Switzerland. This article is an open access article distributed under the terms and conditions of the Creative Commons Attribution (CC BY) license (http://creativecommons.org/licenses/by/4.0/).
Share and Cite
Azhar, N.A.; Ismail, I.S.; Mohamed, N.B.; Hashim, A.; Mohamed, Z. Effect of Bi Substitution on Structural and AC Magnetic Susceptibility Properties of Nd1−xBixMnO3. Crystals 2020, 10, 521. https://doi.org/10.3390/cryst10060521
Azhar NA, Ismail IS, Mohamed NB, Hashim A, Mohamed Z. Effect of Bi Substitution on Structural and AC Magnetic Susceptibility Properties of Nd1−xBixMnO3. Crystals. 2020; 10(6):521. https://doi.org/10.3390/cryst10060521
Chicago/Turabian StyleAzhar, Nurul Atiqah, Intan Solehah Ismail, Nur Baizura Mohamed, Azhan Hashim, and Zakiah Mohamed. 2020. "Effect of Bi Substitution on Structural and AC Magnetic Susceptibility Properties of Nd1−xBixMnO3" Crystals 10, no. 6: 521. https://doi.org/10.3390/cryst10060521