1. Introduction
Al-Cu-Li alloys have great application potentials in the aerospace field due to their excellent properties, such as low density, high strength, and stiffness [
1,
2,
3]. The addition of 1 wt% Li in aluminum can approximately reduce its density for 3% and enhance its elastic modulus for 6% [
4], which makes Al-Li alloys suitable materials for lower wings and fuselages of airplanes. During the production, hot working on these alloys is generally unavoidable, in which the hot working temperature and strain rate are key parameters for quality control. The process design largely depends on a good understanding of the deformation mechanism. Therefore, it is necessary to investigate systematically the deformation behaviors and microstructure evolution at high temperatures for Al-Cu-Li alloys.
The thermal simulation technique has been an effective method to investigate the behaviors of materials under thermo-mechanical loading. Constitutive models can be developed subsequently to describe the relationship among deformation temperature, strain rate, and flow stress [
5]. The flow behaviors of aluminum alloys have been widely simulated by Arrhenius type equations [
6,
7,
8,
9,
10], which is helpful for process design in a specific deformation condition.
Thermal softening, which was a result of dynamic recovery (DRV) and dynamic recrystallization (DRX), and strain hardening have a close relationship with deformation conditions. An improper choice of deformation parameters may induce surface cracks, inhomogeneous distribution of grains, and flow localization. Therefore, processing maps have been established on the basis of power dissipation to avoid undesirable deformation conditions [
11]. Yin [
12] developed a processing map for an Al-Cu-Li alloy, where the suitable processing windows were set up at 450–500 °C and 0.01–0.1 s
−1. Shen [
13] investigated the recrystallization of alloy 2397 at 450–550 °C with strain rates of 0.001–0.1 s
−1. It was reported that the dynamical recrystallization (DRX) was controlled by a combination of deformation mechanisms, i.e., grain boundary bulging (BLG) in the original grains and the transformation of low-angle grain boundaries (LAGBs) into high-angle grain boundaries (HAGBs) in the recrystallized grains. Nayan [
14] established a wider processing map for alloy 2195 and found DRX was the main softening mechanism in the alloy. Two suitable processing windows are located at temperatures between 400–450 °C with strain rates of 10
−2–10
−1.5 s
−1 and 10
−0.5–10 s
−1. Yu et al. studied the recrystallization in 2A97 alloy and found dynamic precipitation of T
1 phase during hot deformation, and the main recrystallization mechanism was discontinuous dynamic recrystallization (DDRX) [
7]. Ou et al.’s [
15] study on alloy 2060 indicated that the dominant softening mechanism was DRV and the best hot working window for this alloy was a temperature of 380–500 °C and strain rates of 0.01–3 s
−1.
It can be summarized that a different softening mechanism was proposed to explain the hot deformation behavior in Al-Cu-Li alloys, and various process maps were developed for suitable hot working windows. However, systematic investigations on the flow behavior, microstructure evolution, and deformation mechanism of 2060-type alloys are still needed, particularly on the deformation at typical production temperatures, strain rates and large strains. The related recrystallization mechanism is seldom reported as well. Therefore, in this work the hot compression tests on an Al-Cu-Li-Mg-Ag alloy were carried out to acquire the stress–strain data in near practical production conditions. The constitutive models were established and the processing maps were developed to investigate the flow behavior. The microstructure was characterized by using the electron back-scattered diffraction (EBSD) technique, and the relationship between lnZ and the recrystallization mechanism was discussed in detail.
2. Materials and Methods
The nominal composition of the experimental alloy was Al-4.0Cu-0.7Li-0.7Mg-0.4Zn-0.3Mn- 0.3Ag-0.11Zr (wt%). The material was semi-continuously cast and homogenized at 410 °C for 4 h followed by 490 °C for 24 h, and then was machined into cylinders with a diameter of 8 mm and a height of 12 mm for hot compression tests.
A Gleeble 3500 thermo-mechanical tester (Dynamic Systems Inc., Austin, TX, USA) was used for the hot compression tests. The test temperatures were between 350 °C and 470 °C and the test strain rate was between 0.01 and 10 s−1. In order to ensure the reliability of data through hot compression tests, graphite was applied between the sample and the die to reduce the interface friction. The specimens were heated up with a heating rate of 2.5 °C/s and held for 3 min at the deformation temperature before the hot compression test to ensure a uniform temperature over the entire specimen, then were compressed to a reduction of 60% in thickness, and finally were quenched into water to reserve the hot deformation microstructures. The microstructures of the test specimens were characterized by a field emission scanning electron microscope (SEM, TESCAN MIRI 3, Brno, Czech Republic) with an electron backscatter diffraction (EBSD) detector (EDAX Inc., Oxford Instruments, Abingdon, UK).
The deformed samples were cut parallel to the compression direction. The examined surface was ground with different sizes of SiC papers and then electro-polished in an electrolyte solution comprised of 10% perchloric acid and 90% alcohol at 20 V for 15 s before observation. After exporting the data in the format cpr from AZtec software (version 3.2, EDAX Inc., Abingdon, UK), EBSD maps were obtained by using HKL Channel 5.
3. Results and Discussion
3.1. Original Microstructure
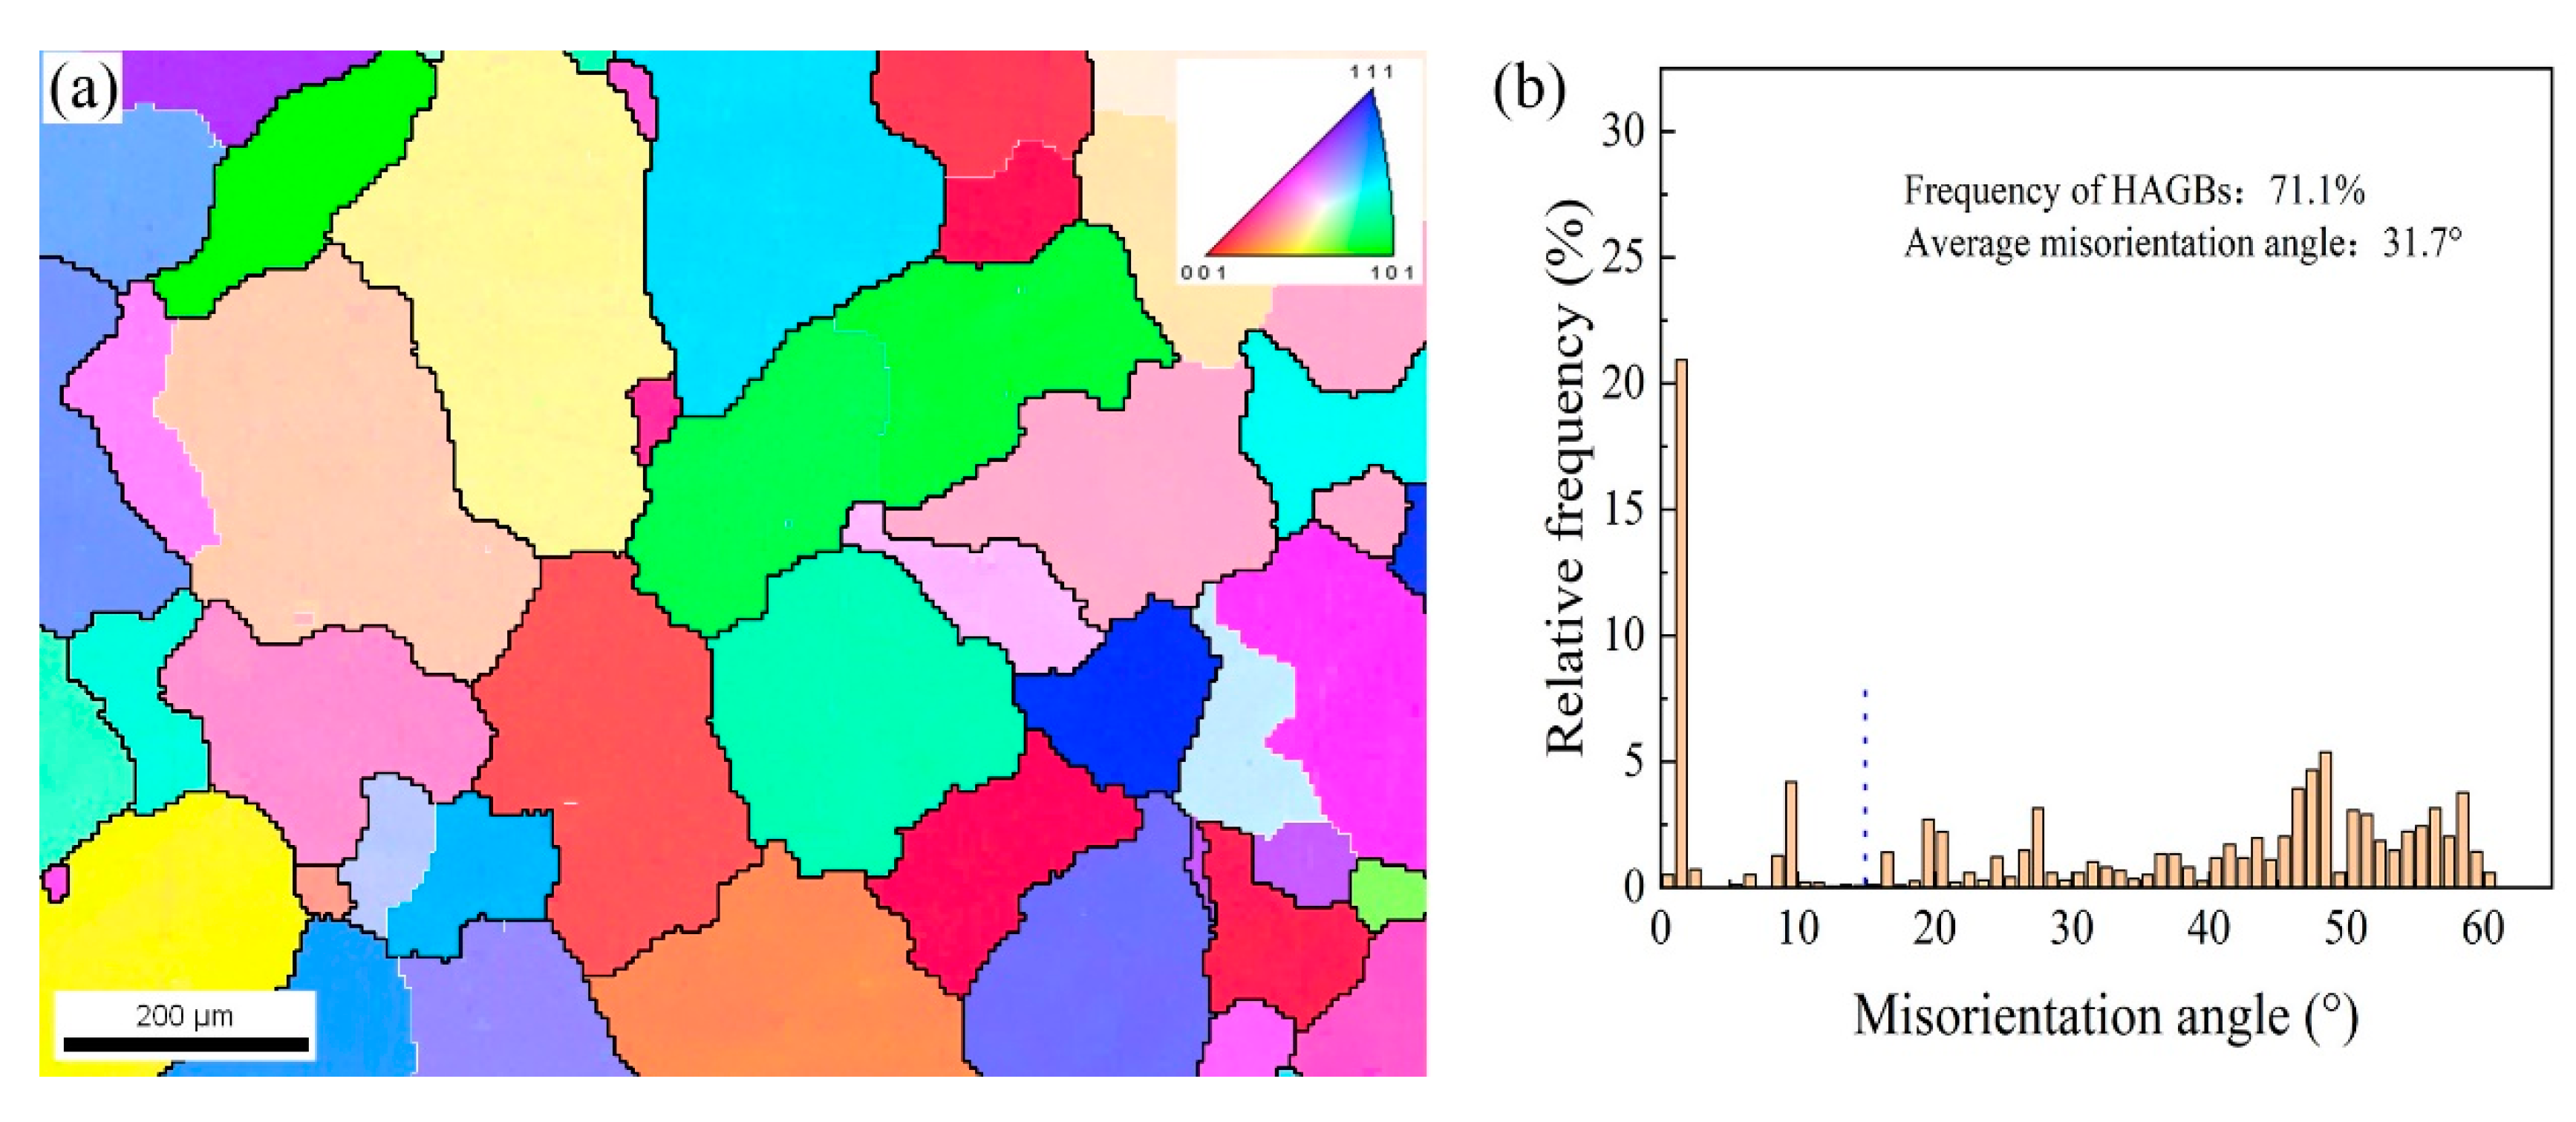
Figure 1 shows the EBSD orientation map of the Al-Cu-Li-Mg-Ag alloy after homogenization. The grain size is about 190 μm. In the map, the high angle grain boundaries (HAGBs) are depicted in black lines whereas the low angle grain boundaries (LAGBs) are depicted in white lines. HAGBs and LAGBs are differentiated by the misorientation angle, HAGBs are defined as boundaries with misorientation angles higher than 15°, while LAGBs are defined as misorientation angles lower than 15°. As shown in
Figure 1b, HAGBs occupy about 70% of the boundaries and the average misorientation angle is around 30°, so the majority of grain boundaries in the starting material are HAGBs.
3.2. Flow Behavior
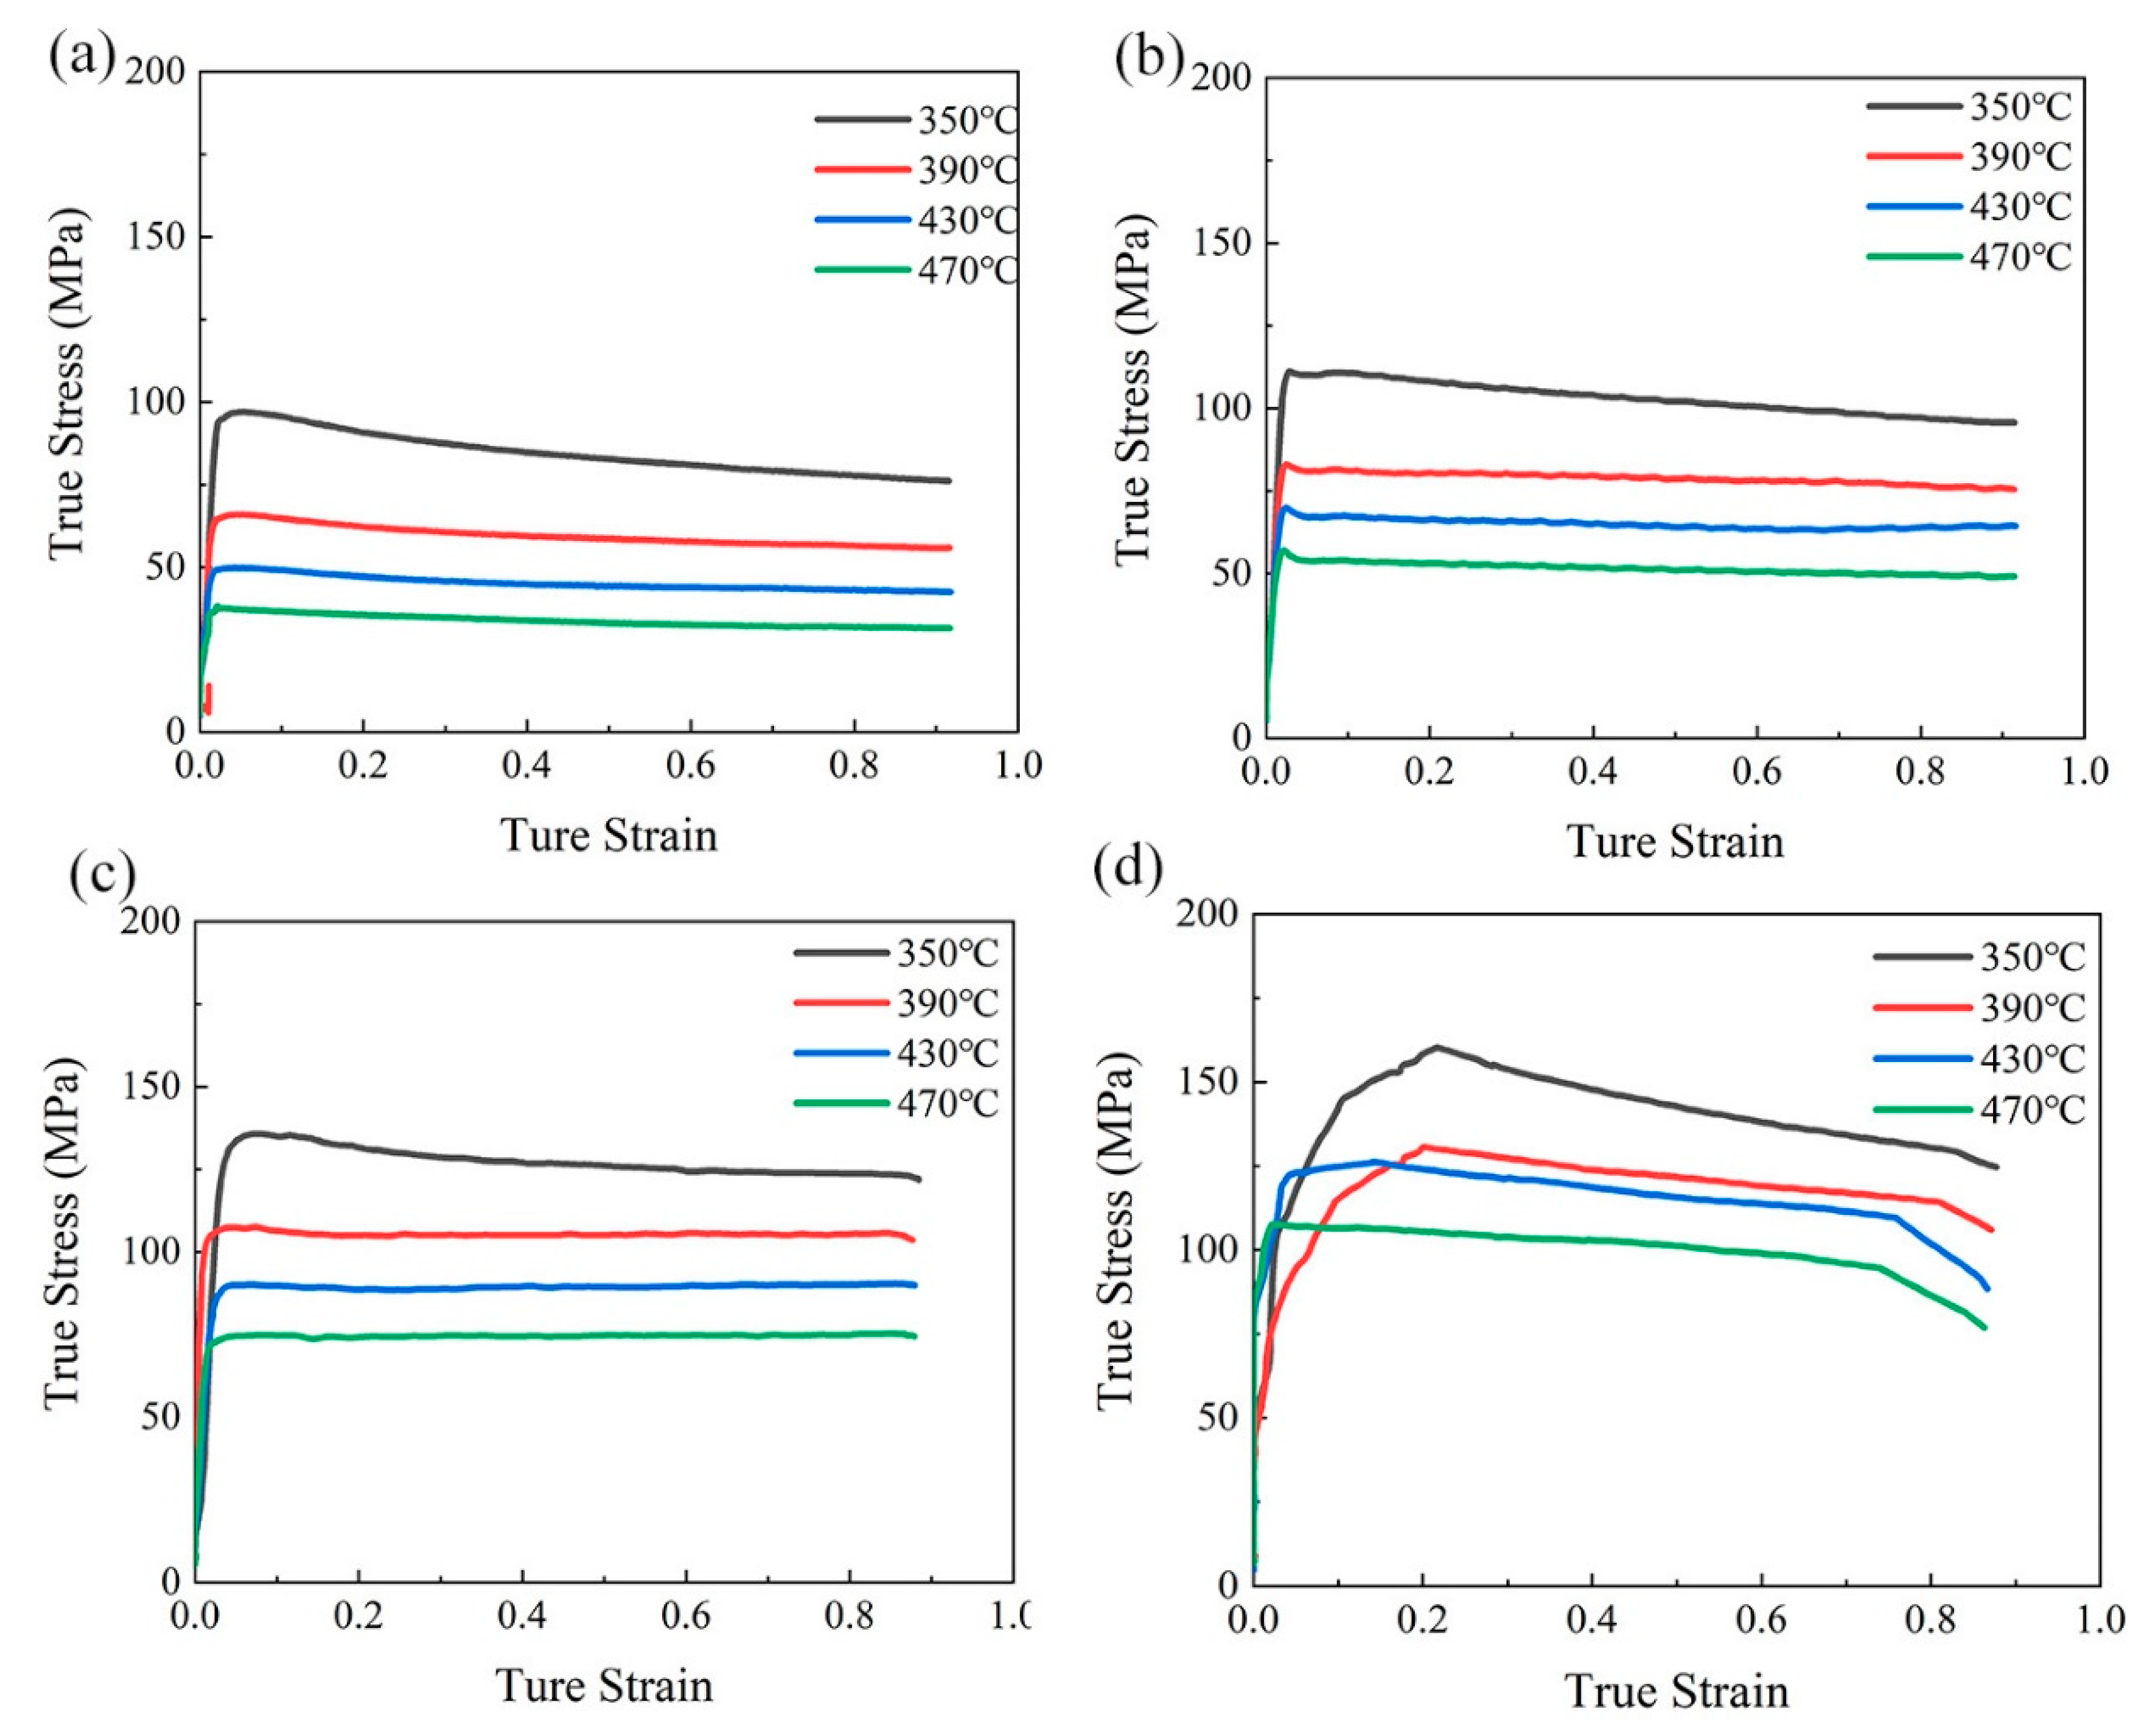
Figure 2 shows the true stress–true strain curves of the Al-Cu-Li-Mg-Ag alloy during hot compression. In all compression tests, the flow stress decreases progressively with the increase of strain after a peak stress. This is dynamic softening, which is a result of dynamic recovery and recrystallization [
16]. At a given strain rate, the flow stress decreases with increasing deformation temperatures, because of a higher softening effect at higher temperatures, and lower resistance to the motion of dislocations. When the sample is compressed at the same temperature, the peak stress decreases with the decreasing strain rates, as a low strain rate extends the deformation time and offers more time for dynamic softening [
17]. However, adiabatic heating due to rapid plastic deformation will lead to the flow softening, especially at higher strain rates [
18]. Because of this effect, the corrected flow stress shown in
Figure 2c,d has been applied to the data used in following sections.
3.3. Constitutive Equation
The constitutive equation for Al-Cu-Li-Mg-Ag alloy can be developed from the experimental strain–stress curves in
Figure 2. In order to understand the influence of deformation temperature and strain rate on the experimental strain–stress curve, the Zener–Hollomon parameter Z is often used [
8]:
where
represents the strain rate, Q is the activation energy of hot deformation (kJ/mol), R is the universal gas constant (8.314 kJ mol
−1), and T is the deformation temperature. The Z parameter is an important parameter for hot deformation, especially in understanding the microstructure evolution during hot deformation [
19].
The relation among stress, strain rate, and temperature during hot deformation can also be expressed by [
2]:
where
is a function of stress σ and has different expressions at different stress levels. It is generally expressed using a hyperbolic sine function, as
where A,
, and n are material constants and
. n
1 and
can be calculated by the mean slope of
and
, respectively, so that the value of α can be obtained thereafter.
From Equations (1)–(3), it can be derived that the values of Q and lnZ are
where n is defined as the relative change of
vs.
at constant temperatures and the value of S is defined as the relative change of
vs. 1/T at constant strain rates. Therefore, Q and lnZ can be calculated according to Equations (4) and (5) respectively.
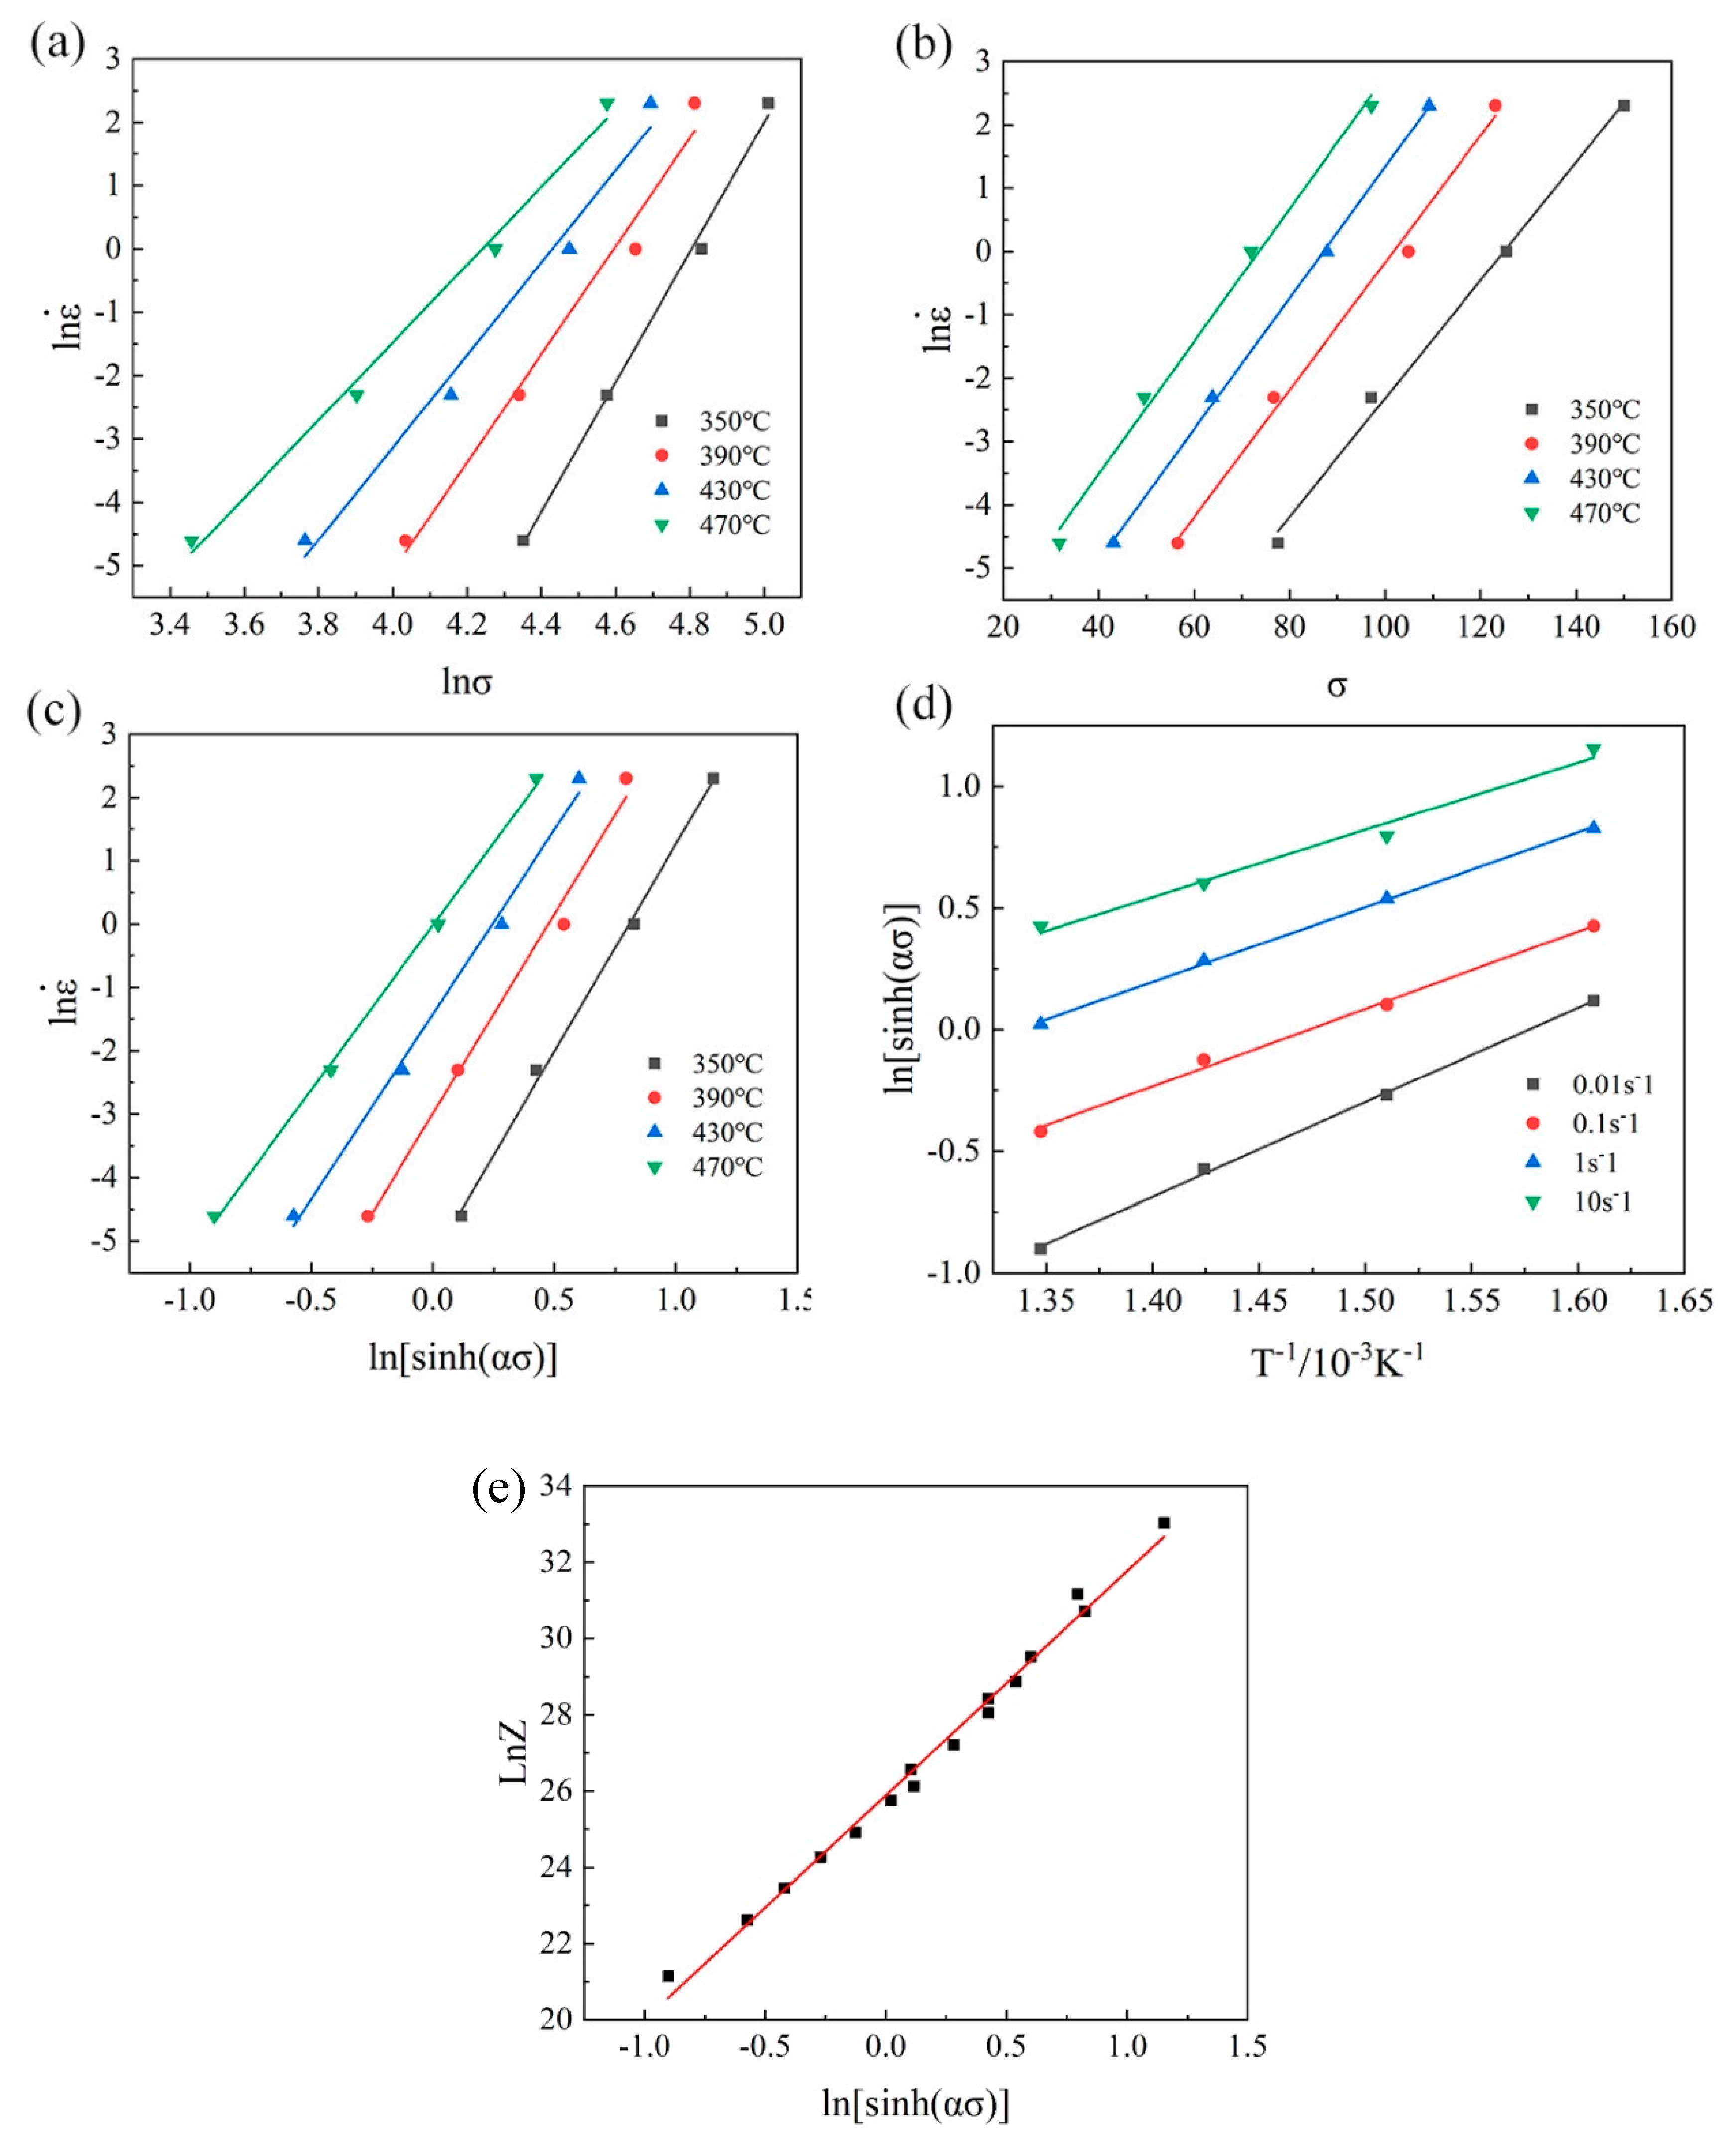
The method to determine the material constants listed above is shown hereafter, using the strain at 0.8 as an example. As a result of linear fitting in
Figure 3, the average value of n
1 and
are 8.053 and 0.1004 MPa
−1, respectively. Therefore,
can be obtained by β/n
1, which is 0.0125 MPa
−1. n is 5.886, and Q is 159.9 kJ mol
−1. The value of lnZ can then be figured out on the basis of Equation (1) and the results are listed in
Table 1.
lnA is the value of lnZ at ln[sinh(ασ)] = 0 and can be obtained from
Figure 3e. Therefore, the constitutive equation for the Al-Cu-Li-Mg-Ag alloy at the strain of 0.8 is:
For a more general expression, different levels of strains should be considered, as it plays an important role in the flow behavior of aluminum alloy (shown in
Figure 2). Based on the method of compensation for strain [
20], the constitutive equation predicting flow stresses for the Al-Cu-Li-Mg-Ag alloy can be described as:
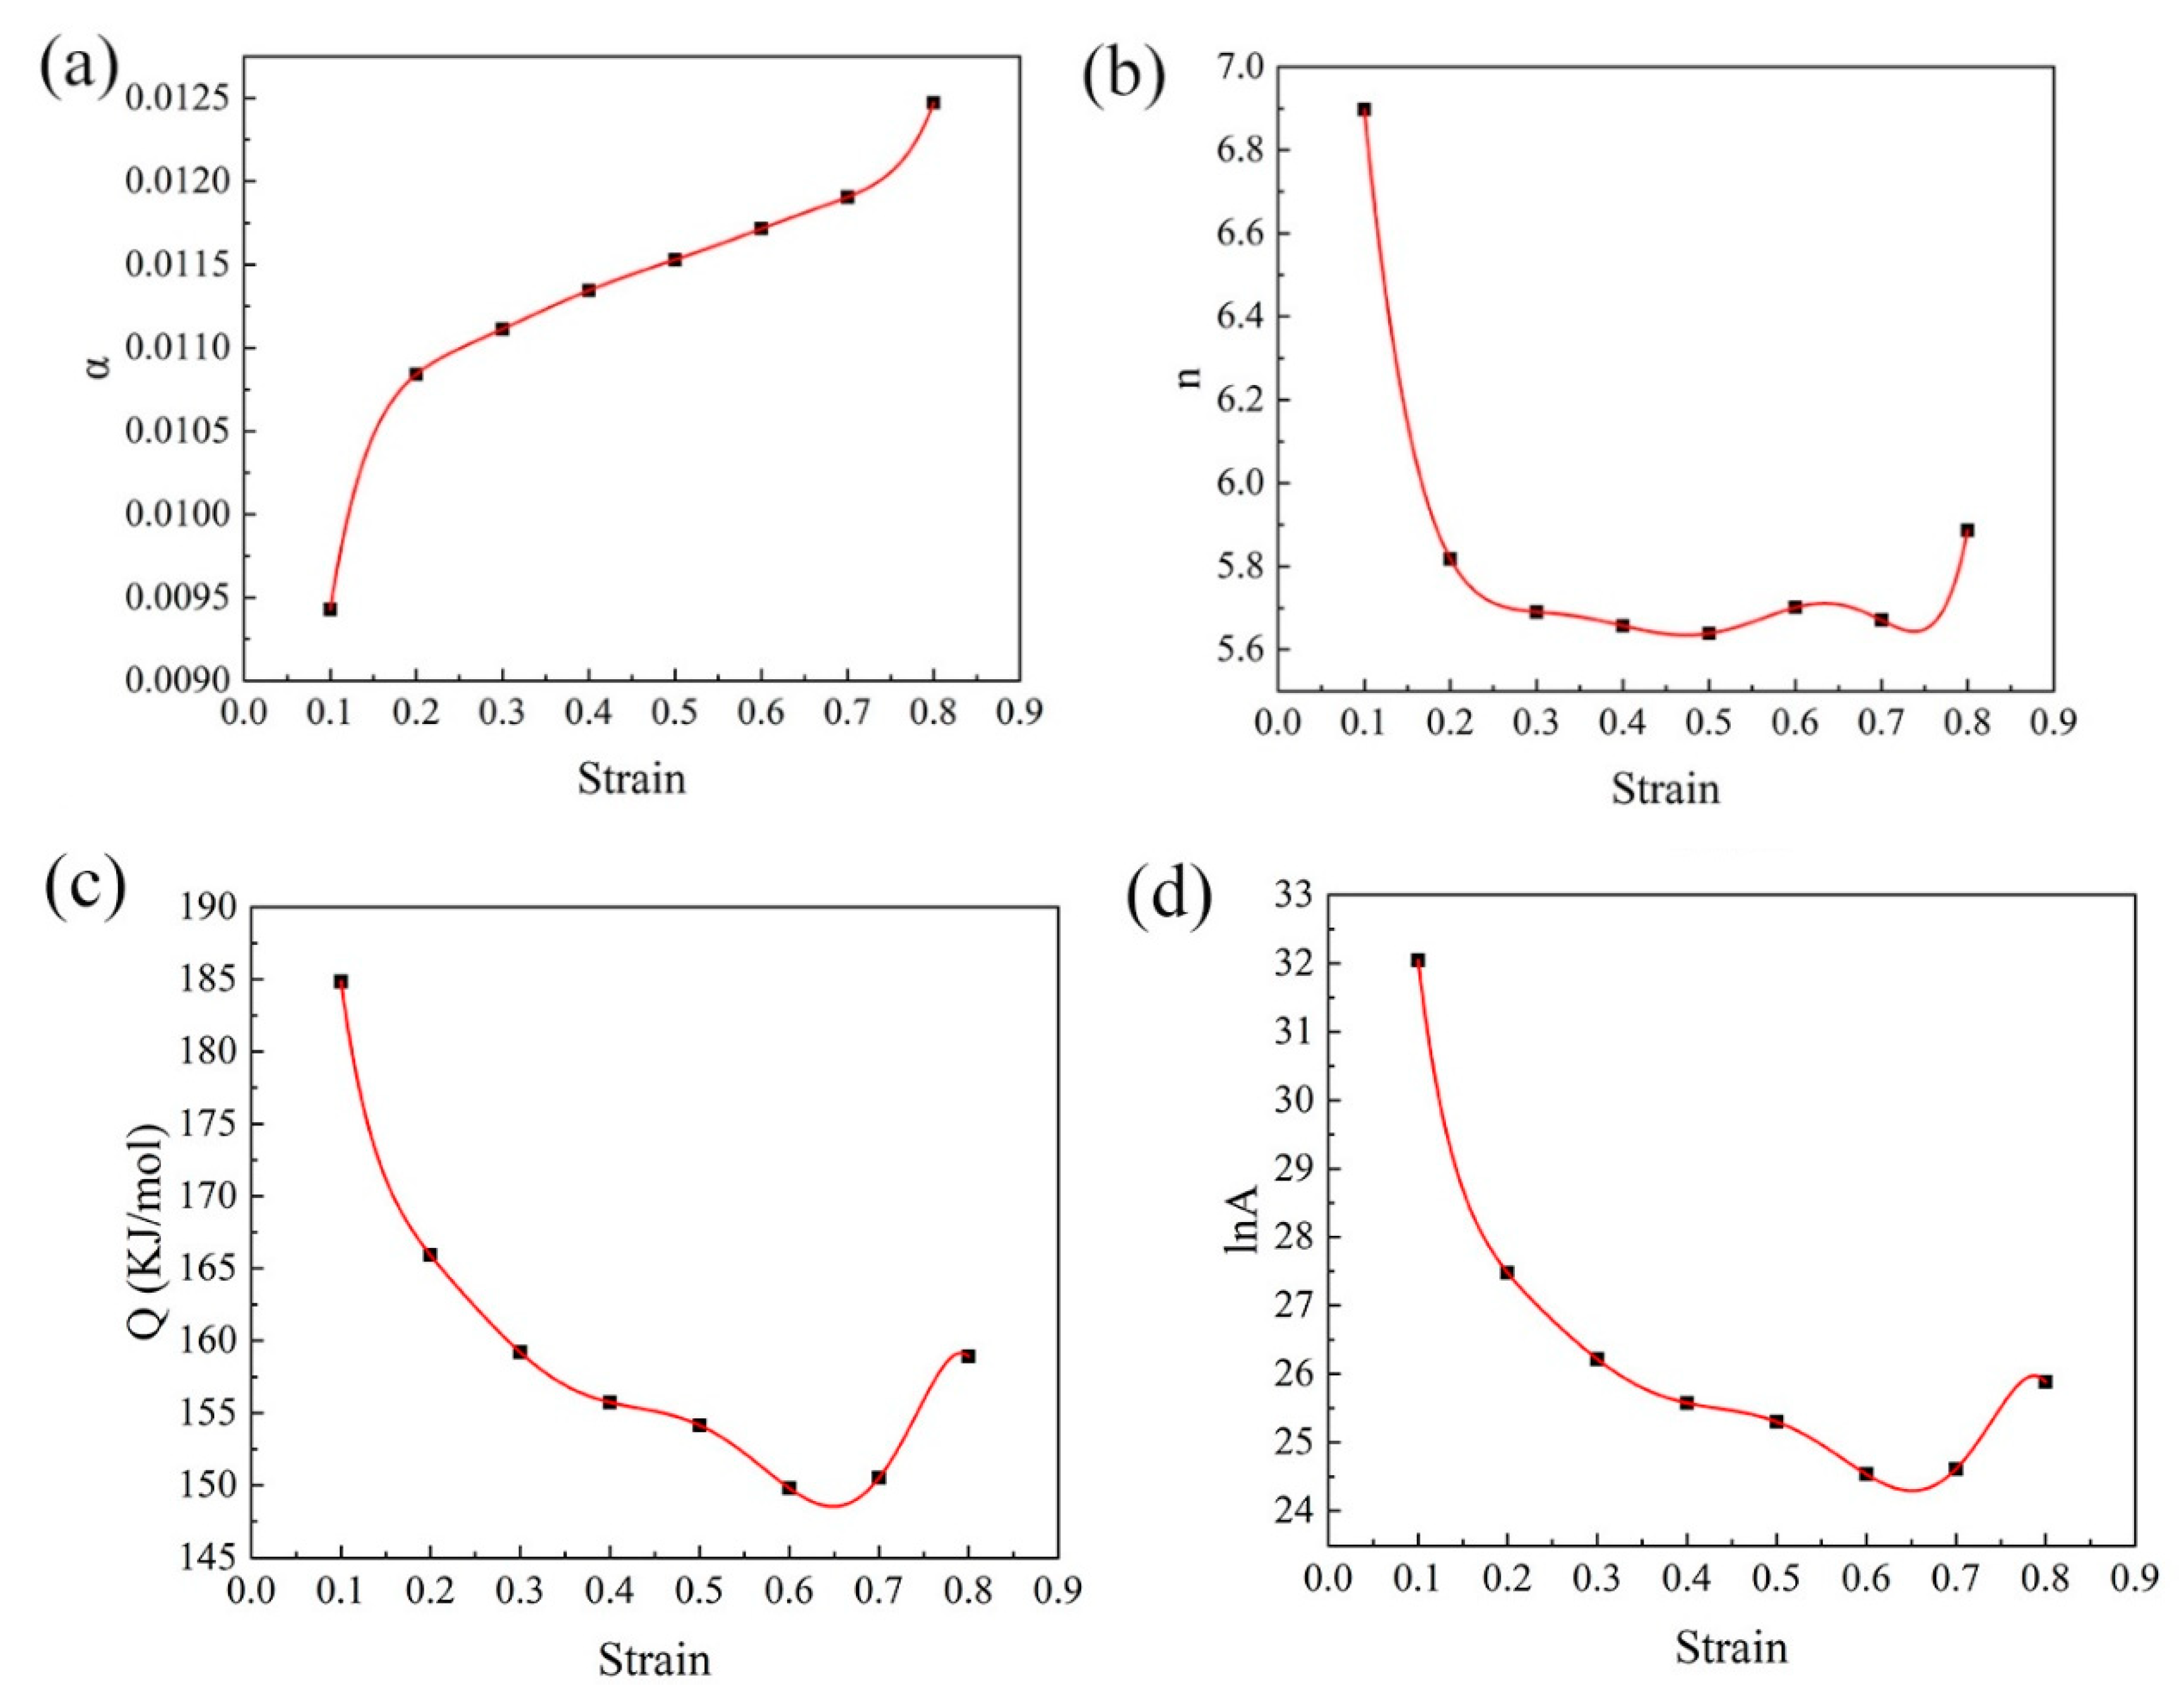
The material constants (α, Q, n, and lnA) in the above equation at various strains ranging from 0.1 to 0.8 with an interval of 0.1 can be calculated in the similar method. The results are shown in
Figure 4. It is clear that these constants are strain dependent and can be correlated by the seventh-order polynomial fitting curves to describe accurately the influence of strains.
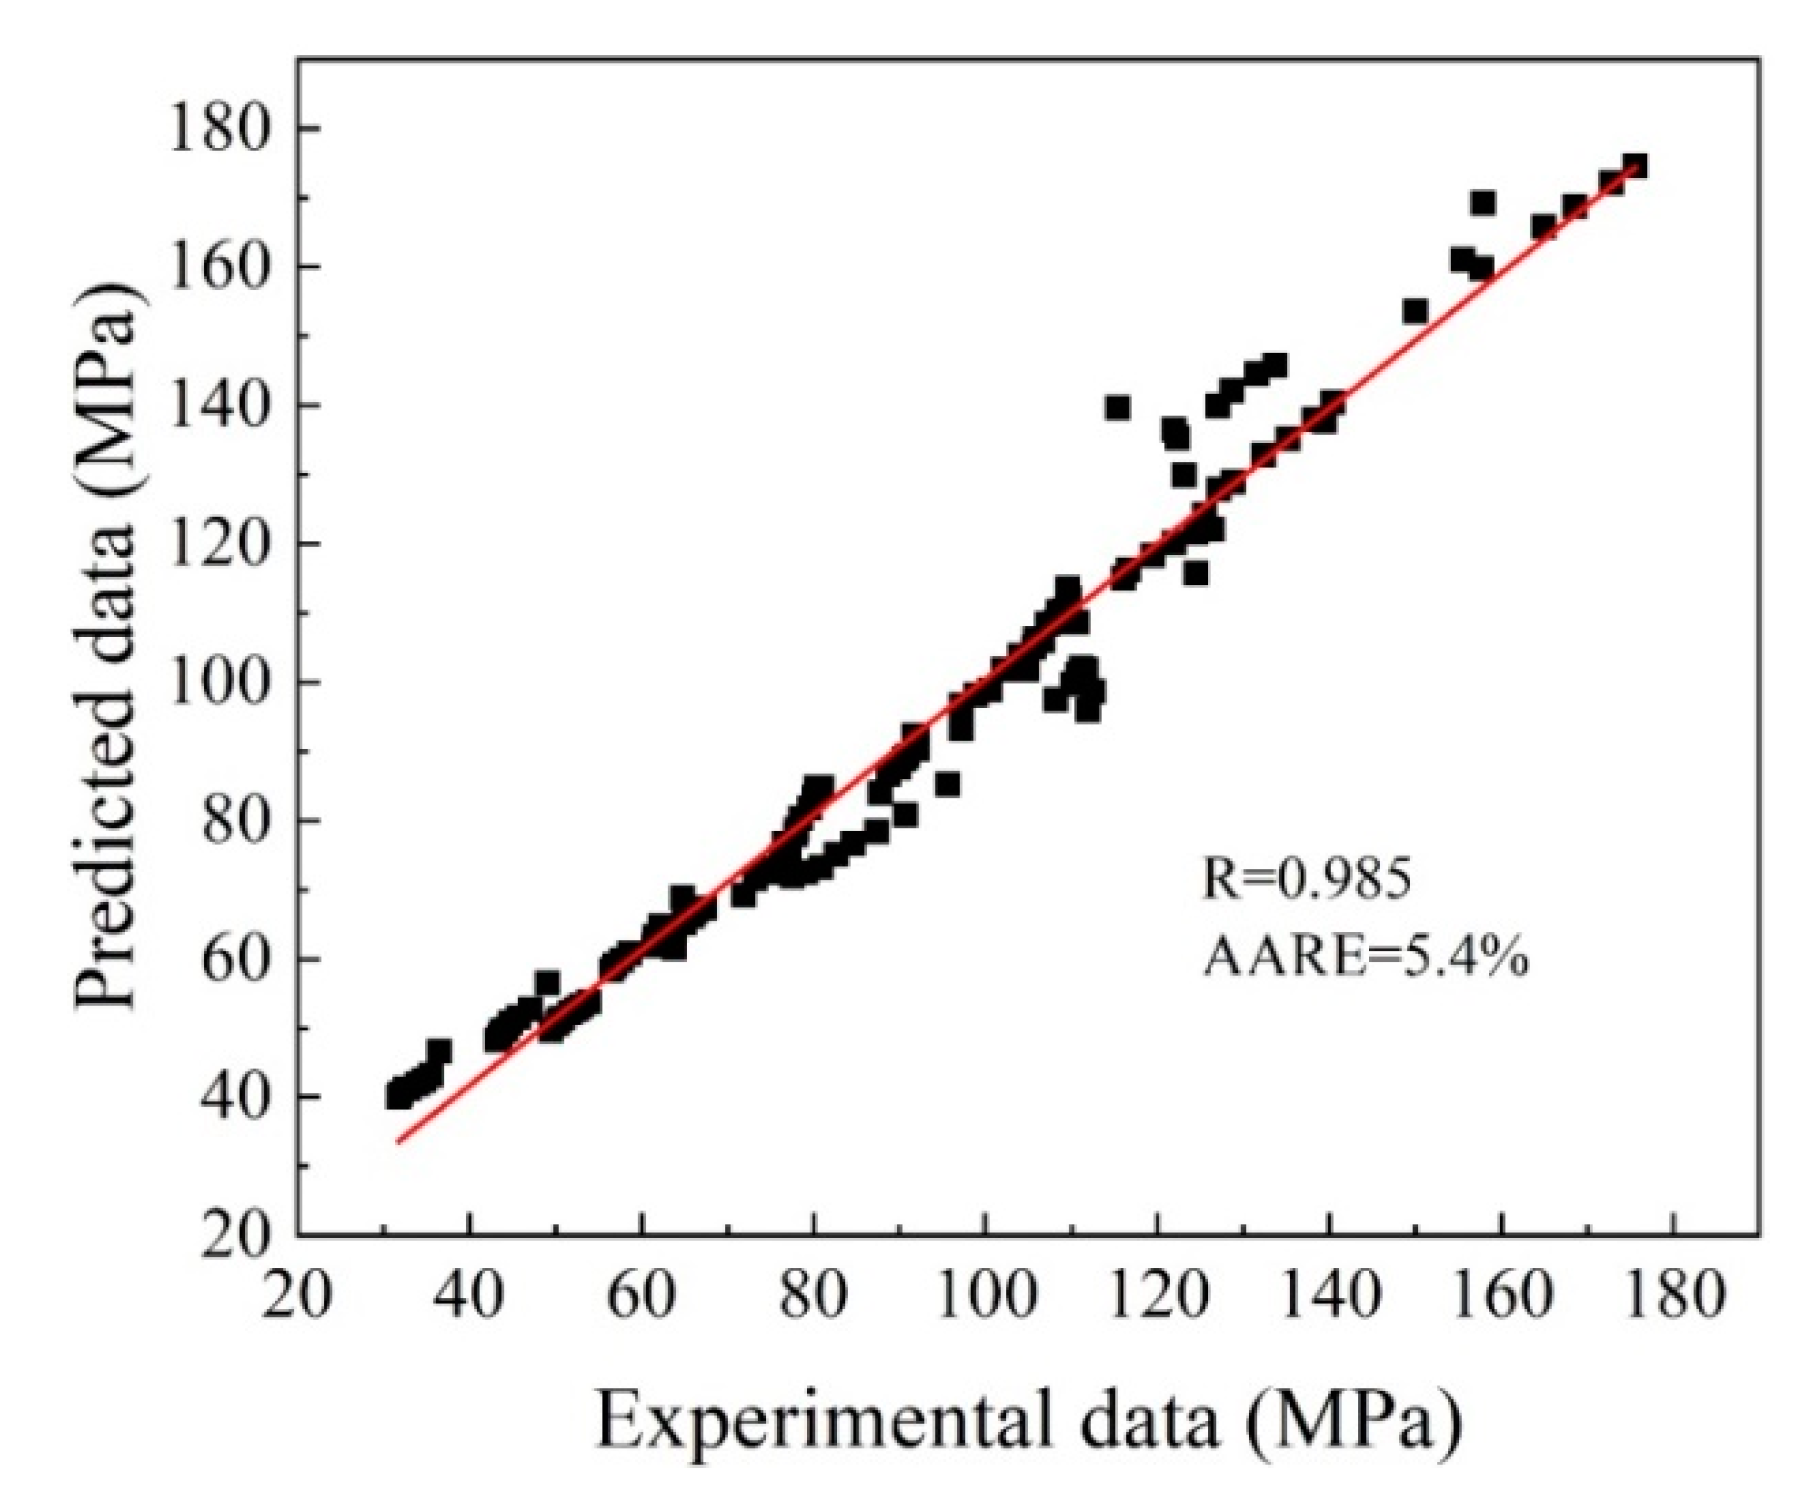
The predicted values of flow stresses and the experimental data are plotted in
Figure 5. The correlation coefficient (R) can be introduced to evaluate the accuracy of the constitutive equations. By fitting the predicted data with the experimental values of flow stresses, the value of R can be figured out as 0.985 with an average relative error (AARE) of 5.4%, which indicates the developed model can predict the high temperature behavior of the experimental Al-Cu-Li-Mg-Ag alloy very well.
3.4. Hot Processing Map
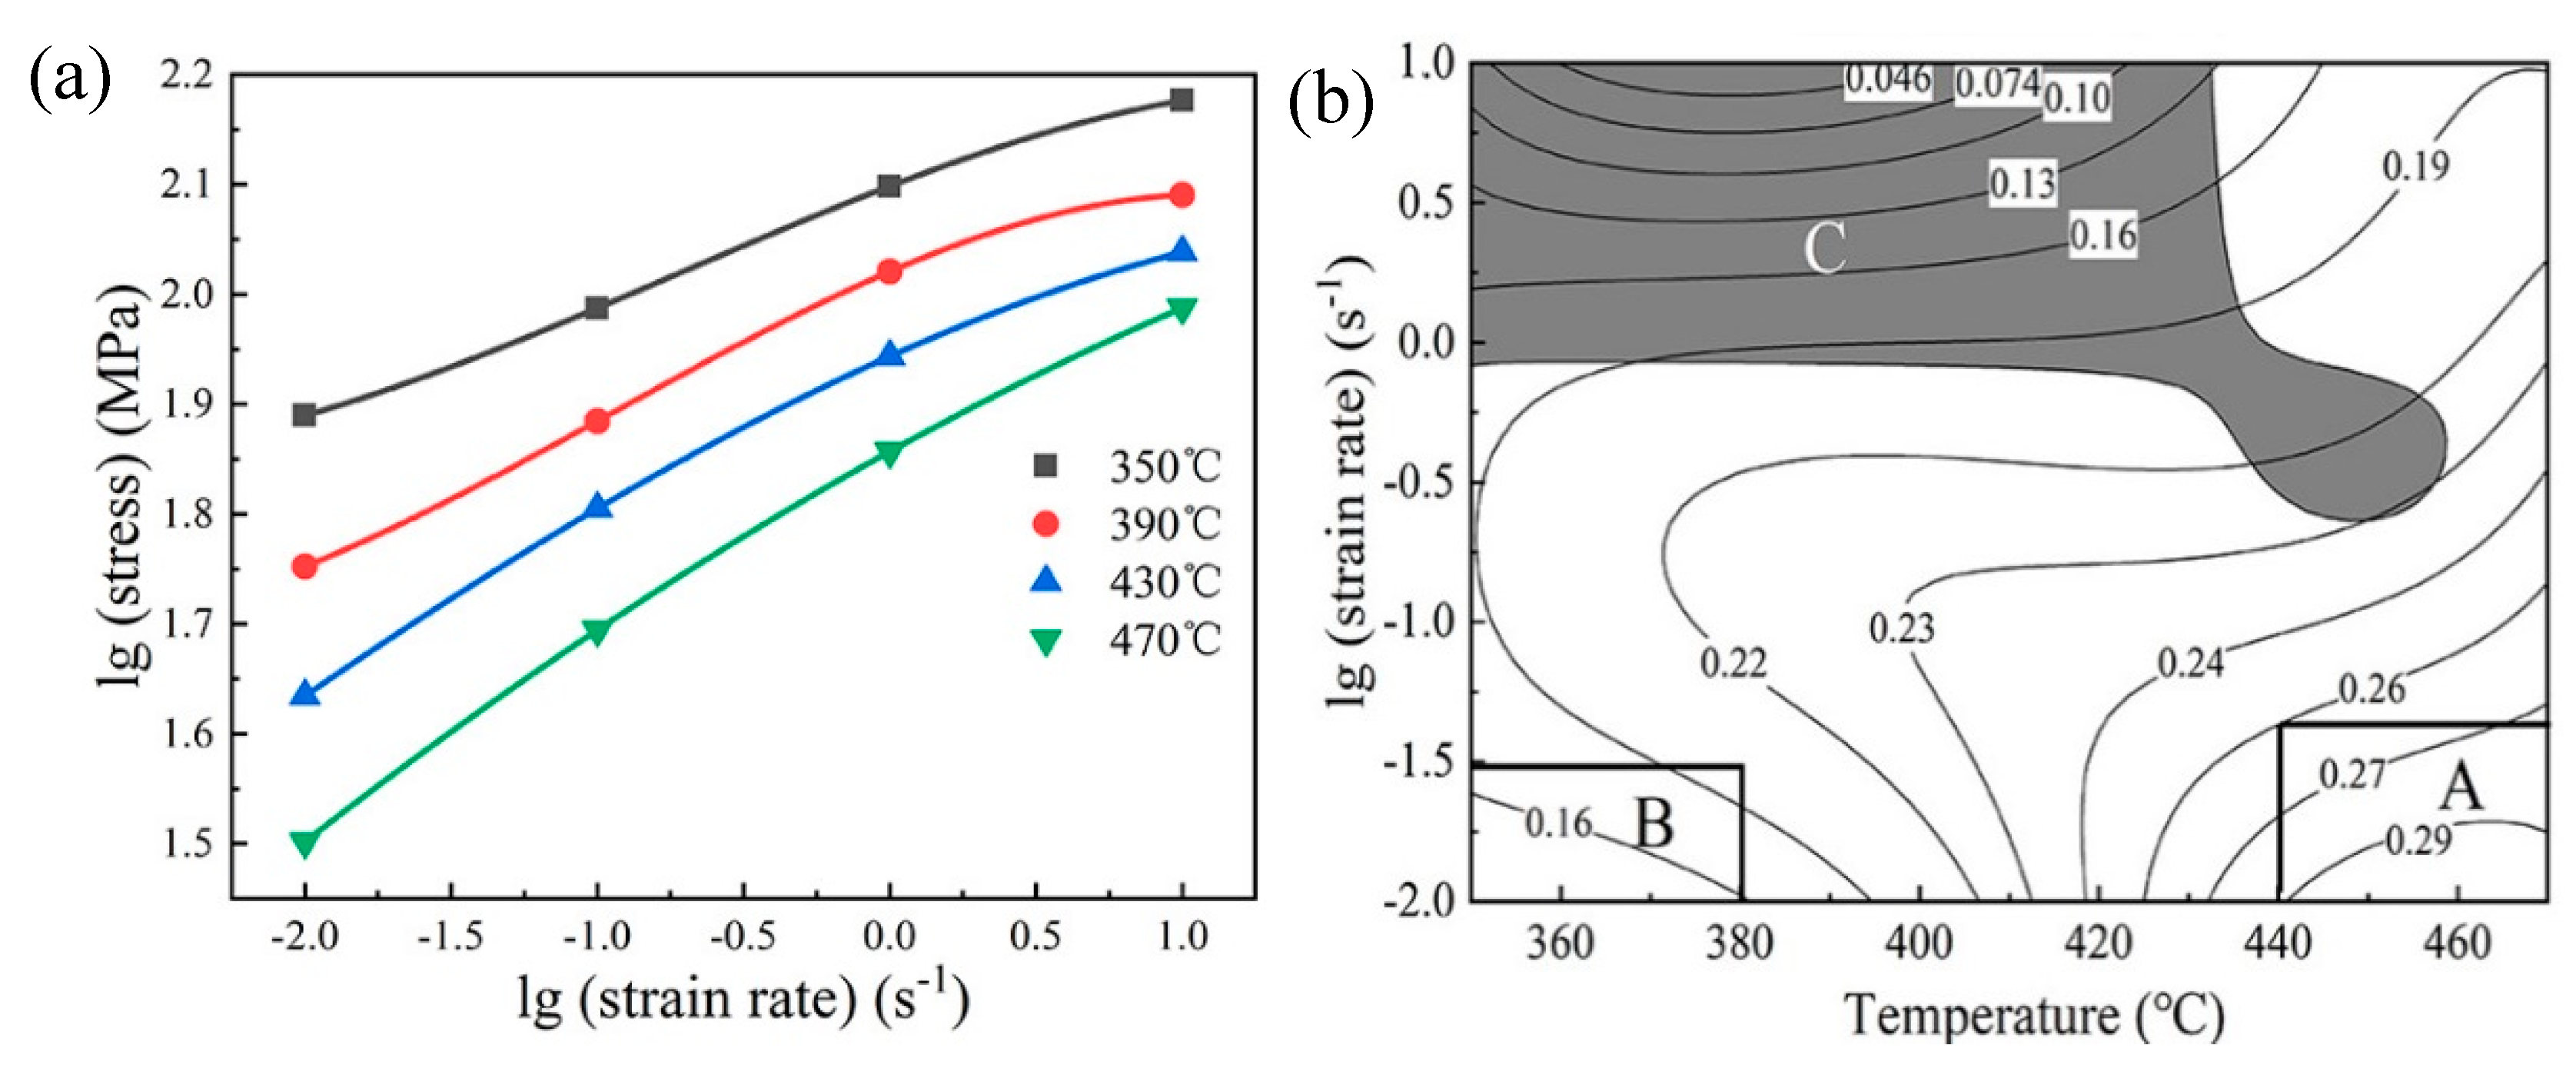
Hot processing maps can be generated to determine the appropriate process domains for hot working. The values of lg (true stress) versus lg (strain rate) in a compression temperature range between 350 °C and 470 °C are presented in
Figure 6a, which are fitted by a cubic spline function. The values of power dissipation (η) are calculated as a function of temperature and strain rate, which are shown as contour lines in
Figure 6b and can be used to assess the relationship between power dissipation capacity and microstructural evolution of materials [
5]. A dimensionless parameter ξ is also introduced to identify the dependence of flow instability on the temperature and strain rate, and the shaded area in the processing map indicates the unstable domain (ξ < 0,
Figure 6b).
If a material is deformed within the unstable window, the material is easy to form undesirable microstructures such as adiabatic shear band and intergranular cracking. Therefore, these instability domains (ξ < 0) should be avoided when selecting proper parameters for hot working [
21,
22], while the high power dissipation areas are usually an appropriate processing zone. Based on the processing map, it can be figured out that the optimum process window for this Al-Cu-Li-Mg-Ag alloy locates in the domain at a temperature between 440 °C and 470 °C, and a strain rate between 0.01 s
−1 and 0.03 s
−1. The instable domain is mainly in the window at a temperature range between 350 °C and 430 °C, and a strain rate between 1 s
−1 and 10 s
−1, which is larger than the aluminum alloy 2060 reported, due to greater strains applied in this work [
15].
For an accuracy evaluation of processing parameters, the processing map alone is not enough, due to the prediction error of the dynamic materials model [
23]. The processing map, composed of power dissipation efficiency and instability domains, connects the microstructure change and the deformation conditions [
24,
25]. Therefore, microstructure observations are also needed for the purpose of deciding the optimal hot working conditions. Therefore, the microstructures of samples compressed in different domains of the processing map, i.e., the safe domains with high power dissipation (domain A) and low power dissipation (domain B), and unstable domain (domain C) (
Figure 6b), will be discussed. The deformation mechanisms will be discussed accordingly.
3.5. Microstructure Evolution
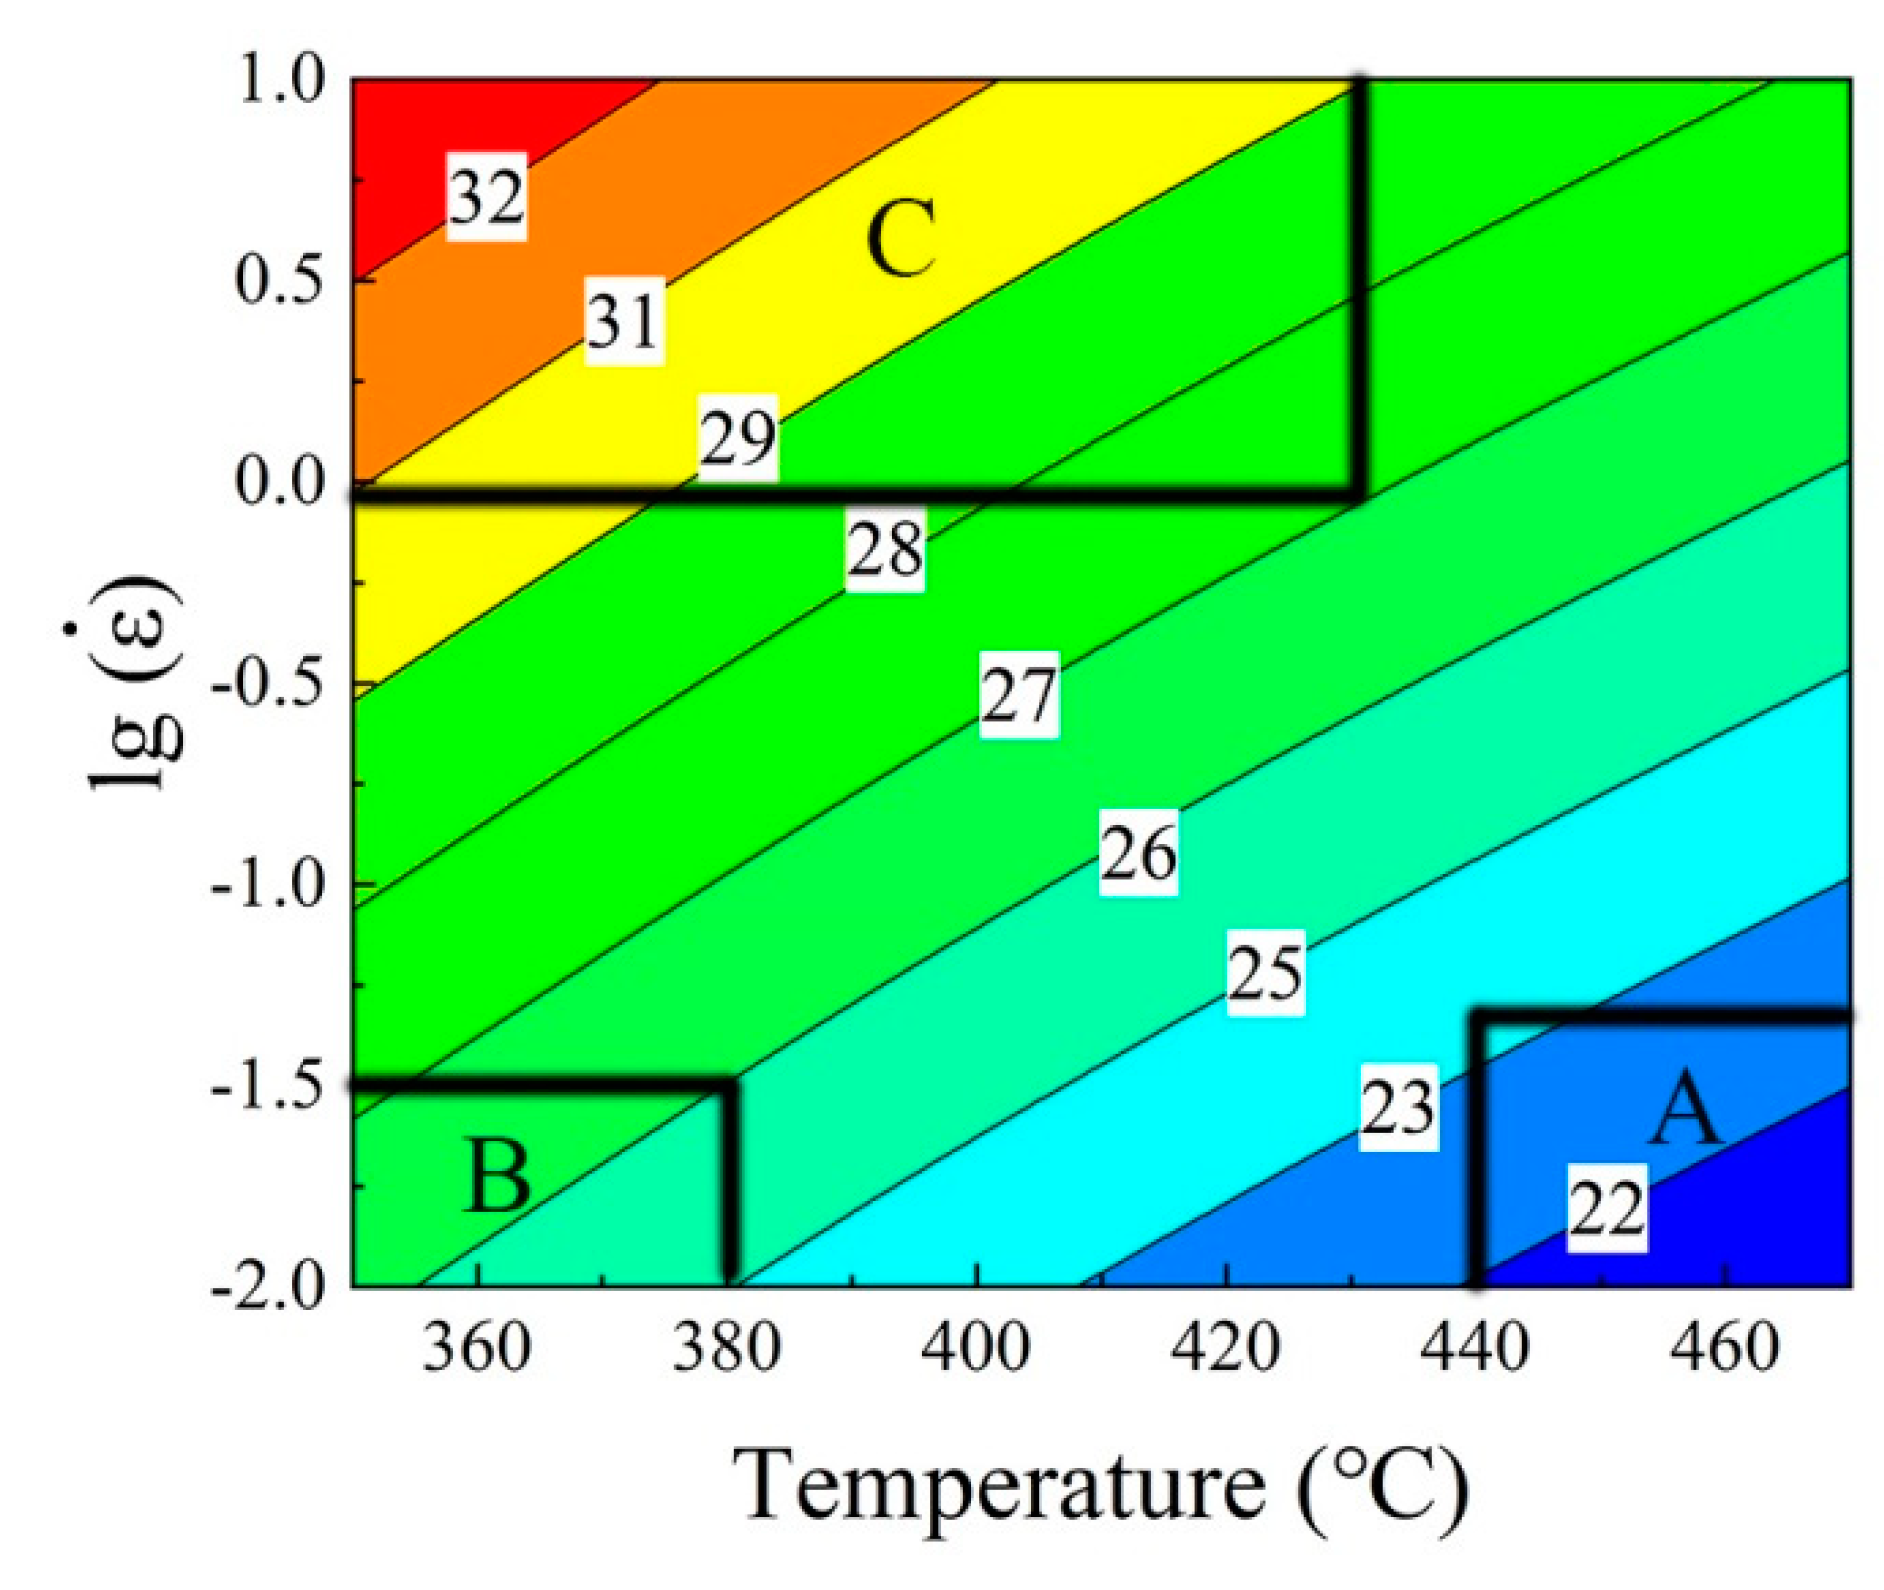
Figure 7 shows the Zener–Hollomon parameter of the Al-Cu-Li-Mg-Ag alloy deformed at different deformation conditions with a true strain of 0.8. It is obvious that the value of lnZ decreases with the increase of temperature and decrease of strain rate. The highest lnZ is obtained at the area with large strain rates (unstable domain C). The medium values of lnZ (around 25–27) locates at domain B, where both strain rates and deformation temperature are low. The lowest value of lnZ (about 22) locates in domain A, where the deformation temperature is high and the strain rate is low. The influence of deformation temperature and strain rates on microstructure changes will be discussed in the next section.
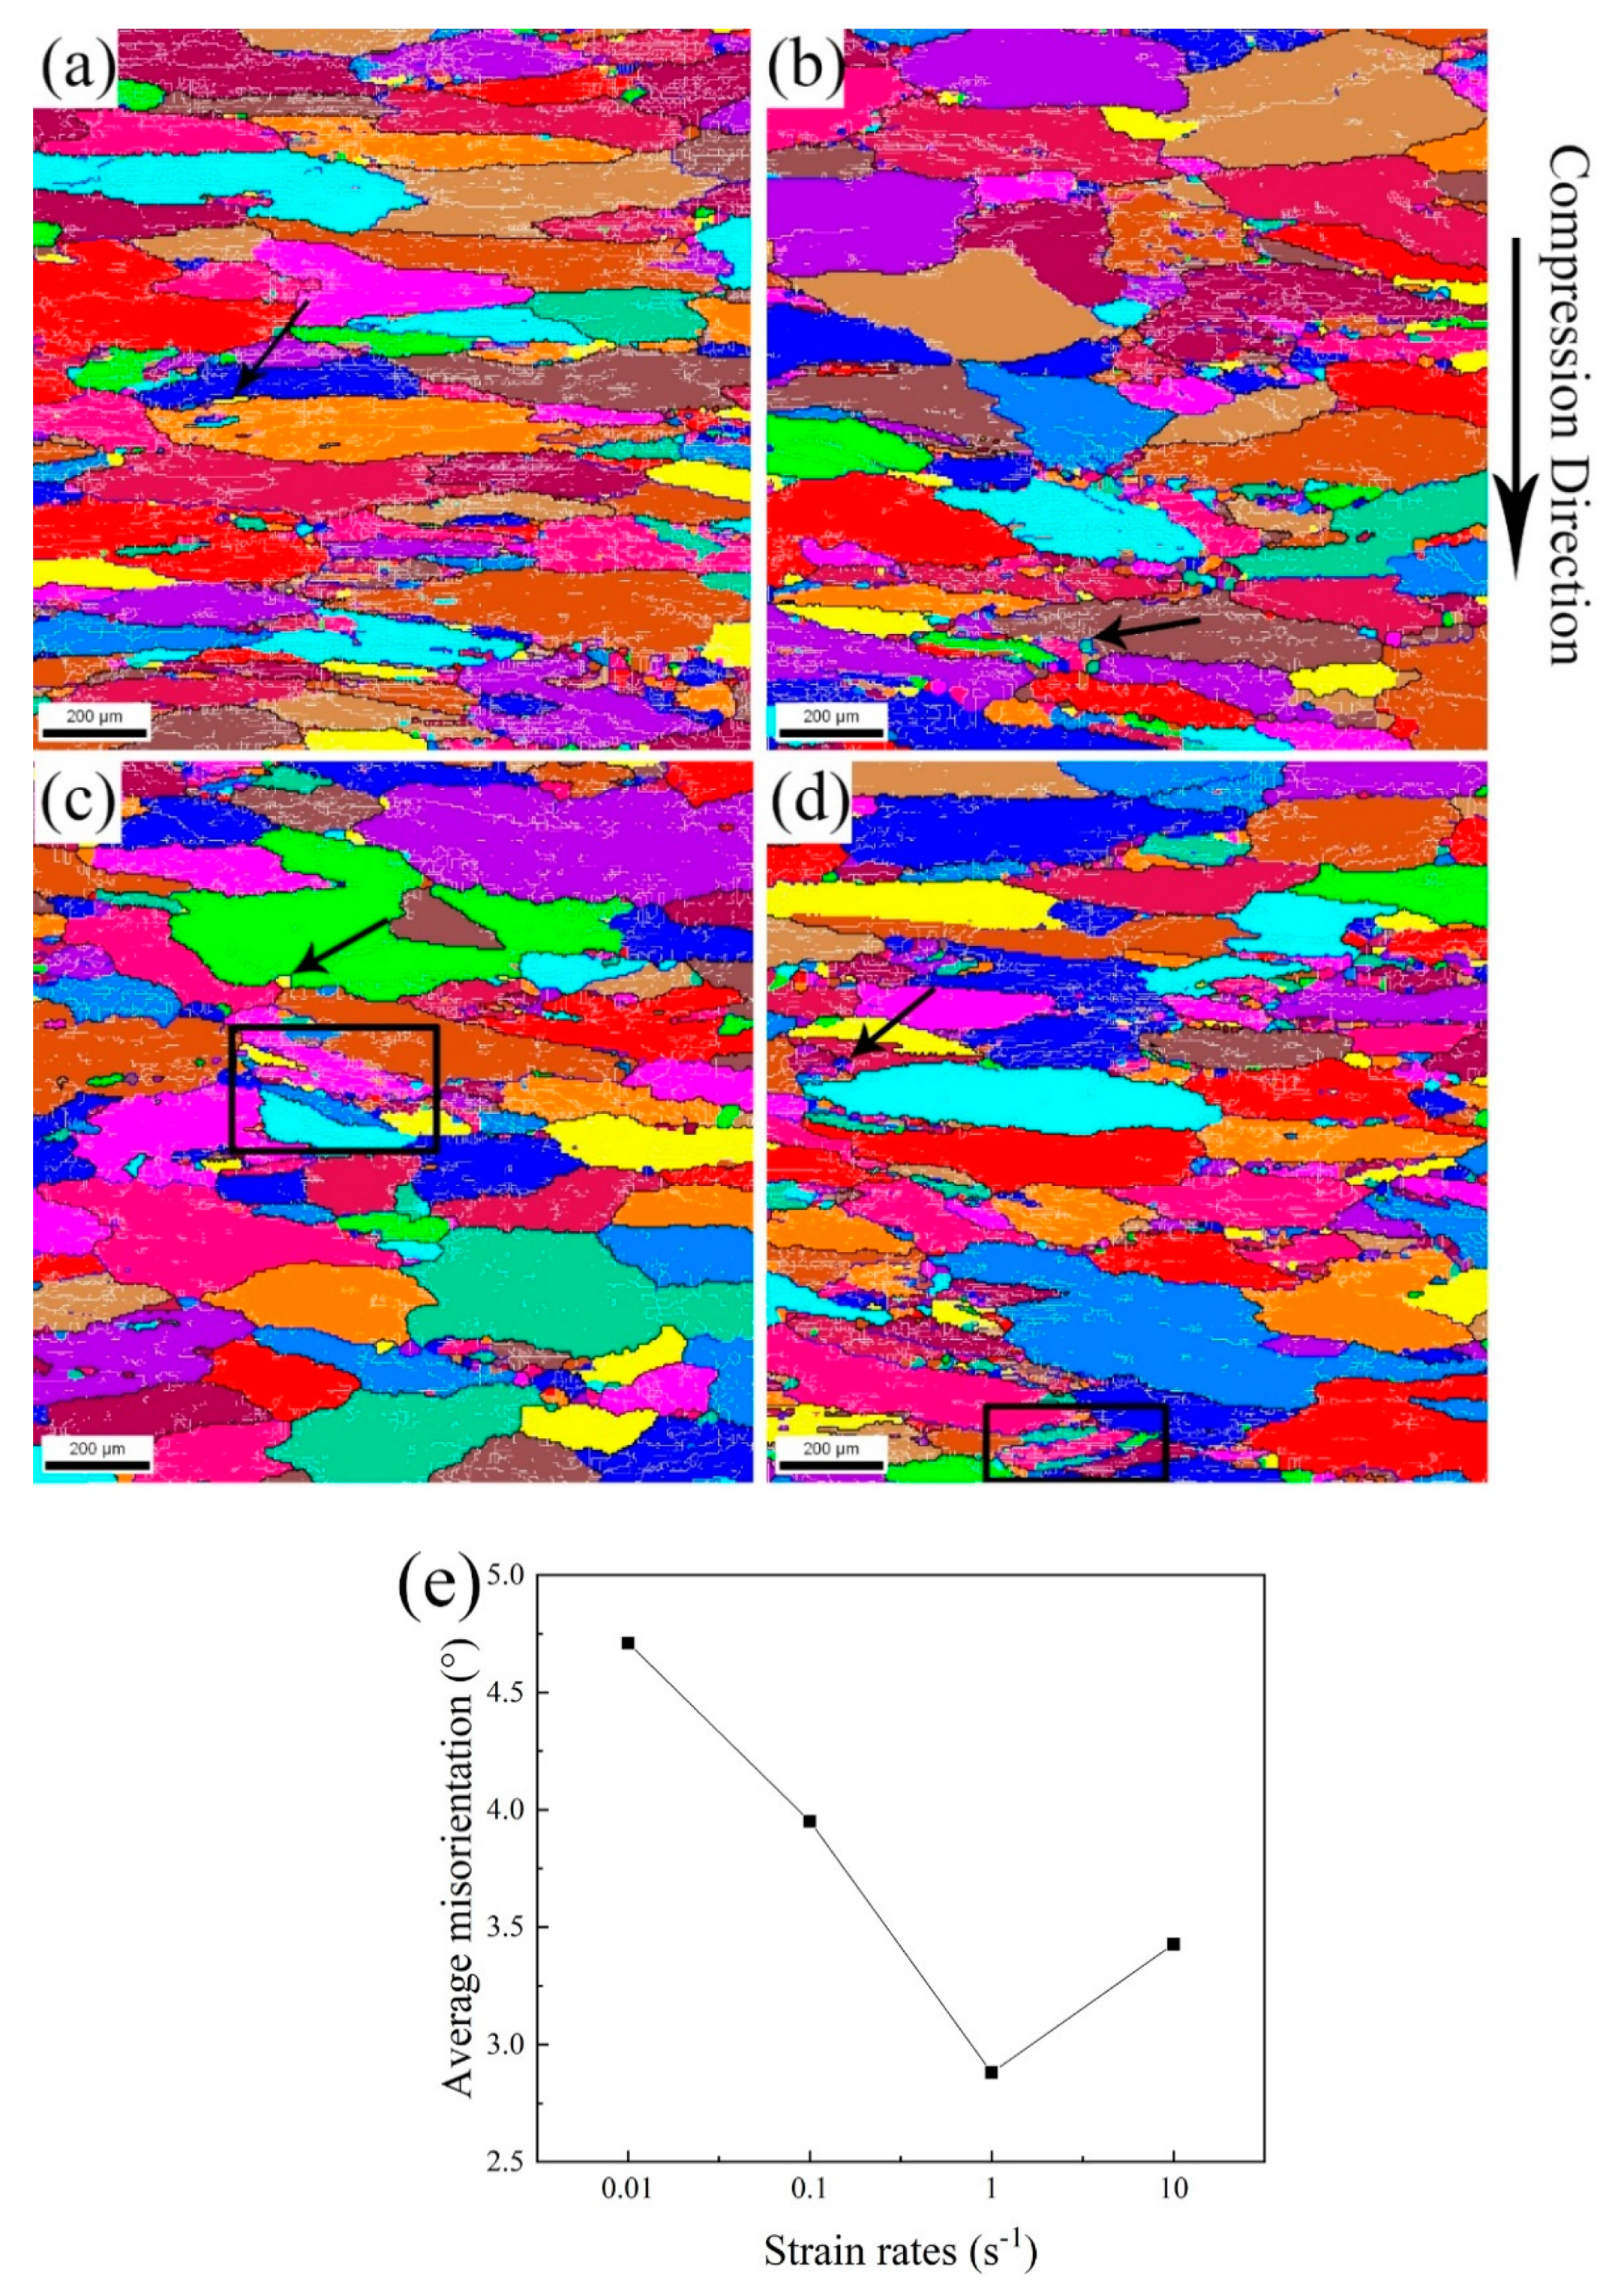
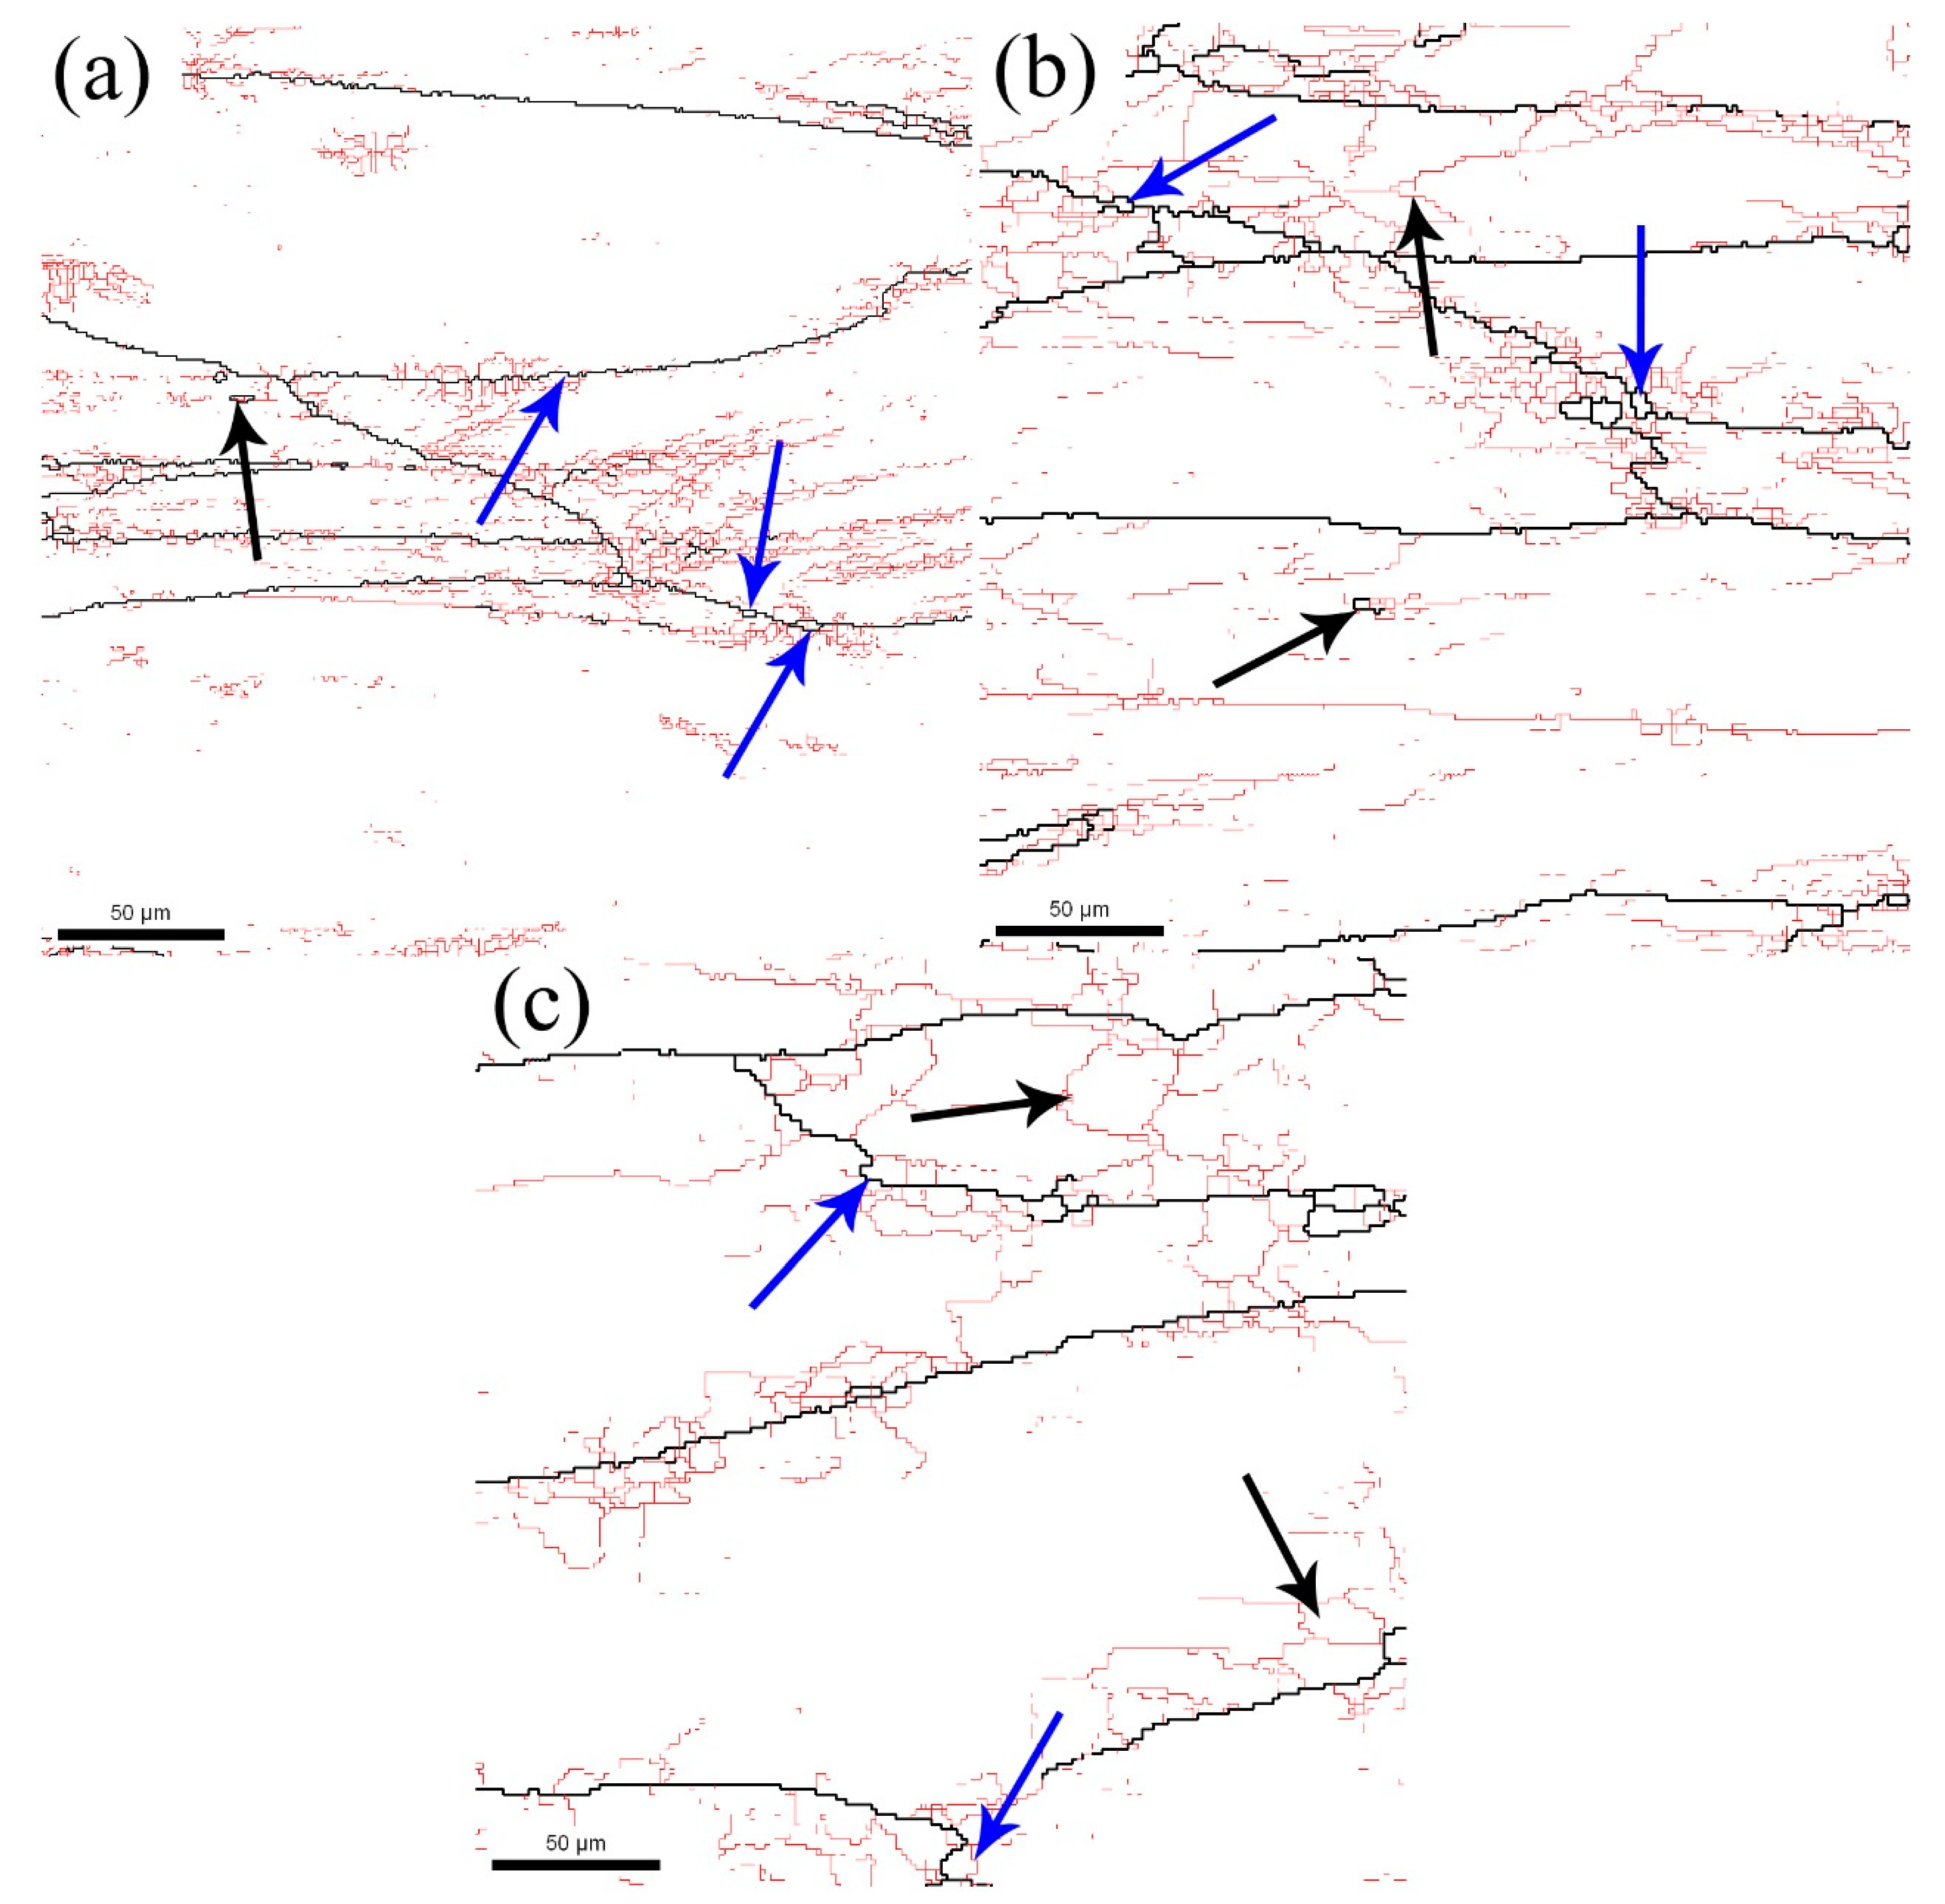
3.5.1. Effect of Strain Rates
Figure 8 illustrates the effect of strain rate on the microstructure change of the studied Al-Cu-Li-Mg-Ag alloy deformed at 350 °C. The microstructures show typical deformed and recovered structure, i.e., the grains elongate perpendicularly to the compression direction, and many sub-grain boundaries are formed inside the grains. Some recrystallized grains (marked by a black arrow in
Figure 8a,b) are observed at lower strain rate (domain A). Adiabatic shear bands, distributed around 45° away from the compression direction as indicated by black rectangles in
Figure 8c,d, are observed at higher strain rates (domain C with higher Z value). In this case, severe deformation heat resulted from high strain rates transfer inadequately within limited deformation time, which results in local flow of materials along the plane of the highest shear stress [
24,
25]. Cracks are expected to generate for the relief of local stress concentrations, thus deformation parameters within domain C are not desirable.
The average misorientation between grains can also be calculated on the basis of EBSD technique. As shown in
Figure 8e, the average misorientation decreases firstly with increasing strain rate until strain rates reach 1 s
−1, and then increases. Deformation at lower strain rates generally implies that there is adequate time for the dislocation movement, which is evidenced by the massive sub-grain boundaries detected in the grain interior (white lines with misorientation lower than 15° in
Figure 8a–c). At higher strain rates (strain rates ≥1 s
−1), the adiabatic heating may also be induced, which offers more energy for boundary migration. Thus, the average misorientation values show a non-linear dependence of strain rates.
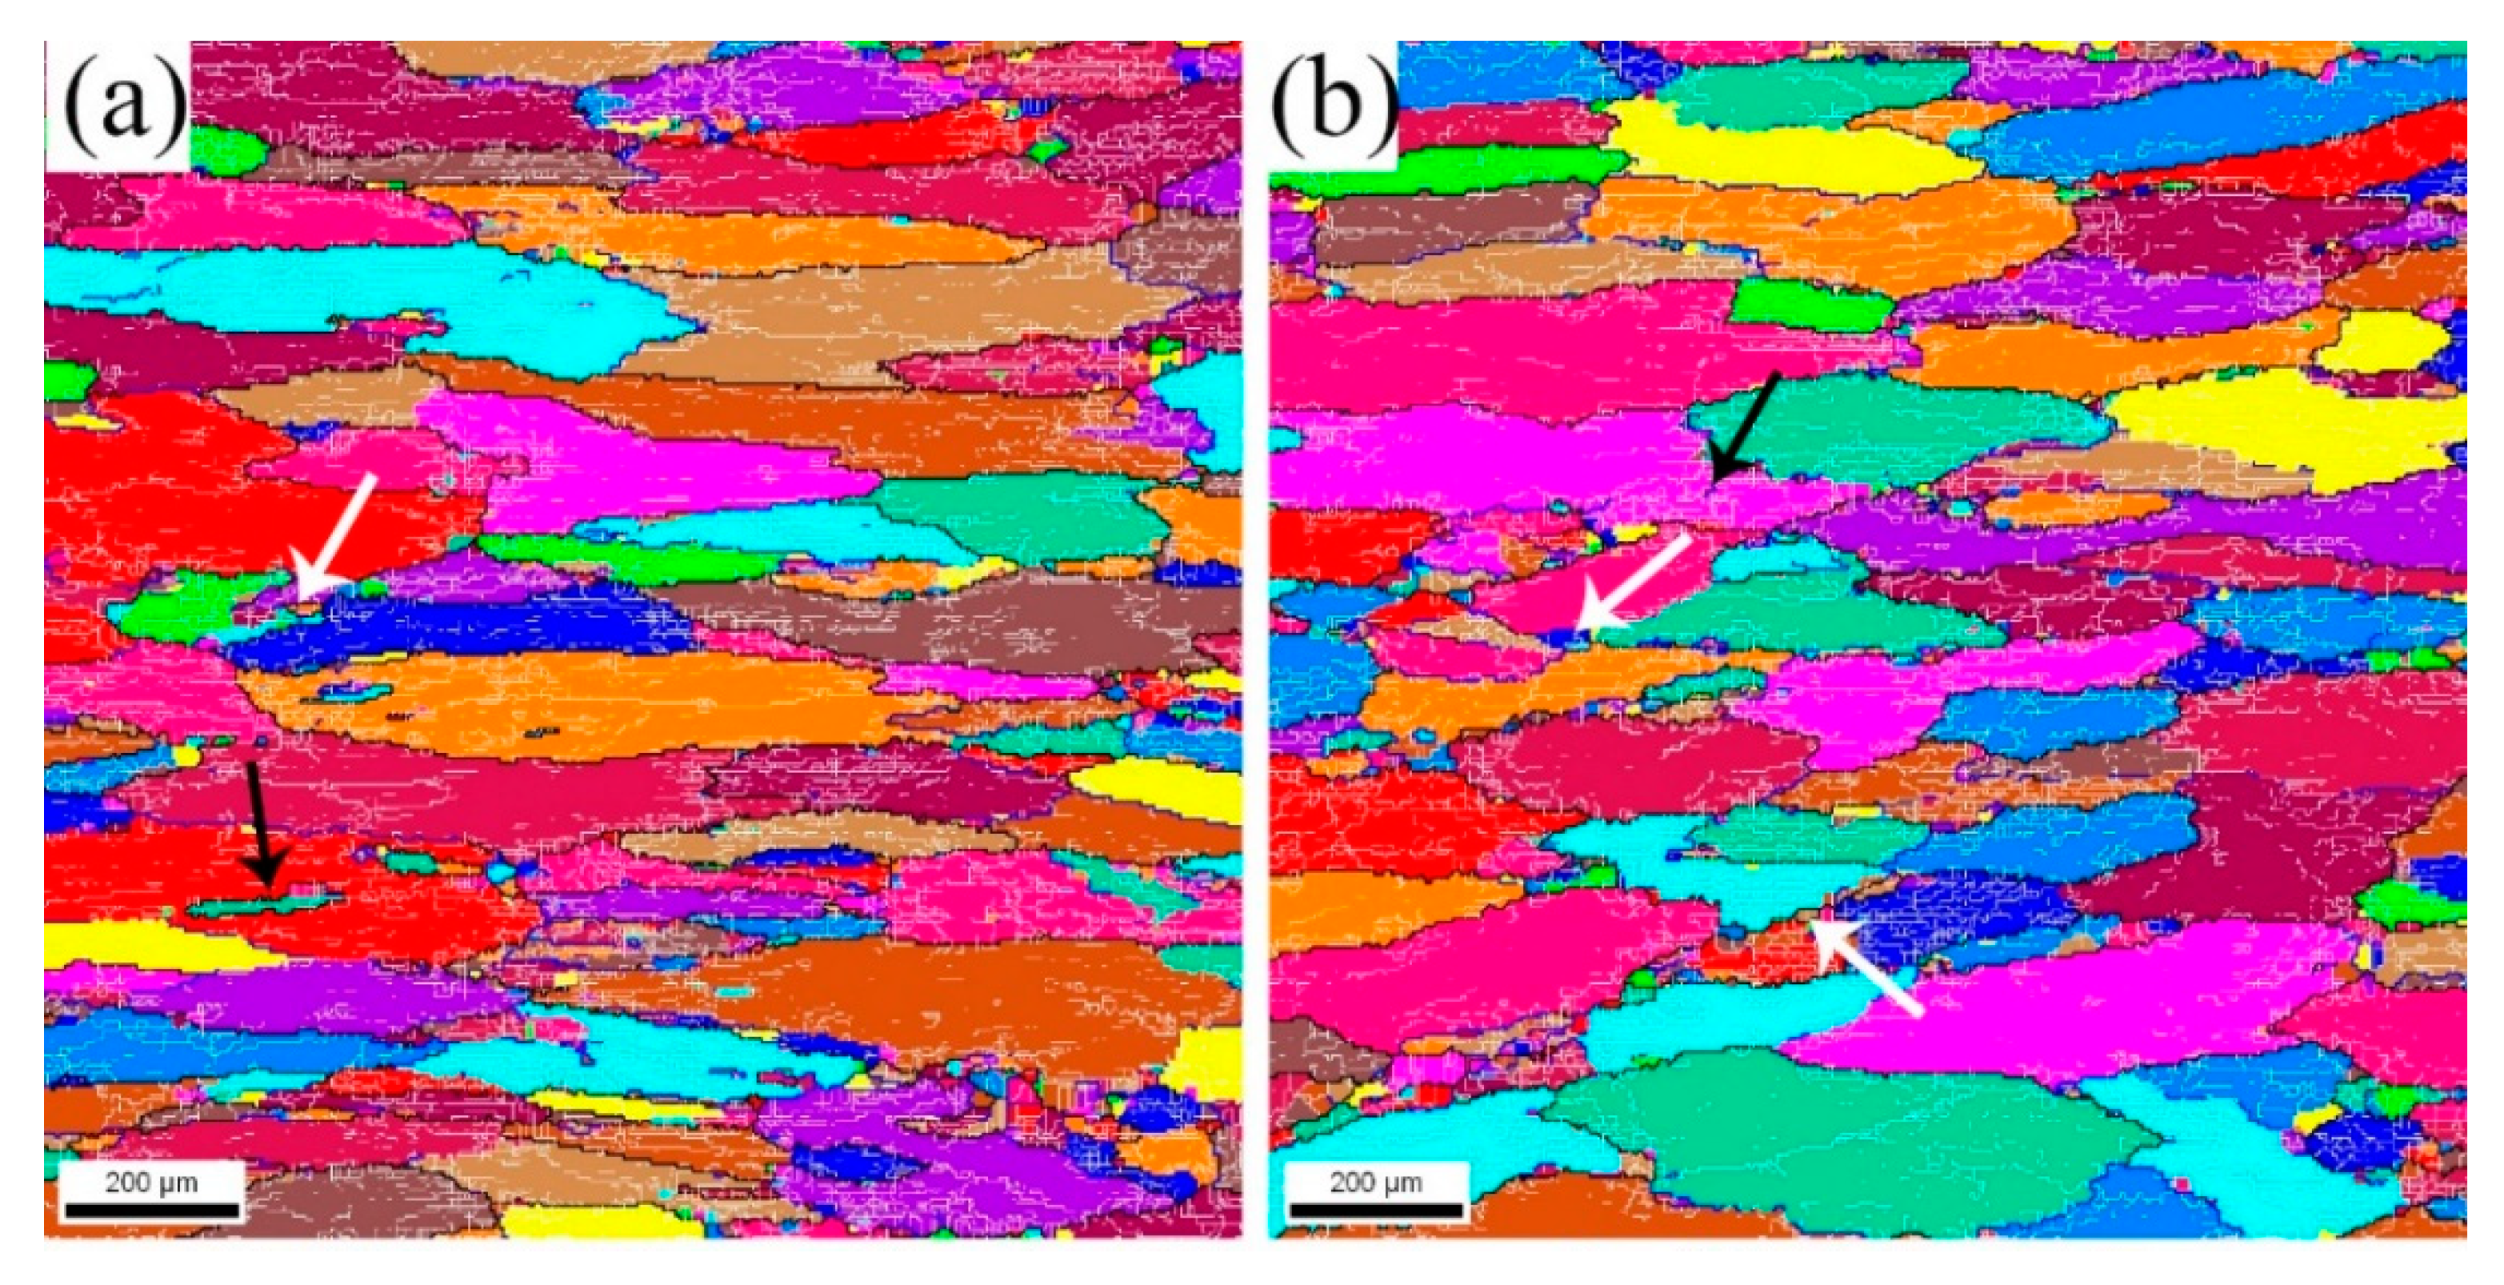
3.5.2. Effect of Deformation Temperature
Deformation temperature, another factor of Zener–Hollomon parameter Z, has an important influence on the change of microstructures as well.
Figure 9 shows the EBSD morphology of the Al-Cu-Li-Mg-Ag alloy deformed at 0.01 s
−1 and various temperatures. When the sample is deformed at low temperature (350 °C, lnZ = 26.1), dislocation tangling is readily generated, and then dislocation walls develop in the grain interior [
5]. So, the microstructure features deformed structures (flat grains) and sub-grains within the grain, as shows in
Figure 9a. With increasing temperature, the migration rate of dislocations is enhanced. When the deformation temperature increases to 470 °C (lnZ = 21.1), the improvement of grain boundary mobility promotes the nuclei and growth of recrystallized grains around the original grain boundaries. In addition, dislocation climbs are also enhanced at elevated temperatures, which promote the formation of sub-grain boundaries. Consequently, more recrystallized grains and sub-grains (indicated by white arrows) at the grain boundary and grain interiors (indicated by black arrows) are found than in other lower temperatures (
Figure 9a–d). The degree of recrystallization and LAGB% increase with increasing temperature in
Figure 9e,f. The fraction of DRX is low regardless of the deformation temperature, which is consistent with the results of Ling [
15], which state that the dynamic recovery is the main reason for dynamic softening.
3.5.3. Recrystallization Mechanism
Based on the processing map (
Figure 6b) three representative domains identified by the value of lnZ are chosen to investigate the recrystallization mechanism. Domains A and B are optimum processing regions (A is the highest and B is the lowest value of power dissipation) while domain C is all areas within the unstable domain boundary.
Figure 10 illustrates the EBSD morphology of the alloy deformed in different domains: unstable domain C (
Figure 10a,b), low power dissipation domain B (
Figure 10c), and high power dissipation domain A (
Figure 10d). As known to us, the continuous dynamic recrystallization (CDRX) is an important dynamic recrystallization mechanism for high stacking fault energy materials during thermo-mechanical processing. A characteristic of CDRX is the increase of average misorientation angle with the increasing strain [
26]. The point-to-origin (cumulative) misorientation is obtained from
Figure 10a–d in the grain with similar orientation and shown in
Figure 10e. An obvious increase of misorientation gradient is observed inside the grains. Misorientation to the initial grain boundary higher than 15° is observed in all samples, which is strong evidence for CDRX. The fraction of CDRX can be evaluated by the fraction of misorientation angles between 10° and 15° [
26,
27,
28,
29].
Figure 10f shows the fraction of misorientation angle between 10° and 15° in the four samples, which significant increases compared to the original sample and decreases with decreasing lnZ, suggesting the fraction of CDRX decreases with decreasing lnZ.
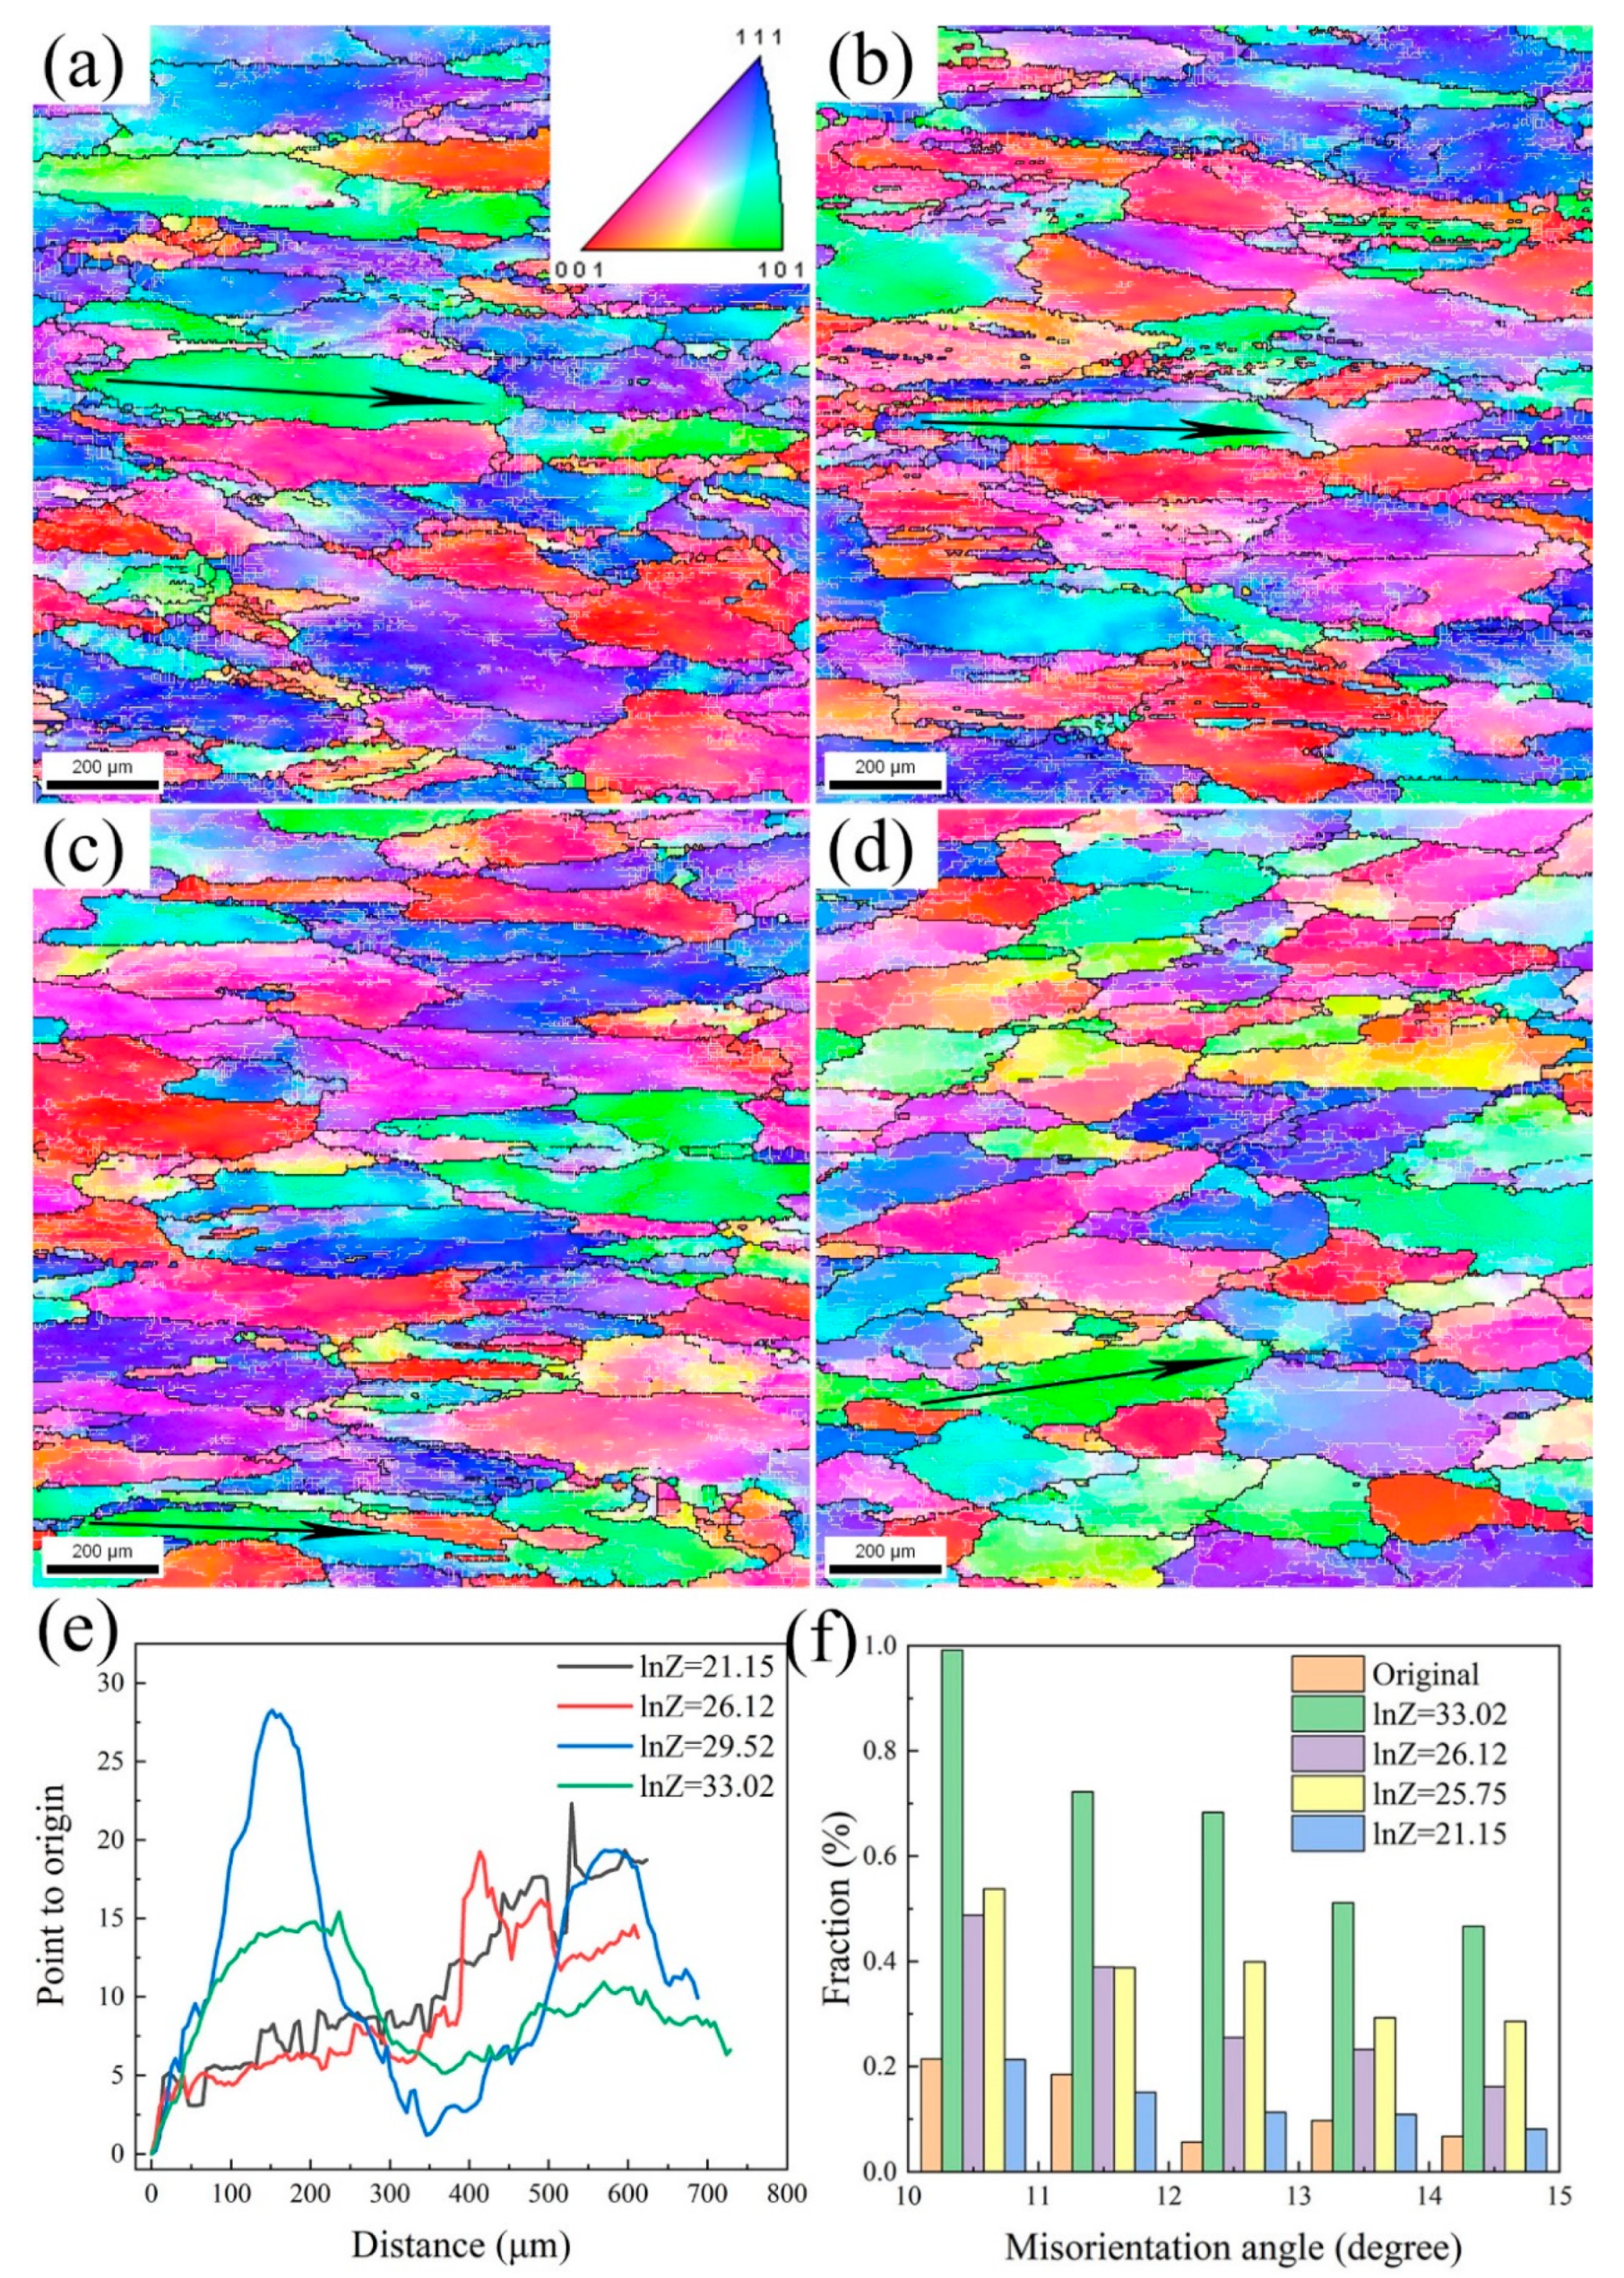
Another representative dynamic recrystallization mechanism is discontinuous dynamic recrystallization (DDRX). Grain boundary bulging (BLG), which shows a bow out of grain boundary, is a typical nucleation mechanism of DDRX [
30]. The grains with BLG feature, marked by blue arrows, are observed in different deformation conditions, together with the CDRX featured grains indicated by black arrows in
Figure 11. The number of grains with BLG features increases with the decreasing of lnZ. Lower values of lnZ usually occur at higher deformation temperatures or lower strain rates, in which case the sub-grain size increases and the dislocation density decreases. Therefore, it can be deduced that the main recrystallization mechanism is gradually transformed from CDRX to DDRX with the decreasing value of lnZ.
Quite a few insoluble constituent particles exist in the Al alloys after homogenization treatments. Most of these insoluble particles are crushed by external force during hot processing and distributed along the processing direction [
31]. These particles have a complicated effect on the microstructure evolution during hot processing. On one side, these particles may promote the recrystallization by particle stimulated nucleation. On the other hand, they may inhibit recrystallization by hindering the motion of the grain boundary. The influence of hot deformation parameters on the constituent particles is important and should have significant influence on the microstructure evolution during hot deformation, and should be clarified in the future.
4. Conclusions
In this work, an Al-Cu-Li-Mg-Ag alloy was deformed in a temperature range of 350–470 °C and a strain rate range of 0.01–10 s−1. The flow behavior and microstructure evolution were carefully studied. The conclusions are presented below.
- (1)
A constitutive equation was developed based on the experimental true stress–strain curves, and for the alloy deformed at a strain of 0.8 it was expressed as
- (2)
The hot processing map was established and the optimum process window was located in the domain with a temperature between 440 °C and 470 °C, and a strain rate between 0.01 s−1 and 0.03 s−1.
- (3)
Dynamic recovery was the main softening mechanism for the experimental alloy. Dynamic recrystallization was also observed, and CDRX was the main recrystallization mechanism at higher lnZ while DDRX was the main recrystallization mechanism at lower lnZ.
Author Contributions
X.W. and L.C. formulated the experimental design; B.L. and C.L. carried out the Gleeble tests and the microstructure characterization; B.L. analyzed the experimental data and wrote the original draft; X.W. and N.C. discussed the results and made the revisions; L.C. and G.H. applied for the financial support. All authors have read and agreed to the published version of the manuscript.
Funding
The authors acknowledge the financial support by the National Natural Science Foundation of China (51871033, 51421001); the National Defense Basic Scientific Research Program; Key Research and Development Program of China (2016YFB0700403); Venture & Innovation Support Program for Chongqing Overseas Returnees (cx2018002); the Fundamental Research Funds for the Central Universities (2020CDJDCL001); the Open Funding of International Joint Laboratory for Light Alloys (MOE), Chongqing University. X.W. thanks the support of the “111” Project (B16007) by the Ministry of Education and the State Administration of Foreign Experts Affairs of China.
Conflicts of Interest
The authors declare no conflict of interest.
References
- Alexopoulos, N.D.; Migklis, E.; Stylianos, A.; Myriounis, D.P. Fatigue behavior of the aeronautical Al–Li (2198) aluminum alloy under constant amplitude loading. Int. J. Fatigue 2013, 56, 95–105. [Google Scholar] [CrossRef]
- Li, B.; Pan, Q.; Yin, Z. Characterization of hot deformation behavior of as-homogenized Al–Cu–Li–Sc–Zr alloy using processing maps. Mater. Sci. Eng. A 2014, 614, 199–206. [Google Scholar] [CrossRef]
- Yu, X.X.; Zhang, Y.R.; Yin, D.F.; Yu, Z.M.; Li, S.F. Characterization of hot deformation behavior of a novel Al–Cu–Li alloy using processing maps. Acta Metall. Sin. 2015, 28, 817–825. [Google Scholar] [CrossRef]
- Rioja, R.J.; Liu, J. The evolution of Al-Li base products for aerospace and space applications. Metall. Mater Trans A 2012, 43, 3325–3337. [Google Scholar] [CrossRef]
- Liao, B.; Cao, L.F.; Wu, X.D.; Zou, Y.; Huang, G.J.; Rometsch, P.A.; Couper, M.J.; Liu, Q. Effect of heat treatment condition on the flow behavior and recrystallization mechanisms of aluminum alloy 7055. Materials 2019, 12, 311. [Google Scholar] [CrossRef] [Green Version]
- Zheng, X.; Luo, P.; Chu, Z.; Xu, J.; Wang, F. Plastic flow behavior and microstructure characteristics of light-weight 2060 Al-Li alloy. Mater. Sci. Eng. A 2018, 736, 465–471. [Google Scholar] [CrossRef]
- Yu, W.; Li, H.; Du, R.; You, W.; Zhao, M.; Wang, Z.A. Characteristic constitution model and microstructure of an Al–3.5Cu–1.5Li alloy subjected to thermal deformation. Mater. Charact. 2018, 145, 53–64. [Google Scholar] [CrossRef]
- Zhao, Q.; Chen, W.; Lin, J.; Huang, S.S.; Xia, X.S. Hot deformation behavior of 7A04 aluminum alloy at elevated temperature: Constitutive modeling and verification. Int. J. Mater. Form. 2019, 13, 293–302. [Google Scholar]
- Chen, L.; Zhao, G.; Yu, J.; Zhang, W. Constitutive analysis of homogenized 7005 aluminum alloy at evaluated temperature for extrusion process. Mater. Des. 2015, 66, 129–136. [Google Scholar] [CrossRef]
- Li, J.; Li, F.; Cai, J.; Wang, R.; Yuan, Z.; Xue, F. Flow behavior modeling of the 7050 aluminum alloy at elevated temperatures considering the compensation of strain. Mater. Des. 2012, 42, 369–377. [Google Scholar] [CrossRef]
- Liu, Y.; Geng, C.; Lin, Q.; Xiao, Y.; Xu, J.; Kang, W. Study on hot deformation behavior and intrinsic workability of 6063 aluminum alloys using 3D processing map. J. Alloys Compd. 2017, 713, 212–221. [Google Scholar] [CrossRef]
- Yin, H.; Li, H.; Su, X.; Huang, D. Processing maps and microstructural evolution of isothermal compressed Al–Cu–Li alloy. Mater. Sci. Eng. A 2013, 586, 115–122. [Google Scholar] [CrossRef]
- Shen, B.; Deng, L.; Wang, X. A new dynamic recrystallisation model of an extruded Al–Cu–Li alloy during high-temperature deformation. Mater. Sci. Eng. A 2015, 625, 288–295. [Google Scholar] [CrossRef]
- Nayan, N.; Murty, S.V.S.N.; Chhangani, S.; Prakash, A.; Prasad, M.J.N.V.; Samajdar, I. Effect of temperature and strain rate on hot deformation behavior and microstructure of Al–Cu–Li alloy. J. Alloys Compd. 2017, 723, 548–558. [Google Scholar] [CrossRef]
- Ou, L.; Zheng, Z.; Nie, Y.; Jian, H. Hot deformation behavior of 2060 alloy. J. Alloys Compd. 2015, 648, 681–689. [Google Scholar] [CrossRef]
- Zhang, C.S.; Wang, C.X.; Guo, R.; Zhao, G.Q.; Chen, L.; Sun, W.C.; Wang, X.B. Investigation of dynamic recrystallization and modelling of microstructure evolution of an Al–Mg–Si aluminum alloy during high-temperature deformation. J. Alloys Compd. 2019, 773, 59–70. [Google Scholar] [CrossRef]
- Zhao, J.; Deng, Y.; Tang, J.; Zhang, J. Influence of strain rate on hot deformation behavior and recrystallization behavior under isothermal compression of Al–Zn–Mg–Cu alloy. J. Alloys Compd. 2019, 809, 151788. [Google Scholar] [CrossRef]
- Liu, L.; Wu, Y.; Gong, H.; Dong, F.; Ahmad, A.S. Modified kinetic model for describing continuous dynamic recrystallization behavior of Al 2219 alloy during hot deformation process. J. Alloys Compd. 2020, 817, 153301. [Google Scholar] [CrossRef]
- Liu, S.H.; Pan, Q.L.; Li, H.; Huang, Z.Q.; Li, K.; He, X.; Li, X.Y. Characterization of hot deformation behavior and constitutive modelling of Al–Mg–Si–Mn–Cr alloy. J. Mater. Sci. 2019, 54, 4366–4383. [Google Scholar] [CrossRef]
- Xiang, Y.; Xiao, S.; Tang, Z.; Zhou, Y. The flow behavior of homogenizated Al-Mg-Si-La aluminum alloy during hot deformation. Mater. Res. Express 2019, 6, 066563. [Google Scholar] [CrossRef]
- Wang, Y.; Zhao, G.; Xu, X.; Chen, X.; Zhang, C. Constitutive modeling, processing map establishment and microstructure analysis of spray deposited Al-Cu-Li alloy 2195. J. Alloys Compd. 2019, 779, 735–751. [Google Scholar] [CrossRef]
- Hu, H.E.; Wang, X.Y.; Deng, L. High temperature deformation behavior and optimal hot processing parameters of Al–Si eutectic alloy. Mater. Sci. Eng. A 2013, 576, 45–51. [Google Scholar] [CrossRef]
- Jenab, A.; Karimi Taheri, A. Experimental investigation of the hot deformation behavior of AA7075: Development and comparison of flow localization parameter and dynamic material model processing maps. Int. J. Mech. Sci. 2014, 78, 97–105. [Google Scholar] [CrossRef]
- Zhang, F.; Sun, J.L.; Shen, J.; Yan, X.D.; Chen, J. Flow behavior and processing maps of 2099 alloy. Mater. Sci. Eng. A 2014, 613, 141–147. [Google Scholar] [CrossRef]
- Kai, X.; Chen, C.; Sun, X.; Wang, C.; Zhao, Y. Hot deformation behavior and optimization of processing parameters of a typical high-strength Al–Mg–Si alloy. Mater. Des. 2016, 90, 1151–1158. [Google Scholar] [CrossRef]
- Huang, K.; Logé, R.E. A review of dynamic recrystallization phenomena in metallic materials. Mater. Des. 2016, 111, 548–574. [Google Scholar] [CrossRef]
- Chamanfar, A.; Alamoudi, T.M.; Nanninga, E.N.; Misiolek, Z.W. Analysis of flow stress and microstructure during hot compression of 6099 aluminum alloy (AA6099). Mater. Sci. Eng. A 2019, 743, 684–696. [Google Scholar] [CrossRef]
- Mandal, S.; Bhaduri, A.K.; Sarma, V.S. A study on microstructural evolution and dynamic recrystallization during isothermal deformation of a Ti-modified austenitic stainless steel. Metall. Mater. Trans. A 2010, 42, 1062–1072. [Google Scholar] [CrossRef]
- Liao, B.; Wu, X.D.; Cao, L.F.; Huang, G.J.; Wang, Z.A.; Liu, Q. The microstructural evolution of aluminum alloy 7055 manufactured by hot thermo-mechanical process. J. Alloys Compd. 2019, 796, 103–110. [Google Scholar] [CrossRef]
- Shimizu, I. Theories and applicability of grain size piezometers: The role of dynamic recrystallization mechanisms. J. Struct. Geol. 2008, 30, 899–917. [Google Scholar] [CrossRef]
- Mcqueen, H.J.; Spigarelli, S.; Kastner, M.E.; Evangelista, E. Hot Deformation and Processing of Aluminum Alloys; CRC Press: Boca Raton, FL, USA, 2011. [Google Scholar]
© 2020 by the authors. Licensee MDPI, Basel, Switzerland. This article is an open access article distributed under the terms and conditions of the Creative Commons Attribution (CC BY) license (http://creativecommons.org/licenses/by/4.0/).

 ,
, 


