Article

Analysis of the Crack Initiation and Growth in Crystalline Materials Using Discrete Dislocations and the Modified Kitagawa–Takahashi Diagram

1
Technical Data Analysis, Falls Church, VA 22046, USA
2
Department of Applied Mechanics, Indian Institute of Technology-Madras, Chennai 600036, India
3
School for Engineering of Matter, Transport, and Energy, Arizona State University, 501 Tyler Mall, Tempe, AZ 85287, USA
*
Author to whom correspondence should be addressed.
Crystals 2020, 10(5), 358; https://doi.org/10.3390/cryst10050358
Submission received: 19 March 2020 / Revised: 23 April 2020 / Accepted: 26 April 2020 / Published: 1 May 2020
(This article belongs to the Special Issue Crystal Plasticity at Micro- and Nano-scale Dimensions)

Abstract

:
Crack growth kinetics in crystalline materials is examined both from the point of continuum mechanics and discrete dislocation dynamics. Kinetics ranging from the Griffith crack to continuous elastic-plastic cracks are analyzed. Initiation and propagation of incipient cracks require very high stresses and appropriate stress gradients. These can be obtained either by pre-existing notches, as is done in a typical American Society of Testing and Materials (ASTM) fatigue and fracture tests, or by in situ generated stress concentrations via dislocation pile-ups. Crack growth kinetics are also examined using the modified Kitagawa–Takahashi diagram to show the role of internal stresses and their gradients needed to sustain continuous crack growth. Incipient crack initiation and growth are also examined using discrete dislocation modeling. The analysis is supported by the experimental data available in the literature.

1. Introduction

Mechanical failure of materials occurs by crack initiation and growth. Griffith [1] provided the first crack growth analysis using the change in the strain energy of the cracked body in comparison to uncracked bodies, in generating new surfaces by crack initiation and the growth process. In his classical analysis, interestingly, the crack initiation and its growth are considered the same. Most metallic materials, however, yield by plastic flow before cracks form and grow. In addition, if the material deforms uniformly across the specimen cross-section, then cracks may not be initiated. The specimen may fail by the necking process. Because cracks are high energy defects, they need localized stress concentrations for their initiation and growth. Simple necking to failure can be seen in some superplastic materials [2].
Most engineering materials, however, are polycrystalline with distributed grain sizes and orientations. This results in inhomogeneous deformations across the specimen cross-section, leading to stress concentrations. The origin of the famous Hall–Petch equation that describes the grain size dependence for deformation and fracture is intrinsically related to the inhomogeneous deformations [3]. In addition, surface grains are likely to deform first due to reduced constraints near the surface. In the following, we examine the crack initiation and growth process in crystalline materials to extract some of the basic concepts involved. Discrete dislocation analysis [4] and elastic-plastic fracture mechanics methods [5] are used to understand how localized deformation and stress concentration help in the formation and growth of an incipient crack leading to specimen failure.

2. Crack Growth Analysis

It is important to look at the problem from the basics. Figure 1 gives a schematic illustration describing the kinetics of crack initiation and the growth process, from an elastic (Griffith) crack to elastic-plastic crack. The problem is discussed both from the point of continuum mechanics principles and from the discrete dislocation modeling.
In Figure 1a, Griffith’s elastic crack [1] is described. The total energy of the system involves the change in the elastic energy due to the presence of a crack under applied stress σy, work done by the applied stress, and work expended in creating two new surfaces. The total energy reaches a peak, where crack length longer than the critical size ac will expand continuously with the reduction in the total energy, Figure 1b. The energy gradient provides the crack-tip driving force. If the energy to nucleate crystal dislocations from the crack tip is lower than the energy needed for the crack to expand further as an elastic crack, then the crack undergoes plastic relaxation, causing a reduction in the total energy of the system.
Starting from Bilby, Cottrell, and Swindon [6], continuum dislocation models are used to characterize the growth of a crack with the dislocation-plasticity. For a given crack size, the crack and associated plastic zone are analyzed using continuum dislocations. The conditions for a critical crack size for its continuous expansion are determined as a function of applied stress and lattice friction stress. In this model for mathematical simplicity, each crack with its plastic zone is treated separately. Hence, inherently the history dependence of a growing incipient crack with its plastic zone was not considered. A similar approach has been adopted by Orawan [7]. There have been many attempts to characterize tensile elastic-plastic cracks with crystal plasticity on inclined slip planes [8,9,10]. For a valid reason, the problem becomes mathematically intractable, and there are many attempted numerical solutions to the problem.
Figure 1a also shows the continuously expanding elastic-plastic crack. The crack growth alternates between glide and cleavage modes of crack growth. The total energy of such a crack also reaches a maximum as a function of crack length, Figure 1b. Analytically it is difficult to formulate the growth of such a crack. Figure 1c shows the log(stress) vs. log(crack length) plot for both elastic and continuous elastic-plastic cracks. For an elastic crack, which is the same as the Griffith crack, the slope is 0.5, depicting square root singularity of stress with crack length. For the continuous elastic-plastic crack, the slope is less than 0.5, and depends on the relative ratio of friction stress (or ~yield stress) to applied stress, μ.
Since it is difficult to formulate the tensile elastic-plastic cracks analytically, Marcinkoski and his group [4,11,12,13] analyzed the problem using discrete dislocations. Here, we present some recent results using such models [14], correlated with the results derived from continuum elastic-plastic fracture mechanics calculations [15,16], and also bring in our modified Kitagawa–Takahashi diagram [15] to extract some basic physical principles. In comparing the continuum models with the dislocation models, caution is exercised by recognizing that the scale of applications is different. Dislocation models are at the micron size level, while the continuum models are more relevant at the continuum level. Nevertheless, the fundamental concepts remain the same, as will be shown here.

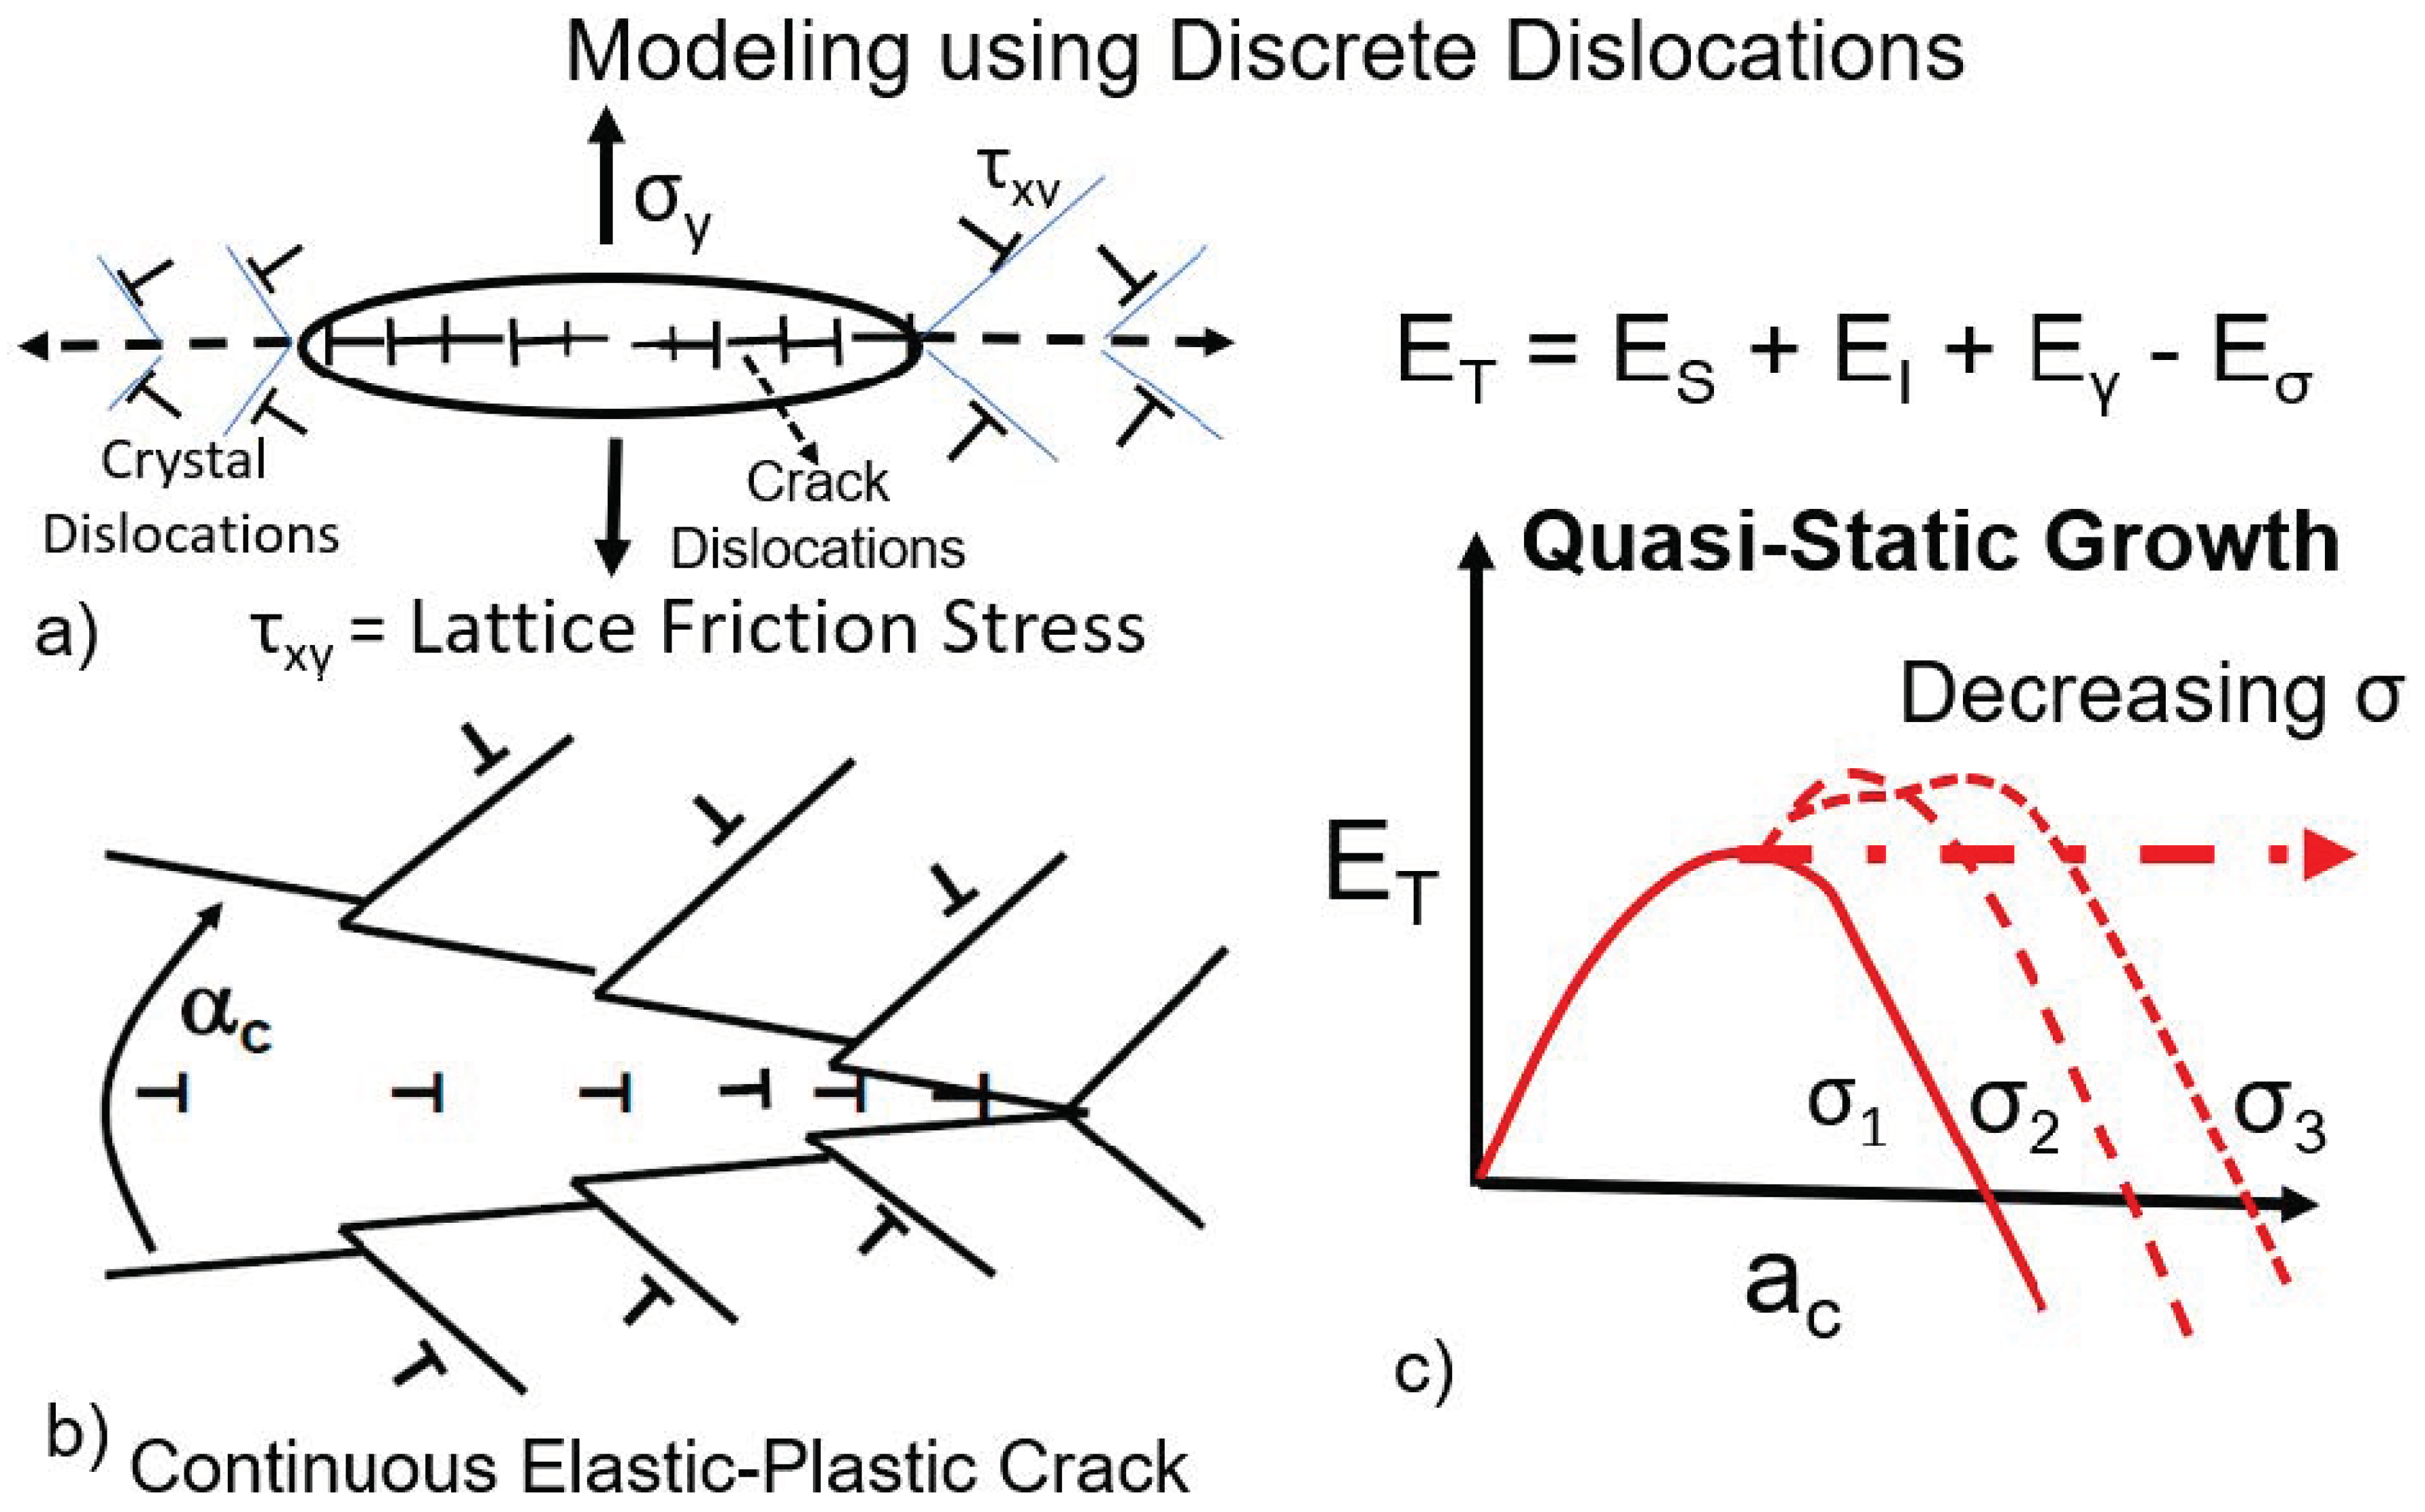
2.1. Discrete Dislocation Models

Figure 2 shows schematics of discrete dislocation models. The cracks are modeled using crack dislocations, meaning the Burgers vectors of the dislocations can be variable and need not correspond to the translation vectors of the crystals. The crack is packed with a sufficient number of dislocations and their equilibrium positions are then found under the imposed applied tensile stress. The equilibrium position corresponds to the zero-force on the dislocations. Therefore, it corresponds to the traction-free condition at the crack surfaces. The total energy of the system involves an algebraic sum of the self-energies, mutual interaction energies, the work done by the applied stress in moving the dislocation from the origin (center of the crack) to their equilibrium positions, and the surface energy in creating the two crack surfaces. For glide dislocations, one has to consider also the work done against the lattice frictional stress. The total energy reaches a peak that corresponds to the Griffith condition. Beyond the peak, the total energy decreases with the crack accelerating as it grows, contributing to specimen failure. The calculations are valid if, for the elastic crack, the results match with that of the Griffith crack.
The crack can emit crystal-lattice dislocations on the slip plane (Burgers Vectors of these correspond to the crystal in question) that make an angle with the crack plane (cleavage plane) [17,18,19]. These dislocations move against the lattice frictional stress (which can be equated to the yield stress of the material) depending on the relative ratio of frictional stress to the applied stress (μ). If the frictional stress reaches zero, the emitted dislocations can go to infinity. On the other hand, if the stress is infinite, the crack reduces to an elastic crack. Thus, a range of material behavior can be obtained by changing this relative ratio, μ.

2.2. Continuous Elastic-Plastic Crack

By emitting crystal lattice dislocations, a growing elastic crack can reduce its energy. As the dislocations accumulate on the slip plane against the frictional stresses and mutual repulsive forces, a stage will be reached where the back stress from the emitted dislocations in the plastic zone prevents further emission of the dislocations at the crack tip. The configuration corresponds closely to that of the Bilby, Cottrell, and Swindon (BCS) crack other than the fact that the dislocations are on an inclined plane.
The continuous elastic-plastic crack, on the other hand, starts emitting crystal lattice dislocations as it grows. Hence, during the calculations, at each crack increment, the total energy is compared for dislocation emission vs. further crack extension as a cleavage crack. If the energy for emission is lower, then the crystal dislocation on the glide plane is allowed. The same test is again done for the emission of the second dislocation on the glide plane, in contrast to further crack extension as an elastic crack. For most cases, depending on the value of μ, the emission of the second dislocation is prevented due to the back stress from the previously emitted dislocation. Hence, the calculations are somewhat tedious and become intensive as the crack grows with changing glide to cleavage components depending on μ and the surface energy of the material. However, the case represents a more realistic situation with the plastic zone accumulating in the wake of the growing crack. The continuous elastic-plastic crack also captures crack growth history. Thus, depending on the μ and γ (surface energy) values, the relative components of glide vs. cleavage components change. The total energy of the incipient crack increases with an increase in the length of the crack until it reaches a peak value. Further increase in crack size only reduces the total energy, resulting in the acceleration of the crack, contributing to the total failure, Figure 2b. The material can harden as the crack grows (thus changing the μ value), thereby altering the energy-crack length curve or contributing to crack growth toughness. Figure 1c shows the log of stress vs. the log of critical crack size (at the peck energy value). Calculations show that in the log–log coordinates, the stress vs. crack length for the continuous elastic-plastic crack follows a straight line but with the slope less that of the elastic Griffith crack, which is 0.5. The slope decreases with a decrease in μ. This is similar to the effect of the decrease of the yield stress of the material. Conversely, as the yield stress increases, the crack growth behavior approaches that of the elastic crack.
Figure 2c also depicts a thought experiment. After reaching the peak-energy for given stress as the energy starts decreasing, if the applied stress is reduced, then the energy has to again peak at a larger ac value. One can think of an infinitesimal change in the applied stress to keep the energy at the same peak level, without it increasing or decreasing. This process can be continued with a continuous decrease in the applied stress as the crack length slowly increases to maintain the growth in equilibrium. Since the total energy remains constant, such a crack grows at a quasi-steady state. For an elastic crack, the applied stress has to be reduced, maintaining the Griffith stress with the increasing crack length. Hence in the log–log plot, the stress vs. crack length line represents the quasi-steady crack growth condition for continuously decreasing stress. If the stress is higher than the Griffith line, then the growing crack accelerates. On the other hand, if the stress falls below the line, the growing crack is arrested. This forms the condition for the crack arrest of an incipient growing crack due to a sharp decrease of applied or internal stresses that are contributing to the growth of a crack. It also leads to the Kitagawa–Takahashi type of diagram [20], as will be discussed below.

2.3. Crack Initiation at Pre-Existing Stress Concentrations

Because cracks are high energy defects, it is difficult for them to be initiated in otherwise defect-free crystals. Most fracture mechanics tests using the American Society of Testing and Materials (ASTM) criteria [21] are conducted using notched specimens and, sometimes, notched and pre-cracked specimens. The stress field of a notch is characterized by the elastic stress concentration factor Kt and the notch tip radius, ρ. Figure 3a shows an incipient crack initiated at the notch tip. The stress at the notch tip corresponds to Kt σ but decreases with distance depending on the notch tip radius, ρ, approaching the remote stress, σ. For sharp notches, the stress gradient is sharp, while for blunt notches, the rate of decrease is slower. We have analyzed the growth of a short crack at the notch tip using elastic-plastic fracture mechanics [16]. The results are shown schematically in Figure 3c. The stress intensity factor for the short crack increases sharply from zero, decreases to some minimum, and then increases slowly with a further increase in the crack length. When the short crack length is zero, K for the short crack is also zero. The sharp increase is due to the very high notch tip stresses. Hence the initial sharp increase can be considered as within the process zone or from the point of dislocations within the core region of the notch. The decrease of K as the short crack grows is due to the gradient in the notch tip stress field. Further increase in the K value arises as the crack grows due to the remote applied stress since K increases with the crack length for a given stress. Hence, the depicted behavior of Ksc is expected due to the notch tip stress gradient. It may be noted that for just purely elastic calculation, Ksc monotonically increases and does not show the observed minimum [22].
For the continuous growth of the initiated crack at the notch tip, the minimum must exceed the threshold stress intensity factor, Kth for crack growth. Otherwise, the incipient crack that is growing in the high-stress field of the notch is arrested when Ksc drops below Kth. The minimum of the Ksc value is related to the internal stress (notch tip stress) magnitude and its gradient. For very sharp notches (ρ ~ 0), the stress gradient can be sharp, leading to arrest of the growing short crack leading to non-propagating cracks at sharp notches. This is observed, particularly under fatigue, leading to fatigue stress concentration factor, KFC, differing from the elastic stress concentration factor, Kt. The magnitude of the stress at the notch tip also depends on the applied stress, σapl. We have shown [16] that the minimum applied stress needed for the continuous growth of incipient crack near the stress concentration can be expressed as:
σ a p l = 2 K t h ( K t ) 1.3 × ρ
where Kth corresponds to the threshold for crack growth. It can be a threshold for any subcritical crack growth (thresholds for fatigue, stress corrosion, corrosion-fatigue, sustained load, or even for a fracture, such as K1C). Kt and ρ are elastic stress concentration factor and notch-tip root radius, respectively. The equation has been successfully applied to the extensive notch-fatigue data available in the open literature. Recently, the equation has been applied to determine the pit to crack transition under corrosion fatigue [23].
Figure 3b also shows the crack initiation ahead of the notch tip. This can occur at grain boundary junctions (accentuated by the presence of carbide particles or inclusions) due to high hydrostatic stresses present. Several models have been developed assuming such nucleation [24,25,26]. We show later a similar problem was analyzed using discrete dislocations where short crack nucleation ahead of a blunt crack is considered. Figure 4 shows typical results of short crack initiation and growth near notches with different Kt values but for a fixed ρ, showing how minimums in Ksc values become sharper with increasing Kt value.

2.4. Crack Initiation at the In Situ Generated Stress-Concentrations

Since stress concentrations are essential for the initiation of cracks in the material, if there are no pre-existing cracks or stress concentrations, then the inhomogeneous deformations produce localized stress concentrations via the formation of dislocation pile-ups, as discussed by several authors, beginning with Eshelby [27]. The typical internal stress profile ahead of a dislocation pile-up deduced by Eshelby is shown in Figure 5, which was experimentally confirmed by X-ray analysis by Gao et al. [28]. The internal stress profile is not much different from that of a notch tip stress field. In fact, it was shown that most of the stress fields at stress concentrations follow a similar pattern [29]. The implication is that incipient cracks that form at stress concentrations will also have typical profiles for their stress intensity factor, as shown in Figure 3 and Figure 4, with minima that must exceed the governing threshold for continuous crack growth. Otherwise, initiated growing short cracks are arrested. Experimentally, one finds many short cracks are initiated near the surface under, for example, corrosion, but only one or two grow and thus contribute to specimen failure.

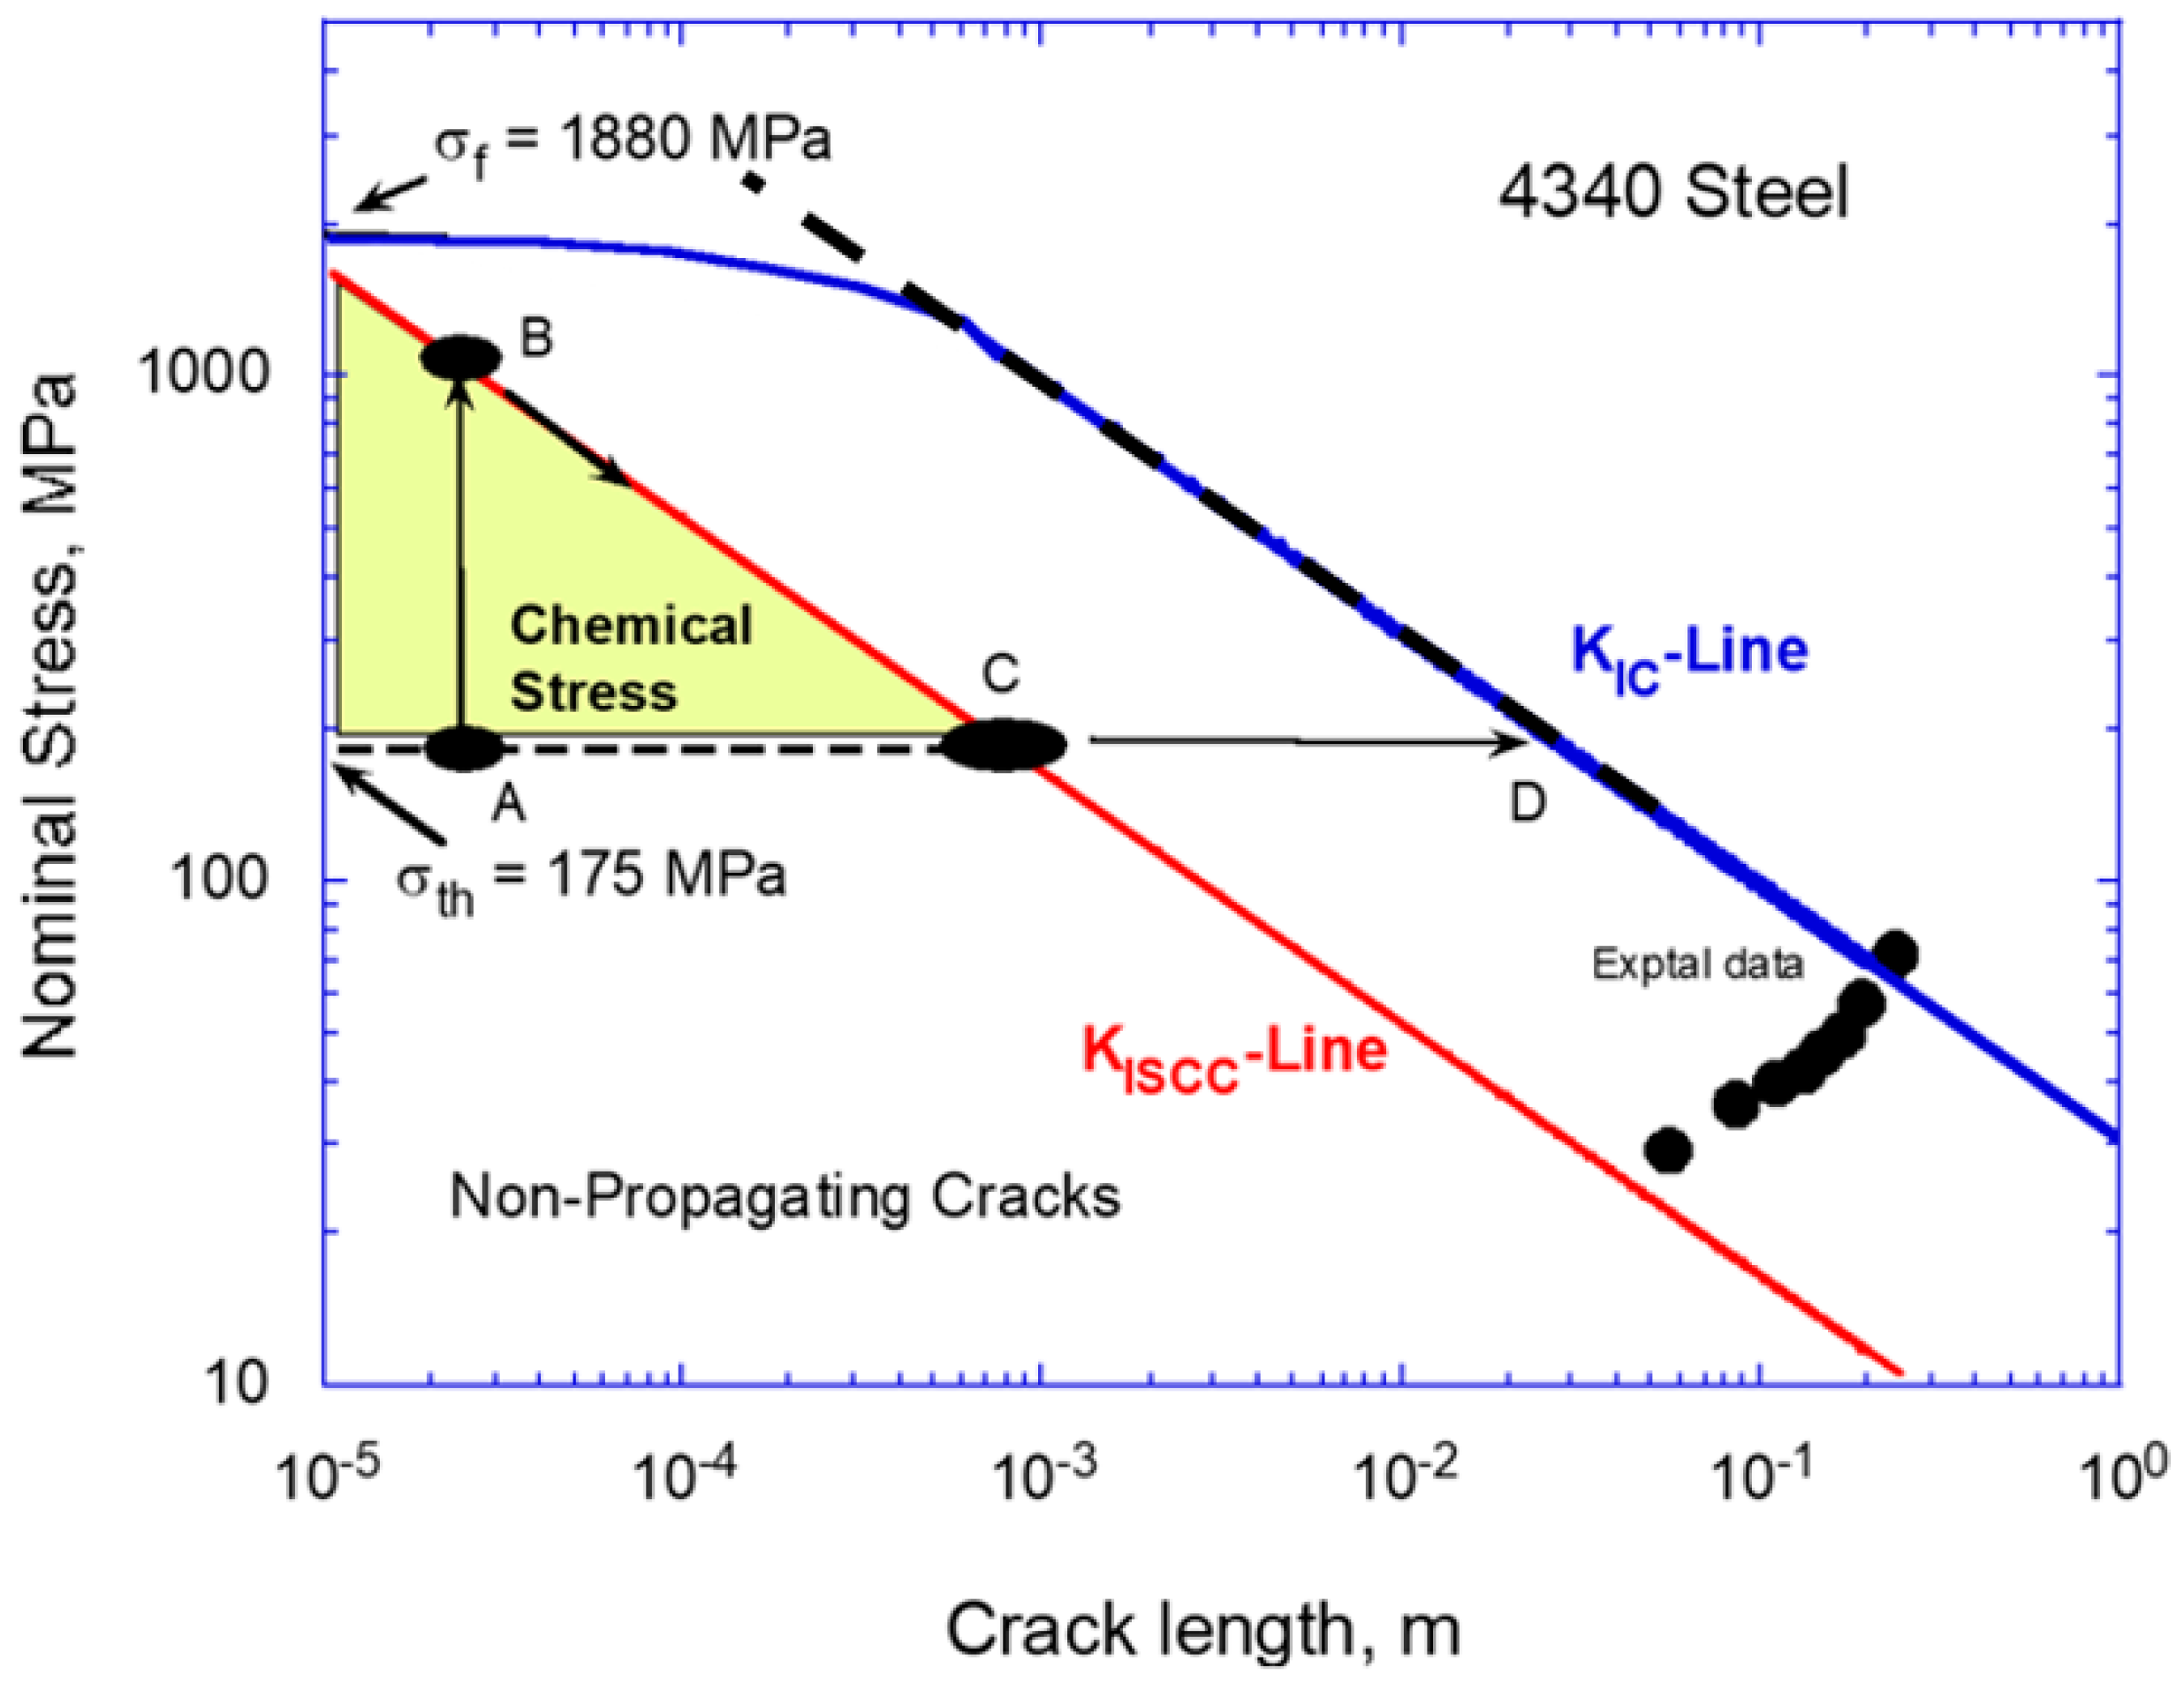
2.5. Role of Internal Stresses and the Modified Kitagawa-Takahashi Diagram

From Griffith’s equation, we note that the stress for crack growth increases with decreasing crack length according to the relation:
σ apl = ( 2 E γ ) π a ( 1 ν )
Where the required applied stress increases with decreasing size of the crack approaching infinity when the crack length goes to zero. Figure 6 shows this in a log–log plot. For ductile materials, with the increase in the applied stress, the material yields before a crack is initiated. From Figure 6, we can define the minimum internal stresses, and the gradients required for crack initiation can be defined by what we call an internal stress triangle. In some sense, we are generating the local internal stresses, by way of dislocation pile-ups, to augment the applied stress for the crack initiation and growth, until the remote applied stress is sufficient to sustain further growth of the initiated crack. The internal stress triangle thus defines both the magnitude and gradient required for incipient crack initiation and its growth. Based on this figure, the following points can be made: (a) In addition to the magnitude of the stress, its gradient is also involved in sustaining the growth of the incipient crack. If the gradient is too sharp, as in the case of sharp notches, the initiated crack may be arrested if the stress falls below Griffith’s line. (b) Furthermore, it is difficult to separate the initiation vs. growth as both are simultaneously involved since Griffith’s condition corresponds to the maxima in the total energy (unstable equilibrium). It may be possible that the initiated crack can be stabilized due to oxidation of the mating crack surfaces, but this is a separate issue.
Figure 6b shows a similar behavior that can be extracted using the modified Kitagawa–Takahashi diagram, which was initially developed for fatigue failure. The crack-growth threshold stress-intensity factor replaces Griffith’s criterion, and the endurance limit replaces the yield stress. Our modification involves extending the threshold line beyond the endurance limit, thereby defining the internal stress triangle. At the endurance of a smooth specimen, close to 107 cycles are needed for the crack to initiate and grow. These cycles are required for the development of the needed internal stresses and their gradients for an incipient crack to form and grow. The initiation and growth of the short crack in the endurance have been accounted for by the fracture mechanics community by invoking the similitude break down and proposing that the short crack threshold is different from that of long crack thresholds due to crack closure. We have shown using the dislocation theory that the crack-closure concept is inherently faulty in the plane strain regim e, and no similitude break down is needed to account for the short crack growth behavior. The short crack grows due to the presence of both applied and in situ generated internal stresses arising from inhomogeneous deformations in the polycrystalline materials. The thresholds do not depend on the crack size, and one has to properly account for the local build-up of internal stresses and their gradients due to dislocation pile-ups. A detailed review of short crack growth was provided recently [30].
Internal stresses are difficult to determine. One can compute them based on some physical models such as dislocation pile-ups. The Kitagawa diagram provides some way to estimate the required minimum internal stresses and their gradients for the incipient crack to grow at the threshold condition. The stresses are higher than those causing acceleration of the crack growth while the stresses are lower than those causing crack arrest. Overloads and underloads, for example, can change local internal stresses (sometimes referred to as residual stresses, which are only a subset of the internal stresses) and contribute to changes in the crack growth kinetics. From equilibrium consideration, the internal stresses are self-equilibrating. That is, there will always be a plus/minus type with the net result of maintaining the specimen in equilibrium. The fact is internal stresses resulting from inhomogeneous deformations are involved in the nucleation and propagation of the cracks in specimens, even though they are difficult to measure.

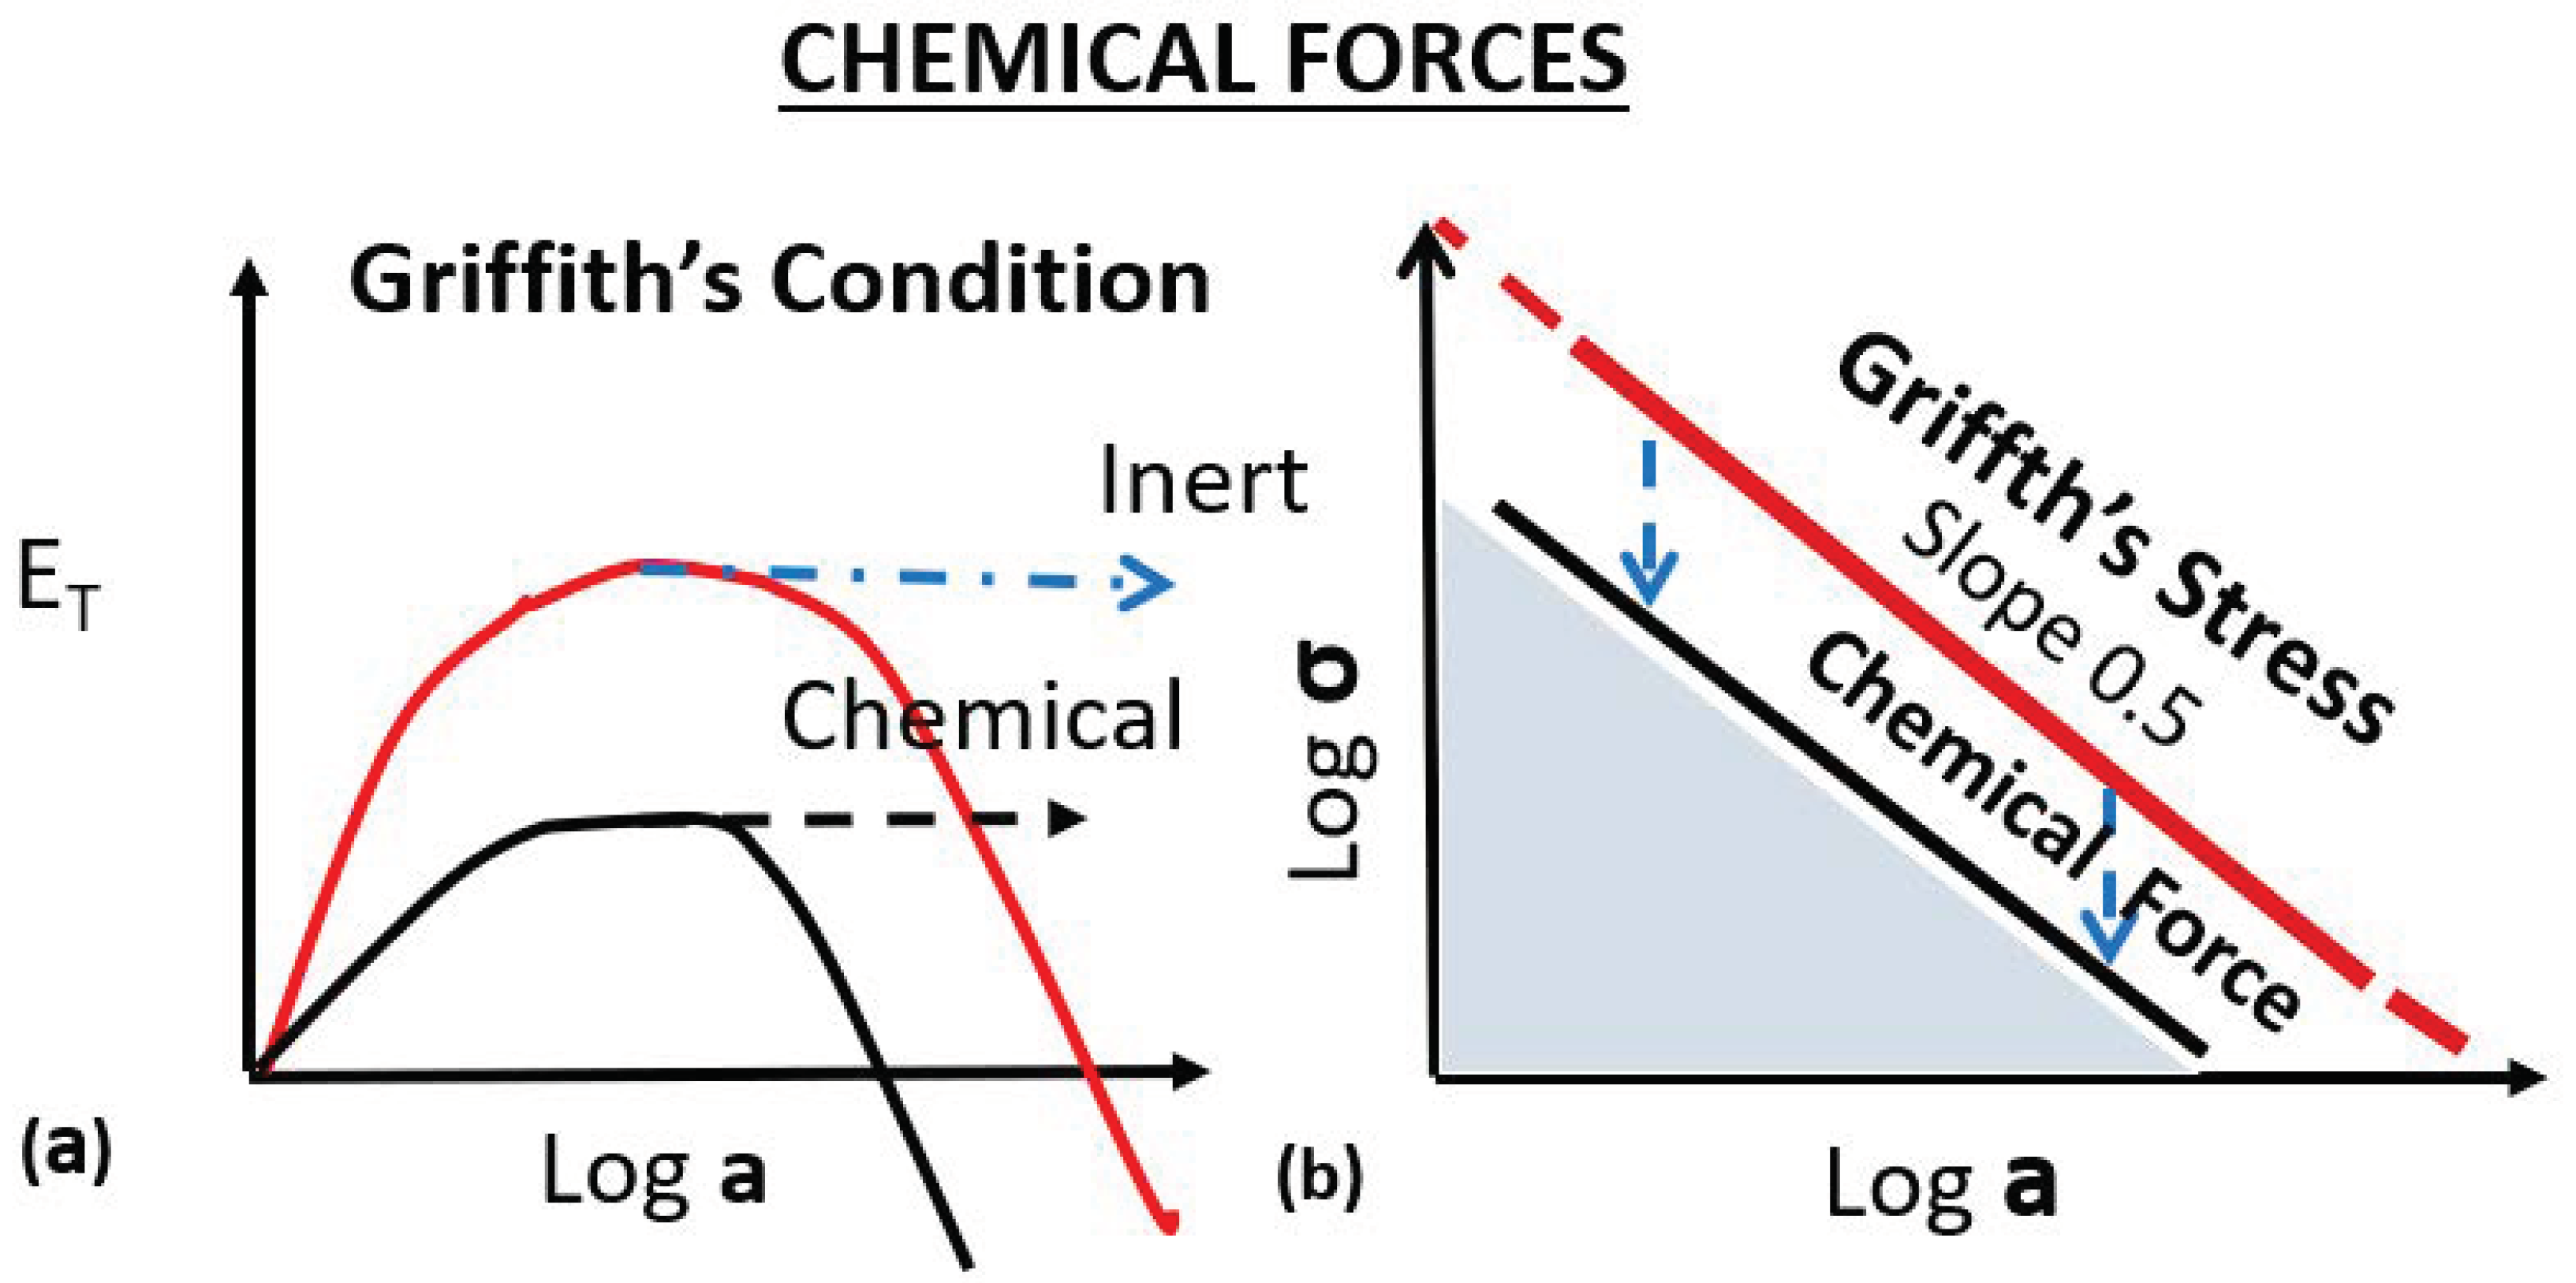
2.6. Role of Chemical Forces

Figure 7 provides a simple case where chemical forces manifest in terms of reduction in the surface energy of the crack surfaces, thereby reducing the required applied stress needed for a Griffith crack, for example, to be initiated and grow (Equation (2)). The total energy as a function of the crack length is reduced (Figure 7a), and, correspondingly, the applied stress needed for a given crack length is reduced (Figure 7b). The micromechanisms involved in the reduction of crack tip driving force can be complex. Nonetheless, the net result from the point of engineering considerations is that there is a reduction in the required applied stress to contribute to the same crack length or crack growth rate. Hence, we can formally define the mechanical equivalent of chemical forces based on the reduction in the required stress to cause the same crack growth rate. This is shown in Figure 7b. To compute the chemical stresses involved, we need, therefore, crack growth in the inert medium as a reference state. For corrosion fatigue, fatigue in an inert medium can be used as a reference state. However, care should be exercised since fatigue is a two-load parametric problem requiring σmax and Δσ for Stress vs. number of cycles for failure (S-N fatigue) fatigue or two stress intensity factors (Kmax, ΔK) for fatigue crack growth [30]. However, for stress corrosion or sustained load crack growth, there is no subcritical crack growth in an inert environment for a reference state. Only the fracture toughness value in an inert medium provides the reference.

3. Experimental Support for the Above Concepts

Figure 8 shows experimental threshold data under corrosion fatigue for steels with different heat treatments resulting in different yields stresses (from Usami [31]). Interestingly the change in the yield stress affects only the endurance limit but not long crack growth thresholds. Why this is so is not clear. With increasing yield stress, the material’s behavior is increasingly elastic, as one should expect. Correspondingly, the internal stress triangle becomes smaller with increasing yield stress, indicating that the needed contribution from the local internal stress decreases. When the yield stress exceeds the fracture stress, the material becomes brittle. Figure 9 shows another example based on Hiroshi–Mura data [32] on stress corrosion of 4340 steel in H2(SO)4. The data are plotted in the form of the Kitagawa–Takahashi diagram. The endurance stress is similar to the minimum failure stress, σth, of a smooth specimen loaded in the corrosive environment. The mechanical equivalent of chemical internal stress is defined in the figure. The extent of experimental data on smooth and fracture mechanics specimens in corrosive media available in the open literature is limited. Nevertheless, the analysis shows that transition from short cracks to long cracks and the role of internal stresses in accentuating the crack initiation and growth process are general for all subcritical crack growth processes in materials.

3.1. Application to Fracture Toughness

The above concepts are relevant not only for subcritical crack growth, but also to fracture toughness (Figure 10). Experimental data from Bucci (1996; [33]) are shown in Figure 10a, and the data are plotted in terms of the modified Kitagawa–Takahashi diagram for two selected alloys (Figure 10b), one with low and the other with high fracture stresses. The horizontal portions of the plot correspond to the tensile fracture stress, while the inclined lines represent the K1C lines. The extension of the K1C lines defines the internal stresses needed to initiate a crack in a smooth specimen. The internal stress triangle is large for the low yield stress 2024-T3 alloy in comparison to the high yield stress 7075-T6 alloy, as expected.

3.2. Discrete Dislocation Models

The formulation of the discrete dislocation models for continuous elastic-plastic cracks was discussed earlier (Section 2.2). Here we present some results of our calculations [14]. Since the computations are quite involved, the analysis could only be undertaken for microscopically sized cracks. In Figure 11, the effect of μ, the ratio of friction stress to applied stress on the growing elastic-plastic cracks is shown. With the decrease of μ, the glide component increases with the cleavage component. Figure 11 shows the slope of the log(applied stress) vs. the log(crack length) decreases with the decrease of μ. Nevertheless, the exponential relation remains with the exponent of σ vs. a decrease from 0.5. Figure 12 shows the total energy of the growing crack as a function of crack size for two μ values, 0.6 and 0.8, based on the calculations reported in ref. [14]. The crack grows along the path that has lower energy. The figure shows that glide and cleavage components fluctuate until the crack becomes unstable. The relative proportions of the two components vary depending on the μ value. Experiments undertaken with varying H concentrations support these results.

3.3. Effect of Hydrogen Pressure

The effect of hydrogen on the embrittlement of steels has received significant attention [34]. Recently, Adlakha and Solanki [35] analyzed this problem extensively using both atomic simulations and continuum-based models. They show that hydrogen segregation around the crack tip enhanced both dislocation emission and cleavage behavior. Figure 13 shows the discrete dislocation analysis of elastic-plastic cracks in the presence of hydrogen [14]. The results indicate that for a given μ, the ratio of lattice friction to applied stress, the slope of log(stress) vs. log(crack length) increases as the hydrogen pressure increases, due to the increased cleavage component, and the curve moves closer to the Griffith crack.
Experimental support for the analysis is provided in Figure 14, which is taken from Vehoff and Rothe [36], and shows that the cleavage component increases with increasing H-pressure, thereby reducing the crack mouth angle, α. Attached micrography shows the reduction in the crack mouth angle with increasing H-pressure. Further analysis (Figure 15) shows that the hydrogen effect saturates at high pressures. Thus, we have a negligible effect at shallow pressures and a saturation effect at high pressures. In the intermediate range, the presence of hydrogen reduces the mechanical driving force for crack growth, making the material more brittle. Experimental data are shown in Figure 16, taken from ref. [37], on the hydrogen embrittlement in alloy steels, which supports the above results.

3.4. Crack Initiation Ahead of the Main Crack

Finally, we treat the growth of a short crack initiated ahead of the main crack, similar to that shown in Figure 3b. The equilibrium configuration of both the glide and cleavage dislocations are shown for selected fractions of hydrogen coverage. With an increase in hydrogen coverage, the material becomes more brittle, or from the dislocation point, the cleavage crack becomes narrower, while the glide part of the crack becomes wider, reflecting crack opening displacements. Figure 17 shows (a) the short crack grows more towards the main crack, (b) the crack tip plasticity or glide component is more for the segment facing the main crack, and (c) with increasing hydrogen coverage, the glide components at both ends decrease and approach the cleavage mode of crack growth. In these calculations, the blunting radius of the main crack is held constant. Future calculations will involve consideration of the plasticity at both the main crack and the initiated short crack, although such calculations will be time-consuming since the number of dislocations involved becomes large.

4. Summary

A detailed analysis of crack initiation and growth in crystalline materials is provided both from the perspective of continuum mechanics and dislocation dynamics. Basic principles underlying crack initiation and growth are highlighted. The role of pre-existing or in situ generated stress concentrations in the initiation of the incipient cracks in crystalline materials is outlined. It is shown that stress concentrations are essential for the nucleation of cracks. They provide the local internal stresses and gradients needed for crack initiation and growth. The application of the modified Kitagawa–Takahashi diagram in accounting for the role of internal stresses for the initiation and growth of short cracks, for both subcritical crack growth and fracture, is discussed. Discrete dislocation models are presented, and the effect of hydrogen on crack growth kinetics is analyzed.

Author Contributions

All authors have read and agreed to the published version of the manuscript. Conceptualization; K.S., I.A., K.N.S. Methodology K.S., I.A., K.N.S., A.K.V.; Software I.A., K.N.S., Validation, I.A., K.N.S.; Formal Analysis, K.S., I.A., K.N.S.; Investigation, I.A., K.N.S.; resources K.S., I.A., K.N.S., A.K.V.; data curation, K.S., I.A., K.N.S.; Writing-original draft preparation, K.S., I.A.; writing review and editing, K.S., I.A.; Visualization, K.S.; Supervision, K.S., K.N.S.; project administration, Nagaraja Iyer, Technical Data Analysis, funding acquisition.

Funding

This research is supported by funds received from the Office of Naval Research, USA, under Technical Data Analysis Contract # N68335-16-C-0135 with Anisur Rahman as the Project Monitor.

Conflicts of Interest

The authors declare no conflict of interest.

Symbols Used

ASTM—American Society of Testing and Materials
KT diagram—Kitagawa Takahashi
μ—Ratio of frictional stress to applied stress.
BCS model—Bilby, Cottrell, and Swindon model
a—Crack Length
ac—Critical Crack length
σy—Normal Stress
ET—Total Energy of the System
ES—Self Energy of all dislocations
EI—Interaction energy of all dislocation
Eγ—Surface energy
Eσ—Work done by applied stress
τxy—Lattice frictional stress
αc—Crack mouth angle
Kt—Elastic Stress Concentration Factor
ρ—Notch tip radius
KSC—Stress intensity factor for short crack
Kth—Threshold stress intensity factor for crack growth
KIC—Fracture Toughness
KISCC—Stress Corrosion Crack Growth Threshold
Kpl—Stress intensity factor for short crack in the elastic plastic notch tip field.
ΔKth—Fatigue crack growth threshold Stress intensity range.
σapl—Applied Stress
σys—Yield Stress
σe—Endurance Stress
σFS—Fracture Stress
E—Elastic Modulus
γ—Surface Energy
ν—Poisson ratio

References and Note

  1. Griffith, A.A. The phenomena of rupture and flow in solids. Philos. Trans. R. Soc. Lond. 1921, 221, 163–198. [Google Scholar]
  2. Dieter, G.E. Mechanical Metallurgy, 3rd ed.; McGraw-Hill Inc.: New York, NY, USA, 1986; pp. 299–301, 452–453. ISBN 0-07-016893-8. [Google Scholar]
  3. Armstrong, R.W. Material grain size and crack size influences on cleavage fracturing. Philos. Trans. R. Soc. A 2015, 373, 20140124. [Google Scholar] [CrossRef] [PubMed]
  4. Jagannadham, K.; Marcinkowski, M.J. Unified Theory of Fracture; Trans Tech Publications Ltd.: Zurich, Switzerland, 1983. [Google Scholar]
  5. Rice, J.R. Elastic-plastic fracture mechanics. Eng. Fract. Mech. 1973, 5, 1019–1022. [Google Scholar] [CrossRef]
  6. Bilby, B.A.; Cottrell, A.H.; Swinden, K.H. The spread of plastic yield from a notch. Proc. R. Soc. Lond. A 1963, 272, 304–314. [Google Scholar]
  7. Orowan, E. Fracture and strength of solids. Rep. Prog. Phys. XII 1948, 12, 185–232. [Google Scholar] [CrossRef]
  8. Zhao, R.H.; Dai, S.-H.; Li, J.C.M. Dynamic emission of dislocations from a crack tip, a computer simulation. Int. J. Fract. 1985, 29, 3. [Google Scholar] [CrossRef] [Green Version]
  9. Rice, J.R. Tensile crack tip fields in elastic-ideally plastic crystals. Mech. Mater. 1987, 6, 317–335. [Google Scholar] [CrossRef]
  10. Weertman, J. Mathematical Theory of Dislocations; Mura, T., Ed.; American Society of Mechanical Engineers: New York, NY, USA, 1969; p. 178. [Google Scholar]
  11. Marcinkowski, M.J. Dislocation model of a plastic tensile crack. J. Appl. Phys. 1975, 46, 496. [Google Scholar] [CrossRef]
  12. Marcinkowski, M.J.; Das, E.S.P. Relationship between crack dislocations and crystal lattice dislocations. Phys. Status Solidi A 1971, 8, 249. [Google Scholar] [CrossRef]
  13. Sadananda, K.; Jagannadham, K.; Marcinkowski, M.J. Discrete dislocation analysis of a plastic tensile crack. Phys. Status Solidi A 1977, 44, 633–642. [Google Scholar] [CrossRef]
  14. Adlakha, I.; Sadananda, K.; Solanki, K.N. Discrete dislocation modeling of stress corrosion cracking in an iron. Corros. Rev. 2015, 33, 467–475. [Google Scholar] [CrossRef]
  15. Sadananda, K.; Sakar, S. Modified Kitagawa Diagram and Transition from Crack Nucleation to Crack Propagation. Metall. Mater. Trans. 2012, 44, 1175–1189. [Google Scholar] [CrossRef]
  16. Sadananda, K.; Arcari, A.; Vasudevan, A.K. Does a nucleated crack propagate? Eng. Fract. Mech. 2017, 176, 144–160. [Google Scholar] [CrossRef] [Green Version]
  17. Rice, J.R.; Thomson, R.M. Ductile versus brittle behavior of crystals. Philos. Mag. 1974, 29, 73. [Google Scholar] [CrossRef]
  18. Rice, J.R. Dislocation nucleation from a crack tip: An analysis based on the Peierls concept. J. Mech. Phys. Solid. 1992, 40, 239–271. [Google Scholar] [CrossRef]
  19. Beltz, G.E.; Rice, J.R.; Shih, C.F.; Xia, L. A self-consistent model for cleavage in the presence of plastic flow. Acta Mater. 1996, 44, 3943–3954. [Google Scholar] [CrossRef] [Green Version]
  20. Kitagawa, H.; Takahashi, S. Applicability of fracture mechanics to a very small crack or the cracks in the early stage. In Proceedings of the Second International Conference on Mechanical Behavior of Materials, Cleveland, OH, USA, 16–20 August 1976; pp. 627–631. [Google Scholar]
  21. Active Standard ASTM E399, Standard Test Method for Linear-Elastic Plane-Strain Fracture Toughness KIC of Metallic Materials.
  22. Raju, I.S.; Atluri, S.N.; Newman, J.C., Jr. Stress intensity factors for small surface and corner cracks in plates. In Fracture Mechanics: Perspectives and Directions (Twentieth Symposium); Wei, R.P., Gangloff, R.P., Eds.; American Society for Testing and Materials (ASTM): Philadelphia, PA, USA, 1989; pp. 297–316. [Google Scholar]
  23. Sadananda, K.; Vasudevan, A.K. Analysis of pit to crack transition under corrosion fatigue & the safe-life approach using the modified Kitagawa-Takahashi. Int. J. Fatigue 2020, 134, 105471. [Google Scholar]
  24. Rice, J.R.; Tracy, D.M. On the ductile enlargement of voids in the triaxial stress fields. J. Mech. Phys. Solids 1969, 17, 201–217. [Google Scholar] [CrossRef] [Green Version]
  25. Ritchie, R.O.; Knott, J.F.; Rice, J.R. Relationship between critical tensile stress and fracture toughness in mild steel. J. Mech. Phys. Solids 1973, 21, 395–410. [Google Scholar] [CrossRef]
  26. McCoy, R.A.; Gerberich, W.W. Hydrogen Embrittlement Studies of a Trip Steel. Metall. Trans. 1973, 4, 539–547. [Google Scholar] [CrossRef] [Green Version]
  27. Eshelby, J.D.; Frank, F.C.; Nabarro, F.R.N. The equilibrium array of Dislocations. Philos. Mag. 1951, 42, 351–364. [Google Scholar] [CrossRef]
  28. Guo, Y.; Britton, T.B.; Wilkinson, A.J. Slip band grain boundary interactions in commercial pure Titanium. Acta Mater. 2014, 76, 1–12. [Google Scholar] [CrossRef]
  29. Glinka, G.; Newport, A. Universal function of elastic notch tip stress fields. Int. J. Fatigue 1987, 9, 144–150. [Google Scholar] [CrossRef]
  30. Sadananda, K.; Nani Babu, M.; Vasudevan, A.K. A Review of Fatigue crack growth resistance in the short crack growth regime. Mater. Sci. Eng. A 2019, 754, 674–701. [Google Scholar] [CrossRef]
  31. Usami, S. Applications of threshold cyclic-plastic-zone-size criterion to some limit problems. In Fatigue Thresholds; Blacklund, I., Bloom, A., Beevers, C.J., Eds.; EMAS: Stockholm, Sweden, 1981; pp. 205–238. [Google Scholar]
  32. Hirose, Y.; Mura, T. Nucleation mechanism of stress corrosion cracking from notches. Eng. Fract. Mech. 1984, 19, 317–329. [Google Scholar] [CrossRef] [Green Version]
  33. Bucci, R.J.; Nordmark, G.; Starke, E.A., Jr. Selecting Aluminum alloys to resist failure by fracture mechanisms. In ASM Handbook 19, Fatigue and Fracture; Materials Park, OH 44073-0002; ASM Handbook Committee: Oxfordshire, UK, 1996; pp. 771–812. [Google Scholar]
  34. Gangloff, R.P. Environmental Cracking-Corrosion Fatigue, Ch.26. In Corrosion Tests and Standard Manual, 2nd ed.; Baboian, R., Ed.; MIL-HDBK 729; ASTM International: West Conshohocken, PA, USA, 2005. [Google Scholar]
  35. Adlakha, I.; Solanki, K.N. Critical assessment of hydrogen effects on the slip transmission across grain boundaries in α-Fe. Proc. R. Soc. A 2016, 472, 617. [Google Scholar] [CrossRef] [PubMed] [Green Version]
  36. Vehoff, H.; Rothe, W. Gaseous hydrogen embrittlement in FeSi and Ni single crystals. Acta Metall. 1983, 31, 1781–1793. [Google Scholar] [CrossRef]
  37. Bandyopadhyay, N.; Kameda, J.; McMahon, C.J., Jr. Hydrogen-induced cracking in 4340-type steel: Effects of composition, yield strength and hydrogen pressure. Metall. Trans. A 1983, 14, 881–888. [Google Scholar] [CrossRef]
Figure 1. Analysis of crack initiation and growth for elastic to elastic-plastic cracks: (a) crack configurations (b) variation of total energy with crack length (c) log of stress vs. log of crack length for elastic and elastic-plastic cracks.
Crystals 10 00358 g001
Figure 2. Discrete dislocation modeling of a continuously growing elastic-plastic crack. (a) Crack with crack and crystal dislocations with applied and lattice frictional forces. (b) Continuously expanding elastic-plastic crack with inbuilt history. Based on the total energy of the system, the crack can expand elastically or emit crystal dislocations. The crack mouth angle depends on the relative ratio of glide and cleavage planes. (c) Quasi-static growth of the crack under continuously decreasing stress holding the total energy constant after its first nucleation.
Crystals 10 00358 g002
Figure 3. Crack initiation at a notch tip. (a) The stress field ahead of the notch tip. (b) Crack initiation at grain boundaries ahead of the notch tip due to hydrostatic stresses. (c) The variation of the stress intensity factor Ksc of the incipient crack growing nearing a notch tip.
Crystals 10 00358 g003
Figure 4. Typical results of actual calculations of Ksc (called Kpl due to elastic-plastic stress fields) for different Kt values but for a fixed ρ, showing the minimum in Ksc.
Crystals 10 00358 g004
Figure 5. Stress field in the next grain due to dislocation pile-up, from Eshelby, and X-ray data from Gao et al. (2014).
Crystals 10 00358 g005
Figure 6. (a) Griffith crack representation with yield stress defining the required minimum internal stress magnitude and gradient. (b) Parallel representation of the modified Kitagawa–Takahashi diagram for subcritical crack growth.
Crystals 10 00358 g006
Figure 7. Role of chemical forces and their quantification. (a) Total energy as a function of crack length and (b) log(stress) vs. log(crack length) plot.
Crystals 10 00358 g007
Figure 8. Corrosion-fatigue crack growth in alloy steels with varying yield stress, from Usami, 1981.
Crystals 10 00358 g008
Figure 9. Modified Kitagawa–Takahashi diagram for stress corrosion crack growth in 4340 steel in H2SO4 solution, extracted from Hiroshi–Mura data.
Crystals 10 00358 g009
Figure 10. Application to K1C, fracture data. (a) Experimental data from Bucci, 1996. (b) Representation of the data in terms of the modified Kitagawa–Takahashi diagram showing the internal stress triangle for the two cases, 7075-T6 and 2024-T3 Al-alloys.
Crystals 10 00358 g010
Figure 11. Discrete dislocation analysis of continuous elastic-plastic cracks for various μ values.
Crystals 10 00358 g011
Figure 12. Changes in the relative glide and cleavage components with the change in μ values for continuous elastic-plastic cracks.
Crystals 10 00358 g012
Figure 13. Effect of hydrogen pressure on crack growth for a given μ ratio. With the increase in H pressure, the lines move closer to the elastic Griffith crack behavior.
Crystals 10 00358 g013
Figure 14. Experimental results from Vehoff and Roth, 1983, on Fe-3%Si showing the effect of hydrogen pressure on crack growth. (a) With the increase in the hydrogen pressure cot(α) increases (α decreases) due to the increase in the cleavage component. (b) The associated micrograph indicates the crack mouth angle decreases when hydrogen pressure increases.
Crystals 10 00358 g014
Figure 15. Results of discrete dislocation analysis showing that the stress-intensity factor of an incipient crack shows a saturation effect with H coverage.
Crystals 10 00358 g015
Figure 16. Experimental results showing the saturation effect with the embrittling species on the crack growth threshold.
Crystals 10 00358 g016
Figure 17. Discrete dislocation models of growth of an incipient crack from ahead of the main crack for various hydrogen coverages.
Crystals 10 00358 g017

