Article

Toward Programmed Complex Stress-Induced Mechanical Deformations of Liquid Crystal Elastomers

1
School of Physics and Astronomy, University of Leeds, Leeds LS2 9JT, UK
2
Department of Mechanical Engineering, University of Colorado, Denver, CO 80204, USA
*
Author to whom correspondence should be addressed.
Crystals 2020, 10(4), 315; https://doi.org/10.3390/cryst10040315
Submission received: 25 March 2020 / Revised: 13 April 2020 / Accepted: 15 April 2020 / Published: 18 April 2020
(This article belongs to the Special Issue Early Career Stars of the Decade)

Abstract

:
We prepare a liquid crystal elastomer (LCE) with a spatially patterned liquid crystal director field from an all-acrylate LCE. Mechanical deformations of this material lead to a complex and spatially varying deformation with localised body rotations, shears and extensions. Together, these dictate the evolved shape of the deformed film. Using polarising microscopy, we map the local rotation of the liquid crystal director in Eulerian and Lagrangian frames and use these to determine rules for programming complex, stress-induced mechanical shape deformations of LCEs. Moreover, by applying a recently developed empirical model for the mechanical behaviour of our LCE, we predict the non-uniform stress distributions in our material. These results show the promise of empirical approaches to modelling the anisotropic and nonlinear mechanical responses of LCEs which will be important as the community moves toward realising real-world, LCE-based devices.

Graphical Abstract

1. Introduction

From skin to tree branches, many biological tissues exploit anisotropy and gradients in mechanical properties in order to achieve functionality [1,2,3,4]. In skin, the patterning of mechanical anisotropy allows the minimization of stresses when deformed through movement or the action of external forces [5]. In addition, softwood trees also use gradients in anisotropy in order to influence the bending direction of a growing branch [4,6,7].
By taking inspiration from nature, the performance and functionality of next generation robotics and biomedical devices could be improved by employing synthetic materials that mimic the gradients in mechanical properties and anisotropy of biological structures. Thanks to their inherent and spatially programmable anisotropy, Liquid Crystal Elastomers (LCEs) offer great promise for next generation bioinspired mechanical devices.
Nematic LCEs (the simplest type of LCEs) can be thought of as crosslinked rubber networks that are templated with anisotropic uniaxial order by the nematic phase of the constituent mesogenic groups. Compared to typical isotropic polymers and elastomers, nematic LCEs possess anisotropic polymer conformations which result in anisotropic mechanical properties and shape actuation behaviours [8]. The magnitude of the material anisotropy is dictated by the magnitude of the underlying nematic order. The special case of a LCE in its isotropic phase corresponds to a conventional elastomer with a spherical, isotropic rubber polymer conformation. For a nematic LCE, the coupling between polymer and nematic anisotropy enables the active shape actuation behaviour for which LCEs are most celebrated. However, this anisotropy also results in an anisotropic elastic modulus, load curve non-linearity and even negative Poisson’s ratio behaviour [9,10,11,12,13,14].
By spatially controlling the principal direction of LCE anisotropy—known as the “director”—mechanical properties can be spatially programmed [11]. Over the years numerous techniques for spatially controlling the director orientation in liquid crystalline systems have been developed [11,15,16,17,18,19,20,21,22]. For LCEs, the techniques of photoalignment and, more recently, 3D printing have proved the most powerful techniques in terms of resolution of director alignment and ease of use. In the majority of examples of LCEs programmed with complex director patterns, the aim has been to develop stimuli responsive shape actuators—particularly systems that change shape in response to external thermal, optical and electric fields. However, despite the promise LCEs show for creating bioinspired mechanical devices, we know of only two studies that consider the stress-induced mechanical properties and deformations of director patterned LCEs [11,23].
The first, published by Ware et al. in 2016, showed that complex director geometries can generate complex stress-induced mechanical deformations [11]. Despite the exciting results, the authors did not discuss in detail how the complex geometries were generated, how the director profile evolved during the deformation, and how the local stress distribution evolved with strain. The second, published by Godman et al. in 2017, focused on reporting a new LCE chemistry—photopolymerising a thiol-acrylate network via chain transfer [23]. The authors briefly discussed how a narrow film of LCE patterned in discrete blocks with director orientations between 90° and 0° (relative to the stress axis) preferentially undergoes deformation in the regions of greater initial director angle (as one intuitively expects of LCEs).
While both studies clearly demonstrated the power of controlling stress-induced mechanical deformations by localised patterning of the liquid crystal director, fundamental studies of the mechanics of these complex deformations were not undertaken. In designing and developing real-world devices, it will be important to understand and model how strains applied to complexly aligned LCE devices result in localised stresses, shears, rotations and deformations. A significant milestone would be the development of material models that enable the accurate simulation of such devices.
One of the barriers to understanding the deformations of director patterned LCEs is the inherent complexity of the anisotropic and non-linear mechanical behaviour of LCEs—for which a complete theoretical description does not yet exist. However, we recently reported an empirical model capable of predicting the tensile mechanical response of an acrylate-based LCE for a wide range of director configurations. Here, we study in detail the stress-induced mechanical deformation of a LCE prepared with a complex alignment that reflects a circular geometry. By studying how the magnitude of director rotation varies spatially, we deduce rules for how stress-induced complex shape deformations can be programmed via spatial patterning of the liquid crystal director. Moreover, by applying our empirical model, we can make a prediction of how stresses distribute themselves in the system studied. Our results demonstrate the promise of empirical approaches to model the non-trivial mechanical behaviours of LCEs. We envisage our results aiding the development of material models for simulation of LCE devices under strain and being applied to designing director profiles for LCE devices prepared via new manufacturing techniques such as Direct-Ink-Writing 3D printing [22,24,25,26].

2. Materials and Methods

2.1. Sample Preparation

The circularly aligned LCE was prepared using an all-acrylate LCE, as previously described [12]. A LCE monomer precursor was formed from 15 mol% 6-(4-cyano-biphenyl-4′-yloxy)hexyl acrylate (A6OCB CAS: 89823-23-4), 21 mol% 2-Ethylhexyl acrylate (EHA, CAS: 103-11-7), 7 mol% 1,4-Bis-[4-(6-acryloyloxyhex-yloxy)benzoyloxy]-2-methylbenzene (RM82, CAS: 125248-71-7), 56 mol% 4′-hexyloxybiphenyl (6OCB, CAS: 41424-11-7) and 1.6 mol% of the photoinitiator methyl benzoylformate (MBF, CAS: 15206-55-0). 6OCB is a non-reactive liquid crystal used to broaden the nematic phase range of the LCE precursor prior to polymerisation. A6OCB, 6OCB and RM82 were purchased from Synthon Chemical GmbH (Bitterfeld-Wolfen, Germany). EHA and MBF were purchased from Sigma Aldrich (Gillingham, UK). All chemicals were used as received without further purification. The chemical structures of each component are shown in Figure 1a.
The LCE precursor was filled at 40 °C (in the isotropic phase, TNI = 36 °C) into a liquid crystal cell formed from one glass and one 100 μm thick Melinex® substrates, separated with strips of 100 μm thick spacer film [12]. The flexible Melinex® substrate was chosen to aid opening of the cell following polymerisation. Prior to filling the cell, the substrates were coated with a poly(vinyl alcohol) alignment layer which was rubbed circularly, as illustrated in Figure S1, using a velvet cloth and a spin coater (substrate spun at 1500 rpm). The centres of the alignment pattern on each substrate were aligned to within 10 microns using registration marks.
Upon filling, the cells were cooled to ambient temperature and left for half an hour for alignment of the nematic phase. The reactive components of the precursor mixture were then polymerised using a fluorescent UV light source of 2.5 mW·cm−2 intensity and exposure time of 2 h (to ensure complete polymerisation of reactive components). Post polymerisation, 6OCB and any unreacted components were washed from the final LCE by swelling the film slightly in a solution of dicholoromethane:methanol in a 1:3 ratio for 2 h. The film was then dried at 60 °C overnight.
The removal of the unreactive nematic solvent, 6OCB, from the polymerised LCE caused the LCE to anisotropically deswell, i.e., the film de-swelled to a greater degree in the direction perpendicular to the director than parallel to the director. As the LCE’s director orientation followed concentric circles centred on a +1 defect, this anisotropic deswelling caused the film’s radius to contract by a greater fraction than the circumference thus creating a saddle-like geometry. As such, the final sample studied here, an 18 × 2 mm2 strip cut away from the central +1 defect (illustrated in Figure 1b), had a slight buckle which was flattened out by the first strain step of mechanical testing. Cutting the strip slightly away from the +1 defect not only gave a sample with a non-trivial alignment geometry, but doing so also minimised the effects that the unavoidable, but small uncertainty in registration of the cell substrates had on the director pattern. The initial width of the cut film was measured in four places, the average of which was 2.00 ± 0.03 mm. The film thickness varied linearly from 74 μm at one end to 84 μm at the other end (measured with a 1 µm accuracy micrometer). This small variation in thickness was an artefact of the fabrication technique.

2.2. Mechanical Testing

The aligned LCE film was mechanically tested using bespoke apparatus (built in-house, see Ref. [12] and accompanying Supplementary Materials) consisting of a temperature controlled micro-tensile enclosure which allowed the sample to be studied via transmitted white light and between crossed polarisers [12,13]. Sample photographs were captured using a 0.7× magnification lens and a 2048 × 2048 pixel camera system that together gave a pixel resolution of 7.9 μm. The clamped sample had an unstrained length of 13.7 mm and was extended in strain steps of 0.5 mm. Figure 1b illustrates the coordinate set used in this paper where strains are applied along the x axis and the xy plane is viewed using the camera. Throughout testing, the sample was maintained at 23 ± 1 °C.
After each strain step, the sample was allowed to stress relax for two minutes prior to any data being taken. Following stress relaxation, a load cell reading was taken and the sample was photographed once via transmitted white light and 36 times between crossed polarisers (polarisers rotated by 10° between photographs). The crossed polarising photographs were used to spatially map the local director orientation as described below.
A global engineering stress load curve (that determines the stresses using the initial, i.e., unstrained, cross sectional sample area irrespective of its change with strain) was generated using the average initial cross-sectional area (width = 2.00 ± 0.03 mm, thickness = 79 ± 5 μm), the load cell reading at each strain step and strains measured via the separation of the sample clamps.

2.3. Localised Strain Mapping

From each of the transmitted white light photographs, the pixel coordinates of small particles (synthesis artefacts common in LCEs) embedded within the film were measured. Localised strains were determined at each strain step from the relative x-axis separation of pairs of particles. In order to maximise the accuracy of the measured localised strains, pairs of features were chosen such that they had similar y coordinates, i.e., their separation vector lay almost parallel with strain (x) axis (see coordinate system in Figure 1b). Ideally, localised strain measurements would have been measured choosing features with as small as possible initial separations. However, as the position of a given particle could be typically determined to within 3 px, a minimum separation of 45 px was required for acceptable errors in strain measurement.

2.4. Localised Director Mapping

From the 36 crossed polarising photographs of the sample taken at each strain step, the local director orientation across the sample could be mapped in both the Eulerian (laboratory) and Lagrangian (sample) frames. The light transmitted by a birefringent material that is rotated between crossed polarisers takes the form of
I = I 0 s i n 2 ( 2 π × ( ϕ a ) 180 ) + b ,
where ϕ is the angle (in degrees) between the polariser and the strain (x) axis (by our definition), a is the angle (in degrees) between the director and strain axis, and I0 and b are constants related to the intensity of light and polarisers’ efficiency. Fitting Equation (1) (I against ϕ) to the localised intensity measured from the crossed polarising photographs therefore allows the determination (at the measured point) of a—the angle of the director relative to the straining axis. Given the four-fold degeneracy of Equation (1) and the fact that for the director orientation (denoted n ), n = n , the fitted value of a either corresponds to the director angle relative to the strain axis or the same angle +90°. We deduced the correct value of a from our knowledge of the initial alignment geometry instilled by the rubbed cell substrates, together with the assumption that the rotation of the local director with strain is continuous.
To deduce the localised director in the Eulerian frame at each strain step, the transmitted intensity was determined from the average brightness of 19 × 19 pixel regions of interest centred on the vertices of a 40 × 40 pixel grid laid across the sample (Figure S2). The fitted values were first corrected to account for the degeneracy described above. Any remaining anomalous values (i.e., those discontinuous with respect to values from the neighbouring vertices) were corrected using the average director angles from the neighbouring vertices.
To understand the LCE’s localised deformation behaviour we needed to determine the localised director rotation with respect to the Lagrangian (sample) frame. The tracked particles provided, for each strain step, Lagrangian frame coordinates on which to measure the average transmitted intensities and fit to using Equation (1). We determined the correct values of the director orientation (a) at each location by using the director orientation previously determined at the nearest Eulerian frame vertex as the initial value of the fitted parameter. The localised director rotations in the Lagrangian frame were then calculated from the difference between the measured director rotation at each strain step and that measured in the unstrained state.

2.5. Empirical Model Used for Analysis

For the LCE used in this study, we recently described an empirical model that accurately describes the uniaxial tension deformation behaviour of the LCE when stressed at initial angles, θi, of between 15° and 70° relative to the initial director orientation [14]. We found that, in these cases, the true stress—strain load curves (which take into account the change in cross sectional area with strain) take the form of:
σ T = σ E [ 1 + Δ ( ϵ ) ] = A log ( 1 + c [ ϵ i + Δ ( ϵ ) ] 1 d [ ϵ i + Δ ( ϵ ) ] 1 d ϵ i 1 + c ϵ i ) ,
where,
ϵ i = α θ i β
In these equations, σT is the expected true stress (in MPa), σE is the applied engineering stress, Δ(ϵ) is the applied strain, θi is the initial angle between the applied strain and the director orientation and A, c, d, α and β are material-specific constants, deduced by fitting, given in Table 1 (taken from [14]).
Using this model, we also found that the magnitude of director rotation, Δθ, is directly proportional to Δ(ϵ) via,
Δ θ = β Δ ( ϵ )
Here, we apply the equations deduced from this empirical model to the observed deformations in order to infer the localised stress distributions within the film as it is strained.

3. Results

In this section, we first present the raw data, with a brief discussion of some intuitively deduced behaviours, before subsequent analysis steps and deeper discussions that explore the deformation behaviour in greater detail.

3.1. Photographs of Sample Deformation

The sample was extended by 14 steps (of 0.5 mm) from its unstrained state before the film tore at one of the clamps. Figure 2 shows photographs of the sample at every other strain step. The first column of images shows the sample as seen via transmitted white light. These photographs show that the sample deforms inhomogeneously. The region which has deformed the least (herein referred to as the “prominence region”—shaded in red in Figure 3) corresponds to the stiffest part of the film. Overall, the film shape morphs from a rectangular to a complex shape, where the lower edge (as shown in the photographs) remains relatively straight while the top edge adopts a highly curved profile.

3.2. Localised Strains via Tracked Features

Figure 3 shows the trajectories of all the tracked particles overlaid onto the images of the film in both the unstrained and maximally states. The trajectories have been plotted with respect to the centre of the prominence region as this region of the film shows the most interesting shape evolution with strain. Figure 3 clearly shows that in the prominence region there is a large transverse displacement, indicating that the region is undergoing shear. To either side of the prominence region the particles have divergent and bending trajectories, implying that these regions are undergoing both shear and body rotations. Comparatively, on the far-right hand side of the film, the particles are moving in a uniform and parallel manner. Thus, in this region the film is primarily undergoing a linear strain with minimal shear. From now on, the far-right region of the film will be referred to as the “uniform” region (shaded blue in Figure 3) to reflect the deduced deformation behaviour.

3.3. Eulerian Frame Director Rotations

Figure 4a shows the Eulerian frame director mappings for every second strain step of the LCE. The heat map representation was chosen to visibly illustrate the spatial variation in director orientation at each strain step. The figure clearly shows that, in the uniform region, there is a large rotation of the director from angles (relative to the strain axis) of >45° to angles <45° between the unstrained and maximally strained states. In addition, as one should intuitively expect, the director orientation across the prominence region is largely parallel to the applied strain axis. As Figure 5 shows, this configuration corresponds to the stiffest LCE mechanical response [14].

3.4. Lagrangian Frame Director Rotations

Figure 4b shows, for every other strain step, heat maps for the Lagrangian frame director rotation. This representation quantifies the magnitude of local director rotation. The heat map was generated by interpolating the director rotations measured at the site of each tracked particle. By comparing with the initial director orientation map for the unstrained LCE shown in Figure 4a, we see that at up to a global strain of 0.3, the film region undergoing the greatest magnitude of director rotation is that which began with θi~45° (we define θi as a local value of the director angle in the unstrained film). For global strains greater than 0.3, the regions of greater θi begin to undergo greater magnitudes of director rotation. Our observation for the low strain behaviour is consistent with our previous results which have shown that the present LCE has its lowest initial modulus for θi = 45° [14]. Moreover, we have previously shown from Bladon, Warner and Terentjev theory that θi = 45° corresponds to the θi for which there is the greatest initial “rate” of director rotation with strain [27]. While the director in the θi~45° region initially rotates fastest, the regions of θi > 45° have a greater capacity for rotation and so ultimately undergo greater magnitudes of rotation.

4. Analysis and Discussion

In the following analysis we first use our results to understand how spatial director programming can be used to program complex stress-induced mechanical shape deformations of LCEs. We then apply our empirical model that describes uniaxial deformations of the present LCE to the deformation of this non-trivially aligned sample. Our aim is to use the model to generate realistic predictions of the localised stress distribution across the sample.

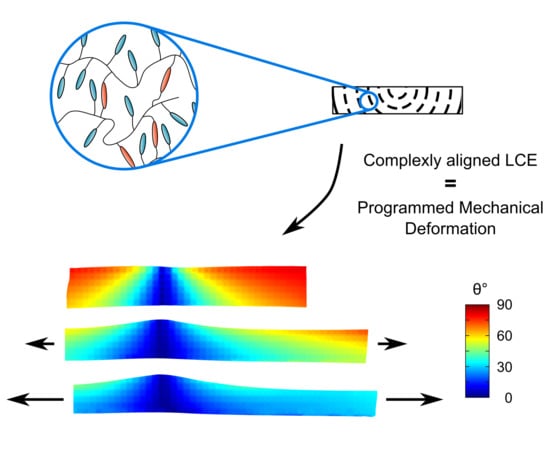
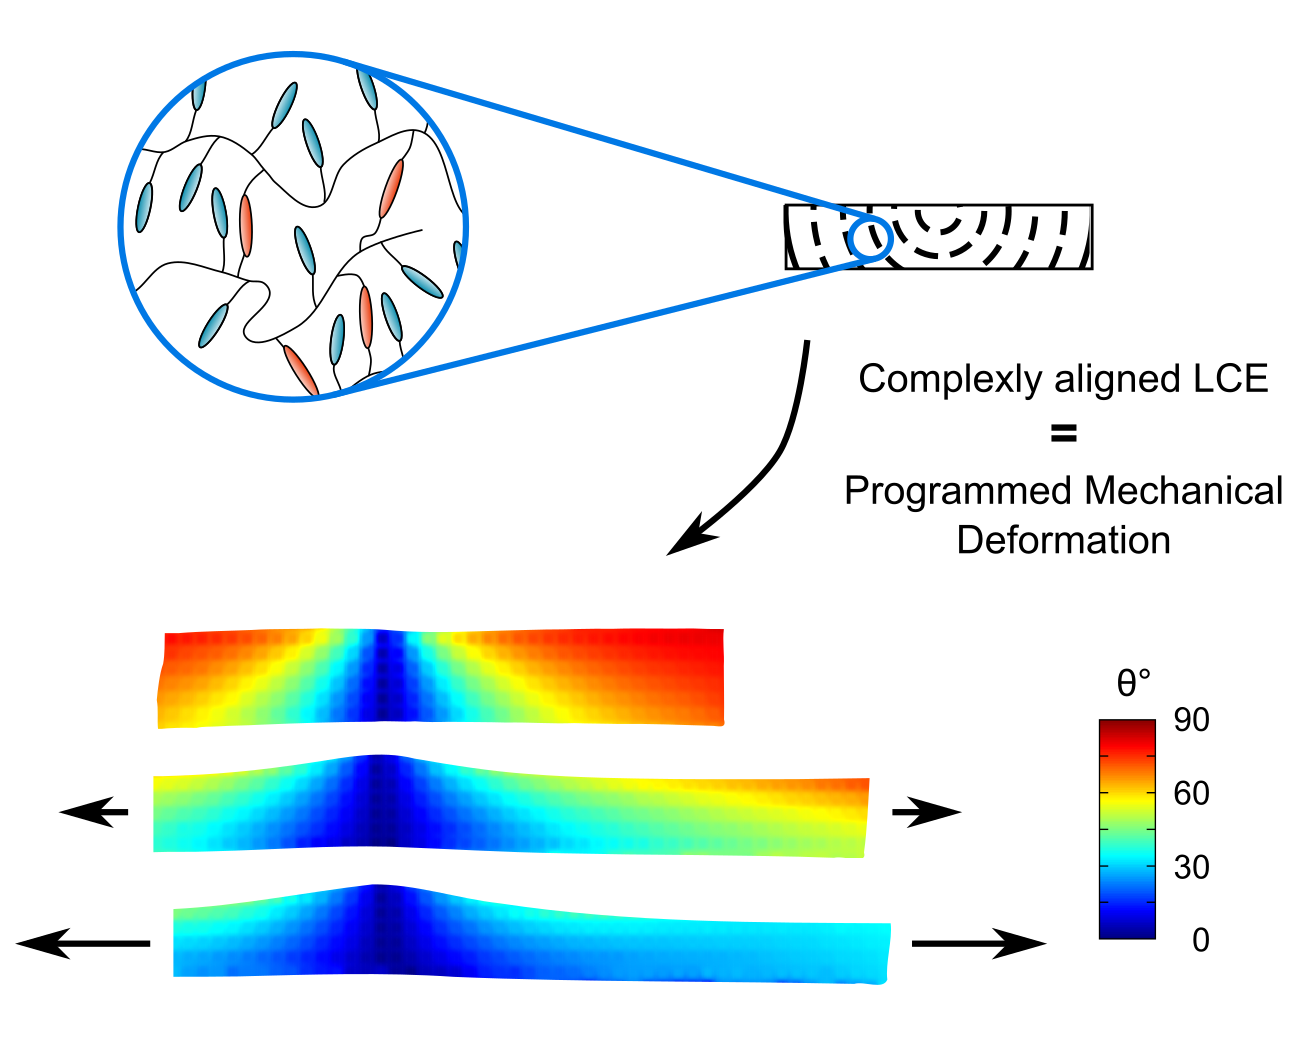
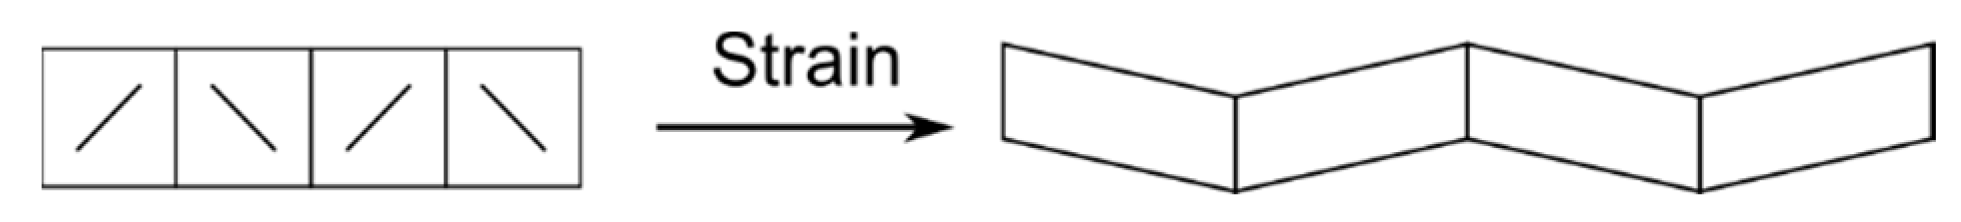
4.1. Designing Mechanical Deformations

The heat maps of Figure 4a show that to the left of the prominence region, the director rotates anticlockwise, while to the right it rotates clockwise. At the centre of the prominence region, there is zero director rotation as the director is already lying parallel to the applied stress axis. Replotting the deformation trajectories from Figure 3a over the unstrained sample’s director orientation map (Figure 6) shows that the result of these opposite senses of rotation is the transverse movement of the prominence region along the y axis. By comparison, in the uniform region, where there is only a single sense of director rotation, the deformation trajectories show that the sample undergoes minimal shear and instead predominantly deforms via a linear strain parallel to the applied strain axis.
By comparing the shape changes observed by Ware et al. (illustrated in Figure 7) with the present system we can learn how curvatures and shapes can be controlled and generated via patterning of the director.
The transverse deformations seen here are similar to those reported by Ware et al. who studied the deformation of a film of LCE prepared with the domains of director orientation alternating between ±45° relative to the strain axis (Figure 7) [11]. Although Ware et al. did not monitor the director orientation with strain, they deduced that the transverse shears that occurred and the zig-zag shape that evolved (Figure 7) were a result of the counter-rotation of the director between neighbouring domains.
Aside from the presence of transverse shearing, the shapes evolved by the Ware et al. sample and our own show several differences.
Firstly, the shape deformation reported here has a smooth, curved profile along its length and the width varies along the sample length. By comparison, the film of Ware et al. has straight edges which turn sharply, and the film width is constant along the sample length.
In addition, we observe that the evolved shape profiles of the top and bottom edges of the present sample differ from each other significantly. By comparison, the top and bottom edges of Ware et al.’s sample show identical profiles. Part of this difference is due to the variations in initial (magnitude of) director angle along the length of our sample. However, our ability to generate edges with different shape profiles stems from the fact that the director angle across a given section of the width varies by typically ~15°, whereas in Ware et al.’s film, the director is constant across any given width. We believe this reflects a spatially varying difference in the ability to generate transverse strains across a given width section—resulting in different profiles for the top and bottom edges. The degree to which these shape profiles differ between the top and bottom edges changes along the length of our LCE strip. The most dramatic shape profile difference is seen in the prominence region, while the uniform region shows almost identical shape profiles. We note that although the variation in director angle across any given film width section (aside from the centre of the prominence region) is typically ~15° (Figure 4a), the typical variation in sinθi across the film width in the prominence and uniform regions differs significantly. In the prominence region (Δ(sinθi)~sin30°–sin15°~0.24), which is more than twice of that in the uniform region (Δ(sinθi)~sin75°–sin60°~0.10).
From the observations and analysis of this paper, we can deduce that there are two key contributions to the evolution of strain-induced complex mechanical deformations—both of which depend on the initial director orientation. Firstly, patterning of the director results in spatial patterning of the non-linear mechanical response, which in turn generates complex shapes through non-uniform deformations. Secondly, patterning of director orientation also patterns the magnitude of local director rotation, which in turn generates complex shape changes through localised body rotations. The first of these effects can, to some extent, be achieved in other polymeric systems by utilising gradients in crosslink density. However, without the anisotropy present in LCEs, the local tensile response in such examples is clearly influenced by the crosslink density alone—the overall shapes of the local load curves in such systems are the same [28].
We propose that the effects of patterned modulus and director orientations together generate complex strain-induced mechanical deformations that can be summarised by the qualitative design rules given below. These are based upon the results of this study and our previous work studying this same LCE material [12,13,14].
Firstly, deformations transverse to the applied strain axis can be generated by body rotations of opposite sense by placing in series (relative to the applied strain axis) regions of opposite initial director orientation (i.e., ±θ). The magnitude of the transverse deformation increases as the inclination of the director angle relative to the strain axis increases from 0° (parallel to the axis of applied strain), as the capacity for director rotation increases. However, for our LCE we note that, at initial director angles close to 90° (perpendicular to the axis of applied strain), the elastic deformation of the polymer conformation dominates the rotation of the anisotropic polymer conformation [12,13,14]. We hypothesise that this would diminish the magnitude of the localised body rotations and hence the magnitude of the generated transverse displacement.
Secondly, curvature in the top edge of the stress-induced shape profile of the LCE strip considered here can be controlled by gradients in the director orientation (which in turn cause gradients in the non-linear elastic response). If the gradient in director modulus is parallel to the applied strain axis, then this causes a stress-induced curved shape profile in the direction parallel to the applied strain axis. Given the anisotropy in the mechanical behaviour, this necessitates the evolution of a non-uniform film width—i.e., inhomogeneous strains parallel and perpendicular to the applied strain axis.
Lastly, by considering again the deformation described by Ware et al.—i.e., a complex shape with transverse displacements, but with a uniform deformation due to a uniform magnitude of initial director orientation—we learn that we can confine curvatures of the stress-induced shape to the discontinuities of defect lines.

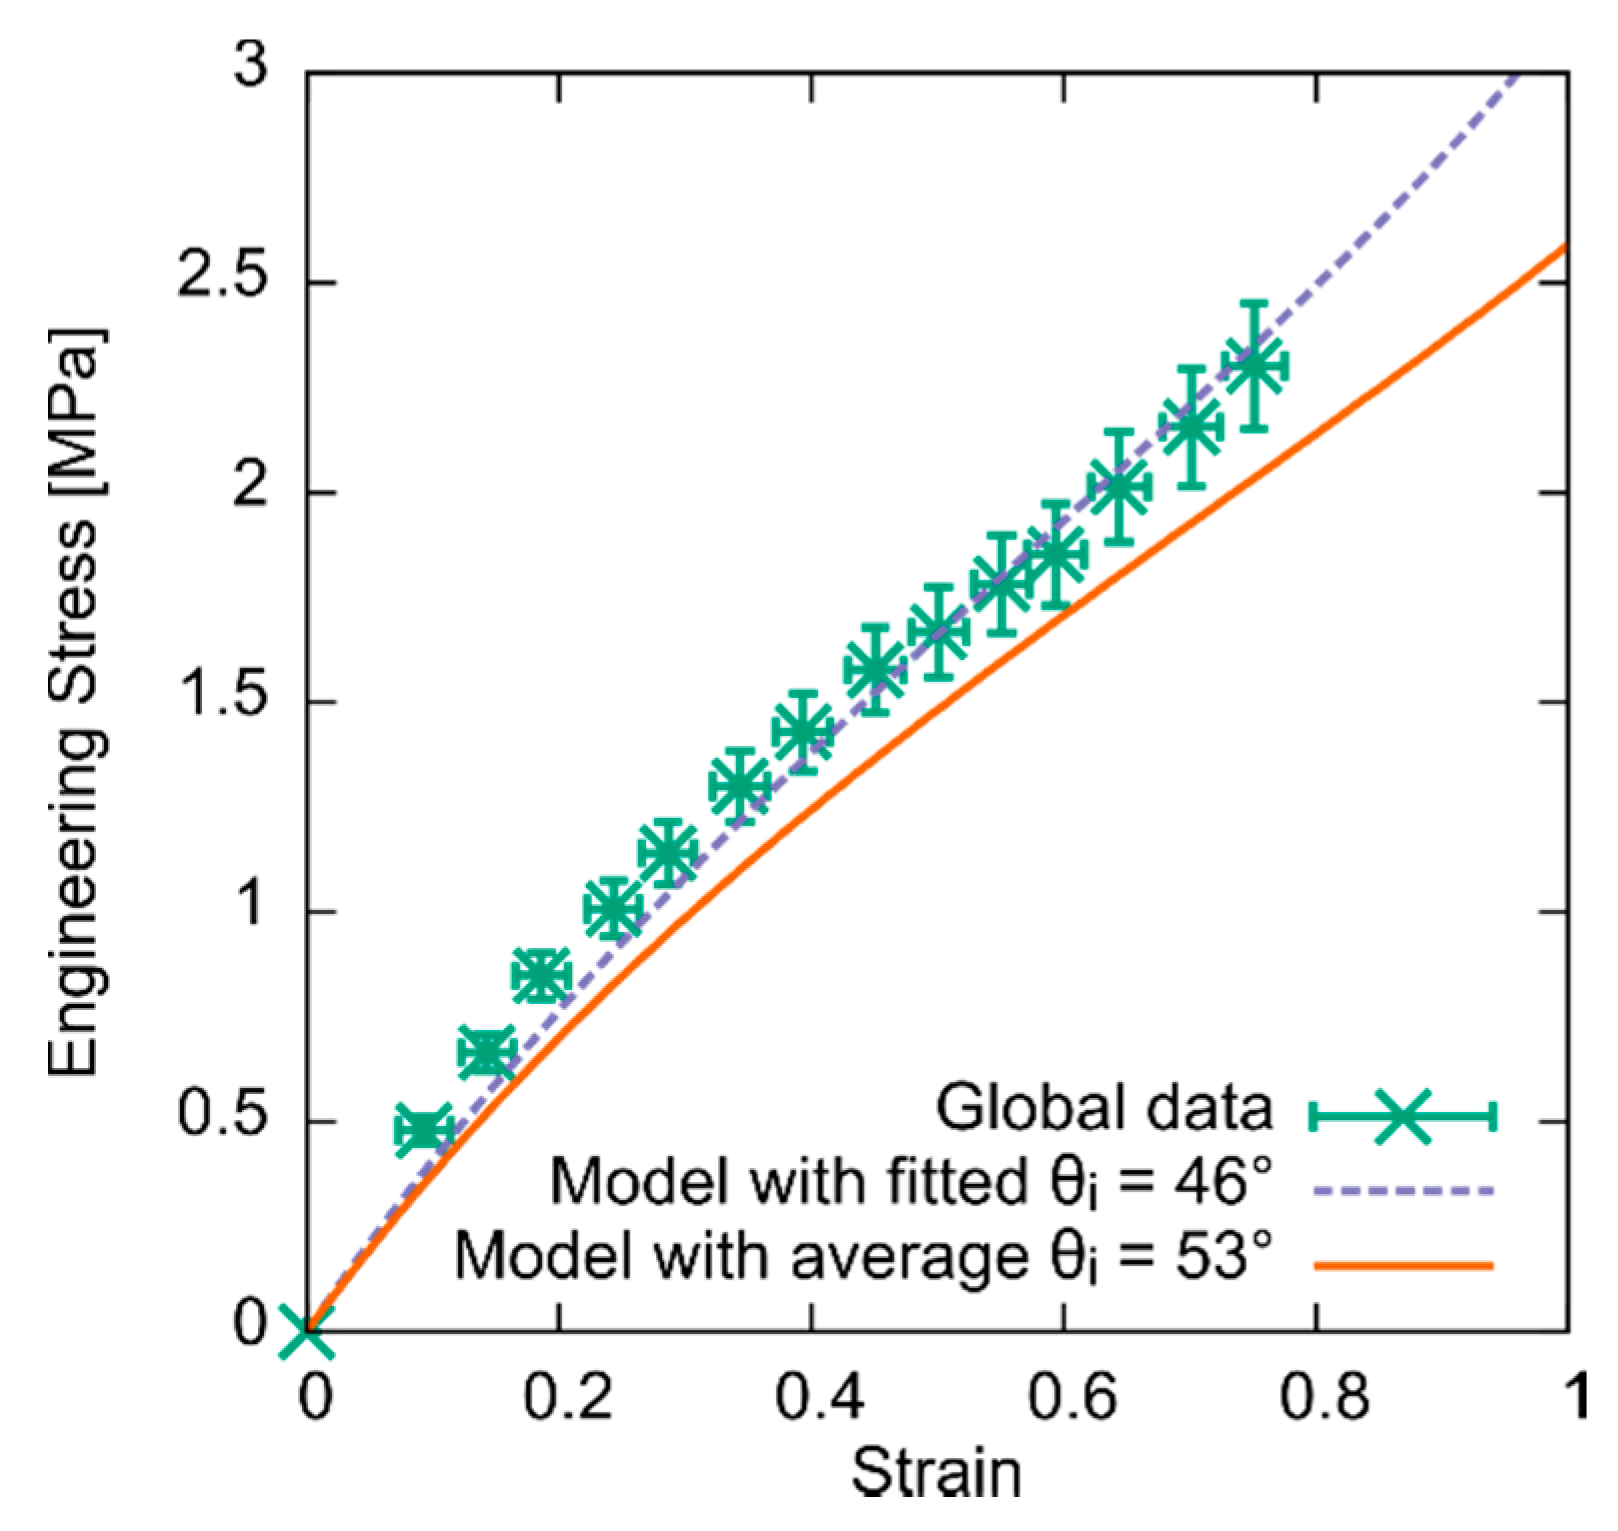
4.2. Global Engineering Load Curve

Despite the spatially dependent sample deformation, the engineering stress load curve is also interesting to study. Figure 8 shows the engineering stress tensile load curve for the deformed sample using the global strain, i.e., the strain measured using the sample clamp separation. The solid line of Figure 8 plots the model engineering stress load curve (Equation (2)) using an initial director angle of 53°—the average value of θi for the unstrained sample. The curve is remarkably similar to the experimental data, despite the fact that the director profile across the present sample is far from uniform. Thus, crude approximations of the overall film’s behaviour can be made from considering the average director angle across a sample of this LCE. In device considerations, this would be useful when constraints on the engineering stress or overall strain possible are known. The dashed plot in Figure 8 shows Equation (2) fitted to the data using the initial director angle as a free parameter. The resultant fitted angle of θi = 46° represents the best approximation of the film’s behaviour when modelled as a film of constant director orientation.

4.3. Predictions of the Localised Stress Distribution

While we can measure localised strains from the relative separation of tracked features, we cannot use these in conjunction with our load cell readings to deduce the localised stress distribution. Doing so would require the assumption that there is an even stress distribution across the cross-sectional widths at each point across the sample’s length—a generally invalid assumption given the spatial varying director (and hence modulus) distribution. Moreover, to deduce the localised true stress, one would need to employ an assumption of constant volume to calculate the cross-sectional area at a given strain step. This would be extremely difficult as local deformations are a combination of the local tensile and shear deformations.
We can, however, use our previously developed empirical model to predict the localised stress distribution. Using the locally measured initial director angles and Equation (2), we can generate predicted localised true stress load curves across the sample. Then, by using locally measured strains (particle pairs shown in Figure 9a) we can use these predicted load curves to calculate localised stresses. Figure S4 shows, for locations corresponding to each feature pair, predictions of the true stress load curves deduced using the initial director angle measured at the halfway point between the pairs of tracked features. For comparison, we also plot true stress load curves measured using load cell readings and the locally measured strains (see the Supplementary Materials for further details). While in the uniform region, the measured load curves agree well with the model, in the prominence region there is significant disagreement—a result of the assumptions needed to generate the experimental load curves as described above.
Previously, we showed that our empirical model was valid for initial director angles of between 15° and 70 °. Here, all the tracked feature pairs except pair D satisfy this limitation (initial and final average director angles for feature pair D of 15.2° and 5.78°, respectively). Feature pair D is, however, included as to provide some insight into the stress within the centre of the prominence region.
Figure 9b shows the prediction of the localised stress distribution generated for the last strain step using our empirical model and the locally measured strains. The interpolated heatmap shows that, in general, lower stresses are found in the prominence region compared to the uniform region. This is intuitive as the uniform region has undergone the greatest strain and therefore the greatest reduction in cross sectional area. Within the prominence region, the stress distribution varies between the upper and lower edges of the sample, with the lowest stresses found on the top edge of the sample either side of the prominence region centre. Such a distribution is expected as either side of the prominence centre the initial director angle varies from ~40° to ~5° from the top to bottom sample edges (Figure 9b). As the LCE shows a significantly stiffer response for director angles of 5° compared to 40°, it is plausible that stresses would be concentrated through the lower edge of the sample prominence region [14]. In the uniform region, the stress distribution is comparatively even despite there still being a varying director profile. This is accounted for the by the fact that the initial elastic modulus of the present material is comparatively uniform for director angles of between 40° and 90°—the range of director angles found within the uniform region.
The empirical model has evidently provided an intuitive and useful insight into the stress distributions across the complexly aligned LCE. We could generate stress distributions with increased accuracy if more data points were available on which to base the interpolation. This could be achieved using techniques such as Digital Image Correlation. From our empirical model we found that the magnitude of director rotation was directly proportional to the expected strain (Equation (4)). This relationship could therefore be used to infer strains from single points measured in the Eulerian frame—providing at least twice the number of data points to the method employed above. However, Figure S5 shows that, by the last strain step, the localised strains determined using Equation (4) were consistently overpredicted by a strain of 0.2 compared those directly measured and shown in Figure 9a. The reason for this is unknown, although we would suggest the coupling of director rotations and non-uniform stress distribution is likely to be a contributing factor.

5. Conclusions

In this paper we have sought to understand and demonstrate programmed stress-induced shape deformations and stress localisations in LCEs prepared with complex director profiles. Using simple methods, we have performed the most comprehensive analysis of the deformation geometry and localised director rotation behaviour of a non-trivially aligned LCE with a director profile reflecting a circular alignment pattern.
By comparing the evolved shape profile observed here with those reported by Ware et al., we have shown that the stress-induced deformation behaviour of complexly aligned LCEs follows relatively simple, intuitive, qualitative design rules. Further, by using our empirical model to develop a picture of how stresses are localised across the deformed sample, we have seen how non-uniform director profiles can be used to localise areas of stress in strained LCE devices. While our predictions of the localised stress reflect intuitive expectations, the approach is limited by the fact that we cannot generate predictions of local stress in the centre of the prominence region as the initial director there is ≤15°. Despite this restriction, the results demonstrate that the model can be used effectively to understand the complex mechanical deformations of director patterned LCEs.
This study has shown that the complicated stress-induced mechanical deformations of LCEs can be understood using intuitive design rules and empirical models. We suggest that these qualitative design rules and empirical approaches could aid the future development of material models of LCEs. In turn, these could enable the design and simulation of LCE-based mechanical devices via simulation techniques such as Finite Element Analysis.

Supplementary Materials

The following are available online at https://www.mdpi.com/2073-4352/10/4/315/s1, Figure S1: Circular alignment generation, Figure S2: Example grid overlay for measuring the local director. Figure S3: Localised load curves, Figure S4: Comparing model and actual local director rotations.

Author Contributions

Conceptualisation, D.M. and H.F.G.; methodology, D.M. and H.F.G.; validation, D.M. and H.F.G.; formal analysis, D.M.; resources, D.M. and H.F.G.; data curation, D.M. and H.F.G.; writing—original draft presentation, D.M.; writing—reviewing and editing, D.M. and H.F.G.; supervision, H.F.G.; project administration, H.F.G.; funding acquisition, D.M. & H.F.G. All authors have read and agreed to the published version of the manuscript.

Funding

D. Mistry thanks UltraVision CLPL and the EPSRC, grant number 1611009, for the awarding of a CASE PhD studentship, the Royal Commission for the Exhibition of 1851 for the awarding of an Industrial Fellowship, and the English Speaking Union for the awarding of a Lindemann Trust Fellowship.

Acknowledgments

The authors thank T. Haynes and P. Thornton for building the bespoke apparatus.

Conflicts of Interest

The authors declare no conflict of interest.

References

  1. Yao, H.; Dao, M.; Carnelli, D.; Tai, K.; Ortiz, C. Size-dependent heterogeneity benefits the mechanical performance of bone. J. Mech. Phys. Solids 2011, 59, 64–74. [Google Scholar] [CrossRef]
  2. Yakubov, G.E.; Bonilla, M.R.; Chen, H.; Doblin, M.S.; Bacic, A.; Gidley, M.J.; Stokes, J.R. Mapping nano-scale mechanical heterogeneity of primary plant cell walls. J. Exp. Bot. 2016, 67, 2799–2816. [Google Scholar] [CrossRef] [PubMed] [Green Version]
  3. Raabe, D.; Sachs, C.; Romano, P. The crustacean exoskeleton as an example of a structurally and mechanically graded biological nanocomposite material. Acta Mater. 2005, 53, 4281–4292. [Google Scholar] [CrossRef]
  4. Liu, Z.; Meyers, M.A.; Zhang, Z.; Ritchie, R.O. Functional gradients and heterogeneities in biological materials: Design principles, functions, and bioinspired applications. Prog. Mater. Sci. 2017, 88, 467–498. [Google Scholar] [CrossRef]
  5. Wong, R.; Geyer, S.; Weninger, W.; Guimberteau, J.C.; Wong, J.K. The dynamic anatomy and patterning of skin. Exp. Dermatol. 2016, 25, 92–98. [Google Scholar] [CrossRef] [Green Version]
  6. Burgert, I.; Eder, M.; Gierlinger, N.; Fratzl, P. Tensile and compressive stresses in tracheids are induced by swelling based on geometrical constraints of the wood cell. Planta 2007, 226, 981–987. [Google Scholar] [CrossRef]
  7. Färber, H.; Lichtenegger, H.C.; Reiterer, A.; Stanzl-Tschegg, S.; Fratzl, P. Cellulose microfibril angles in a spruce branch. J. Mater. Sci. 2001, 36, 5087–5092. [Google Scholar] [CrossRef]
  8. Warner, M.; Terentjev, E.M. Liquid Crystal Elastomers; Clarendon Press: Oxford, UK, 2013; ISBN 9788578110796. [Google Scholar]
  9. Finkelmann, H.; Greve, A.; Warner, M. The elastic anisotropy of nematic elastomers. Eur. Phys. J. E 2001, 5, 281–293. [Google Scholar] [CrossRef]
  10. Clarke, S.M.; Tajbakhsh, A.R.; Terentjev, E.M.; Warner, M. Anomalous viscoelastic response of nematic elastomers. Phys. Rev. Lett. 2001, 86, 4044–4047. [Google Scholar] [CrossRef]
  11. Ware, T.H.; Biggins, J.S.; Shick, A.F.; Warner, M.; White, T.J. Localized soft elasticity in liquid crystal elastomers. Nat. Commun. 2016, 7, 10781. [Google Scholar] [CrossRef]
  12. Mistry, D.; Morgan, P.B.; Clamp, J.H.; Gleeson, H.F. New insights into the nature of semi-soft elasticity and “mechanical-Fréedericksz transitions” in liquid crystal elastomers. Soft Matter 2018, 14, 1301–1310. [Google Scholar] [CrossRef] [PubMed] [Green Version]
  13. Mistry, D.; Connell, S.D.; Mickthwaite, S.L.; Morgan, P.B.; Clamp, J.H.; Gleeson, H.F. Coincident molecular auxeticity and negative order parameter in a liquid crystal elastomer. Nat. Commun. 2018, 9, 5095. [Google Scholar] [CrossRef] [PubMed] [Green Version]
  14. Mistry, D.; Gleeson, H.F. Mechanical deformations of a liquid crystal elastomer at director angles between 0° and 90°: Deducing an empirical model encompassing anisotropic nonlinearity. J. Polym. Sci. Part B Polym. Phys. 2019, 57, 1367–1377. [Google Scholar] [CrossRef] [Green Version]
  15. de Haan, L.T.; Sánchez-Somolinos, C.; Bastiaansen, C.M.W.; Schenning, A.P.H.J.; Broer, D.J. Engineering of Complex Order and the Macroscopic Deformation of Liquid Crystal Polymer Networks. Angew. Chem. Int. Ed. 2012, 51, 12469–12472. [Google Scholar] [CrossRef] [PubMed]
  16. McConney, M.E.; Martinez, A.; Tondiglia, V.P.; Lee, K.M.; Langley, D.; Smalyukh, I.I.; White, T.J. Topography from Topology: Photoinduced Surface Features Generated in Liquid Crystal Polymer Networks. Adv. Mater. 2013, 25, 5880–5885. [Google Scholar] [CrossRef] [PubMed]
  17. Schuhladen, S.; Preller, F.; Rix, R.; Petsch, S.; Zentel, R.; Zappe, H. Iris-Like Tunable Aperture Employing Liquid-Crystal Elastomers. Adv. Mater. 2014, 26, 7247–7251. [Google Scholar] [CrossRef]
  18. Ahn, C.; Liang, X.; Cai, S. Inhomogeneous stretch induced patterning of molecular orientation in liquid crystal elastomers. Extrem. Mech. Lett. 2015, 5, 30–36. [Google Scholar] [CrossRef]
  19. Xia, Y.; Cedillo-Servin, G.; Kamien, R.D.; Yang, S. Guided Folding of Nematic Liquid Crystal Elastomer Sheets into 3D via Patterned 1D Microchannels. Adv. Mater. 2016, 28, 9637–9643. [Google Scholar] [CrossRef]
  20. Di Chen, Y.; Fuh, A.Y.G.; Liu, C.K.; Cheng, K.T. Radial liquid crystal alignment based on circular rubbing of a substrate coated with poly(N-vinyl carbazole) film. J. Phys. D Appl. Phys. 2011, 44, 215304. [Google Scholar] [CrossRef]
  21. Bailey, J.; Kaur, S.; Morgan, P.B.; Gleeson, H.F.; Clamp, J.H.; Jones, J.C. Design considerations for liquid crystal contact lenses. J. Phys. D Appl. Phys. 2017, 50, 485401. [Google Scholar] [CrossRef]
  22. Ambulo, C.P.; Burroughs, J.J.; Boothby, J.M.; Kim, H.; Shankar, M.R.; Ware, T.H. Four-dimensional Printing of Liquid Crystal Elastomers. ACS Appl. Mater. Interfaces 2017, 9, 37332–37339. [Google Scholar] [CrossRef] [PubMed]
  23. Godman, N.P.; Kowalski, B.A.; Auguste, A.D.; Koerner, H.; White, T.J. Synthesis of Elastomeric Liquid Crystalline Polymer Networks via Chain Transfer. ACS Macro Lett. 2017, 6, 1290–1295. [Google Scholar] [CrossRef]
  24. Kotikian, A.; Truby, R.L.; Boley, J.W.; White, T.J.; Lewis, J.A. 3D Printing of Liquid Crystal Elastomeric Actuators with Spatially Programed Nematic Order. Adv. Mater. 2018, 30, 1706164. [Google Scholar] [CrossRef] [PubMed]
  25. López-Valdeolivas, M.; Liu, D.; Broer, D.J.; Sánchez-Somolinos, C. 4D Printed Actuators with Soft-Robotic Functions. Macromol. Rapid Commun. 2018, 39, 3–9. [Google Scholar] [CrossRef]
  26. Volpe, R.H.; Mistry, D.; Patel, V.V.; Patel, R.R.; Yakacki, C.M. Dynamically Crystalizing Liquid-Crystal Elastomers for an Expandable Endplate-Conforming Interbody Fusion Cage. Adv. Healthc. Mater. 2020, 9, 1901136. [Google Scholar] [CrossRef]
  27. Bladon, P.; Terentjev, E.; Warner, M. Deformation-induced orientational transitions in liquid crystals elastomer. J. Phys. II 1994, 4, 75–91. [Google Scholar] [CrossRef]
  28. Cotton, D.P.J.; Popel, A.; Graz, I.M.; Lacour, S.P. Photopatterning the mechanical properties of polydimethylsiloxane films. J. Appl. Phys. 2011, 109, 054905. [Google Scholar] [CrossRef]
Figure 1. (a) Diagrams of the chemicals used in this work. (b) Films of complex alignment are prepared by cutting a strip from the circularly aligned LCE away from the central +1 defect. If the cut included the defect, then the director orientation would largely be close to ~90° across the whole film.
Crystals 10 00315 g001
Figure 2. Selected photographs of the sample at every other stage of the deformation. The sample clamps are clearly visible in the top left image and disappear out of view as the strain is increased.
Crystals 10 00315 g002
Figure 3. Trajectories of tracked featured with strain overlaid on top of the sample in (a) the unstrained and (b) the maximally strained states. The initial positions of the tracked particles in each strain state are illustrated by the solid circles. The trajectories and images and have been displaced such that they centre on the middle of the prominence region, making the localised deformation in this region clear. The red (blue) shaded regions correspond to the “prominence” (“uniform”) region.
Crystals 10 00315 g003
Figure 4. (a) Eulerian frame director distribution maps at every other strain step. 0° is defined by the applied strain axis. (b) Interpolated heat maps of the magnitude of director reorientation in the Lagrangian frame using the director angle measured at the location of features tracked with strain.
Crystals 10 00315 g004
Figure 5. Load curves for samples of homogeneously aligned LCE with a single uniaxial orientation of the director stressed at 2°, 39° and 88° to the initial director orientation, θi. Full data sets can be seen in Ref. [14]. These illustrative curves illustrate the variation in stiffness depending on the relative orientation of the director and strain.
Crystals 10 00315 g005
Figure 6. Tracked particle trajectories and quiver plot of initial director orientations overlaid on top of a photograph of the unstrained film.
Crystals 10 00315 g006
Figure 7. Illustration of the complex deformation behaviour for a director-patterned LCE reported by Ware et al [11].
Crystals 10 00315 g007
Figure 8. Engineering tensile load curve of the sample based on the strain measured by the separation distance between the sample clamps. The curves plotted have the form of Equation (2), rearranged for the engineering stress. The solid line uses a value of θi based on the average director angle of the unstrained sample. The dashed line has been fitted to the data for the initial director angle.
Crystals 10 00315 g008
Figure 9. (a) Map of pairs of tracked features between which localised strains are measured for use in generating (b), the prediction of the stress distribution across the film in the maximally strained state.
Crystals 10 00315 g009
Table 1. Parameters from the previously described empirical model, used in Equations (2)–(4).
ConstantValue
A4.39 MPa
c0.426
d0.444
α60.5°
β27.6°

