Article

Synthesis of Carbon Onion and Its Application as a Porous Carrier for Amorphous Drug Delivery

1
Aston Pharmacy School, School of Life and Health Sciences, Aston University, Birmingham B4 7ET, UK
2
School of Engineering and Applied Science, Aston University, Birmingham B4 7ET, UK
3
School of Engineering, University of Leicester, Leicester LE1 7RH, UK
4
State Key Laboratory of Quality Research in Chinese Medicine, Institute of Chinese Medical Sciences (ICMS), University of Macau, Macau, China
*
Author to whom correspondence should be addressed.
Crystals 2020, 10(4), 281; https://doi.org/10.3390/cryst10040281
Submission received: 7 February 2020 / Revised: 2 April 2020 / Accepted: 3 April 2020 / Published: 7 April 2020

Abstract

:
Given the great potential of porous carrier-based drug delivery for stabilising the amorphous form of drugs and enhancing dissolution profiles, this work is focussed on the synthesis and application of carbon onion or onion-like carbon (OLC) as a porous carrier for oral amorphous drug delivery, using paracetamol (PA) and ibuprofen (IBU) as model drugs. Annealing of nanodiamonds at 1100 °C produced OLC with a diamond core that exhibited low cytotoxicity on Caco-2 cells. Solution adsorption followed by centrifugation was used for drug loading and results indicated that the initial concentration of drug in the loading solution needs to be kept below 11.5% PA and 20.7% IBU to achieve complete amorphous loading. Also, no chemical interactions between the drug and OLC could be detected, indicating the safety of loading into OLC without changing the chemical nature of the drug. Drug release was complete in the presence of sodium dodecyl sulphate (SDS) and was faster compared to the pure crystalline drug, indicating the potential of OLC as an amorphous drug carrier.

1. Introduction

Poor solubility and dissolution of drugs have necessitated the formulation of drugs with more than the required dose, leading to economic wastage and an increased risk of toxicity [1,2]. Hence, it is very important for pharmaceutical scientists to develop effective techniques to improve the solubility and dissolution behaviour of poorly water-soluble drugs.
Several studies have been performed to enhance solubility of drugs and, in recent years, adsorption of drugs onto porous materials/adsorbents to produce stabilised amorphous drugs has attracted increasing interest [3,4,5]. Unlike crystalline forms that have a long range molecular order, amorphous forms of drugs lack three-dimensional molecular order, resulting in higher solubility,. However, amorphous forms have poor stability and often tend to convert back to crystalline forms, which is a major obstacle to formulation [6]. Loading of drugs into the pores of a carrier via adsorption restricts the crystallisation of the drug, resulting in a stable amorphous form. In addition to stabilisation, adsorption of drugs onto porous carrier increases the effective surface area of the drug that is in contact with the dissolution media, resulting in higher solubility [7,8]. Various inorganic and organic nanocarriers with suitable porosity were investigated. From organic nanocarriers, cubosomes, hexosomes and spongosomes are interesting and offer high internal channels and porosity to load with amorphous drugs [9].
Recently, carbon-based materials with aggregate created porosity, such as nanodiamonds (NDs, often obtained using detonation processes with TNT in a closed chamber offering oxygen-deficient atmosphere and narrow particle distribution), fullerenes, and carbon nanotubes (CNTs), have been studied as potential drug carriers via physical adsorption [10,11,12]; however, the application of these materials in drug delivery is often associated with limitations, such as: 1) requirement of incorporating functional groups in NDs to improve the interaction between the drug and ND [10,13,14]; 2) complicated synthesis of fullerenes with very low purity and yield [15,16]; and 3) toxicity concerns about CNTs [17].
Carbon onion or onion-like carbon (OLC) can overcome the aforementioned limitations by its ability to facilitate stronger π-π interactions between the aromatic groups of the drug and the graphene rings of OLC [18,19,20], without the need of functionalisation. In addition, OLC can be prepared in large quantities via annealing of NDs and there are no reports indicating any significant toxicity of OLC [21,22,23]. Also, OLC undergoes aggregation, resulting in aggregate created mesoporosity with some microporosity [18,21]. The developed porosity of OLC aggregates and the possible π-π interactions can be advantageous for drug adsorption; therefore, exploring the potential of OLC as a carrier for amorphous drug delivery is of great interest and several studies already demonstrated promising properties for biological and biomedical applications [24,25,26,27,28,29,30].
Annealing of NDs at high temperatures (>1300 °C) is the most widely reported method for the synthesis of OLC. However, such high temperature annealing poses a risk of formation of graphitic ribbons and other bulk graphitic structures, which adversely affects the synthesis of OLC, especially for synthesis under a controlled gaseous atmosphere instead of vacuum [21,31,32]. To overcome the disadvantages, such as high energy consumption and formation of large graphitic particles, OLC were synthesised by annealing NDs at 1100 °C in this study; according to previous studies [21,31,32], thermal annealing at such temperatures does not induce the formation of large graphitic structures, such as graphitic ribbons. Paracetamol (PA) and ibuprofen (IBU) were used as model drugs to investigate the adsorption of drugs onto OLC.

2. Materials and Methods

2.1. Materials

Nanodiamond (ND) powder (particle size <10 nm, purity ≥97%) and paracetamol powder (purity 98–102%) were purchased from Sigma-Aldrich (Gillingham, UK). Ibuprofen powder (purity 99%) was purchased from Discovery Fine Chemicals (Wimborne, UK). Ethanol, dimethyl sulfoxide, sodium dodecyl sulphate, sodium dihydrogen phosphate and disodium hydrogen phosphate were purchased from Fisher Scientific (Loughborough, UK). Caco-2 cells were purchased from ATCC. Dulbecco’s Modified Eagles Medium (DMEM, with 4500 mg/L glucose, L-glutamine, sodium pyruvate, sodium bicarbonate, amino acids and vitamins), foetal bovine serum, trypsin-EDTA solution, anti-mycotic solution (with 10,000 units penicillin, 10 mg streptomycin and 25 μg amphotericin B per mL), Hank’s balanced salt solution, MTT dye, phosphate buffered saline, trypan blue were purchased from Sigma-Aldrich.

2.2. Preparation of Carbon Onions from Thermal Annealing of Detonation Nanodiamonds

Nanodiamond powder (100 mg) was placed in a quartz crucible and thermally annealed to 1100 °C at a heating rate of 5 °C/min in a carbolite TZF furnace, under a flowing nitrogen atmosphere. The sample was held for 0.5 h at temperatures of 350 and 700 °C, to remove adsorbed water molecules and acidic groups, respectively [14], and was then held for 2 h at 1100 °C. After the thermal treatment, the annealed sample was allowed to cool down to room temperature under nitrogen atmosphere and was referred to as carbon onion or onion-like carbon (OLC).

2.3. Physico-Chemical Characterisation

Scanning electron microscopy (SEM) images were recorded with an XL30 ESEM-FEG (Philips, Amsterdam, The Netherlands) at an acceleration voltage of 10 kV.
High-resolution transmission electron microscope (HRTEM) images were recorded using a 2010F microscope (JEOL, Welwyn Garden City, UK) operating at 200 kV and using an Ultrascan 4K camera (Gatan, Pleasanton, CA, USA). Prior to analysis, the sample powders were suspended in ethanol and sonicated for 1 hour to separate agglomerates. Five µL of the suspension was allowed to dry onto a lacey carbon grid.
Raman spectroscopy was used to investigate the transformation of ND to OLC (graphitisation). Spectra were measured on an InVia Raman microscope (Renishaw, Wotton-under-Edg, UK) equipped with a 532 nm excitation source. The acquisition time was 10 seconds and 3 accumulations were recorded. The peak positions and peak full width at half maximum (FWHM) were determined by fitting spectra with a Gaussian line shape using Origin software (OriginLab, Northampton, MA, USA).
The surface chemical composition and sp3/sp2 bonding ratio was determined by X-ray photoelectron spectroscopy (XPS) using an ESCALAB 250 electron spectrometer (Fisher Scientific, Loughborough, UK). Analysis conditions include X-ray source with excitation energy of 15 KeV, pass energy of 20 eV with a step size of 0.1 eV, dwell time of 50 ms and X-ray spot size of 500 µm. The samples were placed on an adhesive copper plate at a chamber pressure of 5 × 10⁻¹⁰ mbar during the analysis. X-ray excited Auger peaks (C KLL) at higher binding energy were analysed to obtain carbon phase information.
Particle size analysis of OLC was performed using HELOS/BR Laser diffractometer (Sympatec GmbH, Ausburg, Germany). 0.5% (w/v) OLC suspension was prepared in ethanol and was analysed for particle size in the measuring range of 0.1 to 500 µm.

2.4. Cytotoxicity Assay

In vitro cytotoxicity studies of OLC were performed with human colon carcinoma cells (Caco-2 Cells) that were grown in DMEM supplemented with 10% FBS, 1% L-glutamine and 1% antimycotic solution. Cells between passages 100 and 120 were used in the experiments. Cell suspension of 104 cells/mL was added to 96 well plates at 100 µL per well and incubated for 24 h. The medium was then replaced with medium containing different concentrations of OLC (10-800 µg/mL) at 100 µL/well and incubated for further 24 h. Caco-2 cells without OLC added was used as a control. After 24 h of incubation, the medium was removed and the cells were washed with PBS to remove any adhered OLC particles. One hundred µL of fresh medium and 20 µL of 5 mg/mL MTT in PBS solution was added to each well and incubated for 4 h. To determine the cell viability, MTT containing medium was replaced with 100 µL DMSO and the absorbance of the resulting formazan solution was determined at 492 nm on a SynergyTM HT microplate reader (Bio-Rad, Hercules, CA, USA).

2.5. Preparation of Drug Loaded Carbon Onion and Determination of Drug Loading Efficiency

Solution adsorption is a commonly used method for drug loading in to a porous carrier, where the carrier is immersed in a saturated drug solution for a specific duration [33]. Drug loadings were performed using three different drug concentrations (concentrations of 50, 100, 150 mg of PA per mL of ethanol and concentrations of 300, 500 and 698 mg of IBU per mL of ethanol). 100 mg of OLC was added to 10 mL of drug solution and was allowed to undergo stirring (100 rpm) at 20 °C for 1 hour. The dispersion was centrifuged at 1500 rpm and the supernatant was collected for further analysis. The sediment was allowed to dry in an oven at 40 °C for 24 h. Details of drug loading method were described in our previous work [34].
Drug loading efficiency was determined by UV spectroscopy (Jenway, Stone, UK). Fifty mg of drug loaded carbon onion (drug/OLC) complex was added to 50 mL of ethanol and was stirred for 24 h at 25 °C. The solution was filtered and the concentration of the drug in the filtrate was determined. Loading efficiency of OLC was calculated using Equation (1):
Loading efficiency (%) = (weight of the drug in complex / weight of complex) × 100

2.6. Characterisation of Drug Loaded Carbon Onion Complex

To investigate the solid state characteristics of the drug in drug/OLC complex, XRD patterns were recorded on a D8 ADVANCE diffractometer (Bruker, Billerica, MA, USA) in the angular range of 10° to 50° (2θ) with a step size of 0.02°, using a Cu–Kα source operated at 30 kV and 30 mA.
The presence of crystalline drug can be detected from the melting peak of DSC curves. DSC analysis was performed using a Q100 DSC (TA Instruments, Leatherhead, UK). Sample (2–3 mg) was transferred to a Tzero aluminium pan and temperature scan was performed at a heating rate of 10 °C/min under nitrogen gas.
FTIR was used to investigate the surface chemistry of OLC and to identify possible interactions between the drug and OLC. Studies were performed using a Nicolet iS5 spectrometer (Fisher Scientific, Loughborough, UK) equipped with an iD5 ATR accessory with a laminated diamond crystal at an angle of incidence of 42°. The spectra were obtained in the range of 500–4000 cm−1 (wavenumber) at a spatial resolution of 4 cm−1 and were an average of 16 scans.
The porosity of the carrier before and after drug loading was investigated by nitrogen adsorption technique using a Micrometrics Accelerated Surface Area and Porosimetry (ASAP) 2420 system (Micrometrics, Norcross, GA, USA). Adsorption-desorption isotherms were obtained at 77 K in the relative pressure range between 0.01 and 0.9. Prior to analysis, all samples were degassed at 40 °C for 24 h. Pore size distribution was computed with the ASAP 2420 software using non-local density functional theory (NLDFT) model assuming slit-shaped pores

2.7. Drug Release Studies

Drug release studies were performed at 37 °C using a USP Type II dissolution apparatus (Erweka GmbH, Langen, Germany). Sample powders were filled in hard gelatin capsules (size 000) prior to analysis and 900 mL of 0.1M sodium phosphate buffer of pH 5.8 and pH 7.2 was used as dissolution media for paracetamol and ibuprofen, respectively. Dissolution was performed at paddle stirring speed of 100 rpm with and without 1% w/v sodium dodecyl sulfate (SDS) added to the medium. 5 mL samples were withdrawn at specific time intervals and replaced with fresh dissolution medium. The withdrawn samples were filtered using 0.2 µm syringe filters and analysed using UV spectrophotometry (Jenway) at wavelengths of 257 nm and 264 nm for paracetamol and ibuprofen, respectively.

2.8. Statistical Analysis

Statistical analysis was carried out on the data using GraphPad Prism software (Version 6.0 for Windows, GraphPad Software, San Diego, CA, USA). Statistically significant differences were denoted for p values of less than 0.05.

3. Results and Discussion

3.1. Characterisation of Annealed Nanodiamonds

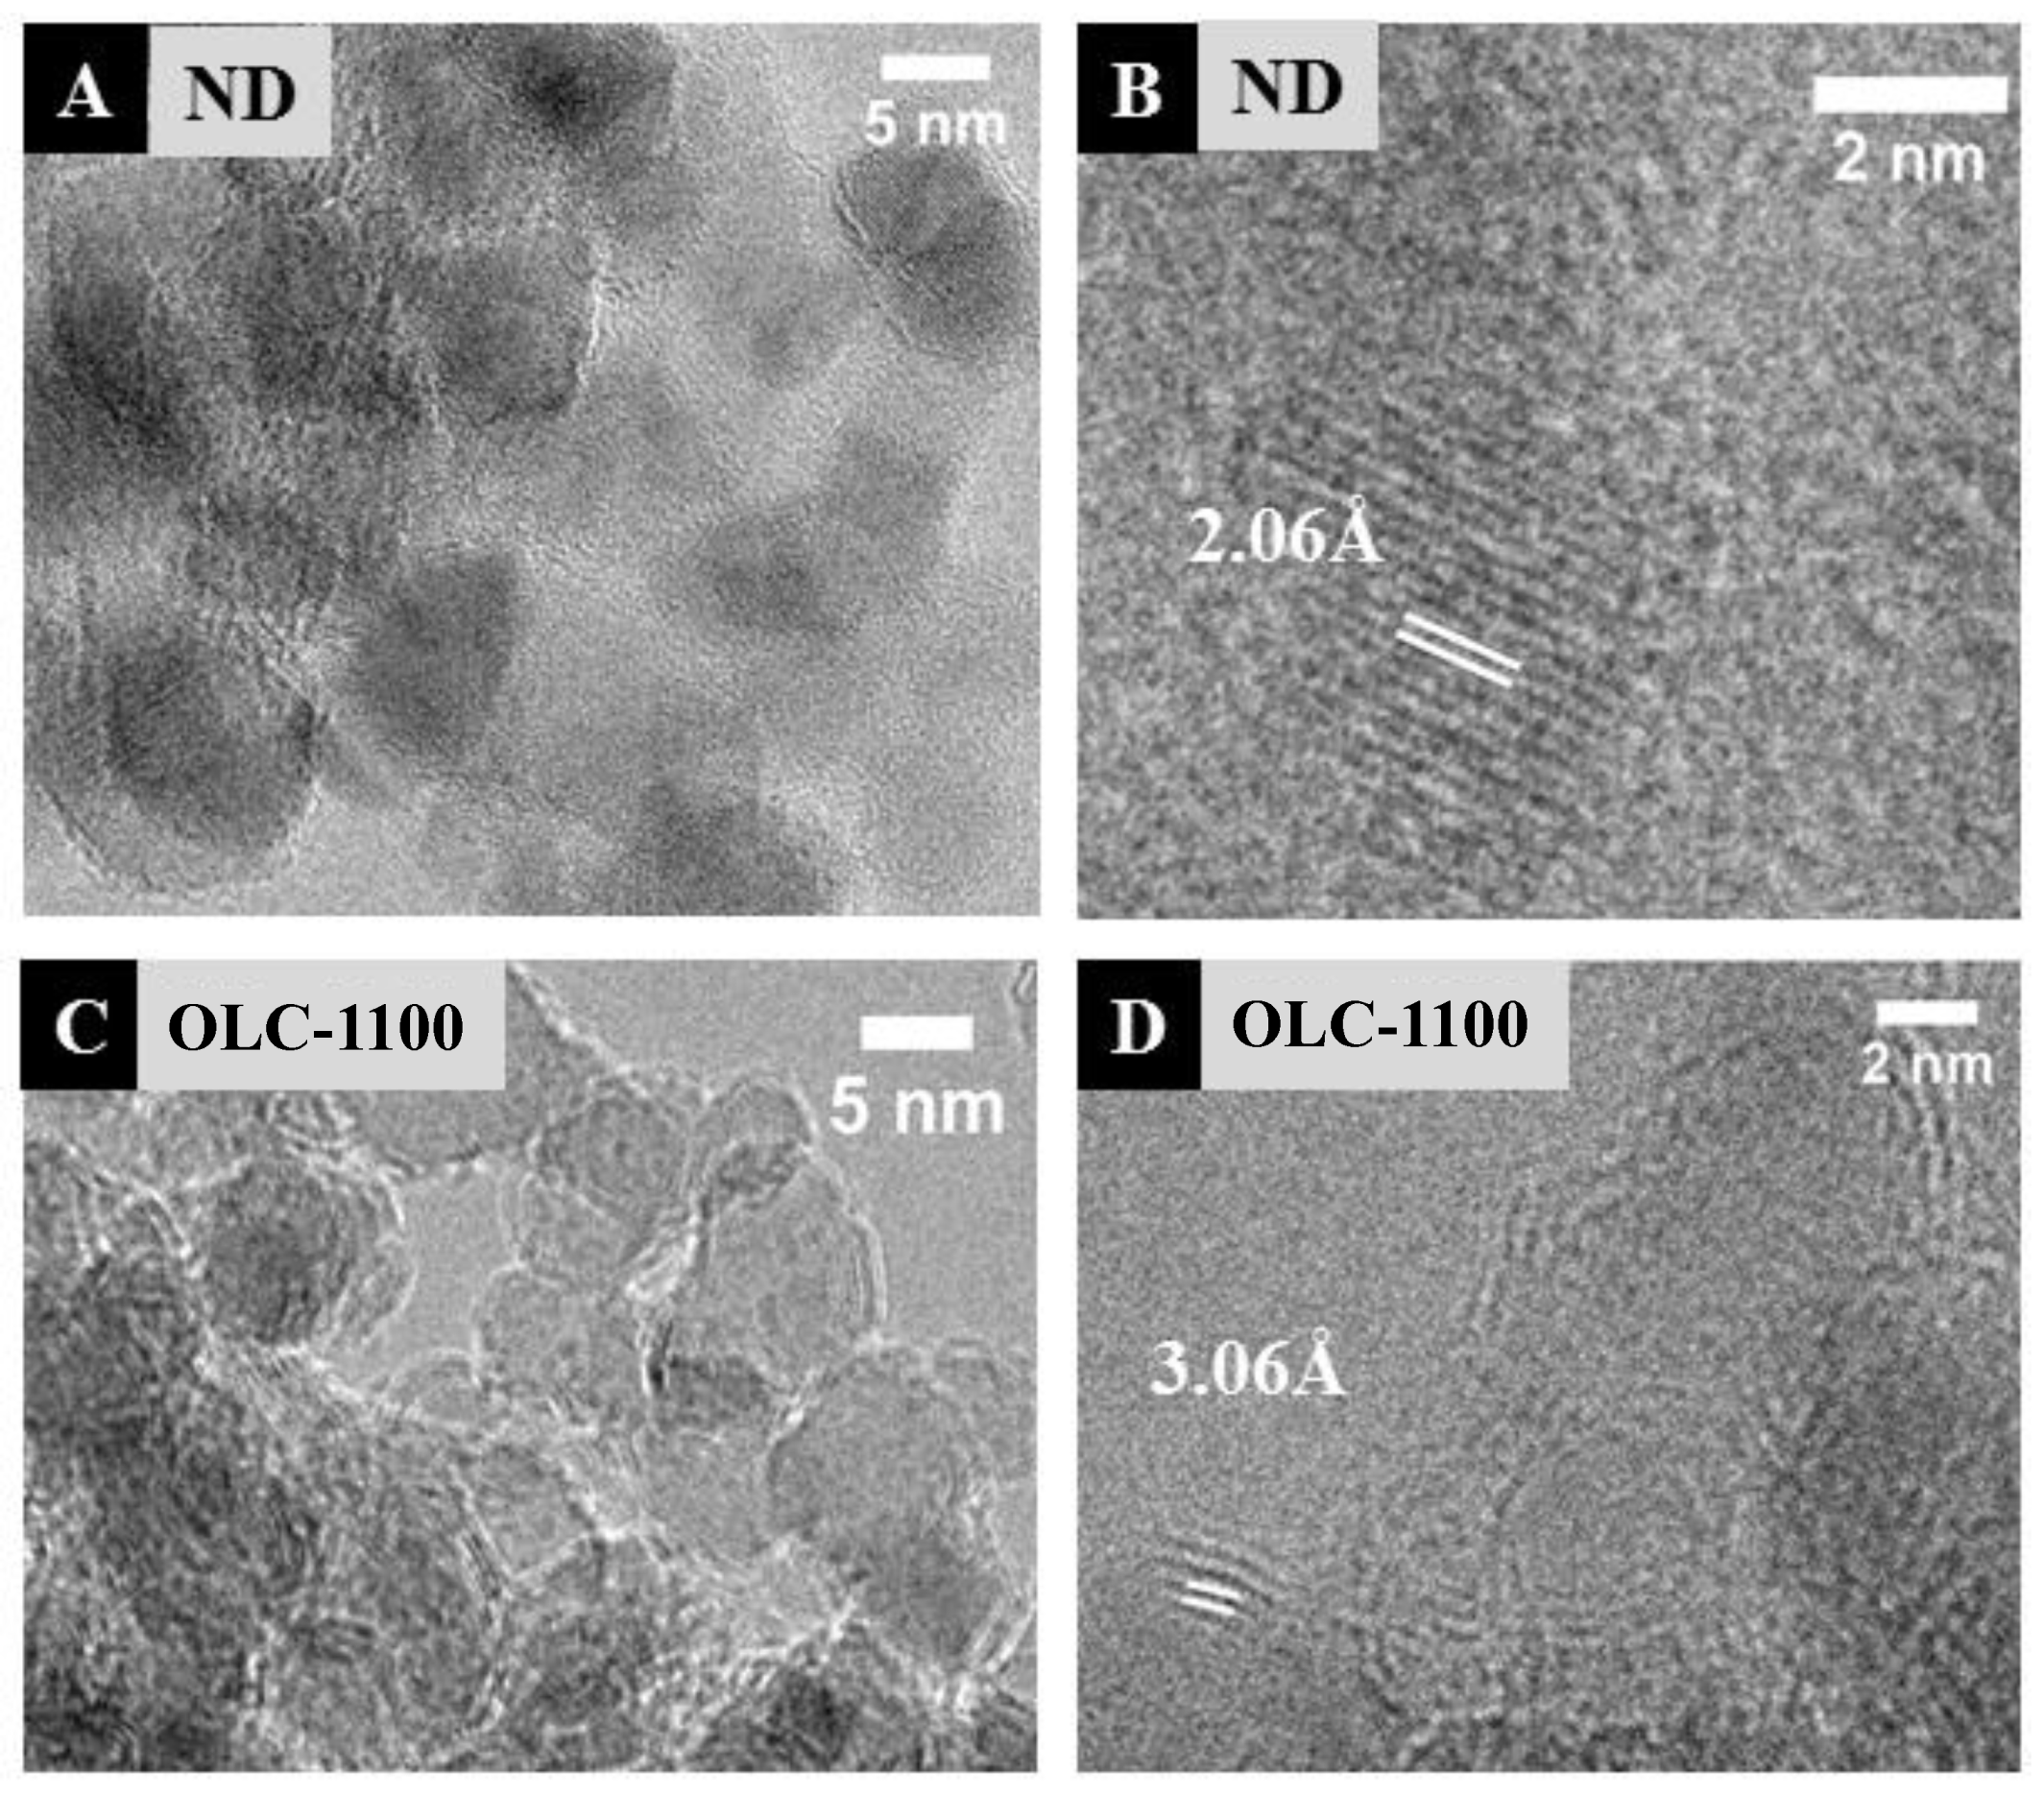
3.1.1. Surface Morphology

SEM pictures (Figure S1) revealed a significant difference in the morphology of OLC compared to pristine nanodiamonds. OLC showed tightly bound aggregates reaching several micrometers in size, compared to NDs showing loosely bound agglomerates. The high agglomerating character of NDs (due to the presence of surface functional groups) results in the formation of OLC aggregates, thereby leading to aggregate induced porosity [13].

3.1.2. Surface Characterisation

The Raman spectrum of ND (Figure S2 and Table S1) showed two dominant peaks: one at 1325 cm−1, corresponding to the sp3 diamond bonds (F2g) with a small background of sp2 disorder peak (D band), and the second at 1595 cm−1, corresponding to sp2 dimer bonds (G band), indicating the presence of graphitic carbon fragments, characteristic of ND produced from detonation process [35,36]. Additionally, the relative broadening of the diamond peak is typical of nanocrystalline diamonds [31].
Post annealing, the Raman spectrum consists of a broad D band at 1345 cm−1, attributed to an increase in the sp2 disorder with a background of sp3 diamond, indicating the transformation of diamond to graphite [37]. This position is also very near the one recorded in previous studies for high purity OLC [31]. Moreover, the G band situated at 1587cm−1 corresponds to the optical phonon mode of the E2g symmetry in graphite and is known as the tangential mode for the OLC. The FWHM of G band decreased after annealing, suggesting the formation of graphitic shells [38,39,40].
HRTEM images (Figure 1) of ND show a diamond core with a typical lattice spacing of ~ 2 Å {111} [41], surrounded by amorphous carbon. Images of OLC show the presence of a diamond core surrounded by 3–5 graphitic shells, with a typical lattice spacing of ~ 3 Å {002} [42], indicating the transformation of diamond to graphite, further supporting the data from Raman studies.
Furthermore, the electronic microscopic observations of annealed ND do not show any evidence of any large graphitic structures, such as graphitic ribbons, which corroborates the findings of the Raman spectrum and is in accordance with the selected annealing conditions [21,31,32].

3.1.3. Chemical Characterisation

The surface chemistry of ND and OLC was examined using XPS. The spectrum (Figure S3) of ND contained an intense carbon (C 1s) peak and two weak peaks, corresponding to nitrogen (N 1s) and oxygen (O 1s), marked at 284, 400, and 532 eV, respectively. Also, a series of CKLL Auger peaks appear between 1200 and 1270 eV that can provide information about the chemical bonding [43,44]. The atomic percentage of carbon increased, while the atomic percentage of nitrogen and oxygen decreased post annealing (Table S2), which could be due to the reduction in the surface dangling bonds, such as –C-H and –C-O- bonds, during annealing [36].
The relative contents of sp3 and sp2 carbon in the samples were determined by analysing the C-KLL X-ray excited Auger spectra (Figure S4 and Table S2) with the method used by Jones et al. [45]. The KLL spectrum was smoothened by Savitzy-Golay with 15 points and differentiated with 9 points [45]. The distance (energy ‘D’) between the maximum of positive excursion and the minimum of negative excursion of the first differential was determined. Figure S5 shows XRD patterns of PA, indicating typical diffraction peaks of crystalline PA located at 15.4°, 18.1°, 20.3°, 23.3°, 24.2°, and 26.4°, respectively. Figure S6 shows XRD patterns of ibuprofen, indicating typical diffraction peaks of crystalline ibuprofen located at 16.4°, 17.4°, 20° and 22°, respectively. As the typical XRD patterns for both drugs studied are located at the 2θ ranging from 10 to 40°, the XRD diffraction presented in Section 3.4 is also shown in the same 2θ range for comparison purpose.
Post-annealing, the D value was found to increase, indicating an increase in the content of sp2 carbon [46]. Relative contents of sp3 and sp2 carbon were determined from the linear interpolation of the D value of 13 eV for diamond (100%- sp3) and 22 eV for graphite (100%- sp2). The D value of ND was found to be 13 eV, despite the presence of sp2 carbon, and the exact reason for this is not clear. Post annealing, the sp2 content was found to increase to 68%, indicating the conversion of diamond to graphite, consistent with the results from Raman spectroscopy. OLC also contains 32% of sp3 carbon, indicating the presence of diamond core, consistent with the results from HRTEM analysis.

3.2. Particle Size Analysis

OLC produced from thermal annealing of NDs, showed an aggregate size in the range of 0.45–21.5 µm (Figure 2 and Table 1).
The primary particle size of OLC depends on the primary particle size of ND used; however, the aggregate size depends on various factors, such as annealing temperature and aggregate size of ND used for the synthesis [47]. Detonation ND usually has a primary particle size of less than 10 nm; however, the presence of surface functional groups facilitates the formation of tight aggregates of size 20–30 nm, and these primary aggregates form secondary aggregates of 100 nm to a few micrometres in size. In addition, the presence of van der Waals interactions between these aggregates often leads to the formation of agglomerates. Therefore, application of these agglomerates of ND as a starting material in the synthesis of OLC resulted in the production of aggregates of OLC bonded by graphitic layers [14].

3.3. Drug Loading Efficiency

UV results indicated that, with an increase in the drug concentration, a statistically significant difference was found in the drug loading (p < 0.05 for PA and p < 0.01 for IBU; one-way ANOVA). Drug loading reached a maximum when the drug concentration in the loading solution reached the saturation point (Figure 3).
The higher loading efficiency for ibuprofen (IBU) compared to paracetamol (PA) could be attributed to the higher solubility of IBU in ethanol. Although the loading efficiency was higher, the fraction of adsorbed to the unadsorbed drug remaining in the initial solution used for OLC loading was lower for IBU compared to that of PA, which could be due to stronger interactions between IBU and ethanol or due to saturation of OLC.

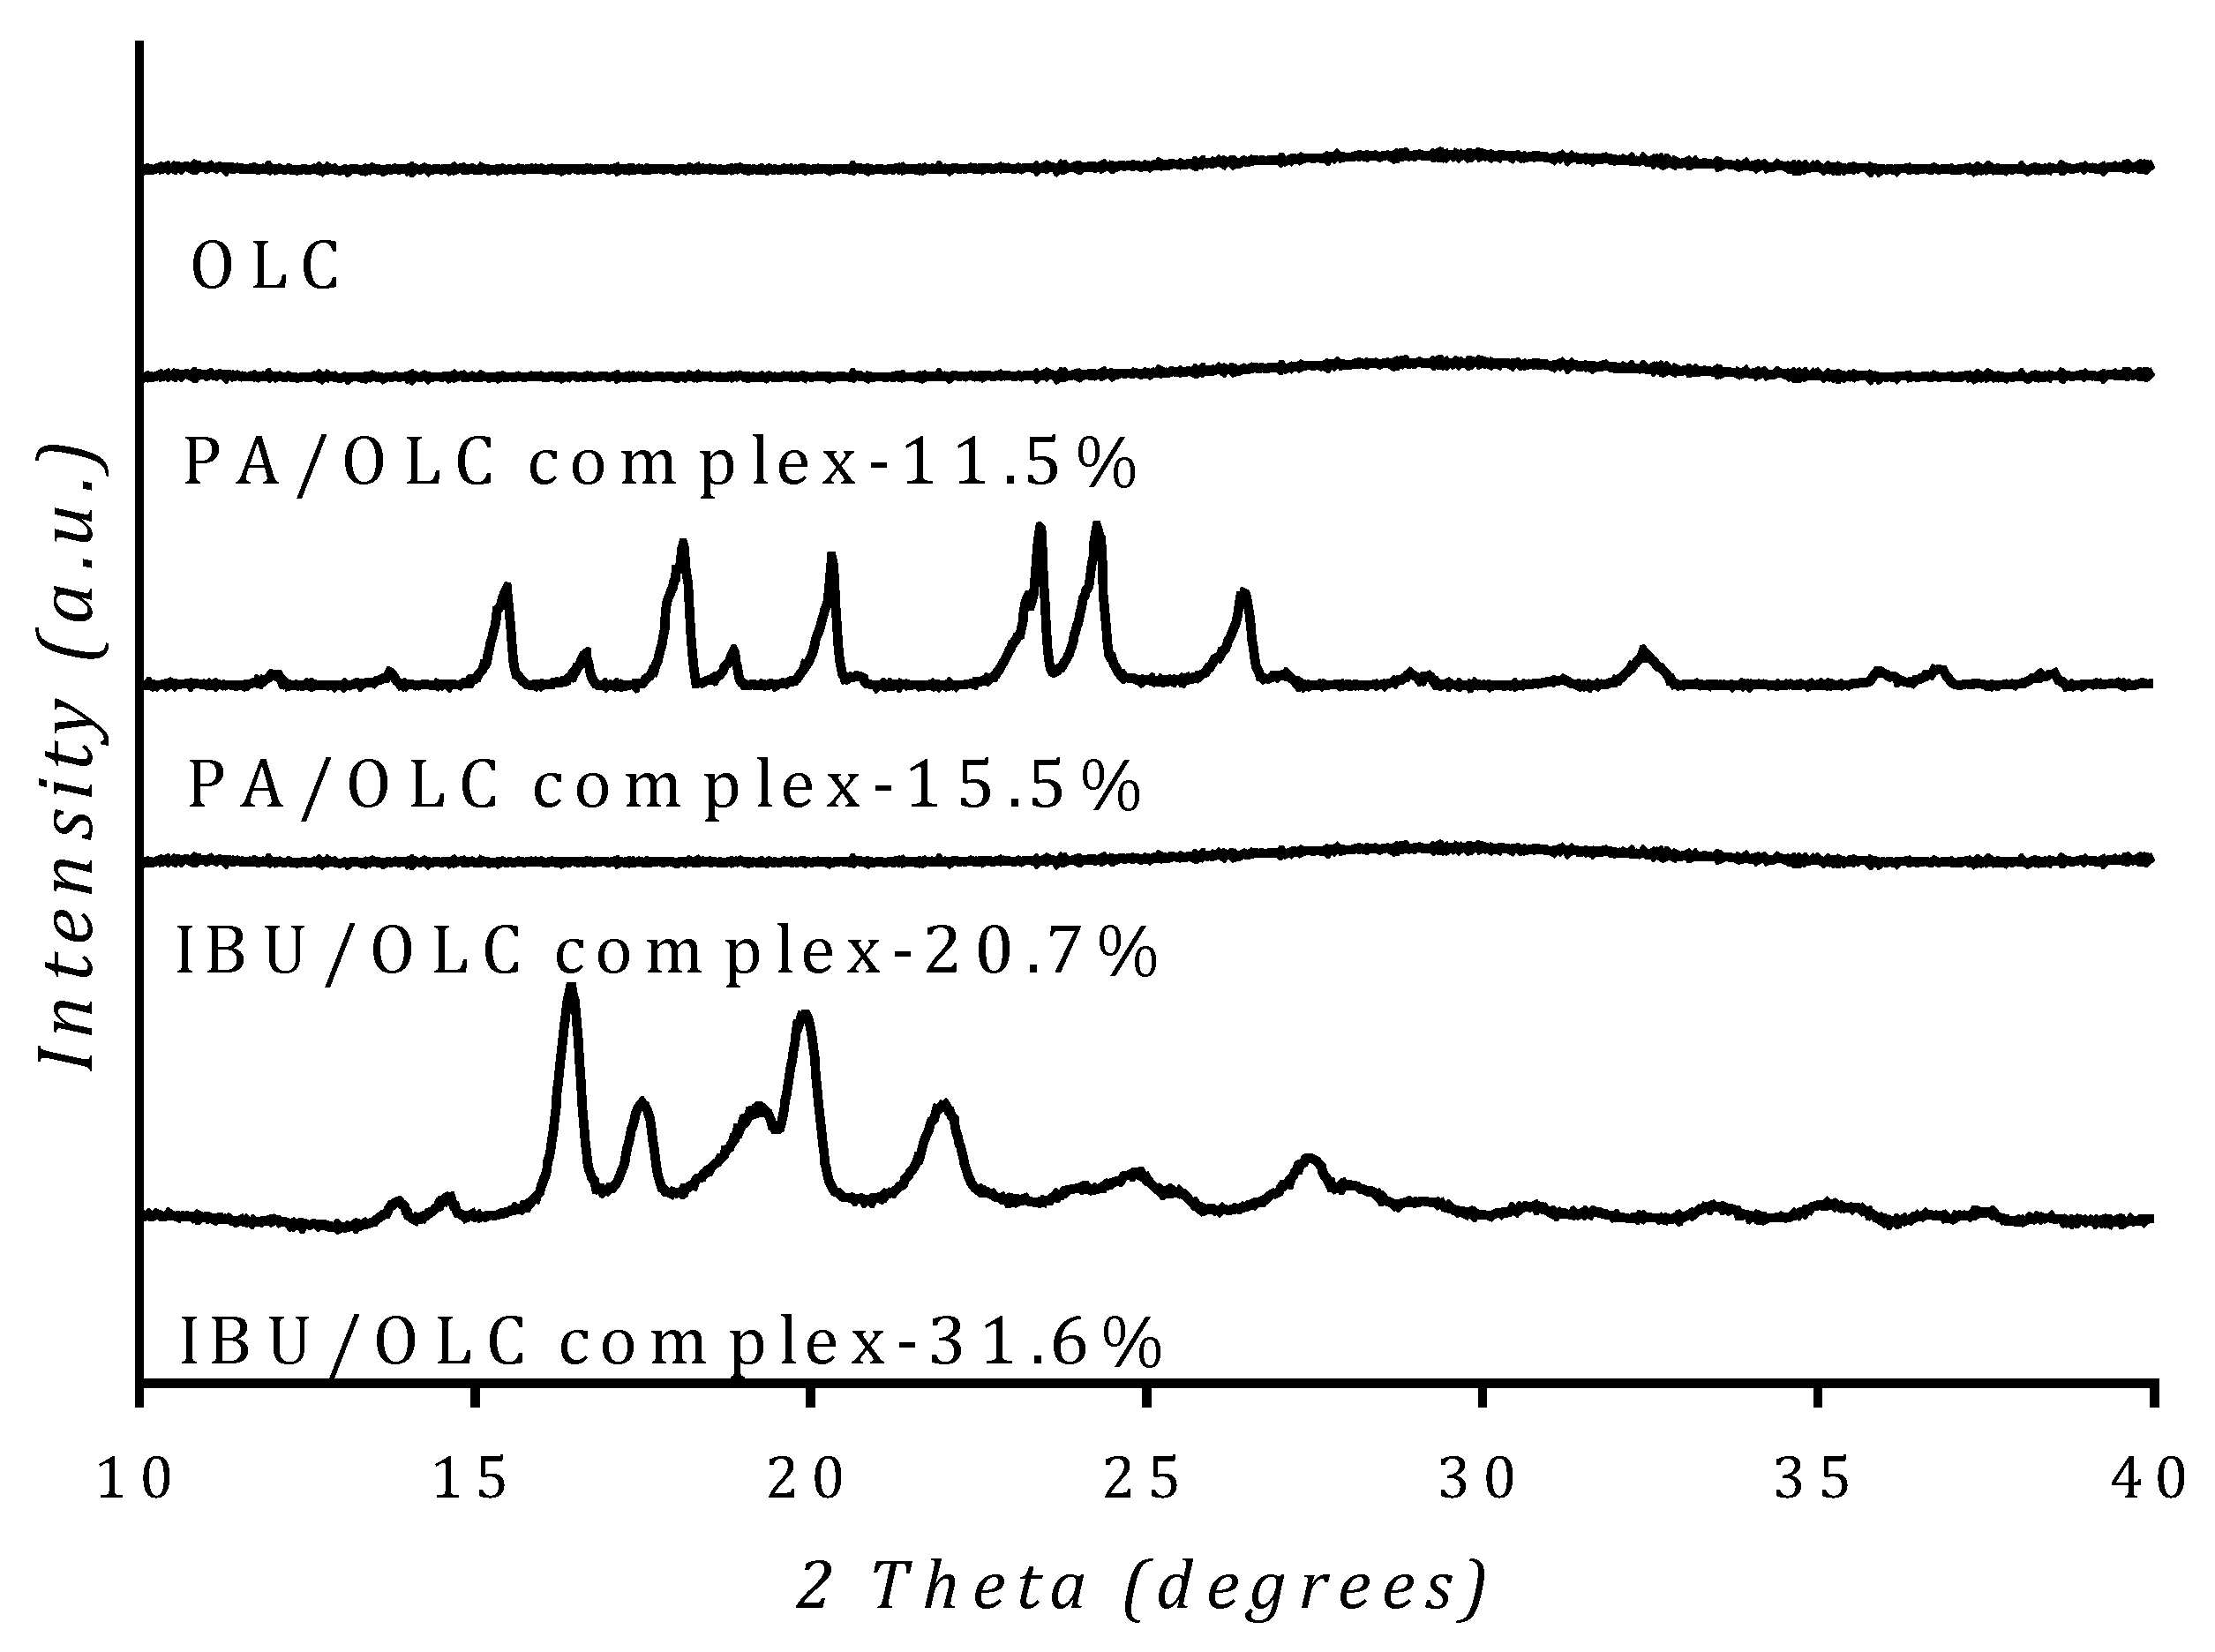
3.4. Solid State Analysis of Drug

Thermal analysis results of PA/OLC complex with different drug loadings were compared (Figure 4A). In the case of PA/OLC complex, the complex with a drug loading of 15.5% exhibited a melting peak at 169 °C, characteristic of monoclinic Form I paracetamol [48], suggesting the presence of crystallinity; however, the complex with drug loading ≤11.5% did not show any crystallinity, which could indicate that saturation has been reached and any loading higher than 11.5% results in crystallisation of PA.
Solid state characteristics of IBU/OLC complex with different drug loadings were also compared and the complex with a drug loading of 31.6% and 36.6% exhibited a melting peak at 74.8 °C [49,50], suggesting the presence of crystallinity; however, the complex with loading 20.7% did not show any crystallinity (Figure 4B), which could indicate that saturation has been reached and any loading higher than 20.7% results in crystallisation of ibuprofen.
The results from DSC were confirmed by X-ray diffraction studies (Figure 5). As mentioned previously in Section 3.1.3, the XRD diffraction graphs presented in Figure 5 only demonstrate the data within the 2θ range from 10° to 40° for comparison purpose. For OLC, there is a negligible broad graphitic (002) peak at round 2θ = 25.2°, which comes from the onion-like nanographite. Diamomd (111) and (220) planes characteristic peaks are located at around 2θ = 43.7° and 75.1°, which are not shown in the 2θ range selected in Figure 5.
XRD patterns of PA/OLC complex with a loading of 15.5% showed peaks at 15.4°, 18.1°, 20.3°, 23.3°, 24.2° and 26.4°(2θ), corresponding to crystalline PA [51]. However, PA/OLC complex with loadings of 11.5% (Figure 5) and 7.1% (data not shown) did not show any peaks corresponding to crystalline PA, suggesting that the drug was present completely in an amorphous form.
In the case of IBU loading, the complex with loadings of 31.6% (Figure 5) and 36.6% (data not shown) showed peaks at 16.4°, 17.4°, 20° and 22° (2θ), corresponding to crystalline IBU [52,53]. However, IBU/OLC complex with a loading of 20.7% did not show any diffraction pattern corresponding to crystalline IBU. Therefore, all subsequent studies were performed on PA/OLC complex-11.5% and IBU/OLC complex-20.7% only, which showed no crystallinity in the sample.

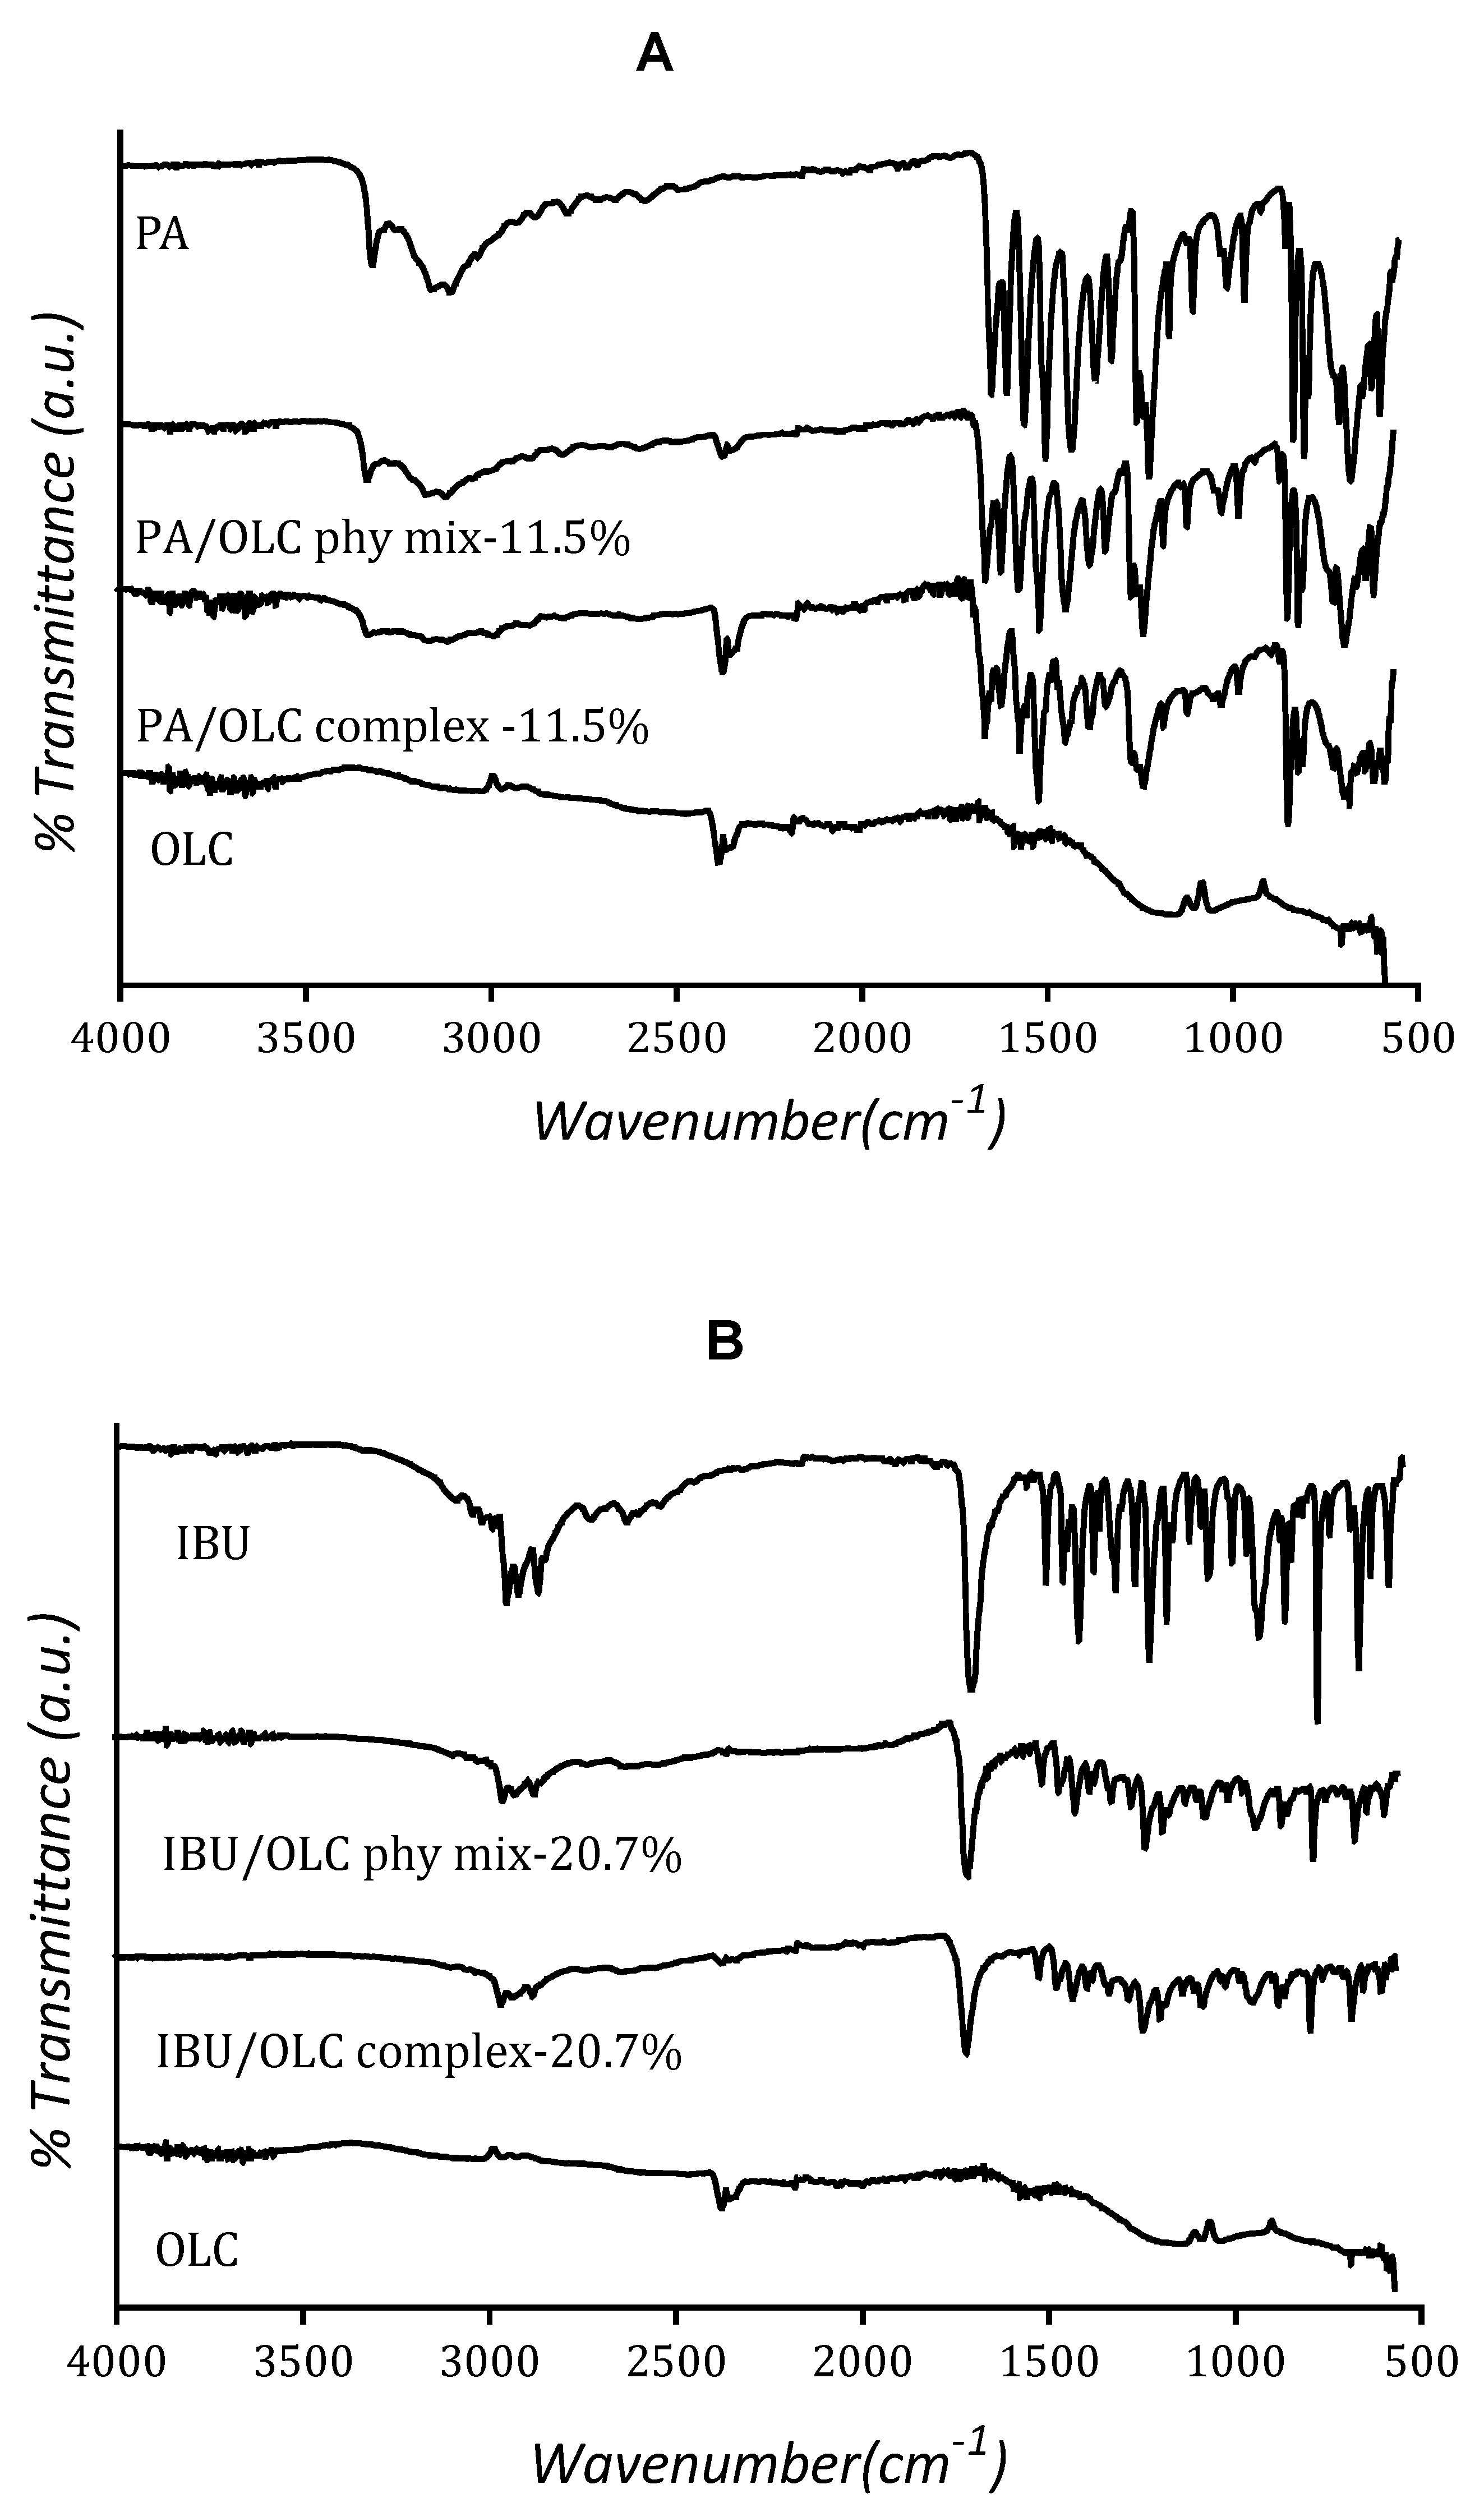
3.5. Drug-Carrier Interactions

It is important to consider possible chemical interactions between drugs and OLC, since these interactions may affect the chemical nature and stability of drugs. FTIR spectra of PA/OLC complex 11.5% and PA/OLC physical mixture containing an equivalent amount of drug as that of the complex showed peaks corresponding to an NH amide band stretch at 3320 cm−1 and a broad phenolic OH stretch at 3129 cm−1, similar to that of Pure PA (Figure 6A). Spectra of PA/OLC complex did not show any significant shift in the existing peaks or new peaks, confirming physical adsorption of PA. Also, spectra of IBU/OLC complex-20.7% and IBU/OLC physical mixture containing an equivalent amount of drug as complex showed peaks corresponding to carbonyl CO stretch at 1694 cm−1, similar to pure IBU, and no new peaks were found, indicating the absence of any chemical interactions (Figure 6B) [54]. Thus, the interaction of drug/OLC is inferred to be through physical adsorption.

3.6. In Vitro Drug Release Studies

Release profiles of pure drug and drug/OLC complex in the presence and absence of SDS are compared in Figure 7. In the absence of SDS, drug release from PA/OLC complex was incomplete, with only 11.4% release in 10 min and could be due to poor wettability of carbon onion (particles were found sticking to the surface of the vessel). Similarly, drug release from IBU/OLC complex was also incomplete in the absence of SDS; however, this was slightly higher, with 17.4% release in 10 min and could be attributed to the higher solubility of ibuprofen in the sodium phosphate buffer media. In the presence of SDS, drug release from PA/OLC complex was complete in 15 min, and was significantly faster (p < 0.0001, two-way ANOVA) compared to pure PA. Similarly, drug release of IBU/OLC complex was complete in 30 min in the presence of SDS and was significantly faster (p < 0.0001, two-way ANOVA) compared to pure crystalline IBU.
Complete release in the presence of SDS could be due to the increased wettability of OLC particles. Compared to the pure drug, faster release in drug/OLC complex could be attributed to the amorphous nature of the drug loaded in complex and higher surface area that is in contact with the dissolution media, supporting the advantage of using OLC in amorphous drug delivery.
To better understand the kinetics of drug release, drug release profiles obtained in the presence of SDS for PA and IBU were fitted with the simplified Higuchi model based on Fick’s law of diffusion, which describes drug release from an insoluble matrix [55,56]. Higuchi square root of time plots for both drug loaded complexes (Figure 8 and Table 2), display a two-step release, with an initial burst effect, which could be attributed to the drug release from superficial pores, followed by a slow release, which could be attributed to the drug release from deeper micropores (Section 3.7).

3.7. Porosity Analysis

N2 sorption analysis was performed to understand the changes in the porosity of OLC before and after drug loading. The adsorption/desorption isotherm (Figure 9) of OLC before and after loading exhibited a typical type II isotherm and H3 hysteresis loop, corresponding to the presence of aggregate created porosity.
The pore size distribution (Figure 10) of pure OLC shows the presence of pores in the range of 2–14 nm. The pore size distribution for micropores could not be determined, however the micropore volume (Table 3) of pure OLC was determined to be 0.03 cm3/g.
For PA/OLC physical mixture, a reduction in surface area and pore volume (Table 3) was observed but the pore size distribution (Figure 10) was similar to that of OLC, indicating that there was no drug present in the pores of OLC. However, for IBU/OLC physical mixture, pores in the range of 2–5 nm completely disappeared and could be due to the adsorption of gaseous IBU on OLC that could be attributed to the sublimation of IBU during N2 sorption analysis [57].
Post loading, in PA/OLC complex, a reduction in the pore size was observed (Figure 10) in pores in the range of 2–14 nm and the pore size distribution broadens in the range of 7.5–10.5 nm, suggesting the adsorption of PA into the pores of OLC. In the case of IBU/OLC complex, pores in the range of 2–5 nm completely disappeared and the pore size distribution broadens for pores in the range of 5–14 nm, which could be due to the reduction of pore size from drug loading

3.8. Toxicity Studies of Carbon Onion

Toxicity studies of these OLC aggregates were performed on Caco-2 cells to determine the feasibility of application of OLC in oral drug formulations. The efficiency of uptake of microparticles is much lower compared to nanoparticles, therefore the risk of toxicity associated with these OLC aggregates can be much lower.
However, studies have shown uptake of microparticles of size up to 10 µm by intestinal epithelium [58], suggesting the importance of considering the toxicity of microparticles. Hence, toxicity of OLC aggregates on Caco-2 cells was investigated by MTT assay.
OLC showed a significant effect (p < 0.0001, one-way ANOVA) on the survival of Caco-2 cells (Figure 11), with cell survival reduced when exposed to media containing OLC concentrations ≥400 µg/mL; however, the cell viability was still over 75%, suggesting OLC is a safe drug carrier for oral drug delivery. Since OLC aggregates are insoluble, the chance of internalisation is low, although synthesis conditions need to be optimised to eliminate the production of aggregates of size <10 µm, to avoid the possibility of internalisation.

4. Conclusions

The current study investigated the application of carbon onion (OLC) aggregates as drug carriers using paracetamol and ibuprofen as model drugs. Nanodiamonds were annealed to 1100 °C and OLC aggregates produced exhibited very low cytotoxicity on Caco-2 cells with cell viability over 75% at all the concentrations tested (10−800 µg/mL). The solution adsorption method was employed for drug loading and the results demonstrated that loading efficiency increased with an increase in initial drug concentration, reaching a maximum when the initial drug concentration reached the saturation point. Results from thermal analysis and diffraction studies suggested that the drug was found to be completely amorphous in PA/OLC complex and IBU/OLC complex with the loading of 11.5% and 20.7%, respectively, indicating that the concentration of drug in the loading solution needs to be optimised to achieve complex without any crystalline drug. Drug release kinetics were studied using USP II dissolution method in sodium phosphate buffer with and without SDS. About 11.4% and 17.1% of the total loaded PA and IBU, respectively, was released in the absence of SDS; however, this was incomplete due to poor wettability of OLC. Complete drug release was achieved in the presence of SDS and the dissolution rate was higher than that of the pure crystalline drug, establishing that drug loading was reversible and also faster due to amorphous nature of the drug loaded into OLC. The maximum initial concentration of drugs in the loading solution to ensure complete amorphous drug loadings is estimated at 11.5 PA and 20.7 IBU. These results suggest that the development of carbon onion based drug delivery systems is promising.

Supplementary Materials

The following are available online at https://www.mdpi.com/2073-4352/10/4/281/s1, Figure S1: Scanning electron microscope pictures showing the morphology of (a) pristine nanodiamonds showing loosely bound agglomerates and (b) carbon onion showing tightly bound aggregates reaching several micrometers in size; Figure S2: Raman spectra of ND and OLC showing the F2g peak corresponding to the sp3 diamond at 1325 cm−1, D band and G band corresponding to sp2 disorder at ~1330 cm−1 and ~1570 cm−1, respectively. Post annealing, OLC spectra consists of a broad D band in the region 1332–1350 cm−1, attributed to increase in the sp2 disorder with a background of sp3 diamond, indicating the transformation of diamond to graphite [37]; Figure S3: XPS spectra of pristine nanodiamonds showing an intense carbon peak at 284 eV and two weak nitrogen and oxygen peaks at 400 and 532 eV, respectively. (a) and carbon onion showing a decrease in intensity for carbon, oxygen and nitrogen peaks (b). The major peaks are marked for Carbon (C 1s), Nitrogen (N 1s) and Oxygen (O 1s) present on the surface.; Figure S4: XPS C KLL Auger Spectra (a) and their first derivatives (b) as compared with pristine nanodiamonds (ND) and carbon onion (OLC). D parameter represents the width between maximum and minimum excursions of the derivative of Auger spectra. D value was found to increase after annealing, indicating an increase in the content of sp2 carbon [36]; Figure S5: XRD patterns of PA showing typical diffraction peaks of crystalline PA (15.4°, 18.1°, 20.3°, 23.3°, 24.2° and 26.4°(2θ), [51]); Figure S6: XRD patterns of ibuprofen showing typical diffraction peaks of crystalline IBU (16.4°, 17.4°, 20° and 22° (2θ), [52,53] ); Table S1: Raman shifts, areal intensities and peak widths obtained from the spectra of ND and OLC determined by fitting spectra with a Gaussian line shape using Origin software. After annealing, the FWHM of G band decreased, suggesting the formation of graphitic shells [38,39,40]; Table S2: The relative atomic contents of carbon, oxygen, and nitrogen, and the relative atomic contents of different chemical states of carbon determined from XPS analysis. The atomic percentage of carbon increased, while the atomic percentage of nitrogen and oxygen decreased post annealing, which could be due to the reduction in the surface dangling bonds, such as –C-H and –C-O- bonds, during annealing [36]. After annealing, the sp2 content was found to increase to 68%, indicating the conversion of diamond to graphite and OLC still contains 32% of sp3 carbon, indicating the presence of diamond core.

Author Contributions

Conceptualization, N.M. and D.J.K.; methodology, N.M.; software, N.M.; validation, D.J.K. and H.Y.; formal analysis, N.M.; investigation, N.M.; resources, D.J.K. and H.Y.; data curation, N.M.; writing—original draft preparation, N.M.; writing—review and editing, D.J.K., A.C., R.Z., B.S., D.O. and H.Y.; visualization, N.M., D.J.K., and H.Y.; supervision, D.J.K. and H.Y.; project administration, D.J.K., and H.Y.; funding acquisition, D.J.K. and H.Y.. All authors have read and agreed to the published version of the manuscript.

Funding

This research was partially funded by Aston University through an overseas student scholarship.

Conflicts of Interest

The authors declare no conflict of interest. The funders had no role in the design of the study; in the collection, analyses, or interpretation of data; in the writing of the manuscript, or in the decision to publish the results”.

References

  1. Dahan:, A.; Wolk, O.; Kim, Y.H.; Ramachandran, C.; Crippen, G.M.; Takagi, T.; Bermejo, M.; Amidon, G. Purely in Silico BCS Classification: Science Based Quality Standards for the World’s Drugs. Mol. Pharm. 2013, 10, 4378–4390. [Google Scholar] [CrossRef] [PubMed]
  2. Douroumis, D.; Fahr, A. Drug Delivery Strategies for Poorly Water-Soluble Drugs; John Wiley & Sons, Ltd.: Hoboken, NJ, USA, 2013. [Google Scholar]
  3. Preisig, D.; Haid, D.; Varum, F.J.; Bravo, R.; Alles, R.; Huwyler, J.; Puchkov, M. Drug loading into porous calcium carbonate microparticles by solvent evaporation. Eur. J. Pharm. Biopharm. 2014, 87, 548–558. [Google Scholar] [CrossRef] [PubMed]
  4. Salonen, J.; Laitinen, L.; Kaukonen, A.; Tuura, J.; Björkqvist, M.; Heikkilä, T.; Vähä-Heikkilä, K.; Hirvonen, J.T.; Lehto, V.-P. Mesoporous silicon microparticles for oral drug delivery: Loading and release of five model drugs. J. Control. Release 2005, 108, 362–374. [Google Scholar] [CrossRef] [PubMed]
  5. Laitinen, R.; Löbmann, K.; Strachan, C.J.; Grohganz, H.; Rades, T. Emerging trends in the stabilization of amorphous drugs. Int. J. Pharm. 2013, 453, 65–79. [Google Scholar] [CrossRef]
  6. Yu, L. Amorphous pharmaceutical solids: Preparation, characterization and stabilization. Adv. Drug Deliv. Rev. 2001, 48, 27–42. [Google Scholar] [CrossRef]
  7. Salonen, J.; Kaukonen, A.M.; Hirvonen, J.T.; Lehto, V.-P. Mesoporous Silicon in Drug Delivery Applications. J. Pharm. Sci. 2008, 97, 632–653. [Google Scholar] [CrossRef]
  8. Vallet-Regi, M.; Ramila, A.; Del Real, R.P.; Perez-Pariente, J. A New Property of MCM-41: Drug Delivery System. Chem. Mater. 2001, 13, 308–311. [Google Scholar] [CrossRef]
  9. Li, Y.; Angelova, A.; Hu, F.; Garamus, V.; Peng, C.; Li, N.; Liu, J.; Liu, D.; Zou, A. pH Responsiveness of Hexosomes and Cubosomes for Combined Delivery of Brucea javanica Oil and Doxorubicin. Langmuir 2019, 35, 14532–14542. [Google Scholar] [CrossRef]
  10. Lim, D.G.; Prim, R.E.; Kim, K.H.; Kang, E.; Park, K.; Jeong, S.H. Combinatorial nanodiamond in pharmaceutical and biomedical applications. Int. J. Pharm. 2016, 514, 41–51. [Google Scholar] [CrossRef]
  11. Zhu, Y.; Li, J.; Li, W.; Zhang, Y.; Yang, X.; Chen, N.; Sun, Y.; Zhao, Y.; Fan, C.; Huang, Q. The Biocompatibility of Nanodiamonds and Their Application in Drug Delivery Systems. Theranostics 2012, 2, 302–312. [Google Scholar] [CrossRef]
  12. Cui, Z.; Zhang, Y.; Zhang, J.; Kong, H.; Tang, X.; Pan, L.; Xia, K.; Aldalbahi, A.; Li, A.; Tai, R.; et al. Sodium alginate-functionalized nanodiamonds as sustained chemotherapeutic drug-release vectors. Carbon 2016, 97, 78–86. [Google Scholar] [CrossRef]
  13. El-Say, K.M. Nanodiamond as a drug delivery system: Applications and prospective. J. Appl. Pharm. Sci. 2011, 1, 29–39. [Google Scholar]
  14. Shenderova, O.A.; Zhirnov, V.V.; Brenner, D.W. Carbon Nanostructures. Crit. Rev. Solid State Mater. Sci. 2002, 27, 227–356. [Google Scholar] [CrossRef]
  15. Mojica, M.; Alonso, J.A.; Méndez, F. Synthesis of fullerenes. J. Phys. Org. Chem. 2013, 26, 526–539. [Google Scholar] [CrossRef]
  16. Kyesmen, P.I.; Onoja, A.; Amah, A.N. Fullerenes synthesis by combined resistive heating and arc discharge techniques. SpringerPlus 2016, 5, 1323. [Google Scholar] [CrossRef] [Green Version]
  17. Bergin, I.L.; Witzmann, F.A. Nanoparticle toxicity by the gastrointestinal route: Evidence and knowledge gaps. Int. J. Biomed. Nanosci. Nanotechnol. 2013, 3, 163. [Google Scholar] [CrossRef] [Green Version]
  18. Bielicka, A.; Wiśniewski, M.; Terzyk, A.P.; Gauden, P.; Furmaniak, S.; Roszek, K.; Kowalczyk, P.; Bieniek, A. Carbon materials as new nanovehicles in hot-melt drug deposition. J. Phys. Condens. Matter 2013, 25, 355002. [Google Scholar] [CrossRef]
  19. Terrones, H.; Terrones, M. Curved nanostructured materials. New J. Phys. 2003, 5, 126.1–126.37. [Google Scholar] [CrossRef]
  20. Costa, G.C.; McDonough, J.K.; Gogotsi, Y.; Navrotsky, A. Thermochemistry of onion-like carbons. Carbon 2014, 69, 490–494. [Google Scholar] [CrossRef]
  21. Zeiger, M.; Jäckel, N.; Aslan, M.; Weingarth, D.; Presser, V. Understanding structure and porosity of nanodiamond-derived carbon onions. Carbon 2015, 84, 584–598. [Google Scholar] [CrossRef]
  22. Pakhira, B.; Ghosh, M.; Allam, A.; Sarkar, S. Carbon nano onions cross the blood brain barrier. RSC Adv. 2016, 6, 29779–29782. [Google Scholar] [CrossRef]
  23. Bartelmess, J.; Giordani, S. Carbon nano-onions (multi-layer fullerenes): Chemistry and applications. Beilstein J. Nanotechnol. 2014, 5, 1980–1998. [Google Scholar] [CrossRef] [PubMed]
  24. Mamidi, N.; Castrejón, J.V.; González-Ortiz, A. Rational design and engineering of carbon nano-onions reinforced natural protein nanocomposite hydrogels for biomedical applications. J. Mech. Behav. Biomed. Mater. 2020, 104, 103696. [Google Scholar] [CrossRef] [PubMed]
  25. Mamidi, N.; Gamero, M.R.M.; Castrejón, J.V.; Zúníga, A.E. Development of ultra-high molecular weight polyethylene-functionalized carbon nano-onions composites for biomedical applications. Diam. Relat. Mater. 2019, 97, 107435. [Google Scholar] [CrossRef]
  26. Camisasca, A.; Giordani, S. Carbon nano-onions in biomedical applications: Promising theranostic agents. Inorganica Chim. Acta 2017, 468, 67–76. [Google Scholar] [CrossRef]
  27. Mykhailiv, O.; Zubyk, H.; Plonska-Brzezinska, M.E. Carbon nano-onions: Unique carbon nanostructures with fascinating properties and their potential applications. Inorganica Chim. Acta 2017, 468, 49–66. [Google Scholar] [CrossRef]
  28. Bobrowska, D.M.; Brzezinski, K.; Plonska-Brzezinska, M.E. PEGylated Carbon Nano-onions Composite as a Carrier of Polyphenolic Compounds: A Promising System for Medical Applications and Biological Sensors. Colloid Interface Sci. Commun. 2017, 21, 6–9. [Google Scholar] [CrossRef]
  29. Singh, V. Natural source derived carbon nano-onions as electrode material for sensing applications. Diam. Relat. Mater. 2018, 87, 202–207. [Google Scholar] [CrossRef]
  30. D’Amora, M.; Camisasca, A.; Boarino, A.; Arpicco, S.; Giordani, S. Supramolecular functionalization of carbon nano-onions with hyaluronic acid-phospholipid conjugates for selective targeting of cancer cells. Colloids Surf. B Biointerfaces 2020, 188, 110779. [Google Scholar] [CrossRef]
  31. Zou, Q.; Wang, M.; Li, Y. Onion-like carbon synthesis by annealing nanodiamond at lower temperature and vacuum. J. Exp. Nanosci. 2010, 5, 375–382. [Google Scholar] [CrossRef]
  32. Kuznetsov, V.; Butenko, Y.; Zaikovskii, V.; Chuvilin, A. Carbon redistribution processes in nanocarbons. Carbon 2004, 42, 1057–1061. [Google Scholar] [CrossRef]
  33. Salonen, J.; Paski, J.; Heikkilä, T.; Björkqvist, M.; Vähä-Heikkilä, K.; Lehto, V.-P. Determination of drug load in porous silicon microparticles by calorimetry. Phys. Status Solidi 2005, 202, 1629–1633. [Google Scholar] [CrossRef]
  34. Miriyala, N.; Ouyang, D.; Perrie, Y.; Lowry, D.; Kirby, D.J. Activated carbon as a carrier for amorphous drug delivery: Effect of drug characteristics and carrier wettability. Eur. J. Pharm. Biopharm. 2017, 115, 197–205. [Google Scholar] [CrossRef] [PubMed] [Green Version]
  35. Qiao, Z.; Li, J.; Zhao, N.; Shi, C.; Nash, P. Structural evolution and Raman study of nanocarbons from diamond nanoparticles. Chem. Phys. Lett. 2006, 429, 479–482. [Google Scholar] [CrossRef]
  36. Xie, F.Y.; Xie, W.; Gong, L.; Zhang, W.H.; Chen, S.H.; Zhang, Q.Z.; Chen, J. Surface characterization on graphitization of nanodiamond powder annealed in nitrogen ambient. Surf. Interface Anal. 2010, 42, 1514–1518. [Google Scholar] [CrossRef]
  37. Chu, P.K.; Li, L. Characterization of amorphous and nanocrystalline carbon films. Mater. Chem. Phys. 2006, 96, 253–277. [Google Scholar] [CrossRef]
  38. Roy, D.; Chhowalla, M.; Wang, H.; Sano, N.; Alexandrou, I.; Clyne, T.; Amaratunga, G. Characterisation of carbon nano-onions using Raman spectroscopy. Chem. Phys. Lett. 2003, 373, 52–56. [Google Scholar] [CrossRef]
  39. Wang, X.; Xu, B.; Liu, X.; Jia, H.; Hideki, I. The Raman spectrum of nano-structured onion-like fullerenes. Phys. B Condens. Matter 2005, 357, 277–281. [Google Scholar] [CrossRef]
  40. Mochalin, V.N.; Pentecost, A.; Li, X.-M.; Neitzel, I.; Nelson, M.; Wei, C.; He, T.; Guo, F.; Gogotsi, Y. Adsorption of Drugs on Nanodiamond: Toward Development of a Drug Delivery Platform. Mol. Pharm. 2013, 10, 3728–3735. [Google Scholar] [CrossRef]
  41. Xiao, J.; Ouyang, G.; Liu, P.; Wang, C.X.; Yang, G.W. Reversible Nanodiamond-Carbon Onion Phase Transformations. Nano Lett. 2014, 14, 3645–3652. [Google Scholar] [CrossRef]
  42. Duffy, E.; He, X.; Nesterenko, E.; Brabazon, D.; Dey, A.; Krishnamurthy, S.; Nesterenko, P.N.; Paull, B. Thermally controlled growth of carbon onions within porous graphitic carbon-detonation nanodiamond monolithic composites. RSC Adv. 2015, 5, 22906–22915. [Google Scholar] [CrossRef] [Green Version]
  43. Wu, S.H.; Pendleton, P. Adsorption of Anionic Surfactant by Activated Carbon: Effect of Surface Chemistry, Ionic Strength, and Hydrophobicity. J. Colloid Interface Sci. 2001, 243, 306–315. [Google Scholar] [CrossRef]
  44. Titantah, J.; Lamoen, D. sp3/sp2 characterization of carbon materials from first-principles calculations: X-ray photoelectron versus high energy electron energy-loss spectroscopy techniques. Carbon 2005, 43, 1311–1316. [Google Scholar] [CrossRef]
  45. Jones, B.J.; Ojeda, J. Substrate and material transfer effects on the surface chemistry and texture of diamond-like carbon deposited by plasma-enhanced chemical vapour deposition. Surf. Interface Anal. 2012, 44, 1187–1192. [Google Scholar] [CrossRef] [Green Version]
  46. Kaciulis, S. Spectroscopy of carbon: From diamond to nitride films. Surf. Interface Anal. 2012, 44, 1155–1161. [Google Scholar] [CrossRef]
  47. Moseenkov, S.I.; Kuznetsov, V.L.; Ishchenko, A.V. Change in sizes of carbon aggregates and primary particles of the onion-like carbon synthesized by high-temperature annealing of nanodiamond. Russ. Chem. Bull. 2014, 63, 599–604. [Google Scholar] [CrossRef]
  48. Qi, S.; Avalle, P.; Saklatvala, R.; Craig, D.Q.M. An investigation into the effects of thermal history on the crystallisation behaviour of amorphous paracetamol. Eur. J. Pharm. Biopharm. 2008, 69, 364–371. [Google Scholar] [CrossRef]
  49. Xu, F.; Sun, L.X.; Tan, Z.-C.; Liang, J.-G.; Li, R.-L. Thermodynamic study of ibuprofen by adiabatic calorimetry and thermal analysis. Thermochim. Acta 2004, 412, 33–57. [Google Scholar] [CrossRef]
  50. Cano, H.; Gabas, N.; Canselier, J. Experimental study on the ibuprofen crystal growth morphology in solution. J. Cryst. Growth 2001, 224, 335–341. [Google Scholar] [CrossRef]
  51. Wang, X.; Liu, P.; Tian, Y. Ordered mesoporous carbons for ibuprofen drug loading and release behavior. Microporous Mesoporous Mater. 2011, 142, 334–340. [Google Scholar] [CrossRef]
  52. Liu, Y.; Yan, K.; Jiang, G.; Xiong, Y.; Du, Y.; Shi, X. Electrical Signal Guided Ibuprofen Release from Electrodeposited Chitosan Hydrogel. Int. J. Polym. Sci. 2014, 2014, 736898. [Google Scholar] [CrossRef] [Green Version]
  53. Martín, Á.; Scholle, K.; Mattea, F.; Meterc, D.; Cocero, M.J. Production of Polymorphs of Ibuprofen Sodium by Supercritical Antisolvent (SAS) Precipitation. Cryst. Growth Des. 2009, 9, 2504–2511. [Google Scholar]
  54. Lai, J.; Lin, W.; Scholes, P.; Li, M. Investigating the Effects of Loading Factors on the In Vitro Pharmaceutical Performance of Mesoporous Materials as Drug Carriers for Ibuprofen. Materials 2017, 10, 150. [Google Scholar] [CrossRef] [PubMed] [Green Version]
  55. Costa, P.; Lobo, J.M.S. Modeling and comparison of dissolution profiles. Eur. J. Pharm. Sci. 2001, 13, 123–133. [Google Scholar] [CrossRef]
  56. Izquierdo-Barba, I.; Martinez, Á.; Doadrio, J.C.; Perez-Pariente, J.; Vallet-Regi, M. Release evaluation of drugs from ordered three-dimensional silica structures. Eur. J. Pharm. Sci. 2005, 26, 365–373. [Google Scholar] [CrossRef]
  57. Ertel, K.D.; Heasley, R.A.; Koegel, C.; Chakrabarti, A.; Carstensen, J.T. Determination of Ibuprofen Vapor Pressure at Temperatures of Pharmaceutical Interest. J. Pharm. Sci. 1990, 79, 552. [Google Scholar] [CrossRef]
  58. Desai, M.P.; Labhasetwar, V.; Amidon, G.; Levy, R.J. Gastrointestinal Uptake of Biodegradable Microparticles: Effect of Particle Size. Pharm. Res. 1996, 13, 1838–1845. [Google Scholar] [CrossRef]
Figure 1. Transmission electron micrographs of pristine nanodiamonds (A,B) showing the lattice spacing of 2.06 Å corresponding to the plane {111} and the surrounding by amorphous carbon, and OLC (obtained after annealing of ND at 1100 °C), (C,D) showing the presence of a diamond core surrounded by 3-5 graphitic shells and the lattice spacing of 3.06 Å corresponding to the plane {002}.
Crystals 10 00281 g001
Figure 2. Particle volume size distribution of carbon onion obtained from laser diffraction analysis. All samples have a broad particle size distribution in the range of 0.5 to 21.5 µm. This distribution is slightly bimodal, with two peaks between 1.6 microns and 2 microns and at 3.8 microns and shows a majority of particles with a size between 1 and 5 µm.
Crystals 10 00281 g002
Figure 3. Effect of initial drug concentration on loading efficiency (stirring speed: 100 rpm; temperature: 20 °C; solution volume: 5 mL; OLC dose: 500 mg; contact time: 1 hour). Results are the mean of triplicate experiments ± SD. Statistically significant differences are noted for p < 0.05 (* p < 0.05, ** p < 0.01, one-way ANOVA and Tukey’s multiple comparison test).
Crystals 10 00281 g003
Figure 4. (A): DSC curves of carbon onion (OLC) and paracetamol loaded carbon onion (PA/OLC complex) with different drug loadings. (B): DSC curves of carbon onion (OLC) and ibuprofen-loaded carbon onion (IBU/OLC complex) with different drug loadings.
Crystals 10 00281 g004
Figure 5. XRD patterns of carbon onion (OLC) paracetamol-loaded carbon onion (PA/OLC complex) and ibuprofen-loaded carbon onion (IBU/OLC complex) with different drug loadings.
Crystals 10 00281 g005
Figure 6. (A): FTIR spectra of paracetamol (PA), carbon onion (OLC), paracetamol-loaded carbon onion (PA/OLC complex) and physical mixture of paracetamol and carbon onion (PA/OLC phy mix). (B): FTIR spectra of ibuprofen (IBU), carbon onion (OLC), ibuprofen-loaded carbon onion (IBU/OLC complex) and physical mixture of ibuprofen and carbon onion (IBU/OLC phy mix). Note that the transmittance scale is arbitrary.
Crystals 10 00281 g006
Figure 7. (A): Dissolution profiles of paracetamol (PA) and paracetamol-loaded carbon onion (PA/OLC complex) determined at pH 5.8. Curves PA-SDS and PA/OLC complex-SDS represent dissolution profiles determined in media containing 1% SDS. (B): Dissolution profiles of ibuprofen (IBU) and ibuprofen-loaded carbon onion (IBU/OLC complex) determined at pH 7.2. Curves IBU-SDS and IBU/OLC complex-SDS represent dissolution profiles determined in media containing 1% SDS. Statistically significant differences are noted for P < 0.05 (* P < 0.05; *** P < 0.001; **** P < 0.0001, two-way ANOVA and Bonferroni’s multiple comparison test). Results are the mean of triplicate experiments ± SD.
Crystals 10 00281 g007
Figure 8. Two step regression linear utilising Higuchi’s square root of time plot for drug release from complex in the presence of SDS. In brackets pH of the dissolution medium. Each point represents the mean of n = 3 determinations.
Crystals 10 00281 g008
Figure 9. Nitrogen adsorption/desorption isotherms at 77 K of carbon onion (OLC) before and after drug loading showing, (A) paracetamol loaded carbon onion (PA/OLC complex) and physical mixture of paracetamol and carbon onion (PA/OLC phy mix); (B) ibuprofen-loaded carbon onion (IBU/OLC complex) and physical mixture of ibuprofen and carbon onion (IBU/OLC phy mix).
Crystals 10 00281 g009
Figure 10. Pore size distribution (2–14 nm) calculated using NLDFT slit-shaped pore model of carbon onion (OLC) before and after drug loading showing- (A) paracetamol-loaded carbon onion (PA/OLC complex) and physical mixture of paracetamol and carbon onion (PA/OLC phy mix); (B) ibuprofen-loaded carbon onion (IBU/OLC complex) and physical mixture of ibuprofen and carbon onion (IBU/OLC phy mix).
Crystals 10 00281 g010
Figure 11. Cytotoxicity of carbon onion against Caco-2 cells. MTT assay was used to analyse the survival rate of Caco-2 cells incubated with different concentrations of carbon onion. Statistically significant differences compared to control (0 µg/mL) are noted for P < 0.05 (** P < 0.01; *** P < 0.001; **** P < 0.0001, one-way ANOVA and Dunnett’s multiple comparison test). Results are the mean of triplicate experiments ± SD.
Crystals 10 00281 g011
Table 1. Particle size characteristics of carbon onions obtained from laser diffraction analysis.
MaterialX10a (µm)X50b (µm)X90c (µm)Volume Mean Diameter (µm)Span
Carbon onion0.88 ± 0.02.2 ± 0.07.45 ± 0.023.37 ± 0.012.99 ± 0.01
a Particle dimension corresponding to 10% of the cumulative undersize distribution; b Median particle dimension; c Particle dimension corresponding to 90% of the cumulative undersize distribution.
Table 2. Kinetic parameters of drug release from paracetamol and ibuprofen loaded carbon onion corresponding to a 2-step release with an initial burst effect during 3 to 10 min.
Higuchi Diffusion Two Step
SampleDurationRate ConstantLinear Regression Coefficient
PA/OLC complex at pH 5.83–10 min46.340.999
10–20 min16.910.797
IBU/OLC complex at pH 7.23–10 min48.070.94
10–20 min13.870.916
Table 3. Surface areas and pore volumes obtained from nitrogen sorption of carbon onion (OLC), ibuprofen-loaded carbon onion (IBU/OLC complex) and paracetamol loaded carbon onion (PA/OLC complex).
SampleSpecific Surface Area1 (m2/g)Total Pore Volume (cm3/g)Micro Pore Volume2 (cm3/g)
OLC293.31.20.03
PA/OLC complex-11.5%138.40.730.002
PA/OLC phy mix-11.5%210.10.860.015
IBU/OLC complex-20.7%46.10.270
IBU/OLC phy mix-20.7%65.40.380
1 Calculated by BET method; 2 Calculated by NLDFT method.

