Review

Applications of X-ray Powder Diffraction in Protein Crystallography and Drug Screening

by
Maria Spiliopoulou
1,
Alexandros Valmas
1,
Dimitris-Panagiotis Triandafillidis
1,
Christos Kosinas
1,
Andrew Fitch
2,
Fotini Karavassili
1 and
Irene Margiolaki
1,*
1
Section of Genetics, Cell Biology and Development, Department of Biology, University of Patras, GR-26500 Patras, Greece
2
European Synchrotron Radiation Facility, BP 220, 38043 Grenoble CEDEX 9, France
*
Author to whom correspondence should be addressed.
Crystals 2020, 10(2), 54; https://doi.org/10.3390/cryst10020054
Submission received: 12 December 2019 / Revised: 15 January 2020 / Accepted: 15 January 2020 / Published: 21 January 2020

Abstract

:
Providing fundamental information on intra/intermolecular interactions and physicochemical properties, the three-dimensional structural characterization of biological macromolecules is of extreme importance towards understanding their mechanism of action. Among other methods, X-ray powder diffraction (XRPD) has proved its applicability and efficiency in numerous studies of different materials. Owing to recent methodological advances, this method is now considered a respectable tool for identifying macromolecular phase transitions, quantitative analysis, and determining structural modifications of samples ranging from small organics to full-length proteins. An overview of the XRPD applications and recent improvements related to the study of challenging macromolecules and peptides toward structure-based drug design is discussed. This review congregates recent studies in the field of drug formulation and delivery processes, as well as in polymorph identification and the effect of ligands and environmental conditions upon crystal characteristics. These studies further manifest the efficiency of protein XRPD for quick and accurate preliminary structural characterization.

1. Introduction

X-ray crystallography has been for more than sixty years the most accurate and reliable approach to obtain detailed structural information for biological macromolecules. Relying on the availability of high-quality crystals, this method provides significant insights into the molecular mechanisms revealing the function of macromolecules, as well as inter/intramolecular interactions forming complex supramolecular assemblies [1,2]. Although, in recent years, Single-Crystal X-ray Diffraction (SCXD) has been considered the most powerful structural characterization tool for proteins, limitations related to the requirement of a sizeable single-crystal, stability, and diffraction quality have considerably reduced the number of molecules that can be studied via this method [3].
X-ray diffraction by crystalline powders is one of the most powerful and widely used methods for analyzing matter. It was discovered just 100 years ago, independently, by Paul Scherrer and Peter Debye in Göttingen, Germany, who managed to use the powder diffraction method for structure solution in 1916, as they studied a polycrystalline material of lithium fluoride (LiF) [4,5,6].
The SCXD method for structure solution consolidated its applicability in macromolecules early on, with the first crystal structure of a protein, myoglobin, solved in 1960, while increasing numbers of large molecules and macromolecular assemblies have been determined by crystallographic methods during the following years. In the field of X-ray Powder Diffraction (XRPD), in 1947 the Philips company introduced the first commercial powder diffractometer, while in the 1950–1960s this technique was used primarily by metallurgists and mineralogists for phase identification to study structural imperfections [7], and in some cases structure solution of inorganic materials and minerals [8,9]. The first protein crystal structure determined from high-resolution XRPD data was a variant of T3R3 human insulin-zinc complex [9].
Over the past twenty years, the use of XRPD on macromolecules has significantly improved, leading to a new era where high resolution data are regularly collected from microcrystalline precipitates [9,10,11,12]. Prior to the development of the Rietveld method [13], initially for neutron and later for X-ray powder diffraction data [14], the most common applications of XRPD included phase identification and quantitative phase analysis, especially in industrial settings [15,16].
However, a steadily increasing number of studies has underlined efficiency of the powder diffraction method in a wide spectrum of fields, including structure determination of zeolites, small organic molecules [8,17,18,19], and, more recently, biological macromolecules [9,20,21,22,23,24,25,26,27]. The use of high-resolution synchrotron data, along with new analytical procedures, have stimulated exciting progress in XRPD efficacy, expanding the variety of proteins under structural examination and constituting the technique as a strong, complementary tool to already well-established methods [23].
Although the use of polycrystalline specimens has some disadvantages, as this approach may provide low or medium resolution diffraction data (3–10Å), these samples are produced more easily and quicker than a single crystal. XRPD methods allow for the examination of low-quality crystals as an ensemble, protein polymorph screening becomes a common procedure, while time-resolved studies are also possible [23,26,28,29]. Preliminary structural features extracted from these experiments can provide crucial information toward their complete structural characterization.
Owing to the simplicity of the XRPD data collection process and the sensitivity of the method, since each polymorph reveals a unique pattern, the technique has become a robust tool for thorough examination of a wide range of microcrystalline precipitates [23,25]. Screening of crystalline polymorphism [30,31,32] is a very important step in the structural characterization of molecules of pharmaceutical interest as different crystalline polymorphs are often associated with modified physicochemical properties and/or biological activity. A pharmaceutical composition may consist of more than one component, each of which is an active pharmaceutical ingredient [33]. XRPD is extensively used for the identification of specific components when examining intermixtures of inorganics or small organics, while its applicability is steadily increasing in the context of characterizing new pharmaceutically important phases of biological macromolecules which, in combination with the crystalline nature of the corresponding compound, may display advantageous properties as increased solubility and prolonged release of the beneficial agent [24,34]. The crystalline properties of individual polymorphs and their direct correlation with a drug’s absorption, distribution, metabolism and excretion (ADME) characteristics can lead to the production of more efficient, or macromolecular, formulations with alternative methods of delivery such as sustained-release or inhaled compounds [35].
There is a plethora of cases where the application of XRPD, alone or in combination with other methods, can be applied and provide information/answers. Challenging specimens, such as some polymorphic molecular drugs, with varying physicochemical properties, can be analyzed using a combination of SCXD and XPRD measurements [36]. In a similar manner, temperature-variation XRPD studies on both crystalline and non-crystalline materials can be performed when investigating the temperature and humidity levels which affect the overall quality and stability of the final formulation [36,37], considerably enhancing differing stages of drug production processes [33,38]. In addition, XRPD often generates objectives for new pharmaceutical compositions, with further analysis of samples through the phase sorting and selection process.
The use of powder diffraction measurements additionally allow for homogeneity and purity control studies of the precipitates, revealing crucial information for the pharmaceutical industry that cannot be obtained easily via SCXD measurements, as one crystal may not be representative of the whole batch [26]. In addition, crystallite size comprising the powder can be estimated from the peak widths present in XRPD profiles [39].
The present review article focuses on recent advances in macromolecular XRPD, summarizing crystallographic case-studies of standard (models) and challenging molecules investigated under different crystallization and environmental conditions. The experimental results presented herein confirm the suitability of the method for both the extraction of structural information and polymorph screening for the purpose of therapeutics’ amelioration and design.

2. Challenging Samples: Macromolecular Assemblies & Subunits

Genome projects of several organisms have revealed numerous new genes, as well as their transcripts (proteins), which are potentially involved in the onset of certain diseases [40].
Viruses have developed different strategies for their proliferation and propagation. Visualization of diverse and complex three-dimensional structures of intact virus particles, as well as their constituent proteins and complexes as recorded in the Protein Data Bank (PDB) or in the specialized database Virus Particle Explorer (VIPER), provides scientists with useful information towards understanding their biological function [41,42,43].
Enveloped viruses have rarely yielded crystals [41]; however, solubilized protein components of their membranes have been crystallized and studied with great success. To date, about 10,837 virus-related structures are available in the PDB, more than 77% of them containing viruses only. Most virus structures in the PDB (around 85%) have been determined using X-ray crystallography (PDB: https://www.wwpdb.org/; [44]) [45]. The abovementioned structures include not only proteins forming icosahedral capsids, proteins of cylindrical viruses, and different components of tailed phages, but also many virus enzymes as proteases, and RNA/DNA polymerases [41,43].
The procedure of growing crystals implies approaches that have been for many years essentially experiential in a more or less trial-and-error process. Screening for identifying the optimal conditions has been made easier through automation and the introduction of commercially available crystallization kits and robots. Many parameters can be changed in these experiments, such as temperature, pH, and ionic strength, but perhaps the most important variable, the protein, is sometimes being neglected [40].
Advances in recombinant DNA technology in recent years have had a massive effect in the area of protein crystallization. Large amounts of pure protein produced in various expression systems allow for preliminary experiments before initiating crystallization trials, such as solubility, purity, and aggregation tendencies [46]. However, one of the most common problems that scientists have encountered with recombinant proteins produced in E. coli is the formation of inclusion bodies containing large amounts of insoluble protein [46].
The combination of methods and approaches, as well as advances in bioinformatics, protein expression, purification, and methods for accelerating crystallization and X-ray data collection are of extreme importance toward removing the so-called “crystallization bottleneck” from the process of determining protein crystal structures [40,46,47,48,49,50,51,52]. Among other approaches, the XRPD method shows a significant gain in time, especially in the case of complex and difficult-to-crystallize molecules, as it contributes to the detection of crystalline symmetry and phase sorting, through the comprehensive examination of even low-quality crystals.

2.1. Polycrystalline Samples and First Virus Protein XRPD Studies

Macromolecular crystallization in general is an inherently complex phenomenon [53], while the most appropriate way to correlate the precipitant agents with the protein concentration is the phase diagram.
Crystallization techniques, even the most sophisticated among them [54,55], attempt to drive the solution briefly to the nucleation and then the metastable zone. Each method follows a different trajectory (Figure 1; [56]). Crystallization proceeds in two phases: nucleation and growth. Once a critical nucleus is formed, growth follows spontaneously [56,57,58,59]. Nonetheless, excess nucleation consistently occurs, resulting in the formation of numerous low-quality micro-/nano-crystals [60,61].
In earlier days, XRPD methods were employed toward the investigation of several different crystalline proteins [63]. This kind of research established the presence of long lattice spacings in the corresponding structures and confirmed the applicability of X-ray diffraction studies of macromolecules.
XRPD data depicted as Debye-Scherrer rings were also obtained from virus proteins and specifically from precipitated tobacco mosaic virus proteins [64]. In this study, emphasis was placed on the large number of peaks in the diffraction profiles (within a range of 80–3 Å). Indeed, it was reported that those patterns were exactly as expected for crystalline samples of molecules as large as these proteins. Further studies of other plant virus proteins [65] allowed for the determination of unit cell dimensions in several cases. Additionally, the use of powder methods was also broadened in a study of the crystalline inclusion bodies (1–3 mm in linear size) of cytoplasmic polyhedrosis virus from Bombyx mori [23,66,67]. They were placed in a capillary tube while immersed in buffer and X-ray diffraction experiments led to powder data extending to 8.2 Å resolution. However, reductions in crystal size below ~20 μm for a 100 Å unit cell are not foreseen soon due to radiation damage effects [68]. Undeniably, the solution and refinement of structures from sub-μm sized protein crystals containing only a few unit cells is still a major challenge for crystallography [23].

2.2. Preliminary Structural Data of Virus Proteins via XRPD

The necessity of many proteins to create considerably large and well-diffracting single crystals has underlined the applicability of XRPD for the structural characterization of virus proteins. The latter was originally confirmed a decade ago, when the macro domain moiety of the nsP3 protein from the Mayaro virus (MAYV), which appears in tropic regions of South America, was investigated. Despite significant efforts, good quality single crystals of the MAYV nsP3 macro domain were not available, whereas crystallization trials resulted in reproducible needle-shaped microcrystalline samples and the first structural information was obtained via synchrotron XRPD measurements [69]. X-ray diffraction data were collected at the European Synchrotron Radiation Facility (ESRF) while indexing of the diffraction patterns indicated a trigonal/ hexagonal unit cell (space group: P31, a = 61.603 (3) Å, c = 94.619 (5) Å) (Figure 2).
In addition, the application of the XRPD method provides the advantage of considerably reducing the amount of time necessary for fine-tuning crystallization experiments, and in the case of virus proteins, it may be useful to examine multiple crystallization conditions by investigating the formation of different crystalline polymorphs [70,71,72]. This allows for the examination of physicochemical characteristics that each polymorph bears, as well as the ability to bind molecules that inactivate the action of any such protein, considering their potential utility as drug precursors.
The applicability of XRPD measurements in antiviral research, and its ability to provide preliminary structural information as first shown from Papageorgiou and colleagues (2010), triggered the research around difficult-to-crystallize virus proteins. Recently, a study focused on a 20.5kDa protein, protease 3C (3Cpro) of an emerging Enterovirus, Coxsackievirus B3 (CVB3), has come to support this claim further [71]. CVB3 may cause various diseases ranging from pleuropneumonia or “Bornholme disease” to myocarditis leading to permanent heart damage or even death [73], while this molecule is comprised of the functional virus proteins and is responsible for the majority of proteolytic cleavages occurring within the host cell [74].
Experimentally, 3Cpro was expressed and purified in a recombinant form, employing bacterial cultures and inducible factors. A crystallization condition containing stable resolving agents was employed in a range of polymer concentrations and pH values and resulted in polycrystalline material (~50 μm). In order to optimize data quality, different instruments and sources were used for data collection.
Using laboratory instrumentation (Malvern Panalytical, X’ Pert PRO), initial extraction of unit cell parameters and crystal symmetry (indexing) was feasible, while the best diffraction profiles in terms of angular and d-spacing resolution were obtained at the ESRF, allowing accurate identification of unit-cell parameters and characterization of peak shape and background coefficients in the absence of a structural model using Pawley method [75]. XRPD data analysis demonstrated no structural modifications or alterations in the diffraction peak positions throughout the crystallization conditions examined, with all samples containing crystals of monoclinic symmetry (space group C2) (Figure 3) [71].
Recent measurements conducted at the Swiss Light Source (SLS) allowed for the collection of data of improved d-spacing resolution. The position-sensitive Mythen II detector (Paul Scherrer Institut, Villigen-PSI, Switzerland) of the Material Science (MS)-X04SA beamline considerably reduces the exposure time during diffraction measurement, enabling the acquisition of data with enhanced counting statistics before radiation damage (more pronounced at high 2θ angles) sets in (Figure 4). The combination of shorter data collection time intervals, reduced radiation damage, and increased counting statistics drastically improved the d-spacing resolution of the XRPD data, i.e., ESRF: d = 5.8Å; SLS: d = 3.2Å, suitable for preliminary structural characterization.
Analogous studies of selected virus proteins and protein domains that have a critical role in a virus’s lifecycle (suggesting potential methods for virus inactivation via lifecycle disruption) have been conducted in recent years. Dengue virus 3 (DENV3) non-structural protein 5 (NS5) participates in a virus replication system; it is a bimodular enzyme carrying a methyltransferase domain (MTase) at its N-terminus and a polymerase (RdRp) at its C-terminus. DENV3 NS5 MTase catalyzes two consecutive methylation reactions associated with the synthesis of the RNA-cap structure. Dengue viruses are, in general, pathogenic flaviviruses transmitted by Aedes mosquitoes [76], and their diseases range in severity from undifferentiated acute febrile disease, classical fever epidemic (Dengue Fever/DF) to life threatening Dengue Hemorrhagic Fever (DHF) and Dengue Shock Syndrome (DSS) conditions which may lead to neurological disorders [77].
Crystallographic studies have been performed on DENV3 NS5 MTase domain in the absence [78,79] or presence [80,81,82] of organic molecules (ligands), leading to the identification of potential inhibitors against DENV [72]. However, only a small number of examined fragments selected by a primary biophysical screening could yield well diffracting single crystals and thus the structure of the complex [80], limiting options for the development of potent inhibitors. Thus, the production of polycrystalline material, as well as XRPD structural analysis, have been performed using different crystallization conditions aiming at diffraction data collection and preliminary extraction of structural information in terms of high-throughput crystal screening and polymorph identification (Figure 5). Analysis of the synchrotron XRPD data indicated no profile variation of the diffraction patterns (peak positions) throughout the crystallization conditions examined. Pattern indexing revealed crystals with orthorhombic symmetry (space group: P21212) for all samples [72].
The aforementioned studies underline the capability of XRPD to accurately provide preliminary structural information for demanding biological samples, employing lower quality crystalline precipitate. Even in these cases, where resolution of the data does not allow for complete structural characterization, space group and lattice parameters are extracted using peak positions at the lower 2θ angles for indexing purposes [83,84]. This makes the proposed process, in a fast and systematic manner, suitable for crystal symmetry identification.
Aiming to facilitate antiviral research on a wide spectrum of virus proteins, forthcoming studies will be focused on the complete structural determination via XRPD, as well as employing the technique for the evaluation of co-crystallization experiments associated with the virus proteins with small molecules-ligands in the context of creating new pharmaceutical compounds.

2.3. Protein Structure Solution via XRPD

If powder data enclose sufficient amount of information, the structure of a specific protein can be solved and refined, a process which can be described in brief in the following steps.
Considering the fact that XRPD data are characterized by peak overlap, combining multiple data sets together where either the cell parameters or the preferred orientation is different allows the contributing reflections within a cluster of overlapped peaks to be more easily distinguished. The PRODD refinement program [23,85,86] has been modified to allow a multi-pattern Pawley fit [75] leading to more accurate intensity extraction.
Optimized peak shape and background parameters of each dataset are extracted via Le Bail method using a pseudo-Voigt peak profile function [87].
A molecular replacement (MR) step then follows [88]. A starting model is positioned and oriented in the new unit cell until the set of calculated intensities effectively match the experimental data. There are only six degrees of freedom per molecule; three of them are related to the orientation, while three more define the position of the molecule with respect to the symmetry elements of the space group.
A suite of stereochemical restraints with automatic recognition of atom and bond types for the standard amino acid residues, using the Rietveld method [13], are later implemented for structure refinement. A restraint is also used to describe the two-dimensional pseudo-potential surface of a Ramachandran plot [89], while Babinet’s principle solvent correction is employed to account for the disordered solvent within the crystal structure [90].
Pioneering experiments with polycrystalline metmyoglobin and lysozyme conducted by Von Dreele and co-workers [20,21,91,92], as well as by Margiolaki and co-workers shortly after at ESRF [10], originally introduced the idea of protein structure determination and refinement using XRPD data. A few years later and after a long series of significant methodological improvements, macromolecular powder diffraction was employed for the examination of the second SH3 (Src homology-3) domain of ponsin (SH3.2) [11], while shortly after, Doebbler and Von Dreele achieved structure solution via MR from powder diffraction data collected using image plates and not multianalyzer diffractometers [93]. The SH3.2 binds to the cytoskeletal proteins paxillin and vinculin at the extracellular matrix adhesion sites [94], while its interaction with paxillin is associated with muscle differentiation processes forming the costamers, namely the lateral cell-matrix contacts of muscle cells [95]. Unit cell characterization step (space group: P212121, a = 24.70420 (9) Å, b = 36.42638 (14) Å, c = 72.09804 (26) Å) was followed by structure solution, model building, and refinement of this 67-residue protein domain (Figure 6).
Ongoing advances in data analysis, implemented in the General Structure Analysis Software (GSAS; [90,96]) and other software packages, further enhanced the applicability of the method.
In 2013, a novel approach for refining structures of protein molecules using XRPD data was introduced in GSAS, where each amino acid is considered as a flexible rigid body (FRB), requiring a smaller number of refinable parameters and restraints [12]. The approach was applied for the structure refinement of the T6 hexameric form of bovine insulin, a highly homologous molecule to human hormone, responsible for glucose metabolism.
A total of 1542 stereochemical restraints were imposed in order to refine the positions of 800 protein atoms, two Zn2+ atoms, and 44 water molecules in the asymmetric unit using experimental data in the resolution range 18.2–2.7 Å. The molecular structure was obtained via a 14-pattern stereochemically-restrained Rietveld refinement which exploits the anisotropic variations in unit-cell parameters for T6 insulin, resolving, therefore, the peak-overlap phenomenon [11,97] and resulting in an average crystal structure over a pH range of 5.9 to 7.7 (Figure 7).

3. Polymorph Identification

An important feature of crystalline matter for pharmaceutical industries towards drug development is polymorphism, meaning the ability of a molecule or compound to exist in one or more molecular as well as crystalline phases [98]. Variation in the crystallization conditions like solvent polarity, initial macromolecular concentration, and precipitant agents may result in different crystal and/or molecular polymorphs [30,31,32,99].
Differences in crystalline polymorph physicochemical characteristics may determine the manufacturability of a drug candidate [100,101] or affect production processes and properties such as stability, bioavailability, and toxicity of the final pharmaceutical product, and, ultimately, the therapeutic efficacy of the substance [102,103]. Approximately 90% of the existing pharmaceutical compounds based in small organic molecules have been reported to consist of more than one crystalline phase [104], each of which can exhibit diverse properties [105,106].
XRPD is a front-line technique in polymorph screening, as it provides a fingerprint of every crystalline phase exhibiting a unique diffraction pattern. Specifically, with XRPD patterns, differences between the various crystalline forms can be observed by examining the peak positions and intensities [101] (Figure 8). Even small changes in the XRPD patterns in the form of new peaks, additional shoulders, or shifts in the peak positions often imply the presence of a second polymorph [107]. Thus, information about crystalline sample composition is obtained, yielding knowledge of whether it consists of one or more phases. The existence of multiple phases in the same formulation can be problematic when homogenous formulations are required, which is usually the case. Understanding the crystalline form(s) of a pharmaceutical compound provides a road map to help directly development processes at multiple levels, ranging from crystallization, formulation, packaging, storage, and performance of the selected polymorph in addition to the preferred ADME characteristics [35].

3.1. Macromolecular Polymorph Screening: The Case of Human Insulin

Human insulin (HI), a peptide hormone of 5.8 kDa produced by β-pancreatic cells that promotes carbohydrates absorption from the blood to the tissues, was one of the first proteins ever isolated [108] and crystallographically studied [109]. In its active form, HI insulin consists of 51 amino acids in two polypeptide chains: A and B (21 and 30 amino acids, respectively). The secondary structure of insulin consists of two, almost antiparallel, α-helices in chain A and one α-helix followed by a turn and a β-strand in chain B [110]. The tertiary structure is stabilized by two inter-chain and one intra-chain (in chain A) disulfide bonds, crucial for proper binding to the insulin receptor [111].
Historically, the first insulin crystals were produced in 1926 comprising the rhombohedral symmetry (R3) with T6 chain B configuration [112]. In 1934, David Aylmer Scott noted that the addition of zinc (Zn) and other divalent metals (such as Cd, Co, Ni) was necessary to create crystals [113]. There is a variety of insulin formulations and analogues against diabetes with different onset (time until action), peak (time to achieve the maximum impact), and duration (time until they wear off) of action. Several studies are also underlying the advantages of microcrystalline HI drugs over aqueous formulations, as they provide higher compound concentration, increased stability, and resistance to structural modifications since they are less prone to chemical or enzymatic degradation [114]. Toward improvement of the onset of insulin injections, first successful results were recorded in 1936 when Hagedorn mixed insulin, zinc (Zn), and protamine [115], producing a less soluble complex (NPH-Neutral Protamine Hagedorn), the ancestor of all modern insulin formulations of prolonged-action. A few years later, the production of the Lente [116] series and the examination of various crystallization parameters including pH, zinc, and insulin concentrations (protamine-free) prepared the ground for the production of an ever-growing variety of preparations with differing durations of action (Table 1). These preparations contain either crystalline, amorphous, or intermixtures of both (such as Semilente formulation), while insulin molecules with altered amino acid sequence (i.e., insulin analogues) are also commercially available in the form of ready-for-injection, solution (Aspart, Lispo, Glargine, etc.) [117].
The structural behavior of HI is at the center of scientific interest, owing to its high crystal and molecular polymorphism [119]. To date, several different crystal polymorphs of monoclinic, rhombohedral, tetragonal, and cubic symmetries have been identified in various crystallization conditions. Insulin microcrystals enclose zinc-based insulin hexamers in one out of three different conformations, known as T6, T3R3f and R6, depending on the conformation of monomers’ N-terminal residues of chain B (Figure 9). T stands for an extended, Rf for a “frayed” intermediate and R for a helical conformation, while the subscript is indicative of the number of monomers that exhibit the aforementioned arrangement [120]. Phenolic or non-phenolic organic molecules that can act as ligands have been used in HI co-crystallization experiments, resulting in a diverse assortment of polymorphs [30,31,32,98,120,121,122].
The interconversion among the three conformations is mediated by ligand-binding in allosteric sites with the most important among them being the hydrophobic pockets (3 in T3R3f and 6 in R6), which bind phenol-like ligands [99,124]. In the absence of allosteric ligands, insulin hexamers adopt the T6 conformation. The T3R3f conformation can be induced by thiocyanate anions [125] while T3R3f and R6 conformations are induced and further stabilized by the binding of phenol and its derivatives to the abovementioned hydrophobic pockets (phenolic pockets) [122,126,127]. The three conformations display different biochemical stability in the following, descending order: R6 > T3R3f > T6 [128]. Furthermore, it is examined whether a single microcrystalline pharmaceutical formulation could contain two active components, via the co-crystallization of HI with selected organic molecules of proven pharmacological importance, providing better regulation of insulin release which will be combined with the availability and the mode of action of the co-crystallized molecule.
It is evident that insulin is distinguished for its polymorphism at both the molecular and crystal levels. A combination of both types of polymorphic characteristics may lead to products with improved features. Thus, identification of these polymorphs must be performed in the polycrystalline sample which should be examined as unity. XRPD is the optimum research tool that makes this type of study feasible. Early attempts were made by Norrman and his colleagues in 2006 [122], but data quality only allowed for the extraction of limited structural information via data clustering based on their similarities and principal component analysis [129]. XRPD patterns of each cluster can, however, be used as “fingerprints” for the different insulin polymorphs. In the following years, improvements in instrumentation led to enhanced data resolution maximizing the extracted structural information.
External insulin is provided subcutaneously via injections obviating its degradation by gastric enzymes, while research aiming toward administration of HI in the form of a pill or inhalation is still proceeding [130,131,132,133].

3.2. Distinct and Novel HI Polymorphs Identified via XRPD

Depending on pH and ion concentration upon crystallization, the conformation of HI shifts between different molecular and crystal polymorphs. In “ligand-free” samples, in cases when pH ranges from 5 to 6.5, the rhombohedral symmetry (T6 molecular conformation) of HI (space group: R3, a = 82.99 Å, c = 34.07 Å) has been identified, while in pH range from 6.9 to 7.5, the T6 alters to T3R3f (a = 80.66 Å, c = 37.74 Å), a transition which is evidently depicted in peak position changes (Figure 10).
Early results indicate an additional structural modification in samples prepared at pH values 7.8–8.6 as a first order phase transition occurs, and HI molecules obtain cubic symmetry (space group: I213, a = 79.1 Å) (PDB ID: 9INS, [134]). The coexistence of two phases in pH range from 7.02 to 7.39 was evident in high resolution diffraction profiles from synchrotron source, the quality of which allowed for simultaneous refinement and accurate extraction of unit-cell parameters via Pawley method.
The structural behavior of HI in the presence of several organic additives, mainly phenolic derivatives which were originally used in pharmaceutical compounds as preservatives by virtue of their antimicrobial properties, has been extensively studied [30,121,135]. In the presence of phenolic ligands, insulin-based pharmaceutical products bear improved physicochemical properties, as well as enhanced resistance to degradation. Toward the development of new pharmaceuticals and improving already existing ones, molecules with well-established pharmacological action employed as ligands provide new prospects for currently known treatment approaches.
Widely employed ligands such as phenol, resorcinol, and m-cresol enter inside the hydrophobic pockets of insulin and strongly stabilize the hexameric conformation by forming two H-bonds between the phenolic hydroxyl and the carbonyl oxygen of CysA6 and the amide NH of CysA11 at one end of the pocket [124].
Another important factor which strongly affects insulin and protein crystallinity in general is the crystallization pH, as this has been established by several earlier studies [136,137,138,139]. Within a wide pH range, protein molecules may modify in various ways, leading, for example, to partial amino acid neutralization, disrupting the formation of salt bridges between protein molecules, and thus decreasing the crystallization rate.
One of the first successful structure refinements using XRPD data was conducted by R.B. Von Dreele and referred to insulin, when a sample of microcrystalline precipitate, produced as a byproduct of single crystal production process, was examined. The experiment led to the identification of a previously unknown rhombohedral polymorph with a = 81.2780 (7) Å, c = 73.0389 (9) Å, which is fundamentally a doubled c axis superlattice of the T3R3f structure (a phase denoted as T3R3fDC). The complete structural determination was achieved via XRPD and verified later via SCXD experiments [140].
Novel insulin polymorphs were also reported by Norrman & Schluckebier [120], providing a driving force for further research on insulin. Specifically, variation in pH and co-crystallization with different ligands led to the production of new crystalline polymorphs with diverse physicochemical properties, thorough investigation, and analysis of which revealed enhanced characteristics in terms of physical stability and dissolution rate. Polycrystalline materials of bovine insulin were studied later on, in pH values from 5.0 to 7.6 [12] and data disclosed to the T6 hexameric insulin conformation (space group: R3, a = 82.5951 (9) Å, c = 33.6089 (3) Å for the sample crystallized at pH: 5.0).
Despite significant efforts devoted to the structural characterization of HI and its complexes with different ligands, there are still novel crystalline phases to be discovered complementary to the rich diagram of phase transitions including the C2221 and C2 polymorphs identified a few years ago [120,122], and two previously unknown monoclinic formulations, P21(α) & P21(γ), reported by our team [30,31,32].
To date, our research has been focused on the polymorph identification using the XRPD method for HI in the absence and presence of organic ligands and phenolic derivatives in pH variation. Ligands such as phenol and resorcinol derivatives which led to the formation of more than one monoclinic symmetry polymorphs are of particular interest [31,32] (Figure 11). The previously referenced P21(γ) crystal polymorph (a = 87.0749 (7) Å, b = 70.1190 (5) Å, c = 48.1679 (5) Å, β = 106.7442 (8)°) was identified in cases of HI crystallization in the presence of m-cresol (pH: 4.5 to 6.7) and 4-nitrophenol (pH: 5.1 to 6.3), as illustrated in Table 2, while in pH: 6.7 to 8.6 and 6.2 to 8.1, the complexes adopt the rhombohedral R3 symmetry, with R6 and T3R3f HI conformation accordingly [26,31].
In the remarkable case of 4-ethytlresorsinol, monoclinic symmetry was observed throughout the whole pH range (4.95 to 8.05) for repeated crystallization experiments [32]. Four different monoclinic polymorphs were identified, two of which [C2 and P21(β)] were structurally known, whereas the other two belong to the P21 space group and were first reported by our team in previous studies [P21(α) and P21(γ)] [30,31] (Table 2), with HI obtaining the R6 molecular conformation, in the case of P21(γ) polymorph.
Even more recent studies from our research team revealed two additional novel monoclinic polymorphs in cases of co-crystallization of HI with two phenolic derivatives, p-coumaric acid and resveratrol [99]. The first one, namely P21(η), was identified in the presence of p-coumaric acid (pH: 5.44 to 5.82) and resveratrol (pH: 5.06 to 5.46) with unit-cell parameters a = 77.4210 (1) Å, b = 46.7125 (7) Å, c = 82.8445 (1) Å, β = 111.063 (2)°, while the second, P21(ζ) (a = 48.2712 (8) Å, b = 68.513 (1) Å, c = 41.6667(8) Å, β = 95.030 (1)°), has been identified in the pH: 5.82 to 5.69 and pH: 5.46 to 5.81 in HI- p-coumaric and HI- resveratrol crystals respectively (Figure 12, Table 2). However, both complexes obtain the rhombohedral R3 in pH values around 6.5 to 7.5, while for HI- p-coumaric crystals an additional first order transition to cubic phase (space group: I213), was detected.
It has also been reported that binding interactions of ligands in the phenolic pockets are further stabilized by the binding of certain anions such as halides, pseudohalides, and organic carboxylates [124,128,141,142]. Based on the previously identified HI complexes with small organic molecules, distinct and novel monoclinic P21 polymorphs have been reported, mainly in mild acidic pH (5.3–6.5), around the isoelectric point of HI -. Concerning the pH of the newly identified polymorphs, we could speculate that HI molecules, due to their decreased electric charge around pI, are more receptive to adopt various crystalline conformations of low symmetry, a process strongly affected by the presence of all different ligands. Furthermore, it seems that P21(ζ) polymorph is of the highest packaging efficiency among P21 polymorphs, according to the percentage of unit-cell volume occupied by protein molecules [143], as listed in Table 3. Owing to the very dense molecular packing, additional inter-hexamer interactions may arise, further increasing stability, and, thus, extending the life of crystalline insulin formulations. The latter could be of particular interest for the development of therapeutics as the combination of tightly packed hexamers and minimum amount of solvent is often linked directly with prolonged disassociation period after injection.
The XRPD technique is increasingly used in the context of characterizing pharmaceutically important crystalline phases, which may display advantageous physicochemical characteristics such as altered solubility levels and prolonged release of the active pharmaceutical ingredient, based on identification of the composition of macromolecular polycrystalline precipitates.

3.3. Macromolecular Polymorph Screening: The Case of Urate Oxidase

The identification of novel HI formulations with remarkable physicochemical properties reinforced the use of powder diffraction as a rudimentary/fundamental tool in daily research, important for identification and verification of batch-to-batch abnormalities during large-scale crystallization in the production process. However, HI is not the only highly polymorphic protein upon which the validity of XRPD was attested. Another molecule of high pharmacological importance, rasburicase (recombinant urate oxidase enzyme (Uox) from Aspergillus flavus), a homotetrameric enzyme of 135 kDa, was also examined.
Uox triggers the initial step in the degradation of uric acid to allantoin; however, it is absent in humans. Even though uric acid has strong antioxidant properties, higher concentrations of the molecule can lead to acute hyperuricemia and gout. Consequently, Uox can be used as a protein-based drug [24,144].
Crystallization may be employed in order to formulate a protein drug [35,145], as it ensures better stability of the molecule than in a solution for storage and has a considerably lower manufacturing cost in contrast with lyophilization. Additionally, this approach allows for a highly concentrated formulation with minimum viscosity, which makes drug handling significantly easier.
Different protocols were followed exploiting a variety of crystallization conditions. In all cases, Uox when complexed with the inhibitor 8-azaxanthine (AZA), was not altered from orthorhombic I222 phase. However, in the absence of AZA during crystallization, ligand free Uox was significantly affected by the type of salt, resulting in different crystal forms [35] (Figure 13). The related crystalline phases were characterized by means of high-resolution synchrotron X-ray powder diffraction, verifying the homogeneity and phase purity of the protein precipitants whereas the extraction of accurate lattice parameters allow for direct observation of slight structure modifications due to radiation and/or sample induced effects.

4. Drug Screening

XRPD has been recently recognized to be at the forefront of industrial studies as an analytical tool of pharmaceuticals due to its wide range of applications [36]. Namely, the technique is ideal for the identification of impurities, monitoring of structural changes and different crystal or molecular polymorphs that often occur during drug formulation [37]. Therefore, in early drug development processes, XRPD is often used as a primary research technique and a means of differentiating between the experimentally generated materials [146].
The applicability of the method in detecting and certifying different polymorphs, as previously discussed, as well as its ability to detect fine characteristics of the microcrystals (for example their size and strains) allows for its use towards improvement of the final form of the drug, aiming at greater potency at the lowest possible cost [147]. This is an important aspect as any change in the crystalline state of the active ingredient(s) in the final product, as a result of the manufacturing process, can influence the drug’s bioavailability. Thus, detection of any changes in morphology during production will ensure the consistent behavior of the final product, making the method directly related to the final drug performance.
Owing to the holistic approach of which samples are measured via XRPD, materials can be investigated directly under the conditions in which they would be used for specific applications. In particular, the applicability of the method lies largely in the ability to detect percentages of the individual crystalline component of the drugs in the final dosage form, together with the percentage of any amorphous or crystallization agents (i.e., salts) used [148].
As an additional advantage, XRPD can be employed for the analysis of final dosage forms, leading toward the determination of the integrity of the active ingredient in the final product, while its capacity for detection of crystalline impurities reaches 0.05% when inorganic or small organic molecules are under examination [146,149]. The crystallinity percentage is a valuable parameter for drug dosage forms in certain cases, as it has a significant influence on manufacturing and processing as well as the pharmacological behavior. In the following sections, the use of the XRPD method for the structural characterization of pharmaceutical peptides is reported. In addition, in-situ studies of the physicochemical stability of protein crystals in terms of variable temperature and relative humidity, as well as their applicability in the development of therapeutics, are also discussed.

4.1. Structure Refinement of a Pharmaceutical Peptide via XRPD

Currently, the majority of pharmaceutical products that are used to treat a wide spectrum of diseases are small-molecular-weight, well-characterized molecules that are generally manufactured by chemical synthesis [150]. Especially synthetic peptides which constitute analogues of natural hormones are of high scientific interest due to their wide range of pharmaceutical and biological properties. In these cases, the artificial peptides are much smaller than the native hormone, while specific modifications in amino acid sequence provide them with increased activity and resistance to proteases following their administration to the human body [151].
A peptide that constitutes a representative example of synthetic analogues is octreotide, an eight-amino-acid molecule that mimics the action of the 14-amino acid human somatostatin hormone. Its superior characteristics lie mostly on the molecule’s longer half-life (up to 2 h) than somatostatin and could be infused at intervals, or even be orally administered [152]. Octreotide’s multiple physiological functions and applications have led to its widespread clinical use.
Octreotide was modified by somatostatin-14 (SS-14), with amino acids 7 to 10 (Phe7-Trp8-Lys9-Thr10) being commonly retained, since they are considered as essential receptor-binding amino acids. In octreotide, this active four-peptide sequence is structurally restricted by a disulfide bridge. Additionally, in octreotide the terminal Thr-COOH group is reduced to an alcoholic group (Figure 14), which is, in theory, more stable to enzymatic degradation while Trp4 (L-Tryptophan) has been replaced by the non-natural enantiomer D-Tryptophan [153], in order to increase the peptide’s biological activity, overcoming difficulties like proteolytic degradation in the application site [154]. Thus, research on in vivo stable synthetic SS agonists has been focused on peptides containing the necessary -Phe7-(D)Trp8-Lys9-Thr10- fragment.
Owing to the fact that the latest crystallographic study of this peptide was performed back in 1995 [153], our research team decided to conduct new XRPD measurements of freshly prepared polycrystalline specimens, in order to elucidate the three-dimensional arrangement of the peptide aiming towards the examination of its properties and the investigation of the existence of different polymorphs [34]. Additionally, in the abovementioned study, it is discussed if the polycrystalline precipitates produced could be employed in the production of longer-lasting formulations of the specific molecule.
High angular resolution XRPD data, owing to reduced peak overlap and signal-to-noise ratio, were collected for octreotide at room temperature (RT) on ID22 [156], at the European Synchrotron Radiation Facility (ESRF), with a wavelength of 1.300017 (2) Å (dres_ESRF = 2.85 Å), while in-house data were also obtained using an X’ Pert PRO instrument [λ = 1.540585 (3) Å]. Additional measurements were performed on the MS-X04SA beamline at the SLS [157] in Villigen, where samples were measured at RT using a wavelength of 1.3004392 (8) Å (dres_SLS = 1.87 Å) and a position-sensitive Mythen II detector (Figure 15).
Indexing revealed the presence of the orthorhombic crystal symmetry (space group: P212121, a = 18.5453 (15) Å, b = 30.1766 (25) Å and c = 39.798 (4) Å) while data quality allowed for the complete structure determination using the FRB approach in GSAS program [34] (Figure 16).

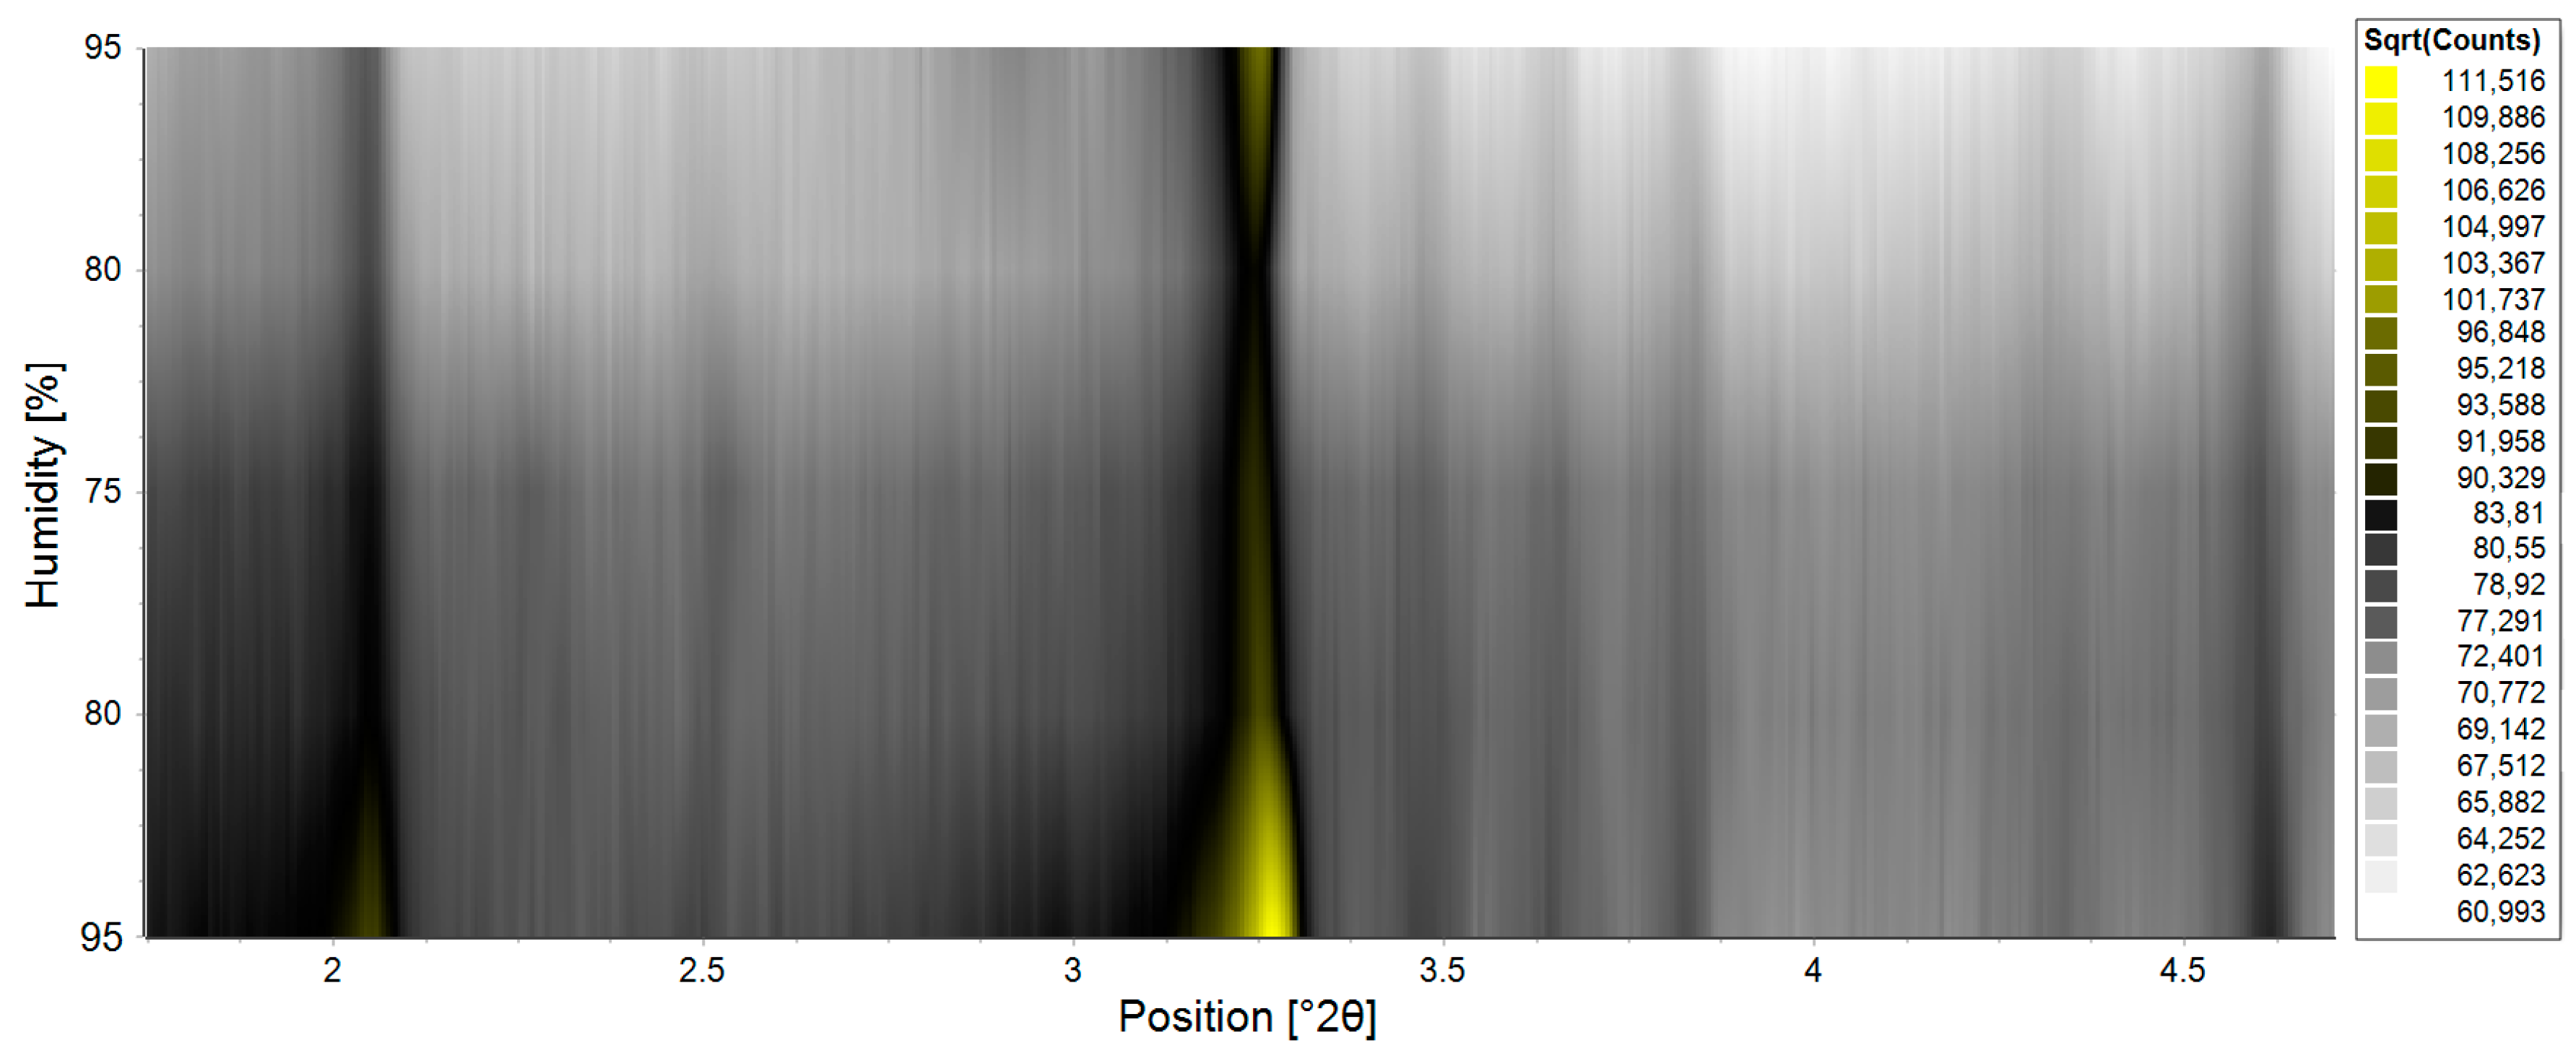
4.2. In Situ XRPD Measurements upon Variation of the Physicochemical Environment

Structural behavior as well as dehydration range tolerance in response to environmental changes are of extreme importance for a variety of pharmaceutical compounds with regard to optimization of their production and storage conditions. Today, a steadily increasing fraction of pharmaceutical compounds contain well-hydrated micro-/nano-crystals constituted from a wide selection of molecules ranging from inorganics to small organics and more recently peptides and proteins [158]. XRPD measurements upon relative humidity (rH) or temperature variation are routinely employed for identification of structural modifications for small organics and inorganics [36,159], an approach which until recently was not common for molecular microcrystals.
In cases of protein/peptide crystals, extensive amounts of solvent are present, surrounding macromolecules with layers of water molecules which preserve their structure during crystallization [160,161]. The amount of water is closely related to relative humidity or temperature levels around the sample. Even small changes in the sample’s environment may cause subsequent alterations in solvent channels, driving protein molecules not to occupy exactly equivalent positions within or between unit cells, frequently leading to insufficient resolution of their diffraction patterns [28,29,162,163].
The correlation between solvent content and protein crystal quality has been extensively examined so far [164,165,166,167] and in few cases fine-tuned [168,169,170]. Initial experiments revealed that complete dehydration of a protein crystal leads to crystal fracturing and thus diffraction signal [171], while additional experiments have shown that controlled reduction of relative humidity (rH) levels significantly improve diffraction quality [172,173,174,175,176].
XRPD experiments upon variable temperature and relative humidity can be conducted employing laboratory X-ray sources properly equipped with a built-in transmission temperature-humidity chamber allowing for in situ studies with gradual variation of environmental conditions. The main goals of such experiments are either the improvement of the diffraction patterns obtained, or, from a biological point of view, the structural characterization of a molecule in a very specific condition or the inspection of its behavior upon rH variation.
Recently, the effect of relative humidity on protein crystal structures, was investigated in two studies of hen egg-white lysozyme (HEWL) polycrystalline precipitates, via in situ laboratory XRPD measurements [28,29]. Two different crystallization protocols were employed in which microcrystals were grown using the salting-out approach [177] in batch by mixing equal amounts of protein solution and crystallization buffer [28,29].
In-situ XRPD data were collected upon controlled rH variation using a laboratory Empyrean diffractometer (Malvern Panalytical) equipped with a built-in transmission temperature humidity chamber (MHC-trans Anton Paar) [178]. Polycrystalline specimens were loaded into thin Kapton-foil holders in order to reduce background contribution and were placed on a multiple position sample holder inside the chamber. In order to investigate the behavior of HEWL crystals over a wide humidity range, two series of experiments were performed: direct crystal dehydration to lower humidity levels (type 1) and gradual crystal de-/re-hydration experiments (type 2). In general, all experiments were conducted following the steps: 1. Set of a specific rH level; 2. Equilibration (minutes to hours) between sample and its environment; 3. XRPD data collection; 4. Change to a new rH level.
Once all diffraction patterns were obtained (Figure 17), they were indexed employing the Dicvol indexing package [179] from the fitted positions of at least the first 20 reflections of the powder diffraction profiles. In order to obtain accurate values of the unit-cell parameters and characterize the peak shape and background coefficients without a structural model, Pawley fits were performed. All tasks were executed using HighScore Plus software [180].
Analysis of XRPD data, which were collected during humidity variation experiments, revealed several structural modifications, as well as a novel monoclinic HEWL phase which, to our knowledge, has never been observed before. When HEWL was crystallized at pH 4.5 and 293K, a new polymorph of monoclinic symmetry (space group P21) was obtained with unit-cell parameters a = 28.174 (9) Å, b = 54.490 (2) Å, c = 71.286 (2) Å, β = 96.079 (2)˚, while in the presence of 0.1 M sodium acetate, 2.4 M NaCl, pH 4.5 and T = 277 K, crystals of tetragonal symmetry (space group P43212, a = 79.05, c = 38.09 Å) (PDB ID: 1JIS, [181]) were identified via high-resolution XRPD data collection. In both cases, no intermixture of crystalline phases was observed (Figure 18).
Structural changes have been observed during both direct and gradual dehydration of the crystals. When the rH levels were slowly decreased, crystals kept their structure for a longer time than during rapid humidity reduction. Rehydration of the already dehydrated crystalline samples was also employed in order to examine the feasibility of the almost collapsed crystal matrix reorganization. In samples where crystallinity was not completely lost at low rH levels, rehydration was successful, restoring the crystal structure and diffraction data quality. However, after long exposure, collapse of the crystal matrix was irreversible. These experiments indicate that the lowest rH at which crystals preserve their structure is between 75% and 80% for those of monoclinic symmetry, and between 71% and 75% for those of tetragonal symmetry, while they underlined the need of long enough waiting time for the crystalline samples to reach their equilibrium [28,29].
This is the first study establishing a preliminary protocol for quick and accurate extraction of structural information from protein polycrystalline precipitates upon humidity variation using X-ray powder diffraction and laboratory instrumentation. These observations, on a well-studied molecule such as HEWL, underlie not only the high impact of humidity on biological crystal structures, but also the significance of in-house XRPD as an analytical tool in industrial drug development and its potential to provide information for enhancing manufacturing of pharmaceuticals.

5. Conclusions and Perspectives

The present review article outlines the application of XRPD methods to different types of biological samples in order to design and improve pharmaceutical formulations. The important contribution of microcrystalline drug technology is indisputable due to its advantages in terms of the protection of beneficial substances, but also the screening of molecular and crystalline polymorphs, leading to prolonged action formulations. During the last twenty years, significant progress has been made in the field of macromolecular powder diffraction, while recent advances of experimental methods and computational tools have strengthened this technique and widened the systems that can be studied.
Polymorphism of therapeutic substances must be fully characterized in order to formulate a drug. XRPD has proved its applicability as the most suitable tool for high throughput and accurate characterization of numerous microcrystalline suspensions by virtue of the simplicity of XRPD data collection and the uniqueness of each polymorph’s diffraction pattern. To date, research reports on HI microcrystals exhibit fascinating polymorphism, occurring upon physicochemical modifications of their environment, namely pH, temperature, and relative humidity, or ligand binding and further expanding the phase diagram of the molecule [26]. Further advantages from the use of XRPD measurements include homogeneity and purity control of the precipitates, whereas, even in cases of challenging samples, powders can easily lead to the extraction of accurate lattice parameters which allow for the detection of structural modifications. Moreover, the combined action of molecules used for co-crystallization could be exploited for the design of a microcrystalline drugs with further benefits, whereas exploration of the physicochemical characteristics of polymorphs obtained could develop drugs to replace the high concentrated injectable solutions available today, leading to a minimization of injection times offering a life-quality improvement of great importance for millions of patients.
As discussed, a very important field that benefits from the XRPD technique is the development of drugs from small peptides/hormone analogues, a challenge with particular prospects due to the enhanced characteristics of the modified peptides, in combination with the protective properties of the crystals [154]. A deeper understanding of the physicochemical features related to the conformation and action of these peptides through enhanced ADME tools will help in accelerating the development of peptides in successful drugs [182].
Despite the widely reported advantages, the technique has also some limitations compared to SCXD, mainly related to quantity of the crystalline material needed and the quality the diffraction data. XRPD method requires high amount of polycrystalline precipitate for a single measurement, which is rapidly destroyed by radiation damage as cryoprotection strategies considerably affect diffraction quality. Additionally, there is a considerable loss of structural information, as 3D data are collapsed into one-dimension detectors.
The most important problem, nevertheless, arises from the overlapping reflections, as a large number of crystals contribute to different diffraction signals simultaneously, complicating considerably the analysis of the diffraction data obtained.
However, advances in instrumentation as well as the development of powerful crystallographic software have significantly facilitated the collection of high-resolution diffraction data and have made XRPD particularly useful for the extraction of structural information. For example, ID22 experimental station at ESRF provides the possibility of using a two-dimensional detector in combination with crystal analyzers in order to retrieve high-resolution powder diffraction patterns [183], while, employing the Mythen II detector of MS-X04SA at SLS [157] and following a strategy which combines vertical focus of the beam on the detector instead of the sample and data collection at multiple detector positions, dataset’s angular resolution capabilities have been expanded.
Furthermore, introduction of the free-electron X-ray laser (XFEL) to structure and dynamics in biology have the potential to prevent the effects of radiation damage [184]. XFELs provide femtosecond pulses with up to 1012 higher photon flux than synchrotrons [185], allowing both structure determination and time-resolved studies of submicrometer crystals that are small XRPD measurements, by delivering them to the XFEL beam in a stream of their mother liquid at room temperature [186,187]. The speed and brightness offered by XFELs are crucial for certain types of experiments, and pulses are so short that data can be collected avoiding the effects of radiation damage [188]. This application of XFELs is valuable for the field of structural biology, creating many new opportunities for crystallography and imaging at atomic resolution on timescales from femtoseconds to seconds (Serial Femtosecond Crystallography/SFX) [189].
In the direction of fully understanding the biochemical operations that macromolecules accomplish, characterizing the corresponding molecular mechanisms is essential. Structural visualization is invaluable, especially when done for multiple functional states of the macromolecule of interest [190]. X-ray crystallography has been the primary technique responsible for determining macromolecule models at atomic resolution for macromolecular complexes during recent decades [191]. This approach has been enormously powerful but is limited by the fact that the molecule or complex of interest must be crystallized, which is not always possible [191]. When macromolecules and complexes prove hard to crystallize or to be produced in the sufficient concentration to even attempt crystallization trials, 3D electron microscopy is a potential alternative to X-ray crystallography that is quickly gaining popularity among structural biologists [185]. In the electron microscope method, aiming to endure the high vacuum and minimize visible effects of radiation damage and thus highly affecting biological studies, samples can be then studied in a frozen hydrated state after vitrification (cryo-EM).
Overall, although XRPD on macromolecules usually requires a cooperative employment of different X-ray sources and instrumentation to provide data suitable for structure determination, recent studies have indicated that XRPD is an efficient tool in structural biology, which can be employed routinely, providing insight into important biological problems.

Author Contributions

All authors were involved in preparing this manuscript: Conceptualization, M.S., A.V., D.-P.T., C.K., F.K. and I.M.; writing—original draft preparation, M.S.; writing—review and editing, M.S., A.V., D.-P.T., C.K., F.K., A.F., I.M.; visualization, M.S., A.V. and F.K.; supervision, I.M.; project administration, M.S., I.M.; funding acquisition, A.F. All authors have read and agreed to the published version of the manuscript.

Funding

Part of the research conducted and presented in this review article has been financially supported by the Hellenic Foundation for Research and Innovation (HFRI), Andreas Mentzelopoulos scholarships of University of Patras, COST Action (CM1306) and the NanoMEGAS company.

Acknowledgments

We would like to thank Malvern Panalytical for instrumentation and software support and AFMB, Novo Nordisk A/S, CBL Patras for the provision of plasmids, HI and peptide correspondingly and their invaluable advices on crystallization procedures as well as the ESRF, NSLS, and SLS synchrotrons for beam time allocation.

Conflicts of Interest

The authors declare no conflict of interest. The funding sponsors had no role in the design of the study, the data collection, analysis, or interpretation; in the writing of the manuscript, and in the decision to publish the results.

References

  1. Russo Krauss, I.; Merlino, A.; Vergara, A.; Sica, F. An overview of biological macromolecule crystallization. Int. J. Mol. Sci. 2013, 14, 11643–11691. [Google Scholar] [CrossRef] [PubMed] [Green Version]
  2. McPherson, A. Introduction to protein crystallization. Methods 2004, 34, 254–265. [Google Scholar] [CrossRef] [PubMed] [Green Version]
  3. Evans, G.; Axford, D.; Waterman, D.; Owen, R.L. Macromolecular microcrystallography. Crystallogr. Rev. 2011, 17, 105–142. [Google Scholar] [CrossRef]
  4. Debye, P.; Scherrer, P. Interferenzen an regellos orientierten Teilchen im Röntgenlicht. Phys. Z. 1916, 17, 277–291. [Google Scholar]
  5. Gingrich, N.S. The diffraction of x-rays by liquid elements. Rev. Mod. Phys. 1943, 15, 90–110. [Google Scholar] [CrossRef]
  6. Authier, A. Early Days of X-ray Crystallography; OUP: Oxford, UK, 2013. [Google Scholar]
  7. Dooryhee, E.; Greaves, G.N.; Steel, A.T.; Townsend, R.P.; Carr, S.W.; Thomas, J.M.; Catlow, C.R.A. Structural studies of high-area zeolitic adsorbents and catalysts by a combination of high-resolution X-ray powder diffraction and X-ray absorption spectroscopy. Faraday Discuss. Chem. Soc. 1990, 89, 119–136. [Google Scholar] [CrossRef]
  8. Cheetham, A.K.; Taylor, J.C. Profile analysis of neutron powder diffraction data: Its scope, limitations and applications in solid state chemistry. J. Solid State Chem. 1977, 21, 253–275. [Google Scholar] [CrossRef]
  9. Von Dreele, R.B. Protein Crystal Structure Analysis from High-Resolution X-ray Powder-Diffraction Data. Methods Enzymol. 2003, 368, 254–267. [Google Scholar]
  10. Margiolaki, I.; Wright, J.P.; Fitch, A.N.; Fox, G.C.; Von Dreele, R.B. Synchrotron X-ray Powder Diffraction Study of Hexagonal Turkey Egg-White Lysozyme. Acta Cryst. D 2005, 61, 423–432. [Google Scholar] [CrossRef]
  11. Margiolaki, I.; Wright, J.P.; Wilmanns, M.; Fitch, A.N.; Pinotsis, N. Second SH3 Domain of Ponsin Solved from Powder Diffraction. J. Am. Chem. Soc. 2007, 129, 11865–11871. [Google Scholar] [CrossRef]
  12. Margiolaki, I.; Giannopoulou, A.E.; Wright, J.P.; Knight, L.; Norrman, M.; Schluckebier, G.; Fitch, A.N.; Von Dreele, R.B. High-resolution powder X-ray data reveal the T6 hexameric form of bovine insulin. Acta Cryst. D 2013, 69, 978–990. [Google Scholar] [CrossRef] [PubMed]
  13. Rietveld, H.M. A profile refinement method for nuclear and magnetic structures. J. Appl. Crystallogr. 1969, 2, 65–71. [Google Scholar] [CrossRef]
  14. Young, R.A.; Mackie, P.E.; Von Dreele, R.B. Application of the pattern-fitting structure-refinement method of X-ray powder diffractometer patterns. J. Appl. Crystallogr. 1977, 10, 262–269. [Google Scholar] [CrossRef]
  15. Alexander, L.E. Forty years of quantitative diffraction analysis. In Advances in X-ray Analysis, 2nd ed.; McMurdie, H.F., Barrett, C.S., Newkirk, J.B., Ruud, C.O., Eds.; Plenum Press: New York, NY, USA, 1976; Volume 20, pp. 1–13. [Google Scholar]
  16. Klug, H.P.; Alexander, L.E. X-ray Diffraction Procedures for Polycrystalline and Amorphous Materials, 2nd ed.; John Wiley: New York, NY, USA, 1974; pp. 271–418. [Google Scholar]
  17. Harris, K.D.M.; Tremayne, M. Crystal Structure Determination from Powder Diffraction Data. Chem. Mater. 1996, 8, 2554–2570. [Google Scholar] [CrossRef]
  18. Das, U.; Naskar, J.; Mukherjee, A.K. Conformational analysis of an acyclic tetrapeptide: Ab-initio structure determination from X-ray powder diffraction, Hirshfeld surface analysis and electronic structure. J. Pept. Sci. 2015, 21, 845–852. [Google Scholar] [CrossRef]
  19. Gu, L.; Liu, C.; Guo, Z. Structural Insights into Aβ42 Oligomers Using Site-directed Spin Labeling. J. Biol. Chem. 2013, 288, 18673–18683. [Google Scholar] [CrossRef] [Green Version]
  20. Von Dreele, R.B. Combined Rietveld and stereochemical restraint refinement of a protein crystal structure. J. Appl. Crystallogr. 1999, 32, 1084–1089. [Google Scholar] [CrossRef] [Green Version]
  21. Von Dreele, R.B.; Stephens, P.W.; Smith, G.D.; Blessing, R.H. The first protein crystal structure determined from high-resolution X-ray powder diffraction data: A variant of T3R3 human insulin–zinc complex produced by grinding. Acta Cryst. D 2000, 56, 1549–1553. [Google Scholar] [CrossRef]
  22. Von Dreele, R.B. Multipattern Rietveld refinement of protein powder data: An approach to higher resolution. J. Appl. Cryst. 2007, 40, 133–143. [Google Scholar] [CrossRef]
  23. Margiolaki, I.; Wright, J.P. Powder crystallography on macromolecules. Acta Cryst. A 2008, 64, 169–180. [Google Scholar] [CrossRef] [Green Version]
  24. Collings, I.; Watier, Y.; Giffard, M.; Dagogo, S.; Kahn, R.; Bonneté, F.; Wright, J.P.; Fitch, A.N.; Margiolaki, I. Polymorphism of microcrystalline urate oxidase from Aspergillus flavus. Acta Cryst. D 2010, 66, 539–548. [Google Scholar] [CrossRef]
  25. Karavassili, F.; Margiolaki, I. Macromolecular Powder Diffraction: Ready for genuine biological problems. Protein Pept. Lett. 2016, 23, 232–241. [Google Scholar] [CrossRef] [Green Version]
  26. Karavassili, F.; Valmas, A.; Fili, S.; Georgiou, C.; Margiolaki, I. In quest for improved drugs against diabetes: The added value of X-ray powder diffraction methods. Biomolecules 2017, 7, 63. [Google Scholar] [CrossRef]
  27. Margiolaki, I. Macromolecular powder diffraction. In International Tables for Crystallography, 1st ed; Gilmore, C.J., Kaduk, J.A., Schenk, H., Eds.; John Wiley & Sons. Inc.: New York, NY, USA, 2019; Volume H, pp. 718–736. [Google Scholar]
  28. Trampari, S.; Valmas, A.; Logotheti, S.; Saslis, S.; Fili, S.; Spiliopoulou, M.; Beckers, D.; Degen, T.; Nénert, G.; Fitch, A.N.; et al. In situ detection of a novel lysozyme monoclinic crystal form upon controlled relative humidity variation. J. Appl. Cryst. 2018, 51, 1671–1683. [Google Scholar] [CrossRef]
  29. Logotheti, S.; Valmas, A.; Trampari, S.; Fili, S.; Saslis, S.; Spiliopoulou, M.; Beckers, D.; Degen, T.; Nénert, G.; Fitch, A.N.; et al. Unit-cell response of tetragonal hen egg white lysozyme upon controlled relative humidity variation. J. Appl. Cryst. 2019, 52, 816–827. [Google Scholar] [CrossRef] [Green Version]
  30. Karavassili, F.; Giannopoulou, A.E.; Kotsiliti, E.; Knight, L.; Norrman, M.; Schluckebier, G.; Drube, L.; Fitch, A.N.; Wright, J.P.; Margiolaki, I. Structural studies of human insulin cocrystallized with phenol or resorcinol via powder diffraction. Acta Cryst. D 2012, 68, 1632–1641. [Google Scholar] [CrossRef]
  31. Valmas, A.; Magiouf, K.; Fili, S.; Norrman, M.; Schluckebier, G.; Beckers, D.; Degen, T.; Wright, J.; Fitch, A.; Gozzo, F.; et al. Novel crystalline phase and first-order phase transitions of human insulin complexed with two distinct phenol derivatives. Acta Cryst. D 2015, 71, 819–828. [Google Scholar] [CrossRef]
  32. Fili, S.; Valmas, A.; Norrman, M.; Schluckebier, G.; Beckers, D.; Degen, T.; Wright, J.; Fitch, A.; Gozzo, F.; Giannopoulou, A.E.; et al. Human insulin polymorphism upon ligand binding and pH variation: The case of 4-ethylresorcinol. IUCrJ 2015, 2, 534–544. [Google Scholar] [CrossRef]
  33. Caira, M.R. Currents Applications of Powder X-ray Diffraction in Drug Discovery and Development. Am. Pharm. Rev. 2014, 17, 54. [Google Scholar]
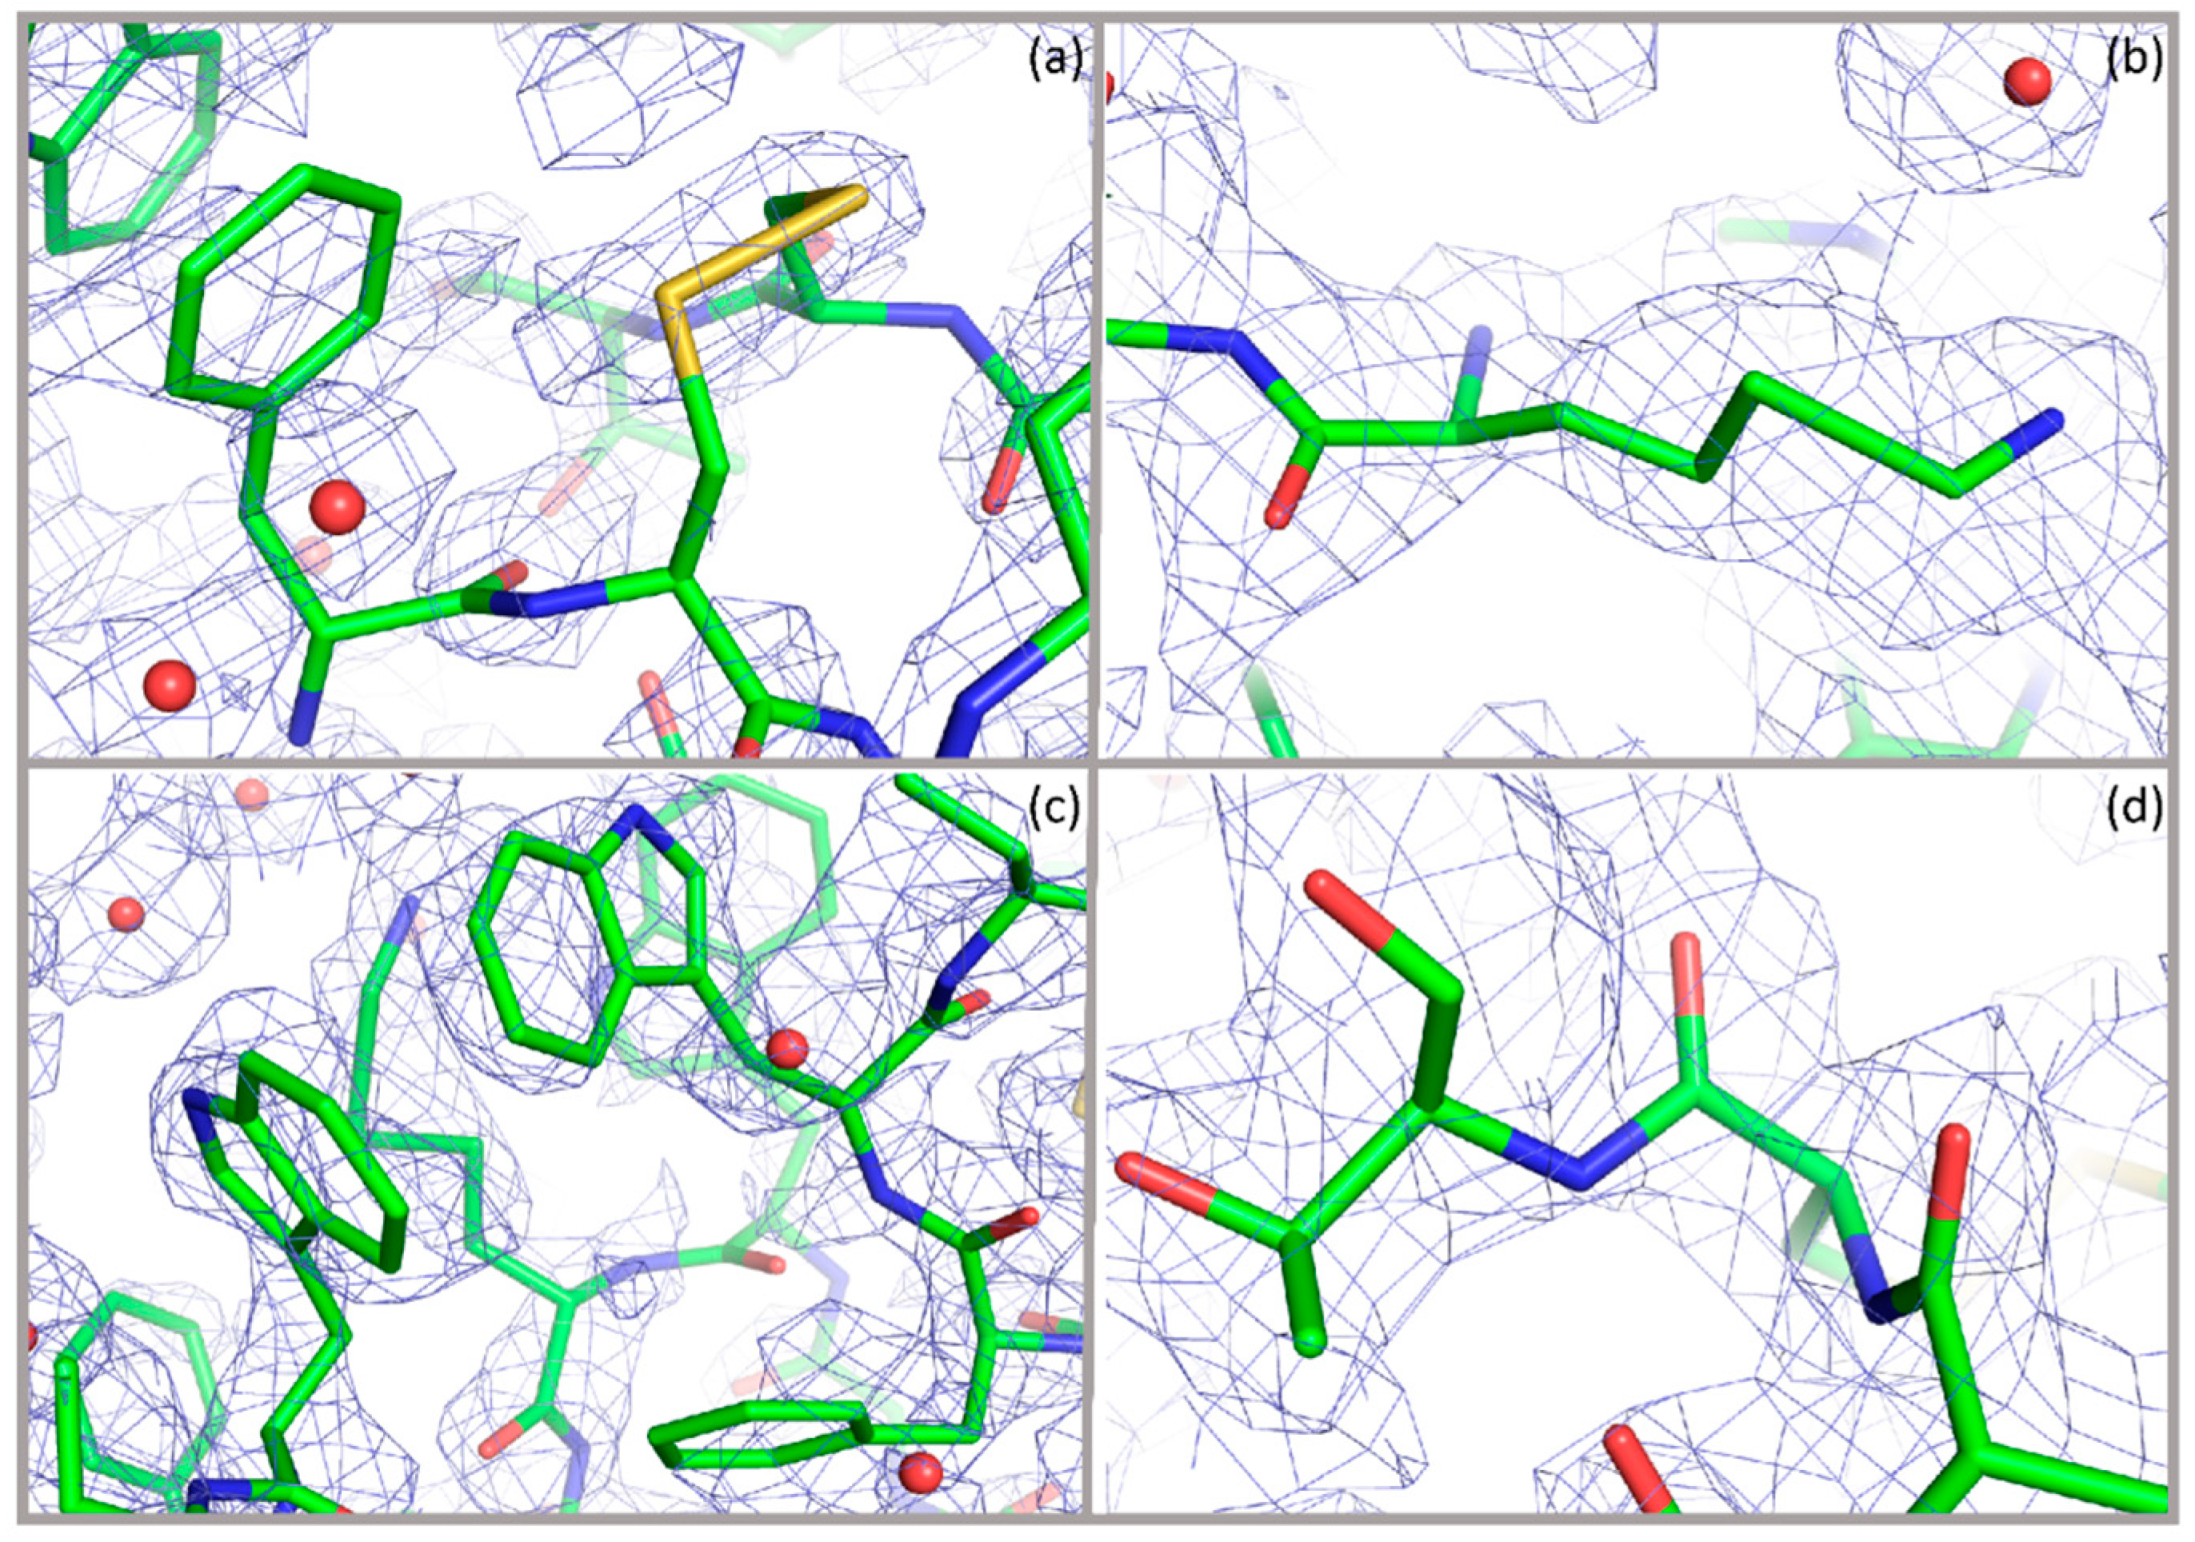
  34. Fili, S.; Valmas, A.; Spiliopoulou, M.; Kontou, P.; Fitch, A.N.; Beckers, D.; Degen, T.; Barlos, K.; Barlos, K.K.; Karavassili, F.; et al. Revisiting the structure of a synthetic Somatostatin analogue for peptide drug design. Acta Cryst. B 2019, 75, 611–620. [Google Scholar] [CrossRef]
  35. Basu, S.K.; Govardhan, C.P.; Jung, C.W.; Margolin, A.L. Protein crystals for the delivery of biopharmaceuticals. Expert Opin. Biol. Ther. 2004, 4, 301–317. [Google Scholar] [CrossRef]
  36. Chyall, L.J. Current Applications of X-ray Powder Diffraction in the Pharmaceutical Industry. Am. Pharm. Rev. 2012, 15, 70. [Google Scholar]
  37. Das, R.; Ali, E.; Abd Hamid, S.B. Current applications of X-ray powder diffraction—A review. Rev. Adv. Mater. Sci. 2014, 38, 95–109. [Google Scholar]
  38. Yin, S.X.; Scaringe, R.P.; Malley, M.F.; Gougoutas, J.Z. In-situ variable temperature powder X-ray diffraction and thermal analysis-applications in the pharmaceutical industry. Am. Pharm. Rev. 2005, 8, 56–58, 60, 62, 67. [Google Scholar]
  39. Ungár, T. The Meaning of Size Obtained from Broadened X-ray Diffraction Peaks. Adv. Eng. Mater. 2003, 5, 323–329. [Google Scholar] [CrossRef]
  40. Dale, G.E.; Oefner, C.; D’Arcy, A. The protein as a variable in protein crystallization. J. Struct. Biol. 2003, 142, 88–97. [Google Scholar] [CrossRef]
  41. Verdaguer, N.; Garriga, D.; Fita, I. X-Ray crystallography of viruses. In Structure and Physics of Viruses; Springer: Dordrecht, The Netherlands, 2013; pp. 117–144. [Google Scholar]
  42. Carrillo-Tripp, M.; Shepherd, C.M.; Borelli, I.A.; Venkataraman, S.; Lander, G.; Natarajan, P.; Johnson, J.E.; Brooks, C.L., III; Reddy, V.S. VIPERdb2: An enhanced and web API enabled relational database for structural virology. Nucleic Acids Res. 2009, 37, D436–D442. [Google Scholar] [CrossRef]
  43. Verdaguer, N.; Ferrero, D.; Murthy, M.R. Viruses and viral proteins. IUCrJ 2014, 1, 492–504. [Google Scholar] [CrossRef]
  44. Berman, J.; Henrick, K.; Nakamura, H. Announcing the worldwide Protein Data Bank. Nat. Struct. Mol. Biol. 2003, 10, 980. [Google Scholar] [CrossRef]
  45. Bassetto, M.; Massarotti, A.; Coluccia, A.; Brancale, A. Structural biology in antiviral drug discovery. Curr. Opin. Pharmacol. 2016, 30, 116–130. [Google Scholar] [CrossRef]
  46. D’Arcy, A.L.L.A.N. Crystallizing proteins—A rational approach? Acta Cryst. D 1994, 50, 469–471. [Google Scholar] [CrossRef]
  47. Abola, E.; Kuhn, P.; Earnest, T.; Stevens, R.C. Automation of X-ray crystallography. Nat. Struct. Biol. 2000, 7, 973–977. [Google Scholar] [CrossRef]
  48. Blundell, T.L.; Jhoti, H.; Abell, C. High-throughput crystallography for lead discovery in drug design. Nat. Rev. Drug Discov. 2002, 1, 45–54. [Google Scholar] [CrossRef] [PubMed]
  49. Boettner, M.; Prinz, B.; Holz, C.; Stahl, U.; Lang, C. Highthroughput screening for expression of heterologous proteins in the yeast Pichia pastoris. J. Biotechnol. 2002, 99, 51–62. [Google Scholar] [CrossRef]
  50. Chayen, N.E.; Saridakis, E. Protein crystallization for genomics: Towards high-throughput optimization techniques. Acta Cryst. D 2002, 58, 921–927. [Google Scholar] [CrossRef] [PubMed] [Green Version]
  51. Dieckman, L.; Gu, M.; Stols, L.; Donnelly, M.I.; Collart, F.R. High throughput methods for gene cloning and expression. Protein Expr. Purif. 2002, 25, 1–7. [Google Scholar] [CrossRef]
  52. Karain, W.I.; Bourenkov, G.P.; Blume, H.; Bartunik, H.D. Automated mounting, centering and screening of crystals for highthroughput protein crystallography. Acta Cryst. D 2002, 58, 1519–1522. [Google Scholar] [CrossRef]
  53. Rupp, B. Origin and use of crystallization phase diagrams. Acta Cryst. F 2015, 71, 247–260. [Google Scholar] [CrossRef] [Green Version]
  54. Gavira, J.A.; Garcia-Ruiz, J.M. Agarose as crystallisation media for proteins II: Trapping of gel fibres into the crystals. Acta Cryst. D 2002, 58, 1653–1656. [Google Scholar] [CrossRef] [Green Version]
  55. Moreno, A.; Quiroz-García, B.; Yokaichiya, F.; Stojanoff, V.; Rudolph, P. Protein crystal growth in gels and stationary magnetic fields. Cryst. Res. Technol. 2007, 42, 231–236. [Google Scholar] [CrossRef]
  56. Chayen, N.E.; Saridakis, E. Protein crystallization: From purified protein to diffraction-quality crystal. Nat. Methods 2008, 5, 147–153. [Google Scholar] [CrossRef] [PubMed]
  57. Chayen, N.E.; Boggon, T.J.; Cassetta, A.; Deacon, A.; Gleichmann, T.; Habash, J.; Harrop, S.J.; Helliwell, J.R.; Nieh, Y.P.; Peterson, M.R.; et al. Trends and challenges in experimental macromolecular crystallography. Q. Rev. Biophys. 1996, 29, 227–278. [Google Scholar] [CrossRef] [PubMed] [Green Version]
  58. Ataka, M. Protein crystal growth: An approach based on phase diagram determination. Phase Transit. 1993, 45, 205–219. [Google Scholar] [CrossRef]
  59. Stura, E.A.; Wilson, I.A. Application of the streak seeding technique in protein crystallization. J. Cryst. Growth 1991, 110, 270–282. [Google Scholar] [CrossRef]
  60. Chayen, N.E. Automation of non-conventional crystallization techniques for screening and optimization. In Macromolecular Crystallography: Conventional and High-Throughput Methods, 2nd ed.; Sanderson, M.R., Skelly, J.V., Eds.; Oxford University Press: Oxford, UK, 2007; pp. 45–58. [Google Scholar]
  61. Govada, L.; Chayen, N.E. Choosing the method of crystallization to obtain optimal results. Crystals 2019, 9, 106. [Google Scholar] [CrossRef] [Green Version]
  62. Chayen, N.E. Turning protein crystallisation from an art into a science. Curr. Opin. Struct. Biol. 2004, 14, 577–583. [Google Scholar] [CrossRef] [PubMed]
  63. Corey, R.B.; Wyckoff, R.W.G. Long spacings in macromolecular solids. J. Biol. Chem. 1936, 114, 407–414. [Google Scholar]
  64. Wyckoff, R.W.G.; Corey, R.B. X-ray diffraction patterns of crystalline tobacco mosaic proteins. J. Biol. Chem. 1936, 116, 51–55. [Google Scholar]
  65. Bernal, J.D.; Fankuchen, I. X-ray and crystallographic studies of plant virus preparations: I. Introduction and preparation of specimens II. Modes of aggregation of the virus particles. J. Gen. Physiol. 1941, 25, 111–165. [Google Scholar]
  66. Xiaa, D.; Yu-Kunb, S.; McCraec, M.A.; Rossmann, M.G. X-ray powder pattern analysis of cytoplasmic polyhedrosis virus inclusion bodies. Virology 1991, 180, 153–158. [Google Scholar] [CrossRef]
  67. Watier, Y. Powder Diffraction Studies of Proteins. Ph.D. Thesis, University Joseph Fourier, Grenoble, France, 2011. [Google Scholar]
  68. Sliz, P.; Harrison, S.C.; Rosenbaum, G. How does radiation damage in protein crystals depend on X-ray dose? Structure 2003, 11, 13–19. [Google Scholar] [CrossRef] [Green Version]
  69. Papageorgiou, N.; Watier, Y.; Saunders, L.; Coutard, B.; Lantez, V.; Gould, E.A.; Fitch, A.N.; Wright, J.P.; Canard, B.; Margiolaki, I. Preliminary insights into the non-structural protein 3 macro domain of the Mayaro virus by powder diffraction. Z. Kristallogr. Cryst. Mater. 2010, 225, 576–580. [Google Scholar] [CrossRef]
  70. Margiolaki, I. Proteins and Powders: An Overview. In Uniting Electron Crystallography and Powder Diffraction; Kolb, U., Shankland, K., Meshi, L., Avilov, A., David, W.I.F., Eds.; Springer: Dordrecht, The Netherlands, 2012; Volume 13, pp. 137–147. [Google Scholar]
  71. Fili, S.; Valmas, A.; Christopoulou, M.; Spiliopoulou, M.; Nikolopoulos, N.; Lichière, J.; Logotheti, S.; Karavassili, F.; Rosmaraki, E.; Fitch, A.; et al. Coxsackievirus B3 protease 3C: Expression, purification, crystallization and preliminary structural insights. Acta Cryst. F 2016, 72, 877–884. [Google Scholar] [CrossRef] [PubMed]
  72. Valmas, A.; Fili, S.; Nikolopoulos, N.; Spiliopoulou, M.; Christopoulou, M.; Karavassili, F.; Kosinas, C.; Bastalias, K.; Rosmaraki, E.; Lichiére, J.; et al. Dengue virus 3 NS5 methyltransferase domain: Expression, purification, crystallization and first structural data from microcrystalline specimens. Z. Kristallogr. Cryst. Mater. 2017, 233, 309–316. [Google Scholar] [CrossRef]
  73. Lee, C.C.; Kuo, C.J.; Ko, T.P.; Hsu, M.F.; Tsui, Y.C.; Chang, S.C.; Yang, S.; Chen, S.J.; Chen, H.C.; Hsu, M.C.; et al. Structural basis of inhibition specificities of 3C and 3C-like proteases by zinc-coordinating and peptidomimetic compounds. J. Biol. Chem. 2009, 284, 7646–7655. [Google Scholar] [CrossRef] [Green Version]
  74. Marcotte, L.L.; Wass, A.B.; Gohara, D.W.; Pathak, H.B.; Arnold, J.J.; Filman, D.J.; Cameron, C.E.; Hogle, J.M. Crystal structure of poliovirus 3CD protein: Virally encoded protease and precursor to the RNA-dependent RNA polymerase. J. Virol. 2007, 81, 3583–3596. [Google Scholar] [CrossRef] [Green Version]
  75. Pawley, G.S. Unit-cell refinement from powder diffraction scans. J. Appl. Cryst. 1981, 14, 357–361. [Google Scholar] [CrossRef]
  76. Malavige, G.N.; Fernando, S.; Fernando, D.J.; Seneviratne, S.L. Dengue viral infections. Postgrad. Med. J. 2004, 80, 588–601. [Google Scholar] [CrossRef]
  77. Bhatt, S.; Gething, P.W.; Brady, O.J.; Messina, J.P.; Farlow, A.W.; Moyes, C.L.; Drake, J.M.; Brownstein, J.S.; Hoen, A.G.; Sankoh, O.; et al. The global distribution and burden of dengue. Nature 2013, 496, 504–507. [Google Scholar] [CrossRef]
  78. Egloff, M.P.; Benarroch, D.; Selisko, B.; Romette, J.L.; Canard, B. An RNA cap (nucleoside-2′-O-) methyltransferase in the flavivirus RNA polymerase NS5: Crystal structure and functional characterization. EMBO J. 2002, 21, 2757–2768. [Google Scholar] [CrossRef] [Green Version]
  79. Yap, T.L.; Xu, T.; Chen, Y.L.; Malet, H.; Egloff, M.P.; Canard, B.; Vasudevan, S.G.; Lescar, J. Crystal structure of the dengue virus RNA-dependent RNA polymerase catalytic domain at 1.85-angstrom resolution. J. Virol. 2007, 81, 4753–4765. [Google Scholar] [CrossRef] [PubMed] [Green Version]
  80. Coutard, B.; Decroly, E.; Li, C.; Sharff, A.; Lescar, J.; Bricogne, G.; Barral, K. Assessment of Dengue virus helicase and methyltransferase as targets for fragment-based drug discovery. Antivir. Res. 2014, 106, 61–70. [Google Scholar] [CrossRef] [PubMed]
  81. Zhao, Y.; Soh, T.S.; Zheng, J.; Chan, K.W.K.; Phoo, W.W.; Lee, C.C.; Tay, M.Y.; Swaminathan, K.; Cornvik, T.C.; Lim, S.P.; et al. A crystal structure of the dengue virus NS5 protein reveals a novel inter-domain interface essential for protein flexibility and virus replication. PLoS Pathog. 2015, 11, e1004682. [Google Scholar] [CrossRef] [PubMed]
  82. Benmansour, F.; Trist, I.; Coutard, B.; Decroly, E.; Querat, G.; Brancale, A.; Barral, K. Discovery of novel dengue virus NS5 methyltransferase non-nucleoside inhibitors by fragment-based drug design. Eur. J. Med. Chem. 2017, 125, 865–880. [Google Scholar] [CrossRef]
  83. Altomare, A.; Cascarano, G.; Giacovazzo, C.; Guagliardi, A.; Moliterni, A.G.G.; Burla, M.C.; Polidori, G. On the number of statistically independent observations in a powder diffraction pattern. J. Appl. Crystallogr. 1995, 28, 738–744. [Google Scholar] [CrossRef]
  84. David, W.I.F. On the equivalence of the Rietveld method and the correlated integrated intensities method in powder diffraction. J. Appl. Crystallogr. 2004, 37, 621–628. [Google Scholar] [CrossRef]
  85. Wright, J.P.; Forsyth, J.B. PRODD, Profile Refinement of Diffraction Data using the Cambridge Crystallographic Subroutine Library. In Rutherford Appleton Laboratory Report RAL-TR-2000-012; CCLRC: Didcot, Oxon, UK, 2000. [Google Scholar]
  86. Wright, J.P. Extraction and use of correlated integrated intensities with powder diffraction data. Z. Kristallogr. Cryst. Mater. 2004, 219, 791–802. [Google Scholar] [CrossRef]
  87. Le Bail, A.; Duroy, H.; Fourquet, J.L. Ab-initio structure determination of LiSbWO6 by X-ray powder diffraction. Mater. Res. Bull. 1988, 23, 447–452. [Google Scholar] [CrossRef]
  88. Rossmann, M.G. The molecular replacement method. Acta Cryst. A 1990, 46, 73–82. [Google Scholar] [CrossRef]
  89. Ramachandran, G.N.; Ramakrishnan, C.; Sasisekharan, V. Stereochemistry of polypeptide chain configurations. J. Mol. Biol. 1963, 7, 95–99. [Google Scholar] [CrossRef]
  90. Larson, A.C.; Von Dreele, R.B. General Structure Analysis System (GSAS). In Los Alamos National Laboratory Report LAUR; UC Regents: Los Alamos, CA, USA, 2004; pp. 86–748. [Google Scholar]
  91. Von Dreele, R.B. Binding of N-acetylglucosamine to chicken egg lysozyme: A powder diffraction study. Acta Cryst. D 2001, 57, 1836–1842. [Google Scholar] [CrossRef] [PubMed] [Green Version]
  92. Von Dreele, R.B. Binding of N-acetylglucosamine oligosaccharides to hen egg-white lysozyme: A powder diffraction study. Acta Cryst. D 2005, 61, 22–32. [Google Scholar] [CrossRef] [Green Version]
  93. Doebbler, J.A.; Von Dreele, R.B. Application of molecular replacement to protein powder data from image plates. Acta Cryst. D 2009, 65, 348–355. [Google Scholar] [CrossRef] [PubMed]
  94. Zhang, M.; Liu, J.; Cheng, A.; DeYoung, S.M.; Chen, X.; Dold, L.H.; Saltiel, A.R. CAP interacts with cytoskeletal proteins and regulates adhesion-mediated ERK activation and motility. EMBO J. 2006, 25, 5284–5293. [Google Scholar] [CrossRef] [PubMed] [Green Version]
  95. Gehmlich, K.; Pinotsis, N.; Hayeß, K.; van der Ven, P.F.; Milting, H.; El Banayosy, A.; Körfer, R.; Wilmanns, M.; Ehler, E.; Fürst, D.O. Paxillin and ponsin interact in nascent costameres of muscle cells. J. Mol. Biol. 2007, 369, 665–682. [Google Scholar] [CrossRef]
  96. Larson, A.C.; Von Dreele, R.B. General structure analysis system (GSAS). In Los Alamos National Laboratory Report LAUR; UC Regents: Los Alamos, CA, USA, 1994; pp. 86–748. [Google Scholar]
  97. Basso, S.; Fitch, A.N.; Fox, G.C.; Margiolaki, I.; Wright, J.P. High-throughput phase-diagram mapping via powder diffraction: A case study of HEWL versus pH. Acta Cryst. D 2005, 61, 1612–1625. [Google Scholar] [CrossRef] [Green Version]
  98. Haleblian, J.; McCrone, W. Pharmaceutical applications of polymorphism. J. Pharm. Sci. 1969, 58, 911–929. [Google Scholar] [CrossRef]
  99. Triandafillidis, D.T.; Parthenios, N.; Spiliopoulou, M.; Valmas, A.; Gozzo, F.; Reinle-Schmitt, M.; Beckers, D.; Degen, T.; Pop, M.; Fitch, A.; et al. Insulin polymorphism induced by two polyphenols: New crystal forms and advances in macromolecular powder diffraction. J. Pharm. Sci. 2020. submitted. [Google Scholar]
  100. Katrincic, L.M.; Sun, Y.T.; Carlton, R.A.; Diederich, A.M.; Mueller, R.L.; Vogt, F.G. Characterization, selection, and development of an orally dosed drug polymorph from an enantiotropically related system. Int. J. Pharm. 2009, 366, 1–13. [Google Scholar] [CrossRef]
  101. Newman, A. XRD-X-ray Powder Diffraction in Solid Form Screening and Selection. Am. Pharm. Rev. 2011, 14, 44. [Google Scholar]
  102. Láng, P.; Kiss, V.; Ambrus, R.; Farkas, G.; Szabó-Révész, P.; Aigner, Z.; Várkonyi, E. Polymorph screening of an active material. J. Pharm. Biomed. Anal. 2013, 84, 177–183. [Google Scholar] [CrossRef] [PubMed]
  103. Van Eupen, J.T.H.; Westheim, R.; Deij, M.A.; Meekes, H.; Bennema, P.; Vlieg, E. The solubility behaviour and thermodynamic relations of the three forms of Venlafaxine free base. Int. J. Pharm. 2009, 368, 146–153. [Google Scholar] [CrossRef] [PubMed]
  104. Stahly, G.P. Diversity in single-and multiple-component crystals. The search for and prevalence of polymorphs and cocrystals. Cryst. Growth Des. 2007, 7, 1007–1026. [Google Scholar] [CrossRef] [Green Version]
  105. Basavoju, S.; Boström, D.; Velaga, S.P. Pharmaceutical cocrystal and salts of norfloxacin. Cryst. Growth Des. 2006, 6, 2699–2708. [Google Scholar] [CrossRef]
  106. Engers, D.; Teng, J.; Jimenez-Novoa, J.; Gent, P.; Hossack, S.; Campbell, C.; Thomson, J.; Ivanisevic, I.; Templeton, A.; Byrn, S.; et al. A Solid-State Approach to Enable Early Development Compounds: Selection and Animsal Bioavailability Studies of an Itraconazole Amorphous Solid Dispersion. J. Pharm. Sci. 2010, 99, 3901–3922. [Google Scholar] [CrossRef] [PubMed]
  107. Davidovich, M.; Gougoutas, J.Z.; Scaringe, R.P.; Vitéz, I.; Yin, S. Detection of polymorphism by powder X-ray diffraction: Interference by preferred orientation. Am. Pharm. Rev. 2004, 7, 10–17. [Google Scholar]
  108. Banting, F.G.; Best, C.H. The internal secretion of the pancreas. J. Lab. Clin. Med. 1922, 7, 251–266. [Google Scholar]
  109. Adams, M.J.; Blundell, T.L.; Dodson, E.J.; Dodson, G.G.; Vijayan, M.; Baker, E.N.; Harding, M.M.; Hodgkin, D.C.; Rimmer, B.; Sheat, S. Structure of Rhombohedral 2 Zinc Insulin Crystals. Nature 1969, 224, 491–495. [Google Scholar] [CrossRef]
  110. Brange, J.; Langkjœr, L. Insulin structure and stability. In Stability and Characterization of Protein and Peptide Drugs; Springer: Boston, MA, USA, 2013; pp. 315–350. [Google Scholar]
  111. Chang, S.G.; Choi, K.D.; Jang, S.H.; Shin, H.C. Role of Disulfide Bonds in the Structure and Activity of Human Insulin. Mol. Cells 2003, 16, 323–330. [Google Scholar]
  112. Abel, J.J. Crystalline insulin. Proc. Natl. Acad. Sci. USA 1926, 12, 132–136. [Google Scholar] [CrossRef] [PubMed] [Green Version]
  113. Scott, D.A. Crystalline insulin. Biochem. J. 1934, 28, 1592–1602. [Google Scholar] [CrossRef] [PubMed] [Green Version]
  114. Halban, P.A.; Mutkoski, R.; Dodson, G.; Orci, L. Resistance of the insulin crystal to lysosomal proteases: Implications for pancreatic B-cell crinophagy. Diabetologia 1987, 30, 348–353. [Google Scholar] [CrossRef] [PubMed]
  115. Hagedorn, H.C.; Jensen, B.N.; Krarup, N.B.; Wodstrup, I. Protamine insulinate. J. Intern. Med. 1936, 90, 678–684. [Google Scholar]
  116. Hallas-Møller, K.; Jersild, M.; Petersen, K.; Schlichtkrull, J. Zinc insulin preparations for single daily injection: Clinical studies of new preparations with prolonged action. JAMA 1952, 150, 1667–1671. [Google Scholar] [CrossRef]
  117. Hartman, I. Insulin analogs: Impact on treatment success, satisfaction, quality of life, and adherence. Clin. Med. Res. 2008, 6, 54–67. [Google Scholar] [CrossRef] [Green Version]
  118. Joshi, S.R.; Parikh, R.M.; Das, A.K. Insulin History, Biochemistry, Physiology and Pharmacology. Suppl. JAPI 2007, 55, 19–25. [Google Scholar]
  119. Van Lierop, B.; Ong, S.C.; Belgi, A.; Delaine, C.; Andrikopoulos, S.; Haworth, N.L.; Menting, J.G.; Lawrence, M.C.; Robinson, A.J.; Forbes, B.E. Insulin in motion: The A6-A11 disulfide bond allosterically modulates structural transitions required for insulin activity. Sci. Rep. 2017, 7, 17239–17254. [Google Scholar] [CrossRef]
  120. Norrman, M.; Schluckebier, G. Crystallographic characterization of two novel crystal forms of human insulin induced by chaotropic agents and a shift in pH. BMC Struct. Biol. 2007, 7, 83–96. [Google Scholar] [CrossRef] [Green Version]
  121. Smith, G.D.; Ciszak, E.; Magrum, L.A.; Pangborn, W.A.; Blessing, R.H. R6 hexameric insulin complexed with m-cresol or resorcinol. Acta Cryst. D 2000, 56, 1541–1548. [Google Scholar] [CrossRef]
  122. Norrman, M.; Ståhl, K.; Schluckebier, G.; Al-Karadaghi, S. Characterization of insulin microcrystals using powder diffraction and multivariate data analysis. J. Appl. Cryst. 2006, 39, 391–400. [Google Scholar] [CrossRef] [Green Version]
  123. Bhatnagar, S.; Srivastava, D.; Jayadev, M.S.K.; Dubey, A.K. Molecular variants and derivatives of insulin for improved glycemic control in diabetes. Prog. Biophys. Mol. Biol. 2006, 91, 199–228. [Google Scholar] [CrossRef] [PubMed]
  124. Dunn, M.F. Zinc-Ligand Interactions Modulate Assembly and Stability of the Insulin Hexamer—A Review. BioMetals 2005, 18, 295–303. [Google Scholar] [CrossRef] [PubMed]
  125. Kaarsholm, N.C.; Ko, H.C.; Dunn, M.F. Comparison of solution structural flexibility and zinc binding domains for insulin, proinsulin, and miniproinsulin. Biochemistry 1989, 28, 4427–4435. [Google Scholar] [CrossRef]
  126. Derewenda, U.; Derewenda, Z.; Dodson, E.J.; Dodson, G.G.; Reynolds, C.D.; Smith, G.D.; Sparks, C.; Swenson, D. Phenol stabilizes more helix in a new symmetrical zinc insulin hexamer. Nature 1989, 338, 594–596. [Google Scholar] [CrossRef]
  127. Smith, G.D.; Pangborn, W.A.; Blessing, R.H. The structure of T6 human insulin at 1.0 Å resolution. Acta Cryst. D 2003, 59, 474–482. [Google Scholar] [CrossRef] [PubMed] [Green Version]
  128. Rahuel-Clermont, S.; French, C.A.; Kaarsholm, N.C.; Dunn, M.F. Mechanisms of Stabilization of the Insulin Hexamer through Allosteric Ligand Interactions. Biochemistry 1997, 36, 5837–5845. [Google Scholar] [CrossRef] [PubMed]
  129. Wold, S.; Esbensen, K.; Geladi, P. Principal Component Analysis. Chemom. Intell. Lab. Syst. 1987, 2, 37–52. [Google Scholar] [CrossRef]
  130. Zijlstra, E.; Heinemann, L.; Plum-Mörschel, L. Oral insulin reloaded: A structured approach. J. Diabetes Sci. Technol. 2014, 8, 458–465. [Google Scholar] [CrossRef] [Green Version]
  131. Mohammed, S.; Arabi, A.; El-Menyar, A.; Abdulkarim, S.; Aljundi, A.; Alqahtani, A.; Arafa, S.; Al Suwaidi, J. Impact of polypharmacy on adherence to evidence-based medication in patients who underwent percutaneous coronary intervention. Curr. Vasc. Pharmacol. 2016, 14, 388–393. [Google Scholar] [CrossRef]
  132. Banerjee, A.; Ibsen, K.; Brown, T.; Chen, R.; Agatemor, C.; Mitragotri, S. Ionic liquids for oral insulin delivery. Proc. Natl. Acad. Sci. USA 2018, 115, 7296–7301. [Google Scholar] [CrossRef] [Green Version]
  133. Grayson, B.E.; Woods, S.C. Insulin. In Handbook of Biologically Active Peptides; Academic Press, Elsevier: Oxford, UK, 2013; pp. 1123–1128. [Google Scholar]
  134. Gursky, O.; Badger, J.; Li, Y.; Caspar, D.L. Conformational changes in cubic insulin crystals in the pH range 7–11. Biophys. J. 1992, 63, 1210–1220. [Google Scholar] [CrossRef] [Green Version]
  135. Whittingham, J.L.; Chaudhurri, S.; Dodson, E.J.; Moody, P.C.E.; Dodson, G.G. X-ray Crystallographic Studies on Hexameric Insulins in the Presence of Helix-Stabilizing Agents, Thiocyanate, Methylparaben and Phenol. Biochemistry 1995, 34, 15553–15563. [Google Scholar] [CrossRef] [PubMed]
  136. McPherson, A. Crystallization of Proteins by Variation of pH or Temperature. Methods Enzymol. 1985, 114, 125–127. [Google Scholar] [PubMed]
  137. Farr, R.; Perryman, A.; Samudzi, C. Re-clustering the database for crystallization of macromolecules. J. Cryst. Growth 1998, 183, 653–668. [Google Scholar] [CrossRef]
  138. Abdalla, M.; Eltayb, W.A.; Samad, A.; SHM, E.; Dafaalla, T. Important factors influencing protein crystallization. Glob. J. Biotechnol. Biomater. Sci. 2016, 2, 025–028. [Google Scholar] [CrossRef] [Green Version]
  139. Chen, R.Q.; Cheng, Q.D.; Chen, J.J.; Sun, D.S.; Ao, L.B.; Li, D.W.; Lu, Q.Q.; Yin, D.C. An investigation of the effects of varying pH on protein crystallization screening. CrystEngComm 2017, 19, 860–867. [Google Scholar] [CrossRef]
  140. Smith, G.D.; Pangborn, W.A.; Blessing, R.H. Phase changes in T3R3f human insulin: Temperature or pressure induced? Acta Cryst. D 2001, 57, 1091–1100. [Google Scholar] [CrossRef] [Green Version]
  141. Bentley, G.; Dodson, E.; Dodson, G.U.Y.; Hodgkin, D.; Mercola, D.A.N. Structure of insulin in 4-zinc insulin. Nature 1976, 261, 166–168. [Google Scholar] [CrossRef]
  142. Huus, K.; Havelund, S.; Olsen, H.B.; Sigurskjold, B.W.; van de Weert, M.; Frokjaer, S. Ligand Binding and Thermostability of Different Allosteric States of the Insulin Zinc-Hexamer. Biochemistry 2006, 45, 4014–4024. [Google Scholar] [CrossRef]
  143. Matthews, B.W. Solvent content of protein crystals. J. Mol. Biol. 1968, 33, 491–497. [Google Scholar] [CrossRef]
  144. McGrath, B.M.; Walsh, G. Directory of Therapeutic Enzymes; CRC Press, Taylor & Francis Group: Boca Raton, FL, USA, 2005. [Google Scholar]
  145. Yang, M.X.; Shenoy, B.; Disttler, M.; Patel, R.; McGrath, M.; Pechenov, S.; Margolin, A.L. Crystalline monoclonal antibodies for subcutaneous delivery. Proc. Natl. Acad. Sci. USA 2003, 100, 6934–6939. [Google Scholar] [CrossRef] [PubMed] [Green Version]
  146. Ivanisevic, I.; McClurg, R.B.; Schields, P.J. Uses of X-ray powder diffraction in the pharmaceutical industry. Pharm. Sci. Encycl. Drug Discov. Dev. Manuf. 2010, 1–42. [Google Scholar] [CrossRef]
  147. Litteer, B.; Beckers, D. Increasing application of X-ray powder diffraction in the pharmaceutical industry. Am. Lab. 2005, 37, 22–25. [Google Scholar]
  148. Rathbone, M.J.; Hadgraft, J.; Roberts, M.S.; Lane, M.E. Modified-Release Drug Delivery Technology; CRC Press, Taylor & Francis Group: Boca Raton, FL, USA, 2008. [Google Scholar]
  149. Gozzo, F. The Power of Synchrotron X-Ray Powder Diffraction for the Characterization of Pharmaceuticals. Pharm. Technol. 2018, 42, 18. [Google Scholar]
  150. Shargel, L.; Andrew, B.C.; Wu-Pong, S. Applied Biopharmaceutics and Pharmacokinetics; Appleton & Lange: Stamford, CT, USA, 1999; pp. 32–35. [Google Scholar]
  151. Fosgerau, K.; Hoffmann, T. Peptide therapeutics: Current status and future directions. Drug. Discov. Today 2015, 20, 122–128. [Google Scholar] [CrossRef] [Green Version]
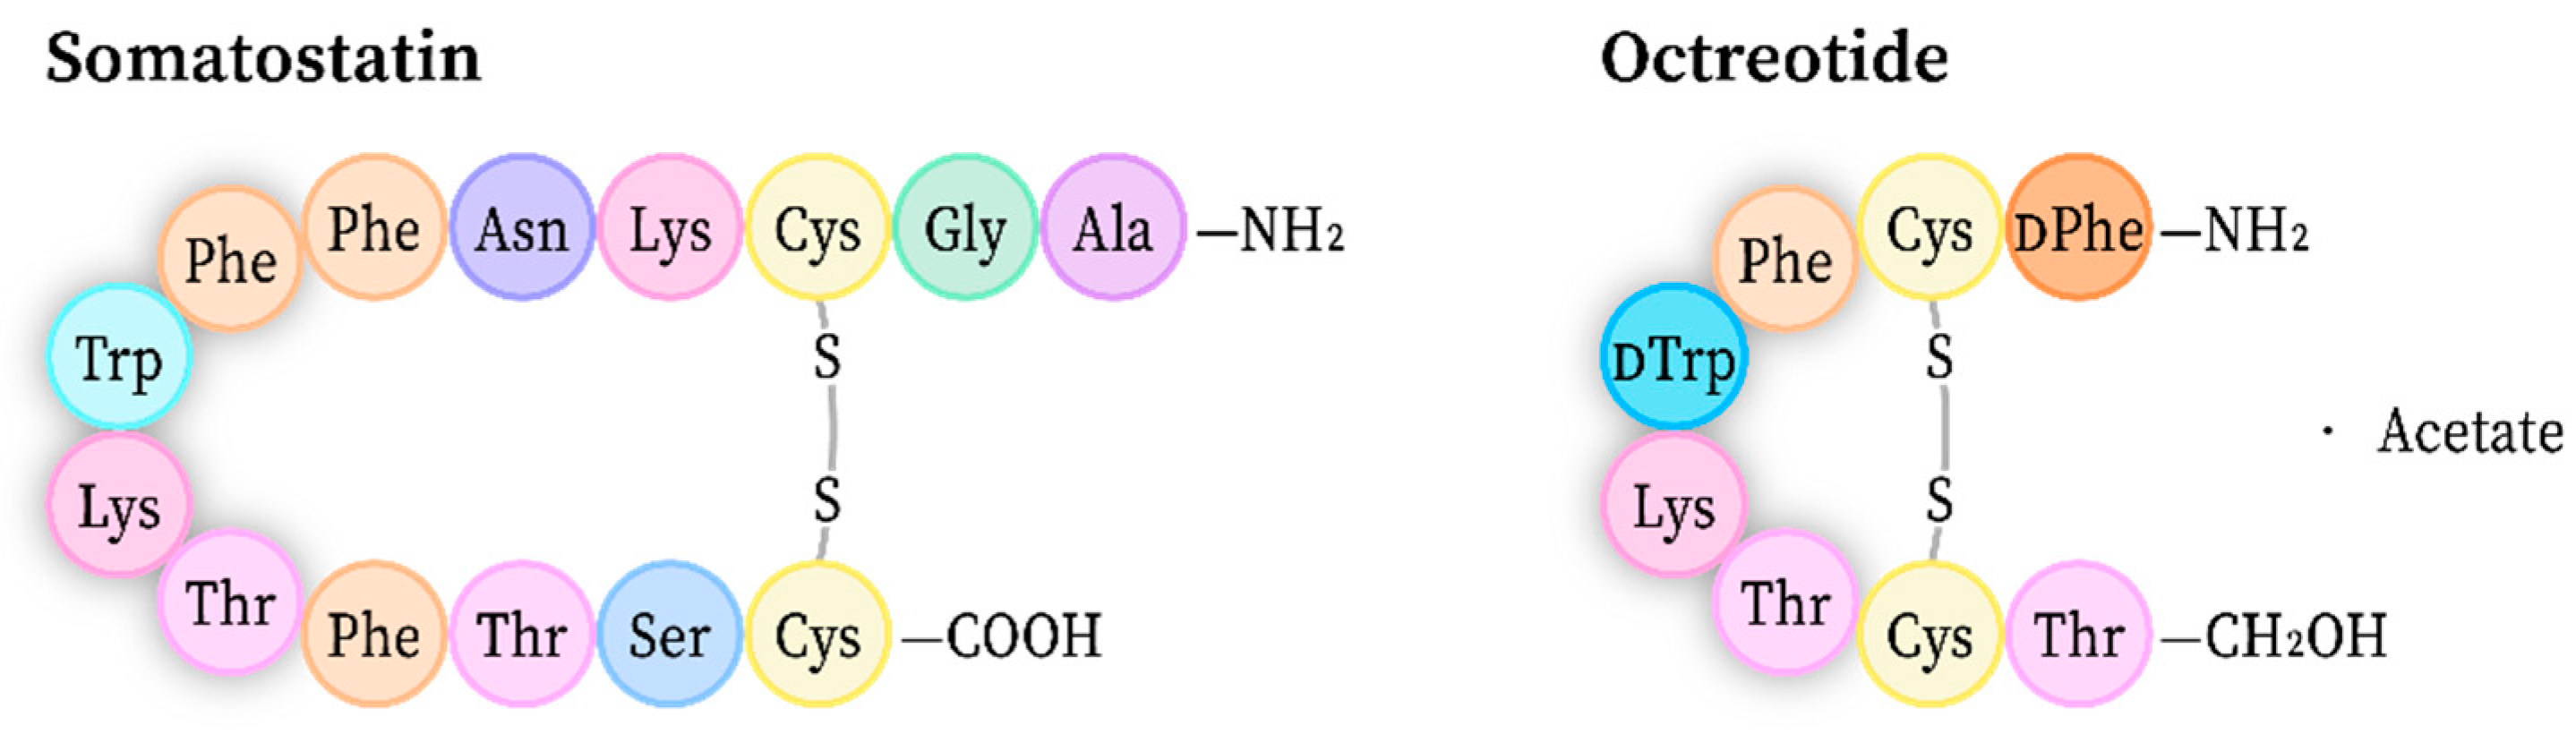
  152. Huang, X.Q. Somatostatin: Likely the most widely effective gastrointestinal hormone in the human body. World J. Gastroenterol. 1997, 3, 201–204. [Google Scholar] [CrossRef]
  153. Pohl, E.; Heine, A.; Sheldrick, G.M.; Dauter, Z.; Wilson, K.S.; Kallen, J.; Pfaffli, P.J. Structure of octreotide, a somatostatin analogue. Acta Cryst. D 1995, 51, 48–59. [Google Scholar] [CrossRef]
  154. Brown, M.; Rivier, J.; Vale, W. Somatostatin: Analogs with selected biological activities. Science 1977, 196, 1467–1469. [Google Scholar] [CrossRef]
  155. Long, R.K.; Cakmak, H. Hypothalamic & Pituitary Hormones. In Basic and Clinical Pharmacology, 14th ed.; Katzung, B.G., Ed.; McGraw Hill Professional: New York, NY, USA, 2018; pp. 667–686. [Google Scholar]
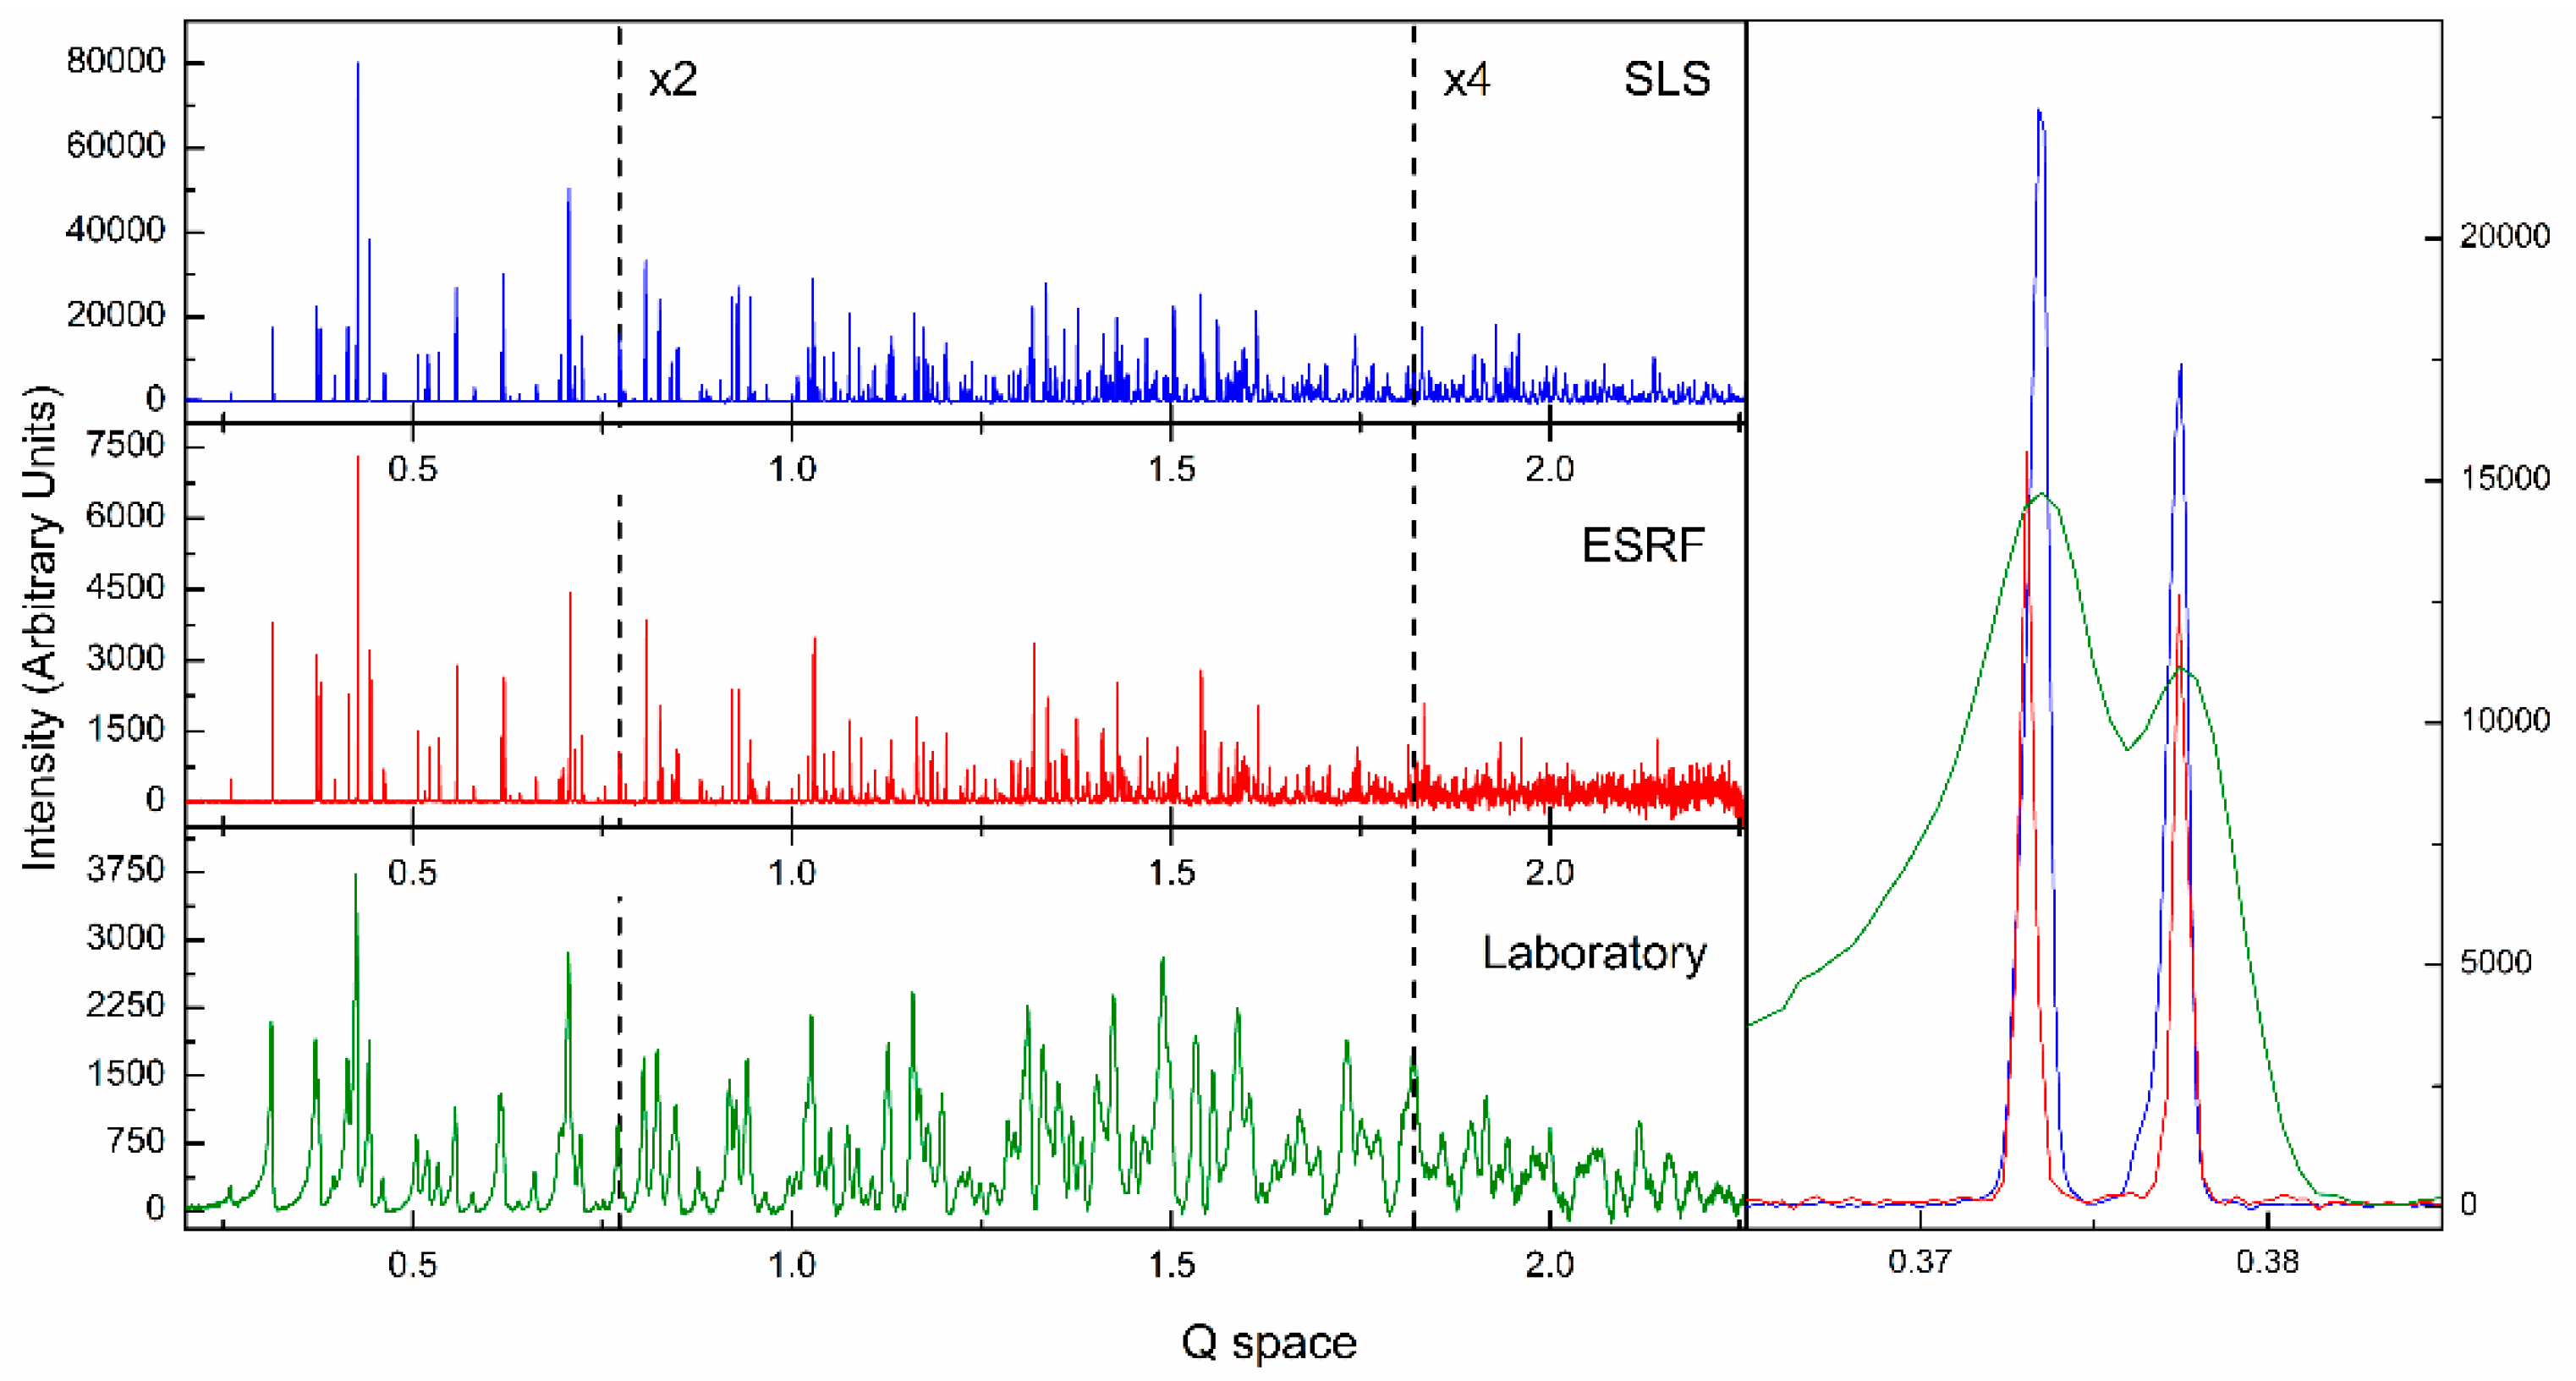
  156. Fitch, A.N. The high resolution powder diffraction beam line at ESRF. J. Res. Natl. Inst. Stan. 2004, 109, 133–142. [Google Scholar] [CrossRef]
  157. Willmott, P.R.; Meister, D.; Leake, S.J.; Lange, M.; Bergamaschi, A.; Böge, M.; Calvi, M.; Cancellieri, C.; Casati, N.; Cervellino, A.; et al. The materials science beamline upgrade at the Swiss Light Source. J. Synchrotron Radiat. 2013, 20, 667–682. [Google Scholar] [CrossRef]
  158. Datta, S.; Grant, D.J.W. Crystal structures of drugs: Advances in determination, prediction and engineering. Nat. Rev. Drug Discov. 2004, 3, 42–57. [Google Scholar] [CrossRef] [PubMed]
  159. Borghetti, G.S.; Carini, J.P.; Honorato, S.B.; Ayala, A.P.; Moreira, J.C.F.; Bassani, V.L. Physicochemical properties and thermal stability of quercetin hydrates in the solid state. Thermochim. Acta 2012, 539, 109–114. [Google Scholar] [CrossRef]
  160. Khatchaturyan, A.G. Phase transformation in crystals composed of macromolecules. Zh. Eksp. Teor. Fiz. 1977, 72, 1149–1155. [Google Scholar]
  161. Morozov, V.N.; Morozova, T.Y. Viscoelastic properties of protein crystals: Triclinic crystals of hen egg white lysozyme in different conditions. Biopolymers 1981, 20, 451–467. [Google Scholar] [CrossRef] [PubMed]
  162. McPherson, A. Protein crystallization in the structural genomics era. J. Struct. Funct. Genom. 2004, 5, 3–12. [Google Scholar] [CrossRef]
  163. Naschberger, A.; Juyoux, P.; von Velsen, J.; Rupp, B.; Bowler, M.W. Controlled dehydration, structural flexibility, and Gadolinium MRI contrast compound binding in human plasma glycoprotein afamin. bioRxiv 2019, 673376. [Google Scholar] [CrossRef]
  164. Crowfoot, D.; Riley, D. Crystal Structures of the Proteins An X-Ray Study of Palmar’s Lactoglobulin. Nature 1938, 141, 521–522. [Google Scholar] [CrossRef] [Green Version]
  165. Perutz, M.F. The composition and swelling properties of haemoglobin crystals. Trans. Faraday Soc. B 1946, 42, 187–194. [Google Scholar] [CrossRef]
  166. Huxley, H.E.; Kendrew, J.C. Discontinuous lattice changes in haemoglobin crystals. Acta Cryst. 1953, 6, 76–80. [Google Scholar] [CrossRef]
  167. Nagendra, H.G.; Sukumar, N.; Vijayan, M. Role of water in plasticity, stability, and action of proteins: The crystal structures of lysozyme at very low levels of hydration. Proteins 1998, 32, 229–240. [Google Scholar] [CrossRef]
  168. Salunke, D.M.; Veerapandian, B.; Kodandapani, R.; Vijayan, M. Water-mediated transformations in protein crystals. Acta Cryst. B 1985, 41, 431–436. [Google Scholar] [CrossRef]
  169. Morozov, V.N.; Morozova, T.Y.; Kachalova, G.S.; Myachin, G.S. Interpretation of water desorption isotherms of lysozyme. Int. J. Biol. Macromol. 1988, 10, 329–336. [Google Scholar] [CrossRef]
  170. Kodandapani, R.; Suresh, C.G.; Vijayan, M. Crystal structure of low humidity tetragonal lysozyme at 2.1-A resolution. Variability in hydration shell and its structural consequences. J. Biol. Chem. 1990, 265, 16126–16131. [Google Scholar] [PubMed]
  171. Bernal, J.D.; Crowfoot, D. X-ray photographs of crystalline pepsin. Nature 1934, 133, 794–795. [Google Scholar] [CrossRef]
  172. Perutz, M.F. The structure of haemoglobin III. Direct determination of the molecular transform. Proc. R. Soc. Lond. Ser. A 1954, 225, 264–286. [Google Scholar]
  173. Einstein, J.R. Humidity control device for the Buerger precession camera. J. Sci. Instrum. 1961, 38, 449–451. [Google Scholar] [CrossRef]
  174. Pickford, M.G.; Garman, E.F.; Jones, E.Y.; Stuart, D.I. A design of crystal mounting cell that allows the controlled variation of humidity at the protein crystal during X-ray diffraction. J. Appl. Cryst. 1993, 26, 465–466. [Google Scholar] [CrossRef]
  175. Heras, B.; Edeling, M.A.; Byriel, K.A.; Jones, A.; Raina, S.; Martin, J.L. Dehydration converts DsbG crystal diffraction from low to high resolution. Structure 2003, 11, 139–145. [Google Scholar] [CrossRef]
  176. Abergel, C. Spectacular improvement of X-ray diffraction through fast desiccation of protein crystals. Acta Cryst. D 2004, 60, 1413–1416. [Google Scholar] [CrossRef]
  177. Hofmeister, F. Zur lehre von der wirkung der salze. Naunyn-Schmiedebergs Arch. Exp. Pathol. Pharmakol. 1888, 24, 247–260. [Google Scholar] [CrossRef] [Green Version]
  178. Zellnitz, S.; Narygina, O.; Resch, C.; Schroettner, H.; Urbanetz, N.A. Crystallization speed of salbutamol as a function of relative humidity and temperature. Int. J. Pharm. 2015, 489, 170–176. [Google Scholar] [CrossRef] [PubMed]
  179. Boultif, A.; Louër, D. Indexing of powder diffraction patterns for low-symmetry lattices by the successive dichotomy method. J. Appl. Cryst. 1991, 24, 987–993. [Google Scholar] [CrossRef]
  180. Degen, T.; Sadki, M.; Bron, E.; König, U.; Nénert, G. The highscore suite. Powder Diffr. 2014, 29, S13–S18. [Google Scholar] [CrossRef] [Green Version]
  181. Datta, S.; Biswal, B.K.; Vijayan, M. The effect of stabilizing additives on the structure and hydration of proteins: A study involving tetragonal lysozyme. Acta Cryst. D 2001, 57, 1614–1620. [Google Scholar] [CrossRef] [Green Version]
  182. Di, L.; Kerns, E.H. Drug-Like Properties: Concepts, Structure Design and Methods from ADME to Toxicity Optimization; Academic Press, Elsevier: Oxford, UK, 2015. [Google Scholar]
  183. Dejoie, C.; Coduri, M.; Petitdemange, S.; Giacobbe, C.; Covacci, E.; Grimaldi, O.; Autran, P.O.; Mogodi, M.W.; Jung, D.Š.; Fitch, A.N. Combining a nine-crystal multi-analyser stage with a two-dimensional detector for high-resolution powder X-ray diffraction. J. Appl. Cryst. 2018, 51, 1721–1733. [Google Scholar] [CrossRef]
  184. Spence, J.C.H. XFELs for structure and dynamics in biology. IUCrJ 2017, 4, 322–339. [Google Scholar] [CrossRef]
  185. Coe, J.; Fromme, P. Serial femtosecond crystallography opens new avenues for Structural Biology. Protein Pept. Lett. 2016, 23, 255–272. [Google Scholar] [CrossRef] [Green Version]
  186. Hunter, M.S.; Fromme, P. Toward structure determination using membrane-protein nanocrystals and microcrystals. Methods 2011, 55, 387–404. [Google Scholar] [CrossRef] [Green Version]
  187. Chapman, H.N.; Caleman, C.; Timneanu, N. Diffraction before destruction. Philos. Trans. R. Soc. Lond. B Biol. Sci. 2014, 369, 20130313. [Google Scholar] [CrossRef] [Green Version]
  188. Doerr, A. The new XFELs. Nat. Methods 2018, 15, 33. [Google Scholar] [CrossRef]
  189. Chapman, H.N.; Fromme, P.; Barty, A.; White, T.A.; Kirian, R.A.; Aquila, A.; Doak, R.B. Femtosecond X-ray protein nanocrystallography. Nature 2011, 470, 73–78. [Google Scholar] [CrossRef] [PubMed]
  190. Nogales, E.; Scheres, S.H. Cryo-EM: A unique tool for the visualization of macromolecular complexity. Mol. Cell 2015, 5, 677–689. [Google Scholar] [CrossRef] [PubMed] [Green Version]
  191. Egelman, E.H. The current revolution in cryo-EM. Biophys. J. 2016, 110, 1008–1012. [Google Scholar] [CrossRef] [PubMed] [Green Version]
Figure 1. Phase diagram (Protein concentration/ precipitation factor diagram). The solubility curve separates the undersaturated with supersaturated, which is also desirable for crystallization. (i) Batch, (ii) Vapor Diffusion, (iii) Dialysis, (iv) Free-Interface Diffusion. The superficial area consists of the metastable zone, the nucleation zone or labile zone and the precipitation zone [62].
Crystals 10 00054 g001
Figure 2. XRPD profiles of MAYV nsP3 macro domain collected at two different beamlines at the ESRF (background). Upper Panel: The materials science beamline ID11, RT, λ = 0.3492 Å. Lower Panel: The high-resolution powder diffraction beamline ID31, RT, λ = 1.29984 Å. Insets correspond to magnifications of profile selected regions [69].
Crystals 10 00054 g002
Figure 3. Pawley fit of the synchrotron XRPD profile of CVB3 3Cpro (pH 8.00; space group C2, a = 78.073 (1) Å, b = 65.577 (6) Å, c = 40.497 (1) Å, β = 115.415 (1)°, Rwp = 12.745% and χ2 = 1.651). Data were collected on ID22-ESRF (RT, λ = 1.30008 (5) Å). The black, red and blue lines represent the experimental data, the calculated pattern and the difference between the experimental and calculated profiles, respectively. The vertical bars correspond to Bragg reflections compatible with space group C2 [71].
Crystals 10 00054 g003
Figure 4. Pawley fit of the synchrotron XRPD profile of CVB3 3Cpro (pH 7.50; space group C2, a = 78.1880 (7) Å, b = 65.5013 (4) Å, c = 40.3104 (6) Å, β = 115.4490 (9)°, Rwp = 2.274% and χ2 = 2.203). Data were collected on MS-X04SA-SLS (RT, λ = 1.300429 (6) Å). The black, red and blue lines represent the experimental data, the calculated pattern and the difference between the experimental and calculated profiles, respectively. The vertical bars correspond to Bragg reflections compatible with space group C2 and the arrows indicate the improvement in d-spacing resolution (unpublished data).
Crystals 10 00054 g004
Figure 5. Pawley fit of synchrotron XRPD data of DENV3 NS5 MTase (pH 8.5; space group P21212, a = 61.8934 (7) Å, b = 189.517 (2) Å, c = 52.4404 (6) Å, Rwp = 11.413% and χ2 = 0.7506). Data were collected on ID22-ESRF (RT, λ = 1.299995 (3) Å). The black, red and blue lines represent the experimental data, the calculated pattern and the difference between the experimental and calculated profiles, respectively. The vertical bars correspond to Bragg reflections compatible with space group P21212 [72].
Crystals 10 00054 g005
Figure 6. Structure of the second SH3 domain of ponsin as derived from XRPD data. (a) Ribbon representation of the protein domain emphasizing the secondary structure elements, where the main hydrophobic regions and loops are indicated. (b) Electrostatic potential representation (using PYMOL) of the domain identifying additionally the water molecules as red spheres [11].
Crystals 10 00054 g006
Figure 7. Selected regions of the total OMIT map contoured at 1σ clearly indicating the positions and coordination of the two zinc ions present in T6 bovine insulin. The map was computed using SFCHECK. The residues represented as cyan sticks correspond to the starting model, 2a3g, and the grey spheres represent the two independent zinc ions, (a) ZnB.1 and (b) ZnB.2, octahedrally coordinated by three symmetry-related HisB10 side chains. This figure was generated using PYMOL [12].
Crystals 10 00054 g007
Figure 8. Overplot of three diffraction profiles. Upper and middle panels: The patterns correspond to human insulin samples of distinct (crystalline) polymorphs, evident from the differences in peak positions. Lower panel: Diffraction profile obtained from a sample where the two phases coexist, as it is manifested by the presence of peaks in both sets of positions, corresponding to each phase (Phase 1 and Phase 2).
Crystals 10 00054 g008
Figure 9. Upper part: The three configurations of insulin in the hexameric configuration (from left to right): R6, T3R3f and T6. The configuration of B-chain N-terminus is illustrated in red in one of the monomers of each hexamer, which differentiates the three forms. Lower part: Isolated view of the configuration of the B-chain N-terminus in each of the three forms respectively [122,123].
Crystals 10 00054 g009
Figure 10. Pawley fits of XRPD data of polycrystalline HI samples exhibiting detectable co-existing molecular polymorphs. Data were collected at ESRF (ID22, RT, λ = 1.29975 (1) Å). The T6 and T3R3f molecular conformations of rhombohedral (R3) crystal phase were identified and refined simultaneously. The black, red and blue lines indicate the experimental data, the calculated profile and their difference, respectively. The black and green vertical bars correspond to Bragg reflections compatible with space group R3 and molecular conformations of T6 and T3R3f, respectively.
Crystals 10 00054 g010
Figure 11. Surface plot of XRPD profiles of HI in the presence of 4-bromoresorcinol corresponding to the P21(γ) (pH: 4.87 to 5.60), P21(δ) (pH: 5.60 to 5.71) and P21(β) (pH: 5.91 to 8.10) polymorphs. The vertical axis corresponds to particular sample codes, the horizontal axis to a specific 2θ range, while, different colors represent intensities denoting the exact position of diffraction peaks. Data were collected on ID22-ESRF (RT, λ = 1.29989 (3) Å).
Crystals 10 00054 g011
Figure 12. Surface plot of XRPD profiles of HI in the presence of p-coumaric acid, corresponding to the P21(η) (pH: 5.44 to 5.82), P21(ζ) (pH: 6.00 to 6.89) and R3 (pH: 7.21 to 7.95) polymorphs. The vertical axis corresponds to particular sample codes, the horizontal axis to a specific 2θ range, while, different colors represent intensities denoting the exact position of diffraction peaks. Data were collected on ID22-ESRF (RT, λ = 1.30017 (2) Å).
Crystals 10 00054 g012
Figure 13. LeBail fits of seven Uox phases collected on ID31-ESRF [295 K, λ = 1.30000 (6) Å]. (a) Ligand-free Uox crystallized with NH4Cl and 15% PEG 8000 (P3121), (b) ligand-free Uox crystallized in water with 10% PEG 8000 (P21212), (c) ligand-free Uox crystallized with NaCl and 15% PEG 8000 (P21), (d) ligand-free Uox crystallized with (NH4)2SO4 and 15% PEG 8000 (P21), study. (e) Ligand-free Uox crystallized with NaCl and 8% PEG 8000 (P21), (f) ligand-free Uox crystallized with KCl and 10% PEG 8000 (P3121), (g) Uox complexed with AZA and crystallized with NaCl (I222). The black, red and lower black lines represent the experimental data, the calculated pattern and the difference between the experimental and calculated profiles, respectively (Q = 4π·sinθ·λ−1). The vertical bars correspond to Bragg reflections compatible with the particular space group [24].
Crystals 10 00054 g013
Figure 14. Comparison of amino acid sequences of somatostatin-14 and octreotide. The amino acids necessary for binding to the receptor are shadowed [155].
Crystals 10 00054 g014
Figure 15. Overplot of three octreotide datasets, collected at different sources, in a restricted angle region (Q = 4π·sinθ·λ−1). The right panel shows the first two peaks for each source, indicating their individual properties.
Crystals 10 00054 g015
Figure 16. Selected regions of the final structural model of octreotide in stick representation and the corresponding total OMIT map contoured at 1σ. The green, blue and red colors in the stick representation illustrate C, N and O atoms of different amino acids, respectively, while water molecules are denoted as red spheres. The four different panels focus on: (a) D-phenylalanine and the disulfide bridge of molecule A; (b) L-lysine of molecule A; (c) neighboring D-tryptophan residues of molecules B and C and L-phenylalanine of molecule C; (d) reduced threonine of molecule C [34].
Crystals 10 00054 g016
Figure 17. Surface plot of XRPD data of HEWL polycrystalline precipitates in a complete de/rehydration process (95 → 80 → 75 → 80 → 95% rH). Samples were crystallized at pH 4.5.
Crystals 10 00054 g017
Figure 18. Pawley fits of XRPD data of monoclinic (left panel) and tetragonal (right panel) HEWL samples, loaded into a thin kapton foil holders. Data were collected using a laboratory diffractometer (Empyrean by Malvern Panalytical) (λ = 1.540585 Å, RT). In both cases, the upper black and red lines represent the experimental data and the calculated profile, respectively, and the lower blue line represents the difference between the experimental and calculated profiles. The vertical bars correspond to the Bragg reflections compatible with the space groups P21 and P43212.
Crystals 10 00054 g018
Table 1. Classification of insulin and insulin analogue formulations based on their initiation and duration of action [118].
Type of FormulationInsulin FormulationStart ActionMaximum ActionDuration of Action
Rapid-acting analoguesInsulin lispro5–15 min30–90 min3–5 h
Insulin aspart5–15 min30–90 min3–5 h
Insulin glusine5–15 min30–90 min3–5 h
Quick-acting analoguesRegular30–60 min2–3 h5–8 h
Intermediate-acting analoguesNPH30–60 min4–10 h10–16 h
Lente30–60 min4–12 h12–18 h
Semilente1–3 h2–8 h12–16 h
Long-acting analoguesUltralente6–10 h10–16 h18–24 h
Insulin glargine2–4 hPeakless20–24 h
Insulin detemir2–4 h6–14 h16–20 h
Insulin mixtures
(multiple action)
75/25 lispro analogue
mix(75% intermediate, 25% lispro)
5–15 minPeakless10–16 h
70/30 aspart analogue
mix(70% intermediate, 30% aspart)
5–15 minPeakless10–16 h
50/50 lispro analogue
mix(50% intermediate, 50% lispro)
5–15 minPeakless10–16 h
70/30 human
mix (75% NPH, 30% regular)
30–60 minPeakless10–16 h
50/50 human
mix (50% NPH, 50% regular)
30–60 minPeakless10–16 h
Table 2. List of recently reported HI monoclinic polymorphs as a function of different ligands and pH range. Precise unit-cell parameters, obtained by XRPD data, are listed.
Crystal PolymorphLigandpH RangeUnit-Cell Parameters
a (Å)b (Å)c (Å)β (°)
P21(α)phenol5.47–5.70114.682 (6)337.63 (2)49.270 (4)101.555 (6)
rescorsinol5.29–5.46114.0228 (8)335.43 (3)49.211 (6)101.531 (8)
4-ethylresorcinol2.64-5.80114.130 (7)336.086 (3)48.987 (5)101.935 (8)
P21(β)phenol7.01–8.2561.0920 (4)61.8279 (4)47.9302 (4)110.6253 (7)
rescorsinol7.53–8.2261.0008 (4)62.0040 (3)47.8823 (3)110.0465 (5)
4-ethylresorcinol6.70–8.1062.8231 (7)62.1078 (5)47.8362 (6)111.6913 (9)
4-chlororesorcinol 16.60–8.1062.413 (1)61.872 (1)47.786 (1)111.978 (2)
4-bromoresorcinol 15.90–8.1062.032 (3)62.186 (2)47.876 (2)113.809 (4)
P21(γ)m-cresol4.50–6.7087.132 (3)70.294 (2)48.064 (2)106.259 (3)
4-nitrophenol4.95–5.6087.118 (1)70.9493 (9)48.4967 (9)106.653 (1)
4-ethylresorcinol5.10–6.3087.132 (3)70.294 (2)48.064 (2)106.259 (3)
4-chlororesorcinol 14.55–5.4387.731 (1)69.9553 (8)47.9564 (8)106.754 (2)
4-bromoresorcinol 14.60–5.6087.065 (4)70.191 (2)47.822 (3)106.539 (4)
P21(δ)4-chlororesorcinol 15.59–5.6448.4206 (9)59.663 (1)47.7644 (6)94.060 (2)
4-bromoresorcinol 15.88–6.2748.833 (1)60.146 (1)47.6372 (7)93.848 (2)
P21(ε)m-nitrophenol 15.60–6.6072.951 (1)64.1465 (8)59.7727 (8)92.091 (1)
P21(ζ)p-coumaric acid5.82–6.7948.2712 (8)68.513 (1)41.6667 (8)95.030 (1)
resveratrol5.46–5.8148.211 (2)68.305 (2)41.770 (2)95.108 (3)
P21(η)p-coumaric acid5.44–5.8277.4210 (1)46.7125 (7)82.8445 (1)111.063 (2)
resveratrol5.06–5.4677.4454 (1)46.7230 (7)82.864 (1)111.068 (2)
C2phenol6.70–6.75103.0115 (5)61.3213 (2)63.5783 (4)117.2244 (5)
4-ethylresorcinol5.93–6.25103.0848 (4)61.6636 (2)63.5006 (4)117.417 (5)
4-chlororesorcinol 15.98–6.50102.947 (2)61.502 (1)63.372 (2)117.221 (3)
C2221phenol5.93–6.5460.287 (1)221.797 (6)228.812 (5)90
resorcinol5.93–7.4560.5579 (7)220.907 (3)228.320 (3)90
1 Unpublished data.
Table 3. Unit-cell parameters and molecular packing efficiency for the seven P21 HI polymorphs reported in literature. * Due to the large unit-cell volume, there are multiple valid Matthews coefficient values with high probability of occurrence [99].
PhaseUnit-Cell ParametersVolume (Å3)Matthews CoefficientHexamers per Unit-CellSolvent (%)Molecular Packing Efficiency (%)
a (Å)b (Å)c (Å)β (°)
P21(α)*114.0228 (8)335.43 (3)49.211 (6)101.531 (8)1,844,168.622.64572053.5146.49
2.40522248.8651.14
2.20472444.2155.79
P21(β)61.0008 (4)62.0040 (3)47.8823 (3)110.0465 (5)170,132.632.4414249.6250.38
P21(γ)87.5506 (2)70.4772 (1)48.3231(1)107.0332 (2)285,089.912.0452439.8660.14
P21(δ)48.9730 (4)60.1422 (5)47.7529 (4)95.7345 (5)139,944.852.0075238.7361.27
P21(ε)72.951 (1)64.1465 (8)59.7727 (8)92.091 (1)279,523.172.0049438.6561.35
P21(ζ)48.2712 (8)68.513 (1)41.6667 (8)95.030 (1)137,269.061.9689237.5362.47
P21(η)77.41 (3)46.728 (2)82.96 (3)111.148 (6)279,873.932.0082438.7561.25

