Article

Dielectric and Electro-Optic Effects in a Nematic Liquid Crystal Doped with h-BN Flakes

Soft Matter and Nanomaterials Laboratory, Department of Physics, The United States Naval Academy, Annapolis, MD 21402, USA
*
Author to whom correspondence should be addressed.
Crystals 2020, 10(2), 123; https://doi.org/10.3390/cryst10020123
Submission received: 24 January 2020 / Revised: 11 February 2020 / Accepted: 13 February 2020 / Published: 16 February 2020
(This article belongs to the Special Issue Early Career Stars of the Decade)

Abstract

:
A small quantity of hexagonal boron nitride (h-BN) flakes is doped into a nematic liquid crystal (LC). The epitaxial interaction between the LC molecules and the h-BN flakes rising from the ππ electron stacking between the LC’s benzene rings and the h-BN’s honeycomb structure stabilizes pseudo-nematic domains surrounding the h-BN flakes. Electric field-dependent dielectric studies reveal that the LC-jacketed h-BN flakes follow the nematic director reorientation upon increasing the applied electric field. These anisotropic pseudo-nematic domains exist in the isotropic phase of the LC+h-BN system as well, and interact with the external electric field, giving rise to a nonzero dielectric anisotropy in the isotropic phase. Further investigations reveal that the presence of the h-BN flakes at a low concentration in the nematic LC enhances the elastic constants, reduces the rotation viscosity, and lowers the pre-tilt angle of the LC. However, the Fréedericksz threshold voltage stays mostly unaffected in the presence of the h-BN flakes. Additional studies show that the presence of the h-BN flakes enhances the effective polar anchoring strength in the cell. The enhanced polar anchoring strength and the reduced rotational viscosity result in faster electro-optic switching in the h-BN-doped LC cell.

Graphical Abstract

1. Introduction

The nanoscale interactions between nematic liquid crystals (LCs) and various two-dimensional (2D) hexagonal nanomaterials show interesting phenomena at the macroscopic levels. For example, the epitaxial interactions between the nematic LC and the hexagonal lattice of graphene, molybdenum diselenide, and tungsten diselenide deposited [1,2,3,4,5,6,7,8,9,10] demonstrate that the LC can achieve a planar-aligned state on these 2D hexagonal nanostructures. Our group has recently shown that the 2D hexagonal boron nitride (h-BN) film can be successfully employed as a planar-alignment agent as well as an ion-capturing agent in electro-optic LC devices [11,12,13]. Here we report the effects of ultrafine 2D h-BN flakes as a colloidal dopant in a nematic LC. The alternating boron and nitrogen atoms form the sp2 conjugated honeycomb structure of h-BN with a lattice spacing of 1.44 Å [14]. This 2D h-BN is an insulator [15] which has very high structural [16], thermal [17], and chemical [18] stability. Here, we experimentally demonstrate that the LC—h-BN epitaxial interaction results in the formation of pseudo-nematic domains—which modifies the LC’s dielectric anisotropy, splay elastic constant, rotational viscosity, and pre-tilt angle. In addition, the isotropic phase shows a net anisotropy on the application of an electric field due to the presence of the h-BN-induced pseudo-nematic domains. When some h-BN flakes from the LC+h-BN sample are absorbed onto the alignment substrates, the polar anchoring strength of the cell is found to increase significantly—which has a major impact on the accelerated electro-optic switching effect of the LC+h-BN sample.

2. Materials and Methods

The ultrafine h-BN flakes in powder form, obtained from Graphene Supermarket, Inc., USA, contained monolayer flakes of a thickness of 0.35 nm. The flakes had an average lateral length of 100 nm. A small amount of h-BN sample was first dispersed in ethanol. The ethanol+h-BN mixture was then shaken on a vortex mixer for 1 h, followed by sonication for 6 h. The LC E7 (TNI = 60 °C) was then added to the ethanol+h-BN mixture and sonicated for 1 h to allow the LC to dissolve entirely into the ethanol. The ethanol was then evaporated slowly at an elevated temperature, leaving a pure LC+h-BN mixture with approximately 1.2 × 10⁻² wt% h-BN flakes in the LC. The mixture was degassed under a vacuum for 4 h. Finally, the LC+h-BN mixture was further sonicated for 6 h. For consistency, the pure LC E7 was also treated the same way; i.e., dissolving in ethanol followed by slow evaporation and degassing. Commercially manufactured antiparallel rubbed planar LC cells from Instec, Inc., USA with a 1 × 1 cm2 indium tin oxide (ITO) coated area and a d = 20 µm spacing, were used for our experiments. Two cells were filled at temperature T = 65°C in the isotropic phase by capillary action, one with LC E7 only, and the other with the LC+h-BN mixture. Then the cells were slowly cooled to room temperature.
The B—N bond length in an h-BN lattice is 1.44 Å [13]. In a hexagonal benzene ring, the C–C bond length is 1.40 Å. Therefore, the hexagonal benzene rings in the LC and the hexagonal 2D h-BN lattice structure have almost the same size. It has been experimentally shown that this nano-architectural symmetry of the hexagons in these two species leads the benzene rings of the LC to coherently align on the hexagonal lattice of h-BN [12]. This epitaxial interaction is schematically presented in Figure 1a by matching the LC benzene rings on the hexagons of the h-BN lattice. The density functional calculations indicate that this epitaxial planar anchoring of the LC molecules on the hexagonal nanostructures (h-BN, graphene, WSe2, etc.) becomes stronger with a binding energy, ranging from 0.7 to 2.0 eV/molecule [4,10,19,20], by the electrostatic energy arising from a substantial amount of charge transfer between the LC molecules and the hexagonal lattice structure. The coherently aligned LC molecules create pseudo-nematic domains (PNDs) on the surfaces of h-BN flakes in the LC+h-BN mixture due to this epitaxial interaction, as schematically shown in Figure 1b. These PNDs have different anisotropy to the bulk LC depending on the surface symmetry of the h-BN flakes. The PNDs are formed on both sides of an h-BN flake. These LC-jacketed h-BN flakes align with their flat planes parallel to the far-field nematic director in the nematic LC to minimize the elastic distortion of the nematic phase to reduce the free energy. The nematic state, therefore, gains additional orientational order due to this LC–h-BN interaction—which can be visualized as local anchoring fields along the nematic director. Note that, the h-BN flakes do not have any permanent dipole moment. However, when the flakes are encapsulated in the PNDs, these LC-jacketed h-BN flakes possess a net anisotropy and can interact with an external electric field E , as schematically presented in Figure 1b,c.

3. Results and Discussion

3.1. Dielectric Studies

An LC’s nematic phase shows dielectric anisotropy, Δε = εε, where ε and ε are the dielectric components parallel and perpendicular to the nematic director n ^ , respectively. For a positive dielectric anisotropic LC, ε > ε. In a planar parallel-plate cell configuration, the nematic director n ^ is initially oriented perpendicularly to the applied electric field E . When E is above a critical threshold value, n ^ reorients parallel to E , achieving a homeotropic orientation. This reorientation process occurs because the nematic state experiences a torque proportional to Δε E2 [21] due to its dielectric anisotropy. This is the essence of the Fréedericksz transition. In the isotropic phase of an LC, Δε = 0, and so it does not respond to E . An Automatic Liquid Crystal Tester (Instec, Inc.) was employed to measure the dielectric constant ε values of the pure LC and LC+h-BN samples as a function of applied voltage Vrms (f = 1000 Hz) at different temperatures, both in the nematic and isotropic phases. The AC field was applied to avoid the effect of ion migration on the dielectric measurements.
Figure 2a shows a typical Fréedericksz transition in the deep nematic phase at T = 40 °C for the pure LC and LC+h-BN listed in the legend. The LC and the LC+h-BN mixture undergo planar (ε) to homeotropic (ε) orientational transition above the threshold voltage Vth upon increasing the applied Vrms. The perpendicular dielectric component ε was obtained from the average value of ε at Vrms < Vth. The inset in Figure 2a shows ε as a function of inverse applied voltage, V rms 1 for both the cells. The extrapolated y-intercept of the linear fit of ε vs. V rms 1 gives the value of ε. Figure 2b shows ε and ε as a function of temperature for the pure LC and LC+h-BN listed in the legend. Figure 2c presents the dielectric anisotropy, Δε = εε, as a function of temperature for the two samples.
These local PNDs possess a different anisotropy than that of the bulk LC due to the strong LC–h-BN epitaxial interaction. These domains collectively increase the overall anisotropy and the nematic orientational order in the LC+h-BN sample. Figure 2d schematically shows that the PNDs align with their flat planes parallel to the far-field nematic director in the nematic LC to minimize the elastic distortion. When the external electric field rotates the nematic LC, the PNDs also follow the director rotation, as illustrated in Figure 2e.
Figure 2c shows that the parallel dielectric component ε is a little higher in the LC+h-BN sample, as the PNDs contribute their anisotropy to the bulk LC. On the other hand, the perpendicular dielectric component ε is slightly lower in the LC+h-BN sample. Some h-BN flakes sediment down from the LC and preferentially attach to the alignment substrate. This process promotes planar anchoring and presumably pulls the LC molecules closer to the substrate due to the LC—h-BN interaction, reducing the average pretilt angle. This reduced pretilt angle results in a slightly lower ε in the LC+h-BN sample. Later in this article, we will present the pretilt angle measurement. A higher ε and a lower ε lead to an enhanced Δε for the LC+h-BN sample. See Figure 2c.
The energy associated with LC–h-BN anchoring mechanisms, |Uanchoring| = 1.2 eV per molecule [22]. In the deep isotropic state at T = 70 °C = 343 K for the LC E7, the thermal energy, Uthermal ~ kBT = 2.95 × 10⁻² eV << Uanchoring. Therefore, the thermal energy is not strong enough to eradicate the LC—h-BN anchoring mechanisms at the LC—h-BN interface in the isotropic phase. Thus, the PNDs are expected to exist in the isotropic phase as well.
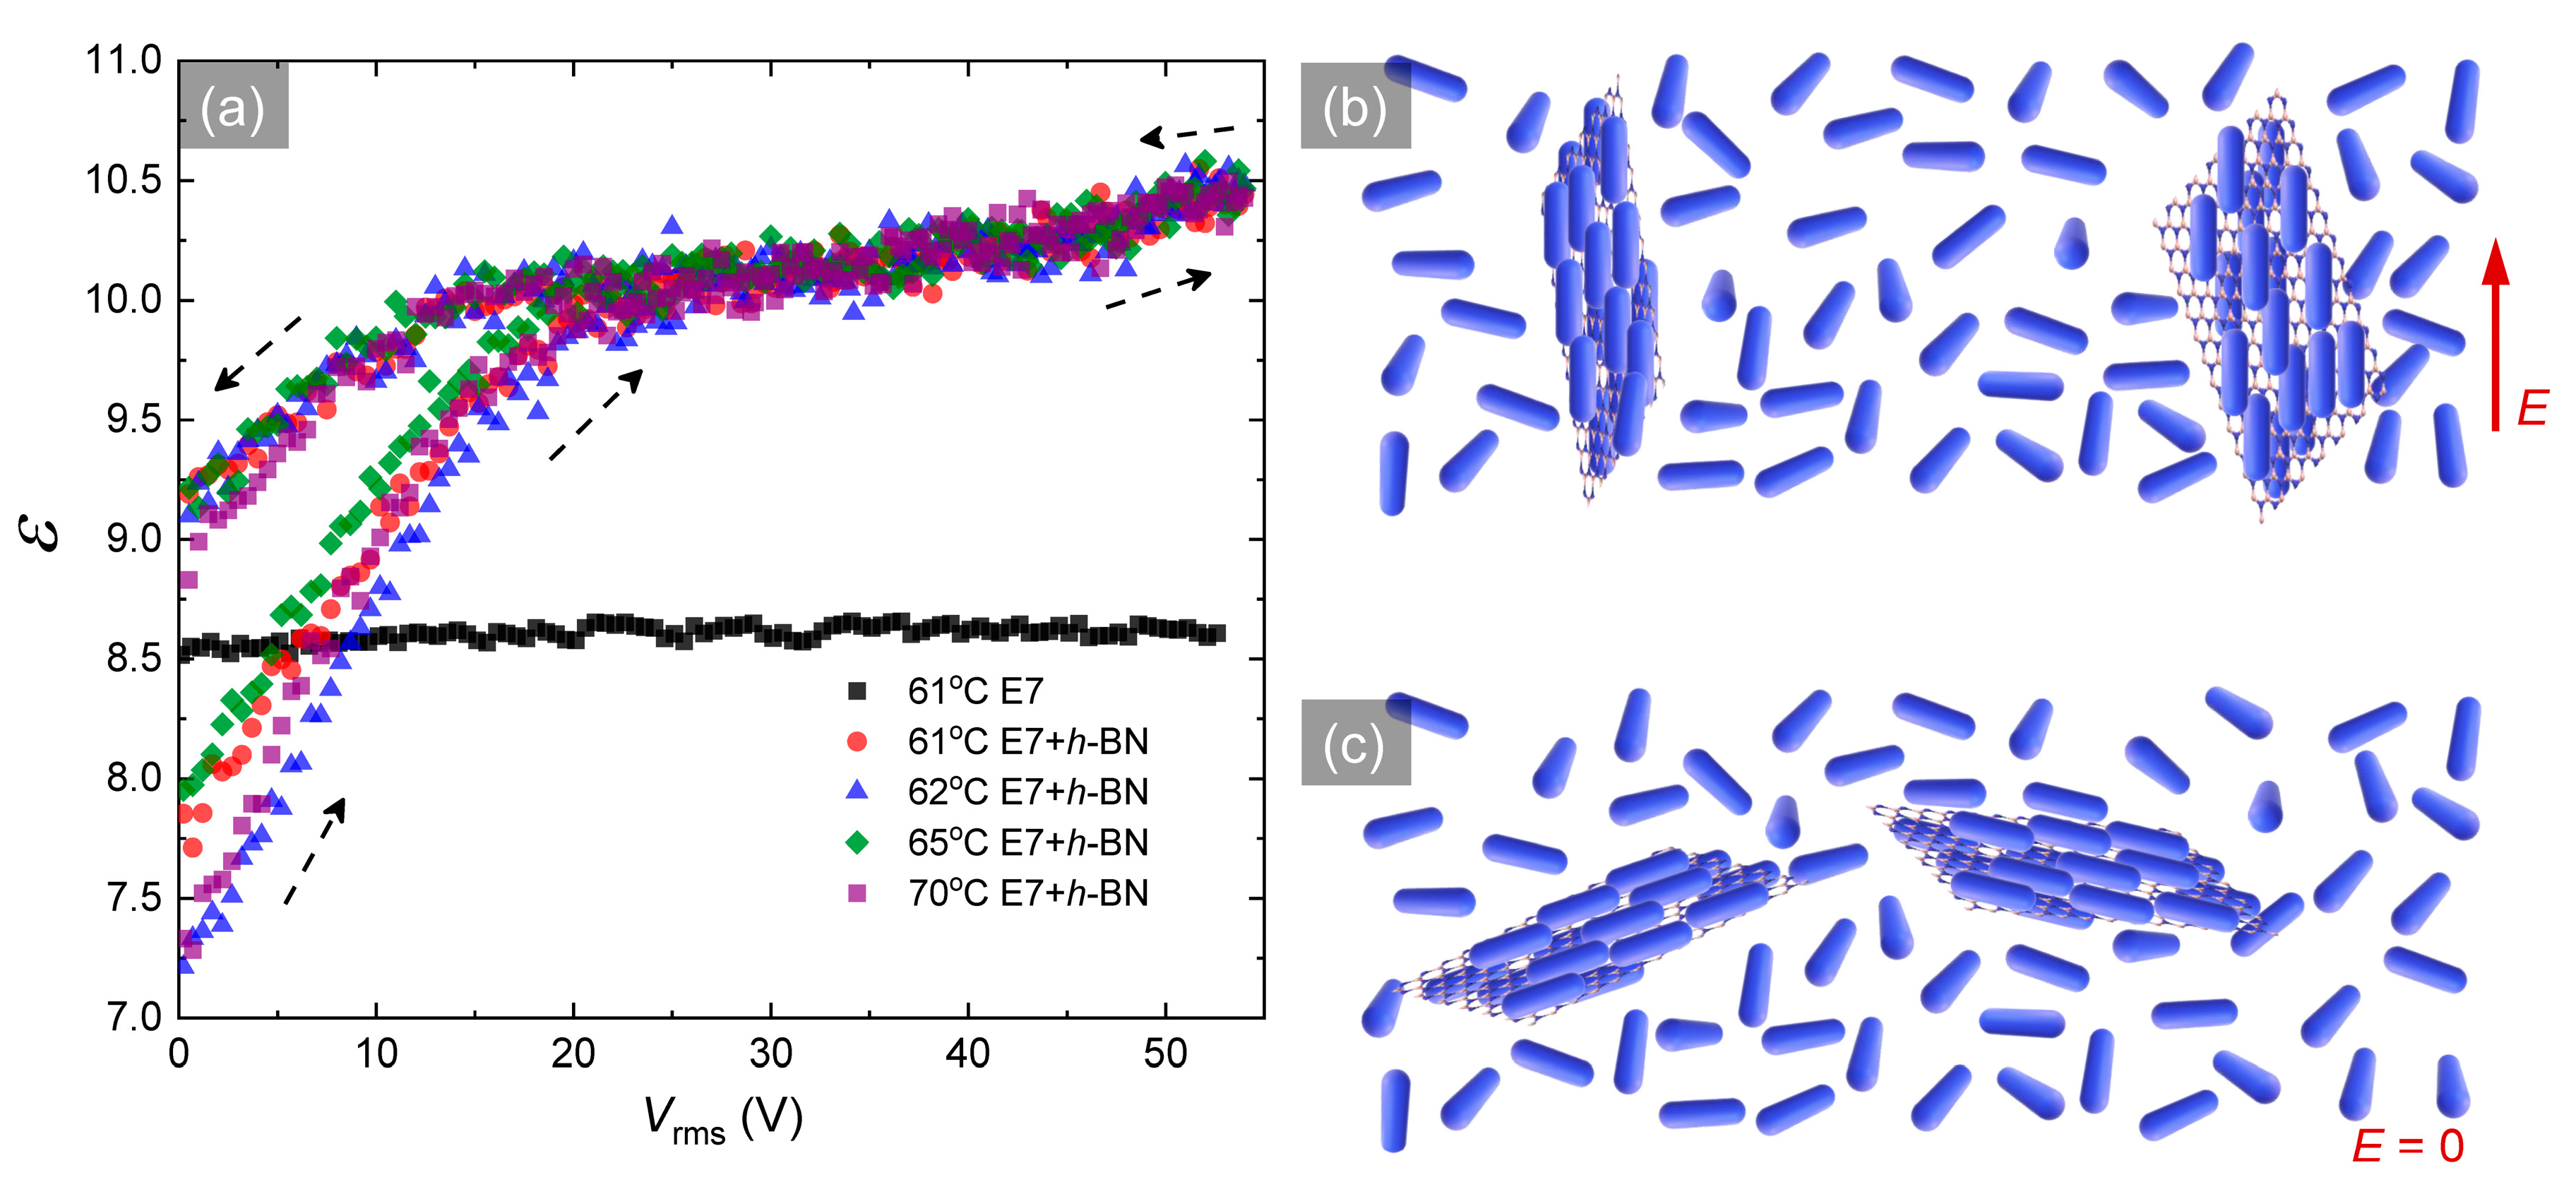
Figure 3 presents ε as a function of applied voltage in the isotropic phase for the pure LC and LC+h-BN listed in the legend. The pure LC shows a featureless behavior in the isotropic phase at T = 61 °C, as expected. The LC+h-BN system shows an increase in ε with increasing applied voltage in the isotropic phase at T = 61 °C. This phenomenon depicts that the suspended PND-encapsulated h-BN flakes induce a net orientational order in the isotropic LC system—which responds to the external field E in the isotropic phase. The increase in ε as a function of applied voltage in the isotropic phase for the LC+h-BN system and a featureless behavior of the same as a function of the applied voltage for the ethanol+h-BN system clearly indicates that the PNDs are present in the LC+h-BN system and interact with E . The individual PNDs, being anisotropic in nature, possess dielectric anisotropy ΔεPND. Therefore, the PNDs experience a torque proportional to ΔεPNDE2 in an external electric field E . The increase in ε for the LC+h-BN sample indicates the alignment mechanism of the PNDs with E in the isotropic phase, as schematically shown in Figure 3b,c. There is no distinct threshold voltage (like Fréedericksz threshold) observed to start the increment in ε in the isotropic phase. This is because the PNDs do not interact directly with the alignment layers due to the absence of any long-range elastic interaction in the isotropic phase. The dielectric anisotropy in the isotropic phase for the doped system is defined as Δεiso = εmaxεmin, where εmax and εmin can be determined from Figure 3a. Figure 2c shows the non-zero Δεiso values for the LC+h-BN sample above TNI. More interestingly, as Figure 3a shows, ε does not relax back to its original value on turning the voltage down to zero, showing a dielectric hysteresis effect—which manifests a nonvolatile memory effect. This hysteresis effect is persistent at several higher temperatures in the isotropic phase, as shown in Figure 3a. After each field cycle at a given temperature in the isotropic phase, the LC+h-BN sample was cooled down to the nematic phase (T = 25 °C) at a rate of 0.02 °C/min to erase the memory. For consistency, each time before starting a new field cycle, the LC+h-BN sample was heated up from the nematic phase to the isotropic phase at T = 70 °C, at a rate of 0.02 °C/min, and then cooled down to the desired temperature in the isotopic phase at the same rate.
As mentioned above, the PNDs do not interact directly with the alignment layers, since there is no long-range elastic interaction in the bulk isotropic phase, and therefore, when the external field E is cycled down to zero, there is no elastic force to torque the PNDs back to the original alignment. The thermal fluctuation disturbs the PNDs to some extent, but cannot completely randomize the PNDs after the external field E is turned down to zero. Therefore, PNDs maintain some degree of alignment in the isotropic phase after the external field E is turned down to zero; hence the observed hysteresis.
To investigate the effects of the PNDs on the physical properties of the LC, we have obtained the bend (K33) and splay (K11) elastic constants employing the Fréedericksz transition method [23] by fitting the capacitance (C) vs. voltage (V) graphs according to the equation
C C o =   2 π 1 + γ sin 2 φ m V t h V φ 0 φ m ( 1 + γ sin 2 φ ) ( 1 + κ sin 2 φ ) sin 2 φ m sin 2 φ d φ )
where γ = Δε/ε, κ = (K33/K11) − 1, Co is the zero-field capacitance, φ is the angle between the director and the alignment substrate at applied voltage V, φm is the maximum angle in the middle of the cell, φo is the pre-tilt angle, and Vth is the threshold voltage for Fréedericksz transition.
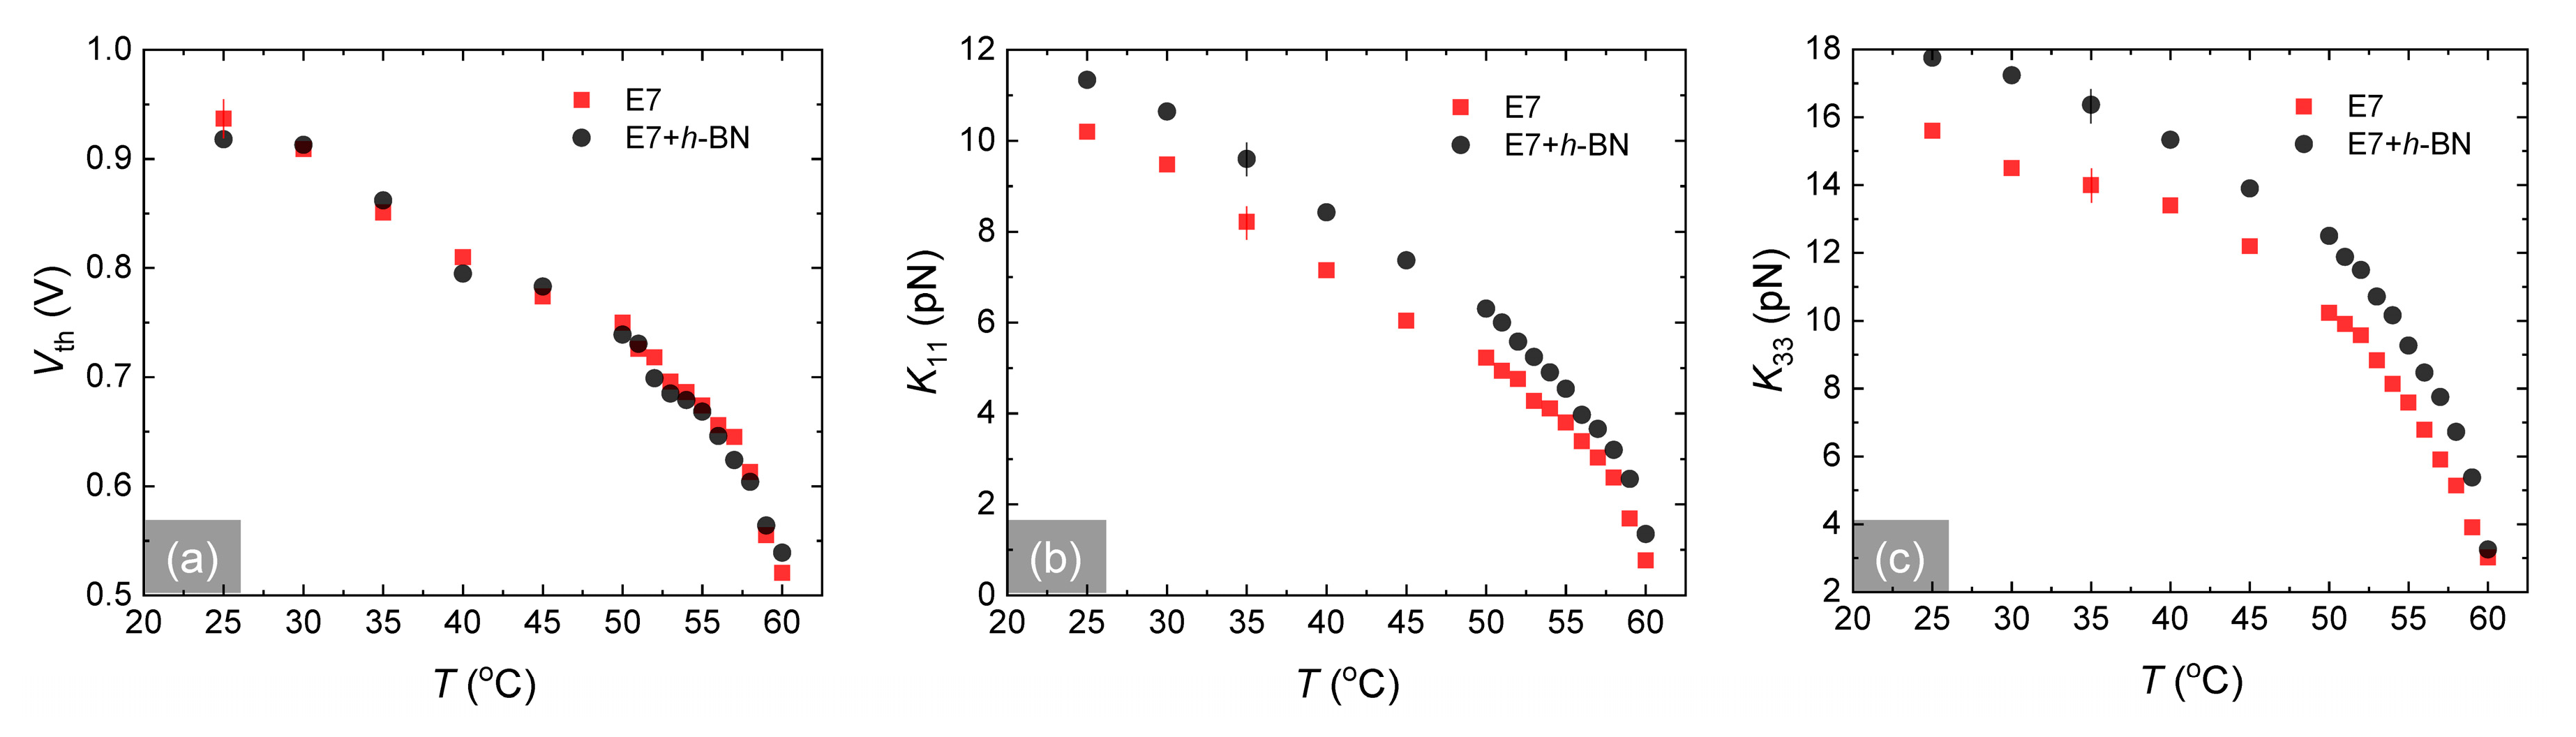
Figure 4a shows the Fréedericksz transition threshold voltage Vth as a function of temperature for the pure LC and LC+h-BN hybrid. Clearly, Vth stays unaffected in the presence of h-BN flakes. Figure 4b,c present K11 and K33, respectively, as a function of temperature for pure LC and LC+h-BN hybrid. As discussed before, the PNDs collectively increase the overall anisotropy and the nematic orientational order in the LC+h-BN sample. Therefore, the elastic interaction is also increased in the LC+h-BN sample. Figure 4b,c, therefore, reveals the increase in K11 and K33 for the LC+h-BN sample. Now, the threshold voltage is described by Vth = π ( K 11 / ε 0   Δ ε ) [23]. Since both K11 and Δε are increased by a similar percentage, the effective change in Vth is minimal, as seen in Figure 4a.

3.2. Rotational Viscosity and Pretilt Angle

The rotational viscosity γ1 of an LC is an important physical parameter that influences the field-induced switching behavior of the LC. We have therefore performed experiments to measure the rotational viscosity γ1 for the LC+h-BN sample. The rotational viscosity for the nematic samples was obtained by measuring an electric field-induced transient current [24,25,26] across the cell. When a DC electric field (much higher than the threshold field) is applied across a planar LC cell, the nematic director goes through a dynamic rotation and induces a transient current I(t) in the cell. This current response is given by
I ( t ) =   A   ( Δ ε   ε o ) 2   E 3   γ 1   s i n 2 [ 2 φ ( t ) ]
where A is the area of the cell, E = (V/d) is the DC electric field, and φ is the angle the director makes with the electrodes at a given time. At φ = 45°, I(t) reaches its peak value,   I p =   A   ( Δ ε   ε o ) 2   E 3   γ 1   at the peak time,
t p = [ γ 1 ( l n ( t a n φ o ) ) Δ ε   ε o ] 1   E 2
where φo is the pretilt angle. A DC voltage pulse of 25 V with a pulse interval of 1 Hz was applied across the cell to generate I(t)—which was detected as a function of time by a digital storage oscilloscope through a load resistor in series. A detailed description of the experimental setup is given in reference [24]. The inset in Figure 5a shows I(t) as a function of time for the pure LC and LC+h-BN at T = 25 °C. The peak current Ip was detected from the I(t) vs. time graph to extract γ1 from the known values of E, Δε, and A. Figure 5a depicts that the LC+h-BN sample has a smaller γ1 than the pure LC. We have recently shown that when an h-BN nanosheet is utilized as a planar-alignment agent in an LC the cell, the h-BN nanosheet captures a significant amount of free ion impurities from the LC by ion-trapping process [11]. It has been also shown that the reduction of free ions in the LC results in a reduced γ1 [5,9,27,28,29]. We believe that the dispersed h-BN flakes in the LC also trap free ion-impurities and reduce γ1 in the LC+h-BN sample.
It has been shown that one of the most accurate methods to measure φo is the transient current I(t) method [26], which has been employed to measure γ1 in this paper. After extracting γ1 from the peak transient current, one can use Equation (3) to find φo from the peak time (see the inset in Figure 5a) for the pure LC and LC+h-BN samples. Figure 5b presents the effective φo as a function of temperature for the samples listed in the legend. Evidently, LC+h-BN exhibits almost a 50% decrease in φo in the room temperature regime. It is possible that a number of monolayer h-BN flakes sediment down and/or get stuck to the alignment substrates from the LC+h-BN mixture and align themselves horizontally on the substrates during the filling process of the LC cell. When some h-BN flakes are preferentially attached to the alignment substrates, they promote planar anchoring, and presumably pull the LC molecules close to the substrate due to the h-BN—LC epitaxial interaction. This process reduces the effective φo in the LC+h-BN mixture.

3.3. Polar Anchoring Strength

The energy cost of the deviation from a planar orientation to a homeotropic orientation upon the application of an electric field is characterized by the polar anchoring strength coefficient, Wθ. Intuitively, the spontaneously deposited h-BN flakes on the alignment substrates would enhance the effective polar anchoring strength for the LC+h-BN sample. We have, therefore, measured Wθ for both the pure LC and LC+h-BN samples. This Wθ measurement was carried out employing the high field technique—where the optical retardation and capacitance of the LC cell are measured simultaneously as a function of applied voltage [30]. According to this technique [30], Wθ is expressed by assuming the first-order approximation,
R R o = 1 C V ξ I 2 K 11 W θ d
where V is the applied rms voltage; R and R0 are retardations with and without the applied voltage, respectively; ξ and I depend on the LC’s properties and the cell geometry; C is the capacitance of the cell; K11 is the splay elastic constant of LC; and d is the cell gap. We used d = 22.5 μm thick planar cells for these measurements. A Soleil-Babinet compensator (Thorlabs, Inc.) was used to measure the retardations as a function of applied Vrms (f = 1000 Hz), and at the same time, the capacitance was measured by a Keysight E4980A LCR meter as a function of the same Vrms at T = 25 °C.
Figure 6a shows the retardation (in μm) on the left-hand y-axis as a function of Vrms. The right-hand y-axis in Figure 6a shows the capacitance as a function of Vrms. Figure 6b shows R/R0vs. 1/CV for both pure LC and LC+h-BN samples. R/R0 vs. 1/CV exhibits an excellent linear behavior in the high field (Vrms >12 V) region, according to Equation (4). The anchoring strength coefficient Wθ now can be determined from the extrapolated intersection of Equation (4) with the axis of 1/CV = 0 (see the inset in Figure 6b) and from the known values of K11 and d. We found that W θ LC = 5.15 × 10⁻⁴ J/m2 and W θ LC + h BN = 9.70 × 10⁻⁴ J/m2—which is an 88% increase in the effective polar anchoring strength. When some h-BN flakes are preferentially attached to the alignment substrates, they modify the substrates’ effective anchoring characteristics by enhancing the planar anchoring energy due to the h-BN—LC epitaxial interaction. This is consistent with some recent results in the literature that show that the graphene flakes [9] and carbon nanotubes [31] can also be absorbed on the alignment substrates from the respective LC-colloidal mixtures and significantly enhance the effective Wθ.
The Table 1 summarizes the LC parameters at 25 °C.

3.4. Electro-Optic Switching

Now we will discuss the impact of this enhanced Wθ on the nematic switching response. The two characteristic times, τon (voltage on) and τoff (voltage off), of the nematic director, considering Wθ, can be described as [32]
τ on γ 1 Δ ε   ε o V 2     K 11 π 2   ( d 2 + 4   d   K 11 W θ ) ,   τ off γ 1 Δ ε   ε o V b 2   K 11 π 2   ( d 2 + 4   d   K 11 W θ )
where V (>>Vth) is the driving applied voltage and Vb is the bias voltage.
Since Wθ and γ1 influence the dynamic electro-optic response in an LC device mainly, the electro-optic switching times for both the pure LC and LC+h-BN samples in 20 μm cells have been investigated. These response times in both the cells were measured by employing the standard electro-optical setup [6,11,12,13], where a 5-mW He-Ne laser beam of wavelength 633 nm was sent through two crossed-polarizers and into a photodetector. The planar LC test cell was placed in-between the crossed polarizers where n ^ in the cell was aligned at 45° with respect to the polarizer. The photodetector output was fed into a digital oscilloscope. A modulated square-wave driving voltage with a |Vb| = 5 V and a |V|= 25 V (>>Vth = 0.95 V) was applied across the cell, and the changes in the transmitted intensity through the cell were measured as a function of time from the oscilloscope. In Figure 7, the right-hand y-axis shows the modulated square-wave driving voltage (modulated frequency f = 30 Hz) profile across the cell. The left-hand y-axis in Figure 7 shows the change in the normalized transmitted intensity through both the cells as a function of time.
The optical switching on, τon is the time needed by the transmitted intensity to drop from 90% to 10% of its maximum value when V is turned on. After V is turned off, the transmitted intensity through the test cell increases, and the optical switching turns off, τoff is the time needed by the transmitted intensity to rise from 10% to 90% of its maximum value. The measured τon and τoff are shown in Table 2.
Note that τon in Table 1 shows a slight decrease (≈4%) for the LC+h-BN sample. However, τoff is significantly accelerated (≈18%) for the LC+h-BN sample—which can also be seen in Figure 7. This faster switching response is mainly attributed to the significant enhancement in the effective Wθ and decrease in γ1 in the LC+h-BN sample.
Note that in this experiment, Vth ≈ 0.95 V and the driving voltage |V| = 25 V, and therefore, V >> Vth. In this high voltage regime, the electro-optic switching mode is known as the transient nematic relaxation mode [33,34], where τoff is naturally fast (~milliseconds), even for large cell-gaps [33,34]. Additionally, since V >> Vth, the driving voltage becomes the dominating factor for τon, and Wθ has very little effect on τon [8,31]. See Equation (5) for τon. Therefore, a minimal change in τon is observed for the LC+h-BN sample. However, when the driving voltage is turned off, τoff is purely influenced by the elastic interaction between the LC and the planar-alignment layers—which is primarily driven by the polar anchoring strength in the cell. In the weak anchoring range (Wθ ~ 10−4 to 10−5 J m−2), the term K 11 W θ in τoff in Equation (5) plays a significant role [8,13] in altering the value of τoff. Therefore, in this weak anchoring limit, τoff is found to be faster for the LC+h-BN sample for a higher effective Wθ and a lower γ1.
The two micrographs in the inset in Figure 7 show the voltage off and voltage on states, respectively, for the LC+h-BN cell under a crossed polarized microscope. The micrograph for the voltage off state shows a uniform texture with no visible h-BN aggregates. This confirms a uniform dispersion of the h-BN flakes at 1.2 × 10⁻² wt% in the LC. Our concentration-dependent investigation showed that when the concentration was more than 3 × 10⁻² wt%, the LC+h-BN texture showed the presence of visible h-BN aggregates under the microscope. Therefore, we consider the 1.2 × 10⁻² wt% as the optimal concentration, and all the experiments were carried out at this concentration.

4. Conclusions

In conclusion, we have shown that the presence of h-BN flakes in the LC creates anisotropic PNDs, altering some essential physical and optical properties of the LC. The presence of the PNDs enhances the dielectric anisotropy in the nematic phase. In the isotropic phase, the PNDs still exist and interact with the external electric field. It is observed that the presence of h-BN flakes decreases the rotational viscosity and lowers the pretilt angle. Finally, the polar anchoring strength is enhanced in the LC+h-BN sample, and consequently, this hybrid sample exhibits a faster electro-optic switching than the pure LC.

Author Contributions

Conceptualization, R.B.; methodology, R.B., L.J.A. and G.W.S.; software, R.B., L.J.A. and G.W.S.; validation, R.B., L.J.A. and G.W.S.; formal analysis, R.B., L.J.A. and G.W.S.; investigation, R.B., L.J.A. and G.W.S.; resources, R.B.; data curation, R.B., L.J.A. and G.W.S.; writing—original draft preparation, R.B.; writing—review and editing, L.J.A. and G.W.S.; visualization, R.B; supervision, R.B.; project administration, R.B.; funding acquisition, R.B. All authors have read and agree to the published version of the manuscript.

Funding

This research was funded by the Office of Naval Research (N0001419WX01126; N0001419WX01219; N0001419WX00566) and a USNA Kinnear Fellowship Award.

Conflicts of Interest

The authors declare no conflict of interest.

References

  1. Shehzad, M.A.; Tien, D.H.; Iqbal, M.W.; Eom, J.; Park, J.H.; Hwang, C.; Seo, Y. Nematic liquid crystal on a two dimensional hexagonal lattice and its application. Sci. Rep. 2015, 5, 13331. [Google Scholar] [CrossRef] [PubMed] [Green Version]
  2. Kim, D.W.; Kim, Y.H.; Jeong, H.S.; Jung, H.-T. Direct visualization of large-area graphene domains and boundaries by optical birefringency. Nat. Nanotechnol. 2012, 7, 29–34. [Google Scholar] [CrossRef] [PubMed]
  3. Yu, J.S.; Ha, D.H.; Kim, J.H. Mapping of the atomic lattice orientation of a graphite flake using macroscopic liquid crystal texture. Nanotechnology 2012, 23, 395704. [Google Scholar] [CrossRef] [PubMed]
  4. Lim, Y.J.; Lee, B.H.; Kwon, Y.R.; Choi, Y.E.; Murali, G.; Lee, J.H.; Nguyen, V.L.; Lee, Y.H.; Lee, S.H. Monitoring defects on monolayer graphene using nematic liquid crystals. Opt. Express 2015, 23, 14162–14167. [Google Scholar] [CrossRef]
  5. Basu, R.; Kinnamon, D.; Garvey, A. Graphene and liquid crystal mediated interactions. Liq. Cryst. 2016, 43, 2375–2390. [Google Scholar] [CrossRef]
  6. Basu, R.; Shalov, S. Graphene as transmissive electrodes and aligning layers for liquid-crystal-based electro-optic devices. Phys. Rev. E 2017, 96. [Google Scholar] [CrossRef] [Green Version]
  7. Basu, R.; Lee, A. Ion trapping by the graphene electrode in a graphene-ITO hybrid liquid crystal cell. Appl. Phys. Lett. 2017, 111. [Google Scholar] [CrossRef]
  8. Basu, R. Enhancement of polar anchoring strength in a graphene-nematic suspension and its effect on nematic electro-optic switching. Phys. Rev. E 2017, 96. [Google Scholar] [CrossRef] [Green Version]
  9. Basu, R.; Kinnamon, D.; Skaggs, N.; Womack, J. Faster in-plane switching and reduced rotational viscosity characteristics in a graphene-nematic suspension. J. Appl. Phys. 2016, 119. [Google Scholar] [CrossRef]
  10. Shehzad, M.A.; Hussain, S.; Lee, J.; Jung, J.; Lee, N.; Kim, G.; Seo, Y. Study of Grains and Boundaries of Molybdenum Diselenide and Tungsten Diselenide Using Liquid Crystal. Nano Lett. 2017, 17, 1474–1481. [Google Scholar] [CrossRef]
  11. Basu, R.; Atwood, L. Reduced ionic effect and accelerated electro-optic response in a 2D hexagonal boron nitride planar-alignment agent based liquid crystal device. Opt. Mater. Express 2019, 9, 1441–1449. [Google Scholar] [CrossRef]
  12. Basu, R.; Atwood, L. Two-dimensional hexagonal boron nitride nanosheet as the planar-alignment agent in a liquid crystal-based electro-optic device. Opt. Express 2019, 27, 282–292. [Google Scholar] [CrossRef] [PubMed] [Green Version]
  13. Basu, R. Enhancement of effective polar anchoring strength and accelerated electro-optic switching in a two-dimensional hexagonal boron nitride/polyimide hybrid liquid crystal device. Appl. Opt. 2019, 58, 6678–6683. [Google Scholar] [CrossRef] [PubMed]
  14. Li, L.H.; Chen, Y. Atomically Thin Boron Nitride: Unique Properties and Applications. Adv. Funct. Mater. 2016, 26, 2594–2608. [Google Scholar] [CrossRef] [Green Version]
  15. Lin, Y.; Connell, J.W. Advances in 2D boron nitride nanostructures: Nanosheets, nanoribbons, nanomeshes, and hybrids with graphene. Nanoscale 2012, 4, 6908–6939. [Google Scholar] [CrossRef] [PubMed]
  16. Bhimanapati, G.R.; Glavin, N.R.; Robinson, J.A. 2D Boron Nitride: Synthesis and Applications. Semicond. Semimet. 2016, 95, 101–147. [Google Scholar]
  17. Pakdel, A.; Zhi, C.; Bando, Y.; Golberg, D. Low-dimensional boron nitride nanomaterials. Mater. Today 2012, 15, 256–265. [Google Scholar] [CrossRef]
  18. Wang, X.; Zhi, C.; Weng, Q.; Bando, Y.; Golberg, D. Boron Nitride Nanosheets: Novel Syntheses and Applications in polymeric Composites. J. Phys. Conf. Ser. 2013, 471. [Google Scholar] [CrossRef] [Green Version]
  19. Baik, I.-S.; Jeon, S.Y.; Lee, S.H.; Park, K.A.; Jeong, S.H.; An, K.H.; Lee, Y.H. Electrical-field effect on carbon nanotubes in a twisted nematic liquid crystal cell. Appl. Phys. Lett. 2005, 87. [Google Scholar] [CrossRef] [Green Version]
  20. Park, K.A.; Lee, S.M.; Lee, S.H.; Lee, Y.H. Anchoring a Liquid Crystal Molecule on a Single-Walled Carbon Nanotube. J. Phys. Chem. C 2007, 111, 1620–1624. [Google Scholar] [CrossRef]
  21. De Gennes, P.G.; Prost, J. The Physics of Liquid Crystals, 2nd ed.; Oxford University Press: New York, NY, USA, 1995. [Google Scholar]
  22. Brown, P.A.; Fischer, S.A.; Kołacz, J.; Spillmann, C.; Gunlycke, D. Thermotropic liquid crystal (5CB) on two-dimensional materials. Phys. Rev. E 2019, 100. [Google Scholar] [CrossRef] [PubMed]
  23. Demus, D.; Goodby, J.; Gary, G.W.; Spiess, H.-W.; Vill, V. (Eds.) Physical Properties of Liquid Crystals, 2nd ed.; Wiley-VCH: Weinheim, Germany, 1999. [Google Scholar]
  24. Imai, M.; Naito, H.; Okuda, M.; Okuda, M.; Sugimura, A. Determination of Rotational Viscosity of Nematic Liquid Crystals from Transient Current: Numerical Analysis and Experiment. Jpn. J. Appl. Phys. 1994, 33, 3482–3487. [Google Scholar] [CrossRef]
  25. Imai, M.; Naito, H.; Okuda, M.; Sugimura, A. Determination of Rotational Viscosity and Pretilt Angle in Nematic Liquid Crystals from Transient Current: Influence of Ionic Conduction. Mol. Cryst. Liq. Cryst. Sci. Technol. Sect. A 1995, 259, 37–46. [Google Scholar] [CrossRef]
  26. Imai, M.; Naito, H.; Okuda, M.; Sugimura, A.A. Method for Determination of Rotational Viscosity and Pretilt Angle from Transient Current in Twisted Nematic Liquid Crystal Cells. Jpn. J. Appl. Phys. 1995, 34, 3170–3176. [Google Scholar] [CrossRef]
  27. Basu, R.; Garvey, A.; Kinnamon, D. Effects of graphene on electro-optic response and ion-transport in a nematic liquid crystal. J. Appl. Phys. 2015, 117. [Google Scholar] [CrossRef] [Green Version]
  28. Basu, R.; Garvey, A. Effects of ferroelectric nanoparticles on ion transport in a liquid crystal. Appl. Phys. Lett. 2014, 105. [Google Scholar] [CrossRef] [Green Version]
  29. Basu, R. Effects of graphene on electro-optic switching and spontaneous polarization of a ferroelectric liquid crystal. Appl. Phys. Lett. 2014, 105. [Google Scholar] [CrossRef] [Green Version]
  30. Yokoyama, H.; van Sprang, H.A. A novel method for determining the anchoring energy function at a nematic liquid crystal-wall interface from director distortions at high fields. J. Appl. Phys. 1985, 57, 4520–4526. [Google Scholar] [CrossRef]
  31. Lu, S.Y.; Chien, L.C. Carbon nanotube doped liquid crystal OCB cells: Physical and electro-optical properties. Opt. Express 2008, 16, 12777–12785. [Google Scholar] [CrossRef]
  32. Nie, X.; Lu, R.; Xianyu, H.; Wu, T.X.; Wu, S.T. Anchoring energy and cell gap effects on liquid crystal response time. J. Appl. Phys. 2007, 101. [Google Scholar] [CrossRef] [Green Version]
  33. Wu, S.T.; Wu, C.S. High-speed liquid-crystal modulators using transient nematic effect. J. Appl. Phys. 1989, 65, 527–532. [Google Scholar] [CrossRef]
  34. Wu, S.T.; Wu, C.S. Small angle relaxation of highly deformed nematic liquid crystals. Appl. Phys. Lett. 1988, 53, 1794–1796. [Google Scholar] [CrossRef]
Figure 1. Schematic illustrations of the h-BN—liquid crystal (LC) interaction: (a) The alignment of LC molecules on the h-BN lattice due to epitaxial interaction is illustrated by matching the LC’s benzene rings on the h-BN-honeycomb structure. (b) A schematic illustration of a pseudo-nematic domain (PND), where n ^ is the average director of the LC molecules on the h-BN flake. (c) The PND aligns with an external electric field E .
Crystals 10 00123 g001
Figure 2. (a) Dielectric constant ε as a function of applied RMS voltage (f = 1000 Hz) in the nematic phase (T = 40 °C) for the pure LC and LC+h-BN listed in the legend. (b) Dielectric components, ε and ε as a function of temperature for the pure LC and LC+h-BN listed in the legend. (c) Dielectric anisotropy Δε as a function of temperature for the pure LC and LC+h-BN listed in the legend. (d) A schematic illustration of the presence of PNDs in the nematic phase. (e) A schematic illustration of the reorientation of the PNDs with the nematic director in the application of an electric field E .
Crystals 10 00123 g002
Figure 3. (a) Dielectric constant ε as a function of applied rms voltage (f = 1000 Hz) in the isotropic phase (T > 60 °C) for the pure LC and LC+h-BN hybrid listed in the legend. (b) A schematic illustration of the orientation of the PNDs along E in the isotropic phase of the LC. (c) A schematic illustration of the random alignment of the PNDs in the isotropic phase of the LC in the absence of E .
Crystals 10 00123 g003
Figure 4. (a) Fréedericksz transition threshold voltage Vth, (b) splay elastic constant K11, and (c) bend elastic constant K33 as a function of temperature for the pure LC and LC+h-BN, listed in the legend.
Crystals 10 00123 g004
Figure 5. (a) Rotational viscosity, γ1 as a function of temperature for the pure LC and LC+h-BN, listed in the legend. Inset: Transient current, I(t) as a function of time for the pure LC and LC+h-BN at T = 25 °C. (b) The effective pretilt angle φo as a function of temperature for the pure LC and LC+h-BN, listed in the legend. Typical error bars are shown.
Crystals 10 00123 g005
Figure 6. (a) The left-hand y-axis represents the retardation R as a function of rms voltage (f = 1000 Hz) and the right-hand y-axis represents the capacitance as a function of the same rms voltage at T = 25 °C for the pure LC and LC+h-BN, listed in the legend. (b) R/R0 as a function of 1/CV for both the samples. The inset shows the extrapolated intersections with the axis of 1/CV = 0 for both the samples.
Crystals 10 00123 g006
Figure 7. Dynamics of electro-optic response in E7 filled test cells. The driving modulated square wave voltage profile with f = 30 Hz is shown on the right-hand y-axis. The left-hand y-axis represents the normalized transmitted intensity as a function of time as V is turned off (at t = 0) and then turned on (at t = 16.6 ms), for the two test cells, listed in the legend at T = 25 °C.
Crystals 10 00123 g007
Table 1. The measured LC parameters for the pure LC and LC+h-BN samples at 25 °C.
SamplesΔεVth
(V)
K11
(pN)
K33
(pN)
γ1 (mPa.S)φo
(degree)
Wθ
(J/m2)
E713.70.93710.215.61852.255.15 × 10-4
E7+h-BN14.60.91811.317.71601.409.70 × 10-4
Table 2. The two characteristic times for the pure LC and LC+h-BN samples measured from Figure 7.
Samplesτon (μs)τoff (ms)
E7520 2.40
E7+h-BN5001.90

