Article

Phase-Specific Strain Hardening and Load Partitioning of Cold Rolled Duplex Stainless Steel X2CrNiN23-4

1
Institute for Applied Materials (IAM-WK), Karlsruhe Institute of Technology (KIT), Engelbert-Arnold-Str. 4, 76131 Karlsruhe, Germany
2
Institute of Engineering Mechanics, Chair for Continuum Mechanics, Karlsruhe Institute of Technology (KIT), Kaiserstr. 10, 76131 Karlsruhe, Germany
*
Author to whom correspondence should be addressed.
Crystals 2020, 10(11), 976; https://doi.org/10.3390/cryst10110976
Submission received: 30 September 2020 / Revised: 19 October 2020 / Accepted: 22 October 2020 / Published: 27 October 2020
(This article belongs to the Special Issue Investigation of Duplex Stainless Steel)

Abstract

:
Multi-phase materials often times consist of constituents with high contrasts in phase-specific mechanical properties. Here, even after homogeneous plastic deformation phase-specific residual stresses develop that may affect the components behaviour in service. For numerical simulation of phase-specific residual stresses, knowledge of the particular phase-specific strain hardening behaviour is essential. In this study, the strain hardening of ferrite and austenite in cold rolled duplex stainless steel of type X2CrNiN23-4 is investigated. By means of X-ray diffraction, the phase-specific load partitioning and residual stress evolution are analysed for uniaxial load application in three directions within the sheets plane, taking into account the sheet metals phase specific anisotropy. In order to assess the necessity for experimental determination of anisotropic phase specific behaviour, the strain hardening parameters, derived from only one loading direction, are implemented in a mean-field approach for prediction of phase-specific stresses. A simplified simulation approach is applied that only considers macroscopic plastic anisotropy and results are compared to experimental findings. For all investigated loading directions, it was observed that austenite is the high-strength phase. This load partitioning behaviour was confirmed by the evolution of phase-specific residual stresses as a result of uniaxial elasto-plastic loading. With the simplified and fast numerical approach, satisfying results for prediction of anisotropic phase-specific (residual) stresses are obtained.

Graphical Abstract

1. Introduction

Duplex stainless steels are frequently used in chemical and mechanical engineering application due to their exceptional corrosion resistance, high yield strength and good formability. They consist of the two phases—ferrite and austenite—in high volume fractions. Thus, the macroscopic material response is a result of the combined properties of the individual phases. As the phase specific elastic and plastic material behaviour of the two constituents may differ significantly, considerable phase-specific micro residual stresses (RS) develop in addition to the macro RS during manufacturing of engineering components. It is well known that, apart from macro RS, micro RS may also influence the components lifetime if subjected to cyclic mechanical loading in service [1]. The reliable experimental analysis of phase-specific RS in multi-phase materials is therefore of substantial interest, considering that it enables targeted manufacturing processes regarding the formed residual stress distribution. With ever-increasing computational capabilities, the prediction of phase-specific RS is also feasible nowadays. The numerically efficient mean-field approaches have been proven to be especially well suited for the application on the integration point level during the simulation of structural components [2]. Precise knowledge about the contribution of different phases to the macromechanical behaviour, i.e., the phase-specific strain hardening, is essential for prediction of macro RS and phase-specific micro RS after plastic deformation. As the micromechanical behaviour of a single phase, bound in a heterogeneous material, depends on stress and strain coupling effects of the individual phases, it usually differs from the macromechanical behaviour of a single phase material with comparable chemical compositions. The utilisation of experimentally determined macromechanical data as micromechanical input could therefore lead to significant inaccuracies in the numerical results. However, duplex stainless steels, containing two phases of mostly equal volume fractions that possess different lattice structures, enable reliable experimental analysis of phase specific stresses via diffraction methods. Several authors have investigated the phase-specific mechanical properties and strain partitioning of duplex stainless steels via neutron diffraction, X-ray diffraction (XRD) and high-energy X-ray diffraction (HEXRD) methods, see, e.g., in [3,4,5]. Although these studies all considered austeno-ferritic steels of equal phase fractions and comparable chemical compositions, varying results were obtained concerning high-strength and low-strength phase and development of phase-specific RS. Apparently, yield strength and strain hardening behaviour of the individual phases are strongly affected by the material’s manufacturing history and the precise chemical composition of the individual phases. For example, nitrogen is known to be a strong austenite stabiliser and increases the phase-specific strength by interstitial solid solution strengthening [6]. Because the numerical simulation results depend crucially on the quality of the experimentally determined phase-specific data, reliable phase-specific strain hardening parameters for the particular alloy and material state are required. In Simon et al., elasto-plastic parameters from literature were used for a simplified methodology of the mean-field approach and calculation of the phase-specific RS distributions after deep drawing of duplex stainless steel sheet X2CrNiN23-4 [7]. Hofinger et al. extended the approach to a mean-field homogenisation for every time increment and integration point for a metal sheet forming process [2]. As the cold rolled metal sheet possesses a crystallographic texture, the aim is to now consider the anisotropic elasto-plastic micromechanical behaviour in the numerical simulation of sheet metal forming.
The purpose of this work is to determine the anisotropic phase-specific strain hardening behaviour of cold rolled duplex stainless steel sheet of type X2CrNiN23-4 (AISI S32304). The material consists of ferrite and austenite in equal volume fraction. Therefore, it is well suited for analysis of phase-specific residual stresses by means of diffraction methods. The initial material state is characterised by texture analyses using XRD and electron backscatter diffraction (EBSD), while EBSD is also applied to determine average grain sizes of both phases. The development of phase-specific stresses is analysed via XRD of stepwise uniaxially loaded tensile specimen, while the loading direction is varied with respect to the rolling direction of the sheet metal. Here, loading in rolling direction (RD), transverse to the rolling direction (TD) and in direction 45 to the rolling direction is considered. For distinct steps of increased loading in each of the loading experiments the surface-near stresses are determined in situ for both phases up to the applied strain of ε t = 10%. In between the loading steps the specimens are completely unloaded and phase-specific RS are determined for the unloaded state. From the evolution of integral breadths of the diffraction lines, the yield strength is found for all three directions. Additionally, the crystallographic textures are again analysed after plastic deformation, for discussion of texture evolution effects. From experimentally determined phase-specific yield points and load partitioning, strain hardening parameters are derived that can be implemented in numerical simulations for prediction of phase-specific RS. Here, a simplified anisotropic mean-field approach is proposed, considering the macroscopic plastic anisotropy, i.e., the Lankford parameters R, and experimentally determined phase specific strain hardening for only one loading direction, i.e., the TD. With the described mean-field approach the strain hardening for ferrite and austenite is subsequently predicted for uniaxial load application in the directions 45 and RD and compared to the experimental results.

2. Materials and Methods
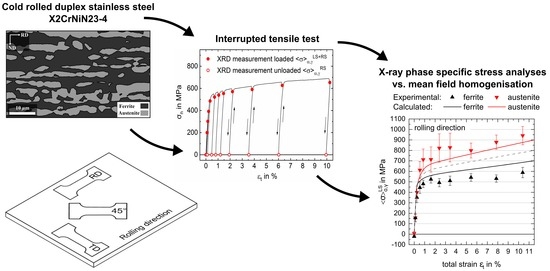
2.1. Material

For the experimental investigations, cold rolled sheet material of X2CrNiN23-4 of 1.5 mm thickness was used as received. The chemical composition, as determined by emission spectroscopy and melt extraction, is given in Table 1. Metallographic analysis revealed a phase fraction of 50% ferrite and austenite with elongated grain structures in rolling direction.
The phase-specific average grain size was analysed from EBSD mappings of the sheets plane section and cross section, see Figure 1. For ferrite, significantly larger average grain sizes (~13 μm) and a pronounced elongation in rolling direction (RD) were observed, whereas austenite shows smaller, rather spherically shaped grains (~4 μm). No further phases were detected.
The initial residual stress state was determined at the sheets surface and centre using XRD (subsequent to electrochemical polishing), according to the procedure described in Section 2.2. Only minor residual stresses ( | σ R S | < 30 MPa ) are present, thus the initial material state of such a high-strength steel can be considered as stress-free. The crystallographic texture of the cold rolled sheet material was analysed by means of XRD using a diffractometer of type Seifert XRD 3003 PTS with iron-filtered Co-K α radiation. As primary aperture, a pin hole collimator with a nominal diameter of 1 m m was used and a 4 m m slit on the secondary side in front of the scintillation counter. Incomplete pole figures (azimuthal angle range: 170 φ 170 ; polar angle range: 0 ψ 70 ) were measured from the normal direction (ND) (i.e., in the sheet plane) for both phases. Three suitable ferrite lattice planes ({220}-, {211}- and {200}) and three austenite lattice planes ({200}-, {220}- and {311}) were analysed. Using the open source Matlab toolbox MTEX, the complete orientation distribution function (ODF) was calculated, assuming orthorhombic specimen symmetry. As can be seen in Figure 2, typical rolling texture components for bcc- and fcc-structured materials were observed. The ferritic phase (bcc) shows components of the α -fibre with rotated cube {001}<110> as major component and a weakly pronounced γ -fibre. The austenitic phase (fcc) has texture components of brass {110}<211>, Goss {110}<001> and copper {112}<111>. Successive electrochemical polishing and repeated texture analysis on the newly generated surface revealed only a weak texture gradient in sheet thickness direction in the initial state.
From the analysed ODF and single-crystal elastic constants, the phase-specific stiffness tensors C i j k l α and C i j k l γ for the textured phases were determined according to the geometric mean of Voigt and Reuss bounds as proposed in [8]. Single-crystal elastic constants for ferrite and austenite are taken from literature, as given in Table 2. The three-dimensional distributions of phase-specific Young’s modulus E, calculated from C i j k l α , γ , are shown in Figure 3.

2.2. Experimental Methods

The phase-specific strain hardening behaviour was investigated for three directions in respect to the rolling direction of the sheet metal. Tensile test specimens were cut from the X2CrNiN23-4 sheet material according to geometry and orientation, as given in Figure 4. A miniature tensile/compression module DDS-2 from Kammrath & Weiss GmbH, Germany with an attached 10 k N loading cell was used for uniaxial load application of the three specimens. Total strain was measured with an axial extensometer of type EXA 10-1 from Sandner Messtechnik GmbH, Germany.
The load application was performed position controlled with a strain rate of about 0.0003 s 1 . For predefined load steps, the cross head of the miniature loading rig was held in position for 30 min , enabling stress and strain relaxations. Subsequently, phase-specific stress analyses were performed by means of XRD, first of the loaded state and thereafter of the completely unloaded state. This stepwise approach was repeated up to a total strain of about 10% for all three specimens. The procedure is schematically shown in Figure 5. From stress–strain recording of the interrupted tensile tests, the orientation-dependent macro strain hardening behaviour can be derived. X-ray diffraction analyses were performed on a θ -2 θ -diffractometer using V-filtered CrK α radiation. The primary beam was tailored using a pin hole aperture of 1 m m in diameter. In front of the detector, a 2 m m slit was used for the analysis of the {220}-austenite diffraction line, and a 4 m m symmetrisation slit was used for the {211}-ferrite diffraction line [11]. The interference lines were fitted using a Pearson VII function after background subtraction, K α 2 {220}-diffraction line was stripped via a double-peak fit. The measurement was performed for 15 tilt angles ψ equally distributed over sin 2 ψ . Due to shadowing effects of the tensile testing rig, the maximum polar angle ψ was limited to ± 45 . The average integral breadths (<IB>) of the X-ray interference lines were evaluated for scattering vectors close to the specimen surface normal, i.e., for | ψ | < 30 . Due to constant measurement point and unchanged measuring and evaluation parameters, an increase in phase-specific <IB> can be related to an increase of phase-specific degree of plastic deformation if significant changes in size of coherently scattering regions can be excluded [12].
Loading stresses (LS) and residual stresses (RS) were evaluated according to the sin 2 ψ -method for the stress component corresponding to the loading direction [13]. The X-ray elastic constants (XEC) were calculated following the approach proposed by Kneer for the self-consistent Eshelby–Kröner model (see, e.g., in [14,15,16]). By this means, for ferrite 1 2 s 2 { 211 } = 5.7006 × 10 6 MPa 1 and austenite 1 2 s 2 { 220 } = 5.9613 × 10 6 MPa 1 were calculated using single-crystal stiffness constants, given in Table 2. As reference values for the XRD line positions, i.e., the diffraction line positions for the unstressed crystal lattice, 2 θ 0 α { 211 } = 155.35 and 2 θ 0 γ { 220 } = 128.25 were considered. From slopes of 2 θ vs. sin 2 ψ distributions, the difference of stress components σ φ σ 33 α , γ is calculated according to Equation (1). Brackets denote the average over the volume of coherently scattering regions.
σ φ σ 33 α , γ = 1 2 tan θ 0 { h k l } 1 1 2 s 2 { h k l } 2 θ { h k l } sin 2 ψ
As σ 33 α , γ cannot be determined without knowledge of the precise lattice parameters for the stress-free condition a 0 α , γ , in this work σ 33 α , γ = 0 is assumed, which is justified due to the limited information depth of 5 μm for CrK α radiation in steel. The macro RS σ φ and phase-specific stresses of second kind σ φ I I α , γ are calculated from determined phase-specific stresses σ φ α , γ and the phase volume fraction c α , γ according to the following equations [17].
σ φ α , γ = σ φ + σ φ I I α , γ
σ φ = c α σ φ α + c γ σ φ γ , c α + c γ = 1
Subsequent to the final loading step of ε t = 10%, repeated texture analyses on the specimen surfaces were performed for all three specimens, as described in Section 2.1.

2.3. Numerical Methods

The methodology proposed by Hofinger et al. [2] is used for the numerical simulation. Fully anisotropic phase specific and effective stiffness tensors as described in Section 2.1 are used for the localization relations.
The plastic strain rates of the phases are given by
ε ˙ α , γ p = ε ˙ 0 α , γ p 3 2 σ α , γ · H α , γ [ σ α , γ ] σ α , γ F 1 σ α , γ F 2 m α , γ 3 2 H α , γ [ σ α , γ ] σ α , γ · H α , γ [ σ α , γ ]
with the anisotropy tensor H α , γ , flow stress σ F 1 α , γ and σ F 2 α , γ , stress exponent m α , γ and reference strain rate ε ˙ p 0 α , γ . Böhlke et al. [18] proposed a correlation of plastic and elastic anisotropies. In this work, the following form of the anisotropy tensor will be used,
H = P 2 + η α , γ A α , γ ,
where η α , γ is a calibration parameter which specifies the amount of plastic anisotropy described by the fourth-order texture coefficient A α , γ . Böhlke and Bertram [19] showed that the fourth-order texture coefficient results based on the orientation distribution function f α , γ ( g ) and the crystallographic basis D α , γ ( g ) as
A α , γ = 30 30 I I + 2 I s 5 g f α , γ ( g ) D α , γ ( g ) d g .
For numeric simplicity, σ F 1 α , γ is assumed to be zero, while the flow stress σ F 2 α , γ = σ F α , γ is modeled by a phenomenological Voce-type hardening approach
σ α , γ F = σ α , γ F 0 + ( σ α , γ F σ α , γ F 0 ) 1 exp Θ α , γ Θ α , γ 0 σ α , γ F σ α , γ F 0 ε α , γ eq + Θ α , γ ε α , γ eq ,
where the initial yield stress σ α , γ F 0 , the saturation stress σ α , γ F , the initial hardening modulus Θ α , γ 0 and the saturation hardening modulus Θ α , γ are introduced as material parameters.
Fitting a hardening curve to data from an uniaxial tensile test requires the computation of the flow stress σ F and the equivalent plastic strain ε p from the measured stresses and strains. A heterogeneous material complicates this computation as, even though the stress component in loading direction σ 11 has been measured locally, the other components are not known. However, the effective stress is uniaxial and therefore known from the local measurements:
σ ¯ 11 = 1 2 ( σ 11 α + σ 11 γ ) ,
with all other components being zero. The task at hand is to calculate the localised stress where the elastic stress localisation tensor B is known exactly for two-phase materials, but the inelastic stress localisation tensor b depends on the unknown plastic stresses. In lieu of an exact localisation, it is assumed that the inelastic stress localisation tensor has the same direction as the effective plastic strain. Given the measured local and global stress, only one localisation is consistent with this assumption:
σ α , γ = B [ σ ¯ ] + ( σ 11 , α , γ B [ σ ¯ ] 11 , α , γ ) N ( H ¯ [ σ ¯ ] ) ,
where N ( A ) = A / | | A | | denotes the direction of a second-order tensor. The flow stress is now calculated through local application of the Hill criterion. As the plastic strains cannot be directly measured, the Voigt-type approach ε α , γ = ε ¯ is chosen as a simple approximation to localise the total strains, resulting in
ε 11 , α , γ p = ε ¯ 11 ( C α , γ 1 [ σ α , γ ] ) 11 .
As only the stress component in loading direction σ 11 was experimentally determined, in this work it is assumed that the direction of local plastic strain always corresponds to the direction of local stress for calculation of the equivalent plastic strain, leading to
ε α , γ p = ε 11 , α , γ p N 11 ( H α , γ [ σ α , γ ] ) .
To facilitate a fit to the hardening curve, all points in the elastic regime are excised from the data. The hardening curves are fitted to the data points with a least-squares optimisation using the Levenberg–Marquardt algorithm.
In order to obtain the calibration parameter η α , γ , an optimisation problem is defined based on the experimentally characterised macroscopic plastic anisotropy. The anisotropy is characterised with the Lankford parameter R β , which is defined as the ratio of in-plane and out-of-plane logarithmic strains for a tensile test at 20% elongation, where β corresponds to the angle between tensile direction and rolling direction, as seen in Figure 4. The admissible domain for η α , γ is sampled in tensile test simulations and optimised with mean squared error
e = ( R 0 R 0 , sim ) 2 + ( R 45 R 45 , sim ) 2 + ( R 90 R 90 , sim ) 2 ,
with regards to the Lankford parameter values measured in [7].

3. Results and Discussion

3.1. Development of Crystallographic Texture

ODF 45 sections of ferrite and austenite phase, determined after the final plastic deformation, are depicted in Figure 6 and can be compared to the initial texture of the cold rolled sheet. Depending on the loading direction, different changes in crystallographic texture were observed for both phases. For the ferritic phase, the plastic deformation in RD and TD resulted in a stronger component of rotated cube texture, whereas the loading direction in 45 reduced this texture component as well as the whole α -fibre. The austenitic phase has a pronounced copper component, which is weakened after plastic deformation to ε = 10% in all three loading cases. The uniaxial loading in rolling direction however formed a 110<111>-texture component, and after loading in 45 direction a rather strong Goss orientation is developed. The austenite phase of the specimen subject to loading in TD developed only a weak texture. The total change in texture for all loading directions is rather small in respect to the initial texture index.

3.2. Evolution of Integral Breadths

Figure 7 shows the average integral breadths <IB> of the diffraction lines for ferrite and austenite vs. the nominal applied load σ n . Although negligible deviations from initial <IB> already exist for smaller loads, a significant increase in <IB> is observed for all three specimen orientations only for an applied load of approximately σ n = 480 MPa. Due to the limited number of loading steps, the accurate phase-specific anisotropic yield strength cannot be determined from evolution of <IB>. For the following numerical simulations it is therefore assumed that the yield point corresponds to the respective phase-specific stress σ α , γ L S , present at approximately σ n = 480 MPa.

3.3. Load Partitioning Behaviour

The load partitioning behaviour of the two constituents is analysed by means of XRD analysis for distinct steps of the uniaxially applied load σ n . In Figure 8, the distribution of normalised maximum intensities and the 2 θ h k l distribution are both plotted vs. sin 2 ψ for all investigated loading directions of ferrite and austenite, exemplary depicted for the applied load of σ n = 600 MPa. It is evident that, for measurement directions in RD and 45 , the diffraction line intensities vary strongly over the analysed ψ -range due to the initial crystallographic texture. However, the 2 θ - sin 2 ψ distributions reveal that only small deviations from linear dependency are present, which may be caused by elastic and plastic anisotropy effects. We therefore conclude that sin 2 ψ evaluation is accompanied by small errors and the approach for residual stress analysis is still justified. The errors in stress evaluation vary with loading direction due to the present crystallographic texture and are depicted as error bars for the evaluated stress values. As the transverse orientation is influenced less by texture based evaluation errors, the phase-specific strain hardening parameters, required for the mean-field simulation, are fitted to the experimental results from this direction.
In Figure 9, the evaluated phase-specific stresses under uniaxial loading σ α , γ L S are depicted vs. the applied total strain ε t for ferrite and austenite and all three specimen orientations. In the area that is expected to be purely elastic (approximately σ n < 350 MPa ), a linear increase of phase-specific stresses was observed. Here, no significant difference in the phase wise load response was determined. For a load application that exceeds the macro yield strength (~ 480 MPa ), increasing load partitioning is determined for all investigated directions. According to the XRD analysis of α -{211}- and γ -{220}-lattice planes, austenite shows a higher strength than ferrite. While for austenite pronounced strain hardening was observed, ferrite shows plastic yielding with only minor hardening for increased deformation. For the final applied strain of ε = 10% the phase-specific loads differ by about 200 MPa to 400 MPa depending on the observed direction. This is due to the significantly smaller average grain sizes of the austenitic phase compared to the ferrite grains. Furthermore, the nitrogen content of 0.13 weight % implies a significant solid solution strengthening effect of the austenitic phase [20].
The load partitioning behaviour is also evident in the evolution of phase-specific residual stresses. After unloading from the respective steps, the phase-specific micro-residual stresses that are developed due to the mismatch in yield strength and strain hardening still exist, see Figure 10. As the phase-specific stiffness parameters differ only slightly, the partitioning of phase-specific loads is nearly retained for the unloaded state. As expected from the experimental procedure, no macro-residual stress is developed for the homogeneously applied tensile stresses.

3.4. Numerical Results with Mean-Field Approach

The fitting process described in Section 2.3 is applied to the measurements carried out in TD direction. The onset of plastic deformation as indicated by the integral breadths of the X-ray diffraction lines is observed at an effective stress of approximately σ n = 480 MPa , which corresponds to local initial stresses of σ γ F 0 = 420 MPa for austenite and σ α F 0 = 380 MPa for ferrite. These are used as cut-off values for the elastic regime. To fit the plasticity parameter η α , γ , the Lankford parameters measured in [7] of R 0 = 0.60 , R 45 = 0.72 and R 90 = 0.80 are used. The plasticity parameters follow as outlined in Table 3.
Phase and effective stiffnesses are approximated using the geometric mean [8]. The measured texture data are used alongside literature data for austenite [10] and ferrite [9] single crystal stiffnesses as given in Table 2. In Figure 11, the fit to the data determined for TD can be seen on the right. A perfect fit is not achieved, owing to the microstructural assumptions detailed in Section 2.3: the localization of the total stress via a Voigt-type assumption, and the assumption that the direction of plastic strains always corresponds to the direction of stress both locally and on the effective scale. In the left and middle figures, the simulated predictions for the stress and strain evolutions in rolling and 45 direction can be seen, along with the measurements for those directions.
Although only the material’s macroscopic plastic anisotropy is considered, the load partitioning is in accordance with the experimental results for all three loading directions. Deviations between simulation and experimental results for RD and 45 direction of up to 150 MPa are partly due to the lower accuracy of experimental results for these directions. We conclude that the consideration of the Langford parameters combined with the experimentally determined phase-specific strain hardening of one direction in the sheets plane already enables a reasonable approach for simulation of phase-specific RS. A more accurate prediction of phase-specific RS, e.g., for complex metal sheet forming process, may be achieved with consideration of the complete data of anisotropic phase-specific strain hardening. However, such an approach is much more elaborate and would reduce the simulation’s speed significantly.

4. Conclusions

Cold rolled duplex stainless steel sheets X2CrNiN23-4 were uniaxially loaded in three directions with respect to the rolling direction, i.e., in RD, 45 direction and TD. XRD-analyses were performed to obtain the phase-specific strain hardening behaviour and development of residual stresses. From the experimental results of the TD load, phase-specific strain hardening parameters were derived and considered in a fast mean-field approach. Taking into account the macroscopic Lankford parameters R, the anisotropic strain hardening of direction 45 and RD was simulated for austenite and ferrite. From the experimental and numerical results, the following conclusions can be drawn.
  • For the material state examined in this work, only minor evolution of crystallographic texture was observed for the given plastic deformations, which justifies neglecting texture development in the simulation.
  • From the evolution of integral breadths of ferrite {211}- and austenite {220}-diffraction lines, it is concluded that only negligible differences in the phase-specific yield strengths exist.
  • The austenitic phase possesses higher strength compared to the ferritic phase for all investigated directions of load application, resulting in the evolution of phase-specific residual stresses even for homogeneous plastic deformation. This is due to the smaller grain size of austenite and the solid solution strengthening by nitrogen.
  • The proposed fast simulation approach based on phase specific strain hardening combined with macroscopic plastic anisotropy enables phase-specific RS simulation of satisfying accordance with experimental results. Deviations are caused in part by inaccuracies in the experimental approach, causing the neglecting of texture effects in the stress evaluation. Additionally, some deviations are due to the simplification of the phase specific plastic anisotropy approximated by the macroscopic Lankford parameters.
With the presented phase-specific anisotropic strain hardening parameters experimentally determined from the particular material state, a valuable set of phase-specific data is now provided for further validation of the application of mean-field approaches to the cold rolled duplex stainless steel sheet in particular.

Author Contributions

Conceptualisation, N.S.; methodology, N.S., M.K. and H.E.; software, M.K. and H.E.; validation, N.S. and P.H.; formal analysis, N.S.; investigation, N.S. and P.H.; resources, J.G. and T.B.; data curation, N.S. and M.K.; writing—original draft preparation, N.S.; writing—review and editing, M.K., H.E., J.G. and T.B.; visualisation, N.S.; supervision, J.G. and T.B.; project administration, J.G. and T.B.; funding acquisition, J.G. and T.B. All authors have read and agreed to the published version of the manuscript.

Funding

This research was funded by the German Research Foundation (DFG) within the Priority Programme SPP2013 “Targeted Use of Forming Induced Residual Stresses in Metal Components” (Gi 376/13-2, Bo 1466/14-2). The support by the German Research Foundation (DFG) is gratefully acknowledged. Furthermore, we acknowledge support by the KIT-Publication Fund of the Karlsruhe Institute of Technology.

Acknowledgments

Erich Müller of Laboratory for Electron Microscopy (LEM) is gracefully acknowledged for performing the investigation by means of electron backscatter diffraction.

Conflicts of Interest

The authors declare no conflict of interest.

Abbreviations

The following abbreviations are used in this manuscript:
MDPIMultidisciplinary Digital Publishing Institute
XRDX-ray diffraction
EBSDElectron backscatter diffraction
ODFOrientation density function
XECX-ray elastic constants
fccface-centred cubic
bccbody-centred cubic
RSresidual stress
LSloading stress
RD/TD/NDrolling/transverse/normal direction

References

  1. Behnken, H.; Hauk, V. On the influence of micro-residual stresses during cyclic loading. In Proceedings of the 3rd European Conference on Residual Stresses, Frankfurt, Germany, 4–6 November 1992; pp. 733–742. [Google Scholar]
  2. Hofinger, J.; Erdle, H.; Böhlke, T. Prediction of residual stresses of second kind in deep drawing using an incremental two-scale material model. Philos. Mag. 2020, 1–21. [Google Scholar] [CrossRef]
  3. Johansson, J.; Oden, M.; Zeng, X.H. Evolution of the residual stress state in a duplex stainless steel during loading. Acta Mater. 1999, 47, 2669–2684. [Google Scholar] [CrossRef]
  4. Inal, K.; Lebrun, J.; Belassel, M. Second-order stresses and strains in heterogeneous steels: Self-consistent modeling and X-ray diffraction analysis. Metall. Mater. Trans. A 2004, 35, 2361–2369. [Google Scholar] [CrossRef]
  5. Dakhlaoui, R.; Braham, C.; Baczmański, A. Mechanical properties of phases in austeno-ferritic duplex stainless steel—Surface stresses studied by X-ray diffraction. Mater. Sci. Eng. A 2007, 444, 6–17. [Google Scholar] [CrossRef]
  6. Tseng, C.M.; Liou, H.Y.; Tsai, W.T. The influence of nitrogen content on corrosion fatigue crack growth behavior of duplex stainless steel. Mater. Sci. Eng. A 2003, 344, 190–200. [Google Scholar] [CrossRef]
  7. Simon, N.; Erdle, H.; Walzer, S.; Gibmeier, J.; Böhlke, T.; Liewald, M. Phase-specific residual stresses induced by deep drawing of lean duplex steel: Measurement vs. simulation. Prod. Eng. 2019, 13, 227–237. [Google Scholar] [CrossRef]
  8. Matthies, S.; Humbert, M. On the principle of a geometric mean of even-rank symmetric tensors for textured polycrystals. J. Appl. Crystallogr. 1995, 28, 254–266. [Google Scholar] [CrossRef]
  9. Every, A.; Mccurdy, A. Landolt-Börnstein—Group III Condensed Matter, Second and Higher Order Elastic Constants; Springer: Berlin/Heidelberg, Germany, 1992. [Google Scholar] [CrossRef]
  10. Ledbetter, H. Predicted monocrystal elastic constants of 304-type stainless steel. Phys. B+ C 1985, 128, 1–4. [Google Scholar] [CrossRef]
  11. Wolfstieg, U. Die Symmetrisierung unsymmetrischer Interferenzlinien mit Hilfe von Spezialblenden. HTM 1976, 31, 23. (In German) [Google Scholar]
  12. Warren, B.; Averbach, B. The effect of cold-work distortion on x-ray patterns: Jour. Appl. Phys. 1950, 21, 595–599. [Google Scholar] [CrossRef]
  13. Hauk, V.; Macherauch, E. Eigenspannungen und Lastspannungen; Hauk, V., Macherauch, E., Eds.; Carl Hanser Verlag: München, Germany, 1982. (In German) [Google Scholar]
  14. Kneer, G. Zur Elastizität Vielkristalliner Aggregate Mit und Ohne Textur. Ph.D. Thesis, Bergakademie Clausthal (TH), Clausthal-Zellerfeld, Germany, 1964. (In German). [Google Scholar]
  15. Kröner, E. Berechnung der elastischen Konstanten des Vielkristalls aus den Konstanten des Einkristalls. Z. Phys. 1958, 151, 504–518. [Google Scholar] [CrossRef]
  16. Eshelby, J.D. The determination of the elastic field of an ellipsoidal inclusion, and related problems. Proc. R. Soc. Lond. Ser. A Math. Phys. Sci. 1957, 241, 376–396. [Google Scholar] [CrossRef]
  17. Hauk, V.; Nikolin, H.J. The evaluation of the distribution of residual stresses of the I. kind (RS I) and of the II. kind (RS II) in textured materials. Textures Microstruct. 1988, 8, 693–716. [Google Scholar] [CrossRef] [Green Version]
  18. Böhlke, T.; Bertram, A.; Krempl, E. Modeling of deformation induced anisotropy in free-end torsion. Int. J. Plast. 2003, 19, 1867–1884. [Google Scholar] [CrossRef] [Green Version]
  19. Bertram, A.; Böhlke, T. Simulation of texture induced elastic anisotropy of polycrystalline copper. Comput. Mater. Sci. 1999, 16, 2–9. [Google Scholar] [CrossRef]
  20. Foct, J.; Akdut, N. Cleavage-like fracture of austenite in duplex stainless steel. Scr. Metall. Mater. 1993, 29, 153. [Google Scholar] [CrossRef]
Figure 1. Electron backscatter diffraction (EBSD) phase index maps (top) and orientation maps of ferrite (centre) and austenite (bottom) for plane section (left) and cross section (right).
Crystals 10 00976 g001
Figure 2. {100}-, {110}-, {111}-pole figures for ferrite and austenite recalculated from the orientation distribution functions (ODFs) (from XRD surface texture analysis). (a) Ferrite and (b) austenite.
Crystals 10 00976 g002
Figure 3. Young’s modulus distribution E of the textured phases. (a) Ferrite and (b) austenite.
Crystals 10 00976 g003
Figure 4. Specimen dimensions and orientations in respect to the sheet rolling direction.
Crystals 10 00976 g004
Figure 5. Loading and unloading scheme for XRD analysis of phase-specific stress development (LS = loading stress; RS = residual stress).
Crystals 10 00976 g005
Figure 6. ODF sections φ 2 = 45 for initial state and after applied plastic strain of ε p = 10% in different orientations for ferrite phase (top) and austenite phase (bottom).
Crystals 10 00976 g006
Figure 7. Evolution of integral breadths of the ferrite and austenite X-ray diffraction lines vs. the applied stress σ n in rolling direction (left), 45 direction (center) and transverse direction (right).
Crystals 10 00976 g007
Figure 8. Diffraction line positions 2 θ h k l and peak intensity distribution vs. sin 2 ψ for loading state of σ n = 600 MPa in RD (left), 45 (center) and TD (right) of the ferrite phase (top) and the austenite phase (bottom).
Crystals 10 00976 g008
Figure 9. Evolution of the phase-specific loading stress (LS) for uniaxial loading in rolling direction RD (left), 45 direction (centre) and transverse direction TD (right).
Crystals 10 00976 g009
Figure 10. Evolution of phase-specific residual stress after loading in rolling direction RD (left), 45 direction (centre) and transverse direction TD (right).
Crystals 10 00976 g010
Figure 11. Comparison of calculated (lines) and experimental (symbols) results: Fitted strain hardening of transverse direction (right) and simulated strain hardening for uniaxial loading in rolling direction (left) and 45 direction (center).
Crystals 10 00976 g011
Table 1. Chemical composition of X2CrNiN23-4 in weight %.
CCrNiMnCoSiMoNFe
0.03423.914.741.3260.1040.380.370.13balance
Table 2. Single-crystal elastic constants.
Phase C 11 C 12 C 44
Ferrite [9]230 GPa134 GPa117 GPa
Austenite [10]209 GPa133 GPa121 GPa
Table 3. Material parameters derived from measurements orthogonal to the rolling direction RD.
σ α , γ F 0 σ α , γ F Θ α , γ 0 Θ α , γ η α , γ
Austenite420 M Pa 640 M Pa 70.7 G Pa 3490 M Pa 3.0
Ferrite380 M Pa 427 M Pa 4.81 G Pa 21 M Pa −5.5
Publisher’s Note: MDPI stays neutral with regard to jurisdictional claims in published maps and institutional affiliations.

