Article

Modeling Study of EMBr Effects on the Detrimental Dynamic Distortion Phenomenon in a Funnel Thin Slab Mold

by
Saul Garcia-Hernandez
1,*,
Carlos Humberto Gonzalez-Guzman
2,
Rodolfo Morales Davila
3,4,
Jose de Jesus Barreto
1,
Enif Gutierrez
1 and
Ismael Calderon-Ramos
5
1
TecNM–Instituto Tecnologico de Morelia, Metallurgy Graduate Center, Av. Tecnológico No. 1500, Morelia, Michoacán, C.P. 58120, Mexico
2
TecNM-Instituto Tecnologico de Morelia, Metallurgy Graduate Centre, Av. Tecnologico No. 1500, Morelia, Michoacan, C.P. 58120, Mexico
3
Department of Metallurgy and Materials Engineering, Instituto Politecnico Nacional-ESIQIE, Ed. 7, Col. Zacatenco, Mexico City, C.P. 07738, Mexico
4
K & E Technologies, Manizales 88, Residencial Zacatenco, Del. Gustavo A. Madero, CDMX, C.P. 07369, Mexico
5
Mechanical Engineering Department, UAdeC/F.I.M.E.-U.N., Barranquilla S/N, Monclova, Coahuila, C.P. 25280, Mexico
*
Author to whom correspondence should be addressed.
Crystals 2020, 10(11), 958; https://doi.org/10.3390/cryst10110958
Submission received: 2 October 2020 / Revised: 15 October 2020 / Accepted: 19 October 2020 / Published: 22 October 2020
(This article belongs to the Special Issue Liquid Steel Alloying Process)

Abstract

:
The turbulent phenomena occurring in the thin slab mold affect the final product quality. Therefore, it is essential to carry out studies to understand and control their occurrence. Current research aims to study the electromagnetic brake (EMBr) effects on the flow patterns in a funnel thin slab mold. The objective is to prevent the detrimental phenomenon known as dynamic distortions (DD) of the flow, applying the EMBr in the typical horizontal position (H-EMBr) and a new vertical position close to the narrow faces (V-EMBr). The fluid dynamics are simulated using the Reynolds stress model (RSM), the Volume of Fluid (VOF) model and the Maxwell equations in their magnetohydrodynamics (MHD) simplification. The results show that the H-EMBr effectively counteracts the DD phenomenon by reducing the submerged entry nozzle (SEN) ports' mass flow rate differences. The EMBr reduces the highest meniscus fluctuations from −10 to ±3 mm with a field intensity of 0.1T and almost 0 mm for higher field intensities. In contrast, the V-EMBr configuration does not reduce or control at all the DD phenomenon, even though eliminating the upper roll flows does not diminish the meniscus fluctuation amplitudes and induces new small roll flows close to the SEN's wall.

1. Introduction

The thin slab casting process is an example of the technological improvements in steel production; nevertheless, due to its high casting velocities and the small slab thickness, the liquid steel inside produces complex turbulent phenomena adversely affecting the final product quality. On this line, many researchers have focused their efforts on studying these turbulent phenomena, searching for a deeper understanding of how to control or eradicate them [1,2,3,4,5,6,7,8,9,10,11,12,13,14,15,16,17,18,19]. Some of the most commonly observed phenomena are asymmetries and oscillations of the flow patterns inside the mold, identified through mathematical simulations [2,4,5,7,10,11,14,15,16,17,18,19] or by physical modeling [6,9,10,11,12,13,15,16,17], formation of strong recirculation at each SEN side [7,8,9,10,11,12,13,14,15,16,17,18,19], meniscus fluctuations [8,9,10,11,12,13,14,15,16,17,19], meniscus vortex formation [10,11,12,17,18,19], among other flow features. In this context, there is a great deal of detailed research about the stability of the meniscus [8,9,11,12,13,15,16,17,19], the heat transfer and steel solidification affected by the flow patterns [7,8,14] and the jet oscillation frequency [2,3,4,5,6,9,10,11,12,13,18,19]. These works proposed and applied modifications to the process variables trying to control the turbulence intensity; the changes focus on the casting velocities [10,11,13,17,18], SEN immersion [10,11,13,16,17,18], the mold shape and dimensions [6,14,15] and the geometry of the SEN [6,8,11,12,14,15,16,18]. Solutes in liquid steel, like aluminum, react with oxygen when the bath is exposed to the atmosphere due to the flux opening, originating from the turbulence in the meniscus area. Therefore, the reaction of oxygen with aluminum and other solutes leads to metallic oxides' precipitation impairing the steel cleanliness. One of the available technologies to control the turbulence is the electromagnetic brake, which is outlined in the next paragraph.
Despite all these contributions, steel production processes continue to require improvements since the mentioned complex phenomena have not been fully understood and controlled. Subsequently, additional technology options are available due to their effectiveness despite the high costs, such as the electromagnetic brake (EMBr). The EMBr has been employed as flow control in the conventional slab mold since around the 1980s, evolving under steelmakers’ needs. The first research works used local-EMBr [20,21,22,23,24] positioned at the mold's broad faces to control strategic flow regions. Later arose the single [25,26] and double [27,28,29,30,31] longitudinal-EMBr, positioned again at the broad faces of the mold but covering horizontal sections from one narrow mold face to another, located below the SEN tip and below the meniscus. Trying to reduce costs and make more efficient the EMBr application, there recently emerged a new tendency to change the EMBr position from horizontal to vertical. This new application is close to the narrow mold faces. It is called vertical-EMBr [32,33], which has been applied even jointly with the longitudinal-EMBr [34], yielding excellent metallurgical results in conventional slab molds. Because of the successful results in conventional casters, this technology is applied in thin slab molds. This technology looks to countering the high turbulence levels reported in these mold types to cast steel with higher casting velocities, keeping the current quality of the final products. In this important and relatively new area, the current research works, using the longitudinal-EMBr type, are focused on the reduction of the vortex formation at the meniscus [35,36], the decrease of the meniscus fluctuation [35,36,37,38,39], the steel solidification improvement and better temperature distribution in the mold [37,38]. Their main contributions are as follows: the meniscus velocities decrease as the electromagnetic field intensity increases, reduction of the height of meniscus fluctuations [35,36,37,40], suppression of the vortexes at the meniscus [36,37] and the upper and lower roll flows reduce its intensity as a consequence of the jet brake [35,36,41]. The shell growth shows a slight improvement, with a higher thickness at the mold end [37].
Therefore, the present research work aims to study the electromagnetic brake effects on the flow patterns in a funnel thin slab mold and control or eliminate the detrimental phenomenon known as dynamic distortions. This control is achieved through applying the EMBr technology in the typical horizontal position and testing the newest vertical position of the EMBr close to the narrow faces due to the claimed benefits reported by conventional slab molds.

2. Experimental Procedure

Physical modeling uses a full-scale thin slab mold model built of 12 mm acrylic plates. Once the bath level reaches the operational level, the water flow rate decreases to the steady-state operating conditions. It was kept constant for ten minutes to achieve steady-state conditions. The water flow rate was equivalent to working with a 6 m/min casting speed. The red dye was injected at the SEN entry to observe the mold's fluid dynamics, using a conventional video camera located just in front of the physical model. Figure 1 shows the funnel thin slab mold, the SEN's geometries and dimensions and a general physical model view.

3. Mathematical Model

The mathematical model was based on the unsteady Reynolds stress model (URSM) to simulate the fluid dynamics inside the mold, together with the volume of fluid (VOF) model to track the steel–air interface. The user-defined facilities provided in ANSYS Fluent® (version 16.2.0, ANSYS Inc., Pennsylvania, PA, USA) helped to introduce the Maxwell equations in their magnetohydrodynamics (MHD) simplification. The equations were solved in the ANSYS Fluent software following the next assumptions and considerations.

3.1. Main Assumptions and Considerations

The fluid flowing is considered to have Newtonian behavior under isothermal and unsteady-state conditions. The governing equations were discretized and solved by the computational segregated-iterative method [42,43]. The non-linear governing equations were linearized using the implicit approach, combined with the implicit VOF model, to define sharp interfaces. A compressive scheme of discretization was performed using the compressive scheme. The pressure interpolation uses the body force weighted scheme for the pressure interpolation. The algorithm used for the pressure-velocity coupling was the SIMPLEC [43]. The momentum transfer equations were discretized using a second-order upwind scheme. The gradients of the flow variables at the finite volume faces were calculated by determining the corresponding magnitudes at the cell center through the procedure of cell-based derivative evaluation [44,45]. Boundary conditions include no-slip velocity at all solid surfaces and log-law approaches to link the mesh in the boundary layer with the bulk flow [42,45,46].
A pressure inlet condition was applied at the mold top ( P = 101325   P a ) to simulate a system's effects open to the atmosphere. An air zone above the bath had 100 mm to simulate the steel–air interface with a surface tension of 1.6   N / m . The inlet and outlet velocities were calculated based on the volumetric flow for a 6   m / m i n casting speed. The mold's molten steel was assumed to have constant physical properties such as the density of 7100   k g / m 3 , a viscosity of 0.0064   P a   s , electrical conductivity of 7.14 × 10⁵   1 / Ω   m and a magnetic conductivity of 1.26 × 10 6   H / m . The tested external DC magnetic fields included constant current densities of 0.1 , 0.2 , 0.3 , 0.4 and 0.5   T . Horizontal (H-EMBr) and vertical (V-EMBr) magnetic field arrangements were considered to simulate the electromagnetic brakes’ effects. The first arrangement was in the mold’s broad face, just below the SEN tip, and the second one is close to the narrow mold faces. The field intensities’ choice is based on the most widely used EMBr technology range, as various researchers reported. All walls work as conductors, except the SEN walls. The subdivision of the domain is through an unstructured mesh consisting of around 1 , 500 , 000 cells.
The mathematical model was run for 240 seconds, assuming the attainment of a steady state at this time. The convergence criterion is when the output variables’ residuals reach values equal to or smaller than 1 × 10 4 . The general boundary conditions for the mathematical model, the EMBr positions and the mesh view are shown in Figure 2.

3.2. Reynolds Stress Model (RSM)

The RSM [46,47] solves a complete set of transport equations directly for the Reynolds stresses given by
D ¯ D ¯ t u i u j + x k T i j k = i j + R i j ε i j
The mean flow variables like u i u j and ε i j are directly simulated. However, the Reynolds stress transport tensor, T i j k , the pressure rate of the stress tensor, R i j , and the stress dissipation rate tensor, ε i j , should be modeled at each computing time step. To model T i j k , the equations model of Daly and Harlow was employed [48], and the pressure rate-of-strain tensor R i j was calculated using the isotropization of production (LRR-IP) model [49]. Balance of the dissipation rate of the turbulent kinetic energy is given by
ε t + U · ε = x i C ε k ε u i u j ε x j + C ε 1 ε k C ε 2 ε 2 k
with C ε = 0.15 , C ε 1 = 1.44 and C ε 2 = 1.92 . The term is the production rate of the dissipation rate of kinetic energy and it is calculated directly from the Reynolds stresses rather than from 2 ν T S ¯ i j S ¯ i j , the scalar product of the averaged deformation rates, as is done in the k-ε model [42]. The turbulent kinetic energy calculated through the trace of the Reynolds stresses matrix is as follows:
k = 1 2 u i u i
Using the dissipation rate of kinetic energy, ε, and the turbulent kinetic energy, k [42,46], through Equation (4), the dissipation rate of Reynolds stresses was calculated:
ε i j = 2 3 δ i j ρ m i x ε

3.3. Volume of Fluid Model

The VOF model is suitable for modeling the multiphase system of steel–air [47,50,51]. The model introduces a VOF function α to define the fluid region. The unit value of α corresponds to a cell full of molten steel, while a zero value indicates that a cell contains no steel. Cells with α value between zero and unity must then contain the free surface.
To minimize the effects of the inaccurate interpolation for some physical quantities, the model needs equations accounting for density and viscosity variation. The physical properties of phases in the mixture are given by
μ m i x = ρ i α i
μ m i x = μ i α i ,
where α i is the volume fraction of phase “i”, μ i is viscosity and ρ i is density.
The continuity equation is
1 ρ q ρ q α q t + U i · ρ q α q x i = p = 1 N ( m ˙ p q m ˙ q p ) ,
where m ˙ p q and m ˙ q p \ are the mass transfer rates from phase “ q ” to phase “ p ” and from phase “ p ” to phase “ q ” for the N phases existing in the system; there is one continuity equation for each phase. In the VOF model, only one set of momentum transfer equations is necessary for the N phases, expressed as
ρ m i x U i t + x i ρ m i x U i U j = P x i + x i μ e f f U i x j + U j x i ρ m i x u i u j x i + ρ m i x g i   + F V s ,
where µeff is the effective dynamic viscosity and µt is the turbulent viscosity, given by
μ e f f = μ m i x + μ t σ k ,
μ t = ρ m i x C μ k 2 ε ,
where σ k = 0.82 , C μ = 0.09 ; the third term in the right-hand side of Equation (8) corresponds to the momentum of the Reynolds stresses. The last term in Equation (8) is a force originating from the interfacial tensions of the three interfaces. This superficial force transforms into a volume force through the divergence theorem, giving as a result following expression:
F V s = p a i r s   i j ,   i < j 3 σ i j α i ρ i κ j α j + α j ρ j κ i α i 1 2 ρ i + ρ j ,
where σ i j is the interfacial tension among phases “i” and “j” and κ i , κ j are their bending radiuses. The interfacial tensions were calculated through the equation
σ w o = σ w 2 + σ 0 2 2 σ w σ o cos θ 1 / 2 ,

3.4. MHD Model

To study the effects of electromagnetic fields on steel flow requires the estimation of the Lorentz forces [52]. This is possible through the use of the Maxwell equations. However, to use them in a more simplified approach, it is recommended to follow the so-called magnetohydrodynamics approach (MHD) [53]. Therefore, the Maxwell equations in their simplified form are as follows:
× E = B t ,
× H = J
· J = 0
· B = 0
where H is the magnetic field ( A / m ), E is the electric field ( V / m ), B is the magnetic flux density ( T ), and j the conduction current density ( A / m 2 ). Moreover, for a moving fluid, Ohm’s law takes the following form [54]:
J = σ e E + u × B ,
The term σ e is the electric conductivity in S / m .
The body force, F b , due to the electromagnetic force field, is given by
F b = J × B ,
This force is the coupling element of the magnetic field with the equations of continuity and momentum transfer.

4. Results

4.1. Model Validation

The validation of results from the mathematical simulation is essential in this work. This validation has two stages: first, the mathematical results without the EMBr effects were contrasted qualitatively against those obtained from the physical modeling; second, the MHD model employed in this research was validated through modeling the classical one-dimensional MHD Couette flow [25,55].
The comparison between physical and mathematical results was by video images of a tracer injection at different instants against velocity contours and velocity vector fields at the central symmetrical plane of the mold, as shown in Figure 3. The numerical results show an asymmetrical flow pattern inside the mold due to irregular entry jet behavior. These aspects can be observed primarily by the indicated differences in points 1 and 2 in Figure 3a,b, where it is clear that the jets' penetration is different. In contrast, the left jet penetrates deeply, and the right changes its tendency upwards before the mold end. This flow pattern induces asymmetrical upper roll flows, the left one being larger than the right one. This flow means that the right upper roll steel flow reaches the meniscus faster, arriving at the right port’s upper side before the left flow from the opposite upper roll flow (see point 3). After these observations, the physical modeling results are analyzed through the video images, see Figure 3c,f, where it is evident the qualitative agreement between both model results, allowing us to establish that the mathematical model is considered valid.
The validation of the MHD model, employed in this research, is presented in previously published works by the current authors [25,55], using the classical one-dimensional MHD Couette flow due to its simplicity, allowing easy comparison with the numerical calculations. The results of the numerical solution of this flow agree very well with the provided analytical solution, as was demonstrated [25,55]. Therefore, the verified mathematical model can be used in the present research work to simulate the steel flow in a thin slab mold under EMBr effects.

4.2. Fluid Dynamics Analysis without EMBr Effects

Before starting the analysis of the EMBr effects on the steel flow behavior, it is necessary to remark on the most common and essential phenomena taking place in this mold type.
The first phenomenon to be studied is the meniscus fluctuation due to its importance and impact on steel solidification behavior. Therefore, the meniscus fluctuation was quantified along a line located at the meniscus center (Figure 4a) when the simulation reaches steady-state conditions (see Figure 4b). The results show meniscus fluctuations of ± 4   mm , where the positive sign indicates that the meniscus elevates over its fixed position, and the negative sign represents the opposite. It is essential to point out that these maximum values were observed close to the narrow mold wall and close to the beginning of the funnel mold shape. The meniscus fluctuation seems not to be very high; however, this calculation represents only one moment of the simulation time. Therefore, for a better analysis, the meniscus fluctuations were stored for sixty seconds, considering four positions in the meniscus (see Figure 4c): two are close to the narrow mold walls, and the other two are at the beginning of the mold funnel. Figure 4d shows the results, where it is evident that the magnitude of the meniscus fluctuation changes over time, reaching extreme values of 10   mm and around + 2   mm . These strong fluctuations indicate detrimental phenomena inside the mold. Therefore, a fluid dynamic analysis of the flow patterns is mandatory since in this type of mold, the dynamic distortions (DD) phenomenon occurs very often. The DD is defined as a periodic alteration of the flow at large scales due to the instantaneous imbalance of the turbulent kinetic energy, resulting in high fluctuations in the meniscus level [10,11]. This phenomenon strongly affects the meniscus stability. For developing such analysis, velocity vector fields were acquired every ten seconds during a simulation period of sixty seconds; see Figure 5. The figure shows the presence of the DD phenomenon since the structure of the jets oscillates many times during the analyzed period. The deformations of the jets identify these oscillations, which originated from a sequence of lower recirculations moving upwards between the jets and ended its trajectory at the SEN tip (Figure 5a—point 1). The recirculation sizes are continuously changing with random ascending motion, but always by one side at a time in a cascade pattern.
Subsequently, when one of these recirculations is significant, it deforms the jet trajectory, pushing it towards the narrow face (Figure 5d—point 2). The steel coming from this jet moves quickly towards the meniscus and reduces the corresponding upper roll flow size (Figure 5d—point 3). While the latter phenomenon is occurring, the other jet behavior remains almost constant. Its corresponding upper roll flow remains large (Figure 5d—point 4), implying that the steel traveling through this side moves slowly towards the meniscus. Once the mentioned effects of the lower recirculation finish, another starts but at the opposite jet, inducing a whole cycle and developing the well-known DD phenomenon. It is important to remark that there are moments when the DD phenomenon allows both jets to penetrate profoundly and have large upper roll flows, generating good symmetry in the whole mold patterns (see Figure 5c,f). As a consequence of the DD phenomenon’s periodicity, the steel fed to the meniscus is not regular; hence, when the DD phenomenon occurs, one of the meniscus sides always obtains more liquid steel than the other, inducing strong meniscus fluctuations. Figure 4d shows that when the DD phenomenon is weak or is not occurring, the meniscus fluctuations present low magnitudes.
Accordingly, it can be said that the presence of the DD phenomenon in funnel thin slab molds strongly affects the meniscus stability since it induces intense meniscus fluctuations. Therefore, the electromagnetic brakes have proven to be an excellent and powerful tool to control turbulent phenomena in conventional slab molds. In the next section of the present research work, this technology is used to attempt the control or elimination of these harmful phenomena.

4.3. Analysis of the EMBr Effects on the Mold Flow Patterns

Two types of EMBr are considered: firstly, positioning longitudinally in the mold below the SEN tip, which has demonstrated excellent results in previously published works [34,35,38,40,41]. The second is a novel EMBr position located vertically close to the narrow mold walls, showing promising results during its application in conventional molds [32,33,34] and representing a new opportunity for turbulence control and meniscus stability with lower EMBr intensities.
The analysis starts considering the horizontal EMBr position (H-EMBr) located below the SEN tip using five field intensities (0.1, 0.2, 0.3, 0.4 and 0.5 T); Figure 6 shows the effects on the fluid dynamics of the mold. It is essential to point out that each H-EMBr simulation used as a starting point the steady-state mentioned in Section 4.2, and subsequently, the simulation using the EMBr ran for another 300 seconds. Figure 6a shows the flow patterns without EMBr, and they are employed as a reference point to contrast the effects of the different EMBr intensities on the fluid flow. Figure 6b,f show the results at the second 540 of the total simulation for each case. Figure 6b shows the results of applying an electromagnetic field of 0.1 T; this H-EMBr magnitude immediately brakes the turbulence intensity, observed by the reduction in the bulk flow velocity. Besides this, the sizes and velocities of the lower recirculations are markedly reduced (Figure 6b—point 1), allowing deeper penetration of the entry jets. This condition induces longer upper roll flows with smaller velocities (Figure 6b—point 2) due to the second brake that suffers the steel flow moving upwards near the narrow mold faces, which are the ones which feed these rotating flows. Despite this slowing down of the whole flow velocity, the flow asymmetry remains since the ascending stream close to the narrow face, at the left mold side, moves faster than the one at the right mold side. Figure 6c shows the effects of a 0.2 T field intensity on the fluid flow, where it is evident that the DD phenomenon has been eliminated. The cascade effect of the lower recirculations is eradicated together with the upper roll flows. Due to this result, the flow leaving the H-EMBr section moves downwards, in a single stream with an apparent plug flow pattern. The implementation of higher field intensities provides almost the same flow patterns but just decreasing in velocity intensity (Figure 6f).
The second analysis considers the application of the vertical-EMBr (V-EMBr) positioned close to the narrow mold faces using the five field intensities indicated above and whose effects on the flow patterns are shown in Figure 7. As in the cases discussed above, each V-EMBr simulation uses as the starting point the steady-state mentioned in Section 4.2, and subsequently, the simulation continues running for another 300 seconds. Figure 7a shows the flow patterns without EMBr, which is the reference state. Figure 7b–f shows the results at the second 540 of the total simulation for each case. In Figure 7b–f, the intensity of the electromagnetic field increases from 0.1 to 0.5 T, respectively. Here, the V-EMBr does not brake the velocity of the jets at any field intensity directly. Thereby, the cascade of lower recirculations remains for all cases, implying that the DD phenomenon was not controlled or eliminated at all (point 1). Despite this, close to the narrow mold faces, the V-EMBr shows its effects decelerating the ascending streams towards the meniscus. In detail, for a 0.1 T field intensity, the bulk flow shows good symmetry, the upper roll flows are yield lower velocities, and a velocity reduction in the meniscus vicinity occurs. For a 0.2 T field intensity, the longer upper roll flows (point 2) became smaller upper roll flows (point 3) at the upper side of the jets. Moreover, the fluid in the meniscus vicinity moves more slowly (point 4) because of the strong braking that it is occurring on the ascending streams close to the narrow faces. When the electromagnetic field intensity is higher, these new small upper roll flows become intermittent over each jet, forming an ascending cascade collapsing in the space between the SEN and the V-EMBr position (point 5). Despite this new phenomenon, the meniscus vicinity seems not to show significant velocity increments; therefore, in the next section, a more detailed study of the meniscus behavior under the effects of these two types of EMBr is carried out.

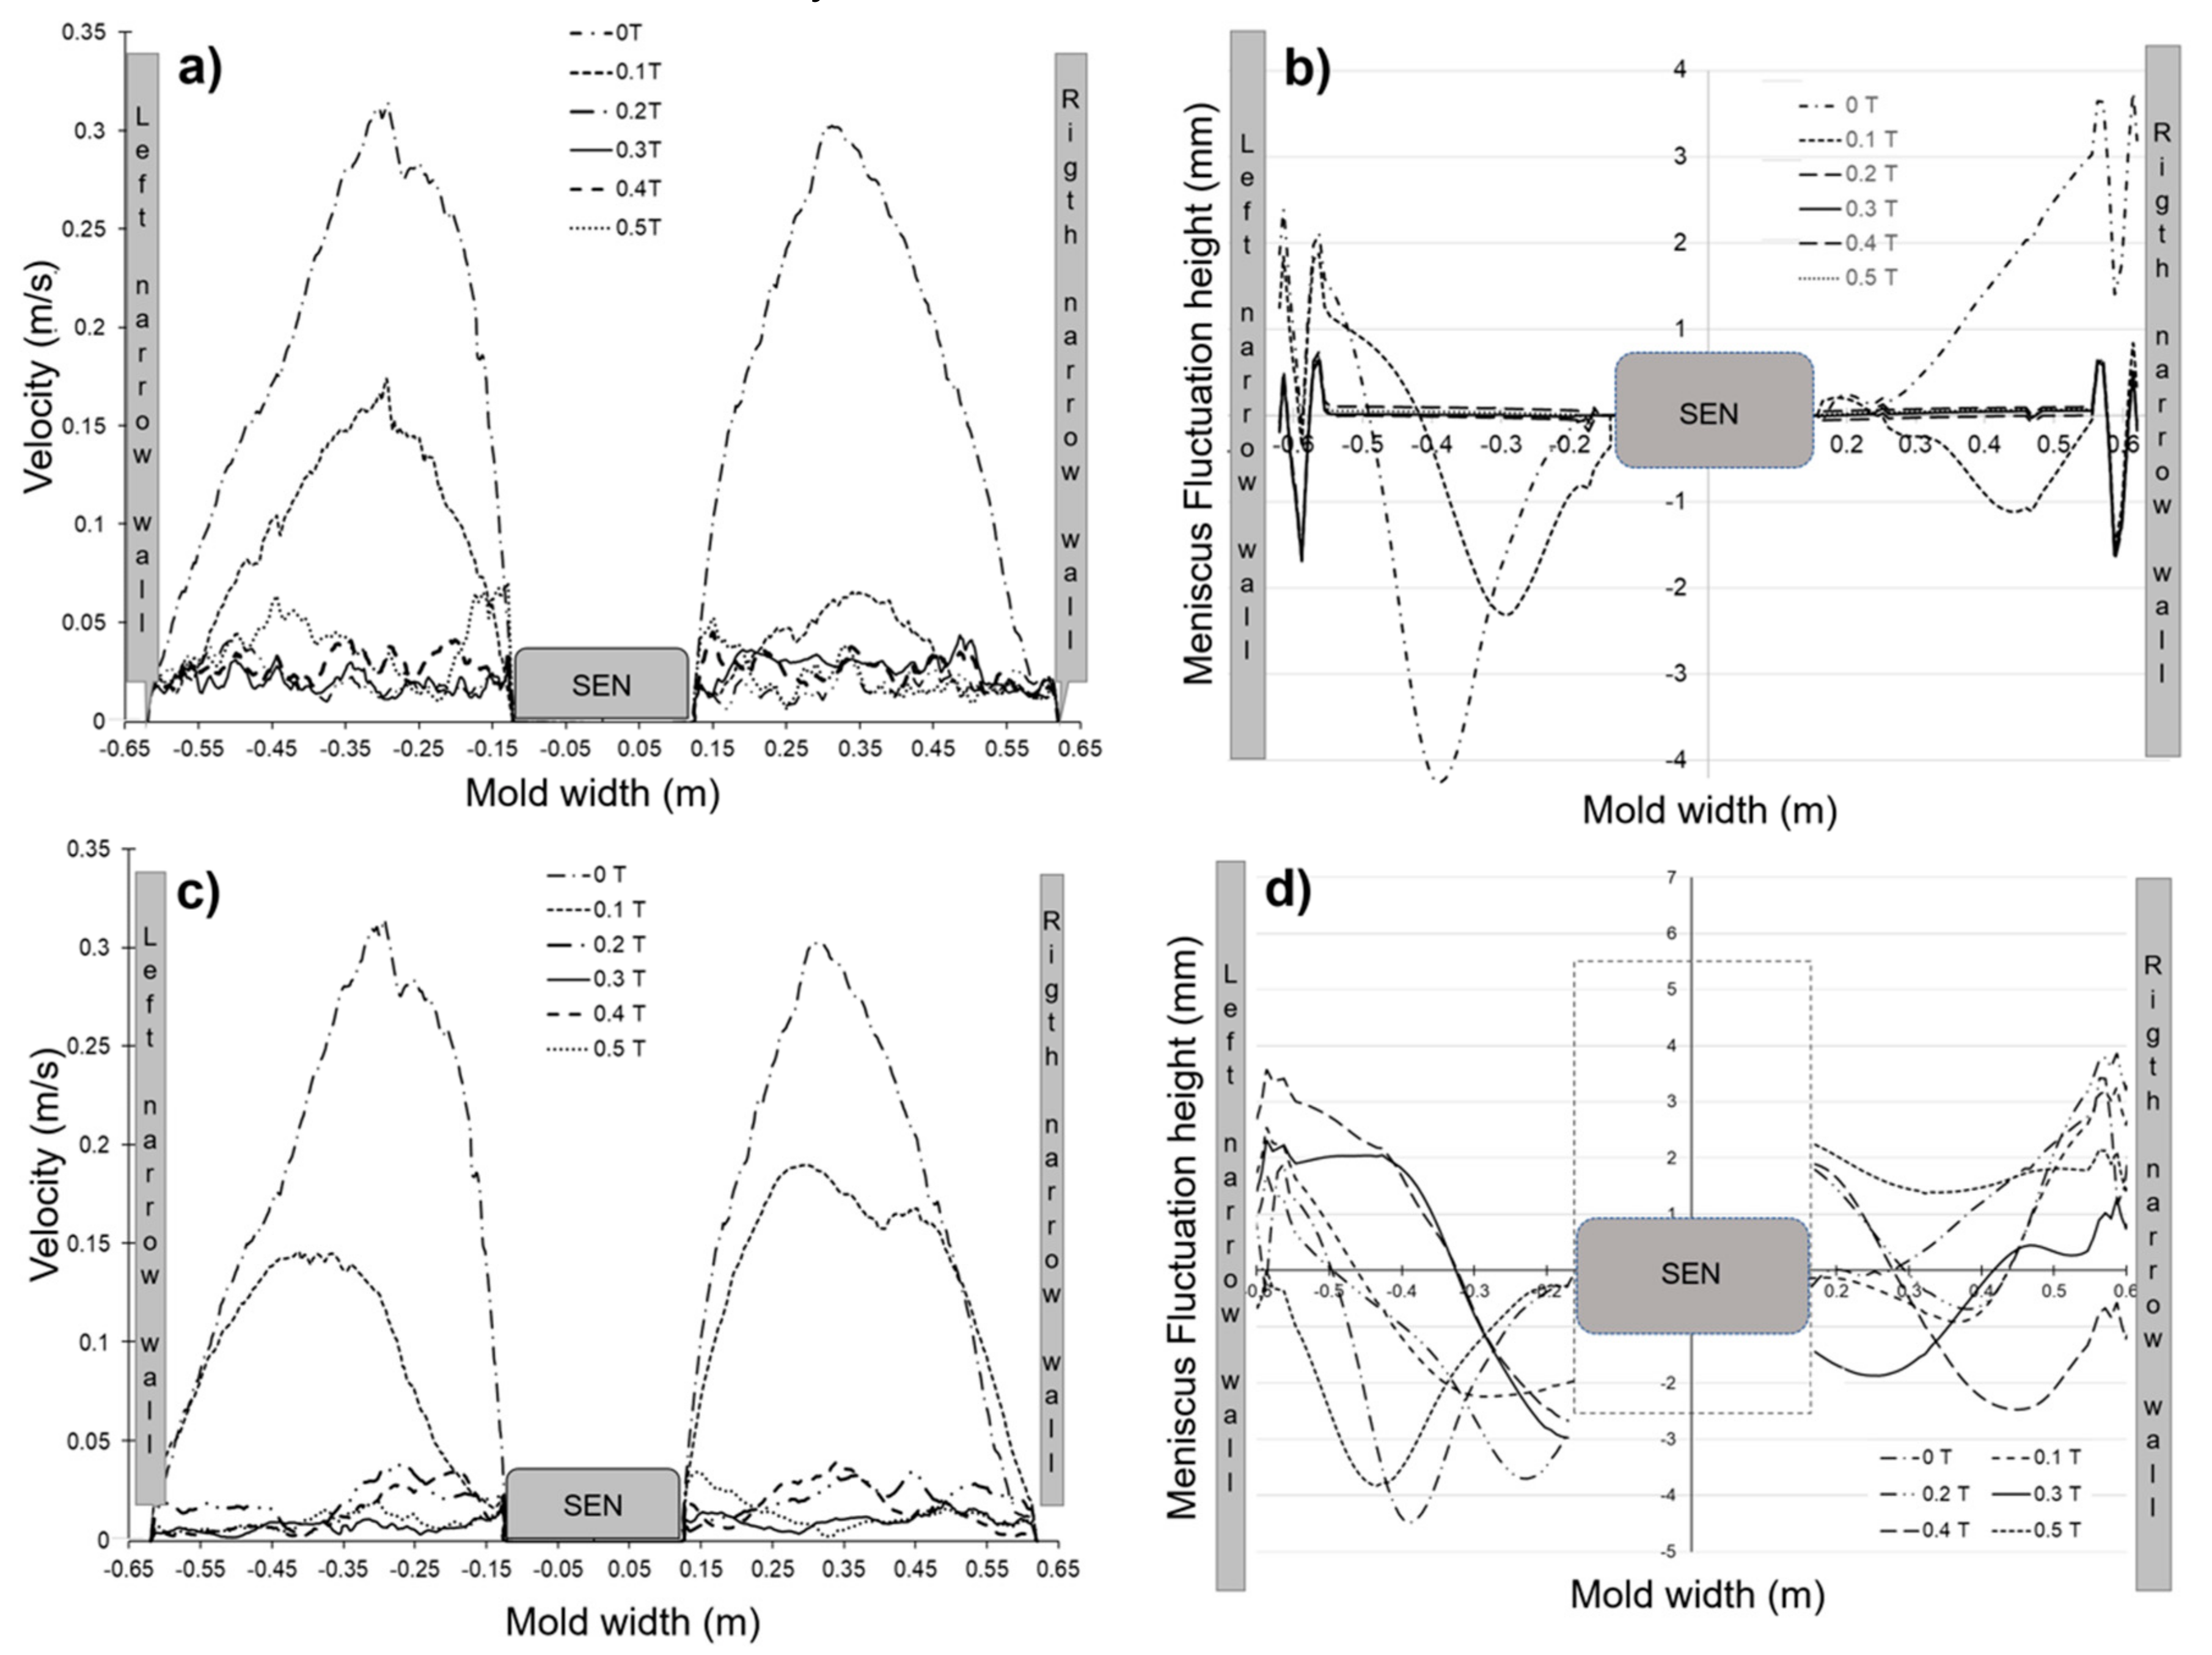
4.4. Study of the EMBr Effects on the Meniscus Behavior

Since the meniscus has shown a considerable velocity reduction due to the usage of both EMBr types, this phenomenon requires further study in more detail.
The meniscus velocity and its fluctuations were calculated throughout the broad face of the mold, considering only the central axis. Figure 8 shows the results of these two variables for both types of EMBr. This figure shows that the meniscus velocity is reduced by around 50% using just a field intensity of 0.1 T and even more than 80% for higher field intensities; these results are regardless of the EMBr type.
In contrast, the results when dealing with meniscus fluctuations are quite different. The H-EMBr reduces around 50% of the meniscus fluctuation with a field intensity of 0.1 T, and higher field intensities even eliminate almost wholly the fluctuations. Meanwhile, the V-EMBr does not provide such types of results since the meniscus fluctuations significantly are not reduced for any field intensity. Even worse, the V-EMBr promotes more fluctuations in the meniscus, close to the SEN wall, no matter the intensity of the electromagnetic field. The collapsing effect of the upper roll flows between the SEN and the V-EMBr position is responsible for such fluctuation increments.
The analysis of the above observations was at the same instant for all cases. However, Figure 4 demonstrates that the intensity of meniscus fluctuations strongly depends on the DD occurrence and that the full effects of such a phenomenon only can be observed studying the simulation results over a period. Hence, to analyze how both EMBr types counteract the DD effects, two variables were monitored for 60 seconds. The first is the mass flow rates delivered by each SEN port, and the second is the height of the meniscus fluctuation at the same four positions employed, indicated in Figure 4c. These two variables, when EMBr is not applied, are shown in Figure 9a. In this case, the DD phenomenon was detected twice by marked differences between the mass flow rates delivered for each port of the SEN. Its occurrences were at seconds 15 and 45 approximately. Here, regarding the mass flow, there is a difference of around 1 kg/s when the DD is occurring, and it is smaller in the oppositive case, around 0.2 kg/s or even less. The consequence of the DD phenomenon is that the meniscus presents strong fluctuations where the funnel shape begins. It is notorious that the fluctuations in the meniscus are not occurring precisely at the same moment when the mass flow rate variations arise. There is a lag-time because the flow requires time to travel throughout the mold interior until reaching the meniscus, making the uneven mass flow rate not have an instantaneous effect on the meniscus stability. Despite this time discrepancy between these two flow signals, these figures demonstrate clearly that the intensity of the meniscus fluctuations depends on the DD phenomenon occurrence and intensity.
Following the idea of the two variables discussed above, the five different H-EMBr intensities, for 60 seconds, were analyzed; see Figure 9 and Figure 10. This monitored period ran after the second 540 for all cases. Figure 9b shows the results when the field of 0.1 T is applied. The mass flow rate difference between both SEN ports is smaller compared to Figure 9a, having a mean difference of around 0.6 kg/s (almost constant), with one occurrence of the DD phenomenon on the 20th second. Here, it is noteworthy that the H-EMBr position is below the SEN tip, whereby another electromagnetic field, inside the SEN, is induced. This induced electromagnetic field affects the SEN's steel flow, producing a delivered flow with more control before entering the H-EMBr zone. This induced electromagnetic field reduces the DD intensity from inside the SEN since each SEN port's mass flow rate presents just a variation of ±0.1 kg/s, far less than the ±0.5 kg/s observed in Figure 9a. These effects directly impact the meniscus stability since the highest meniscus fluctuations, at C and D points referenced in Figure 4, have been strongly reduced from −10 to ±3 mm. These meniscus fluctuations are in the same magnitude as those measured in the points A and D referenced in Figure 4, implying that the meniscus fluctuations are not suffering variations due to the DD phenomenon presence. When an electromagnetic field of 0.2 T is applied, as shown in Figure 9c, the mass flow rate difference between each SEN port is reduced to 0.2 kg/s, and with higher field intensities, this breach decreases until 0.1 kg/s; see Figure 10. Figure 10a,b, at seconds 50 and 45, respectively, shows that despite the braking effects of the induced magnetic field inside the nozzle, the periodic differences in mass flow rate remain but with much lower intensities. As a result, the meniscus fluctuations decrease to 0.1 mm for 0.2 T and are smaller than 0.1 mm for higher field intensities. The DD phenomenon remains barely for 0.2, 0.3 and 0.4 T and disappears for 0.5 T. Thus, the H-EMBr has shown significant contributions in the control and eradication of the DD phenomenon since its reduces the meniscus fluctuation and eliminates the cascade of recirculations moving upward between both jets.
Following the same idea again, the same two variables discussed above, analyzed for 60 seconds for the five different V-EMBr intensities, are shown in Figure 11 and Figure 12. This monitored period ran after the second 540 for all cases. Figure 11a shows both variables when EMBr is not applied. Observing the figures for the mass flow rates shows that the V-EMBr does not contribute to the control of the DD phenomenon. In all cases, this phenomenon appears at different times and with different intensities, identified for the notorious differences between both mass flow rates. Despite this, the V-EMBr intended to counteract the DD phenomenon effects by braking the upwards flow close to narrow mold faces (shown in Figure 7). Due to this, the attention is then on the second variable (the meniscus fluctuation intensity), where the corresponding figures show unencouraging results. For all V-EMBr cases, the meniscus continues presenting constant and strong fluctuations in a wide range of intensities depending on the DD occurrence. The meniscus fluctuations remain more intense in points B and C despite the V-EMBr intensity, reaching values up to −6 mm for 0.5 T or even higher for other cases. Consequently, and considering the above discussion, the V-EMBr type does not control the DD phenomenon's occurrence. Neither counteracts effectively the steel flow affected for this phenomenon ending with a highly fluctuating meniscus.

5. Conclusions

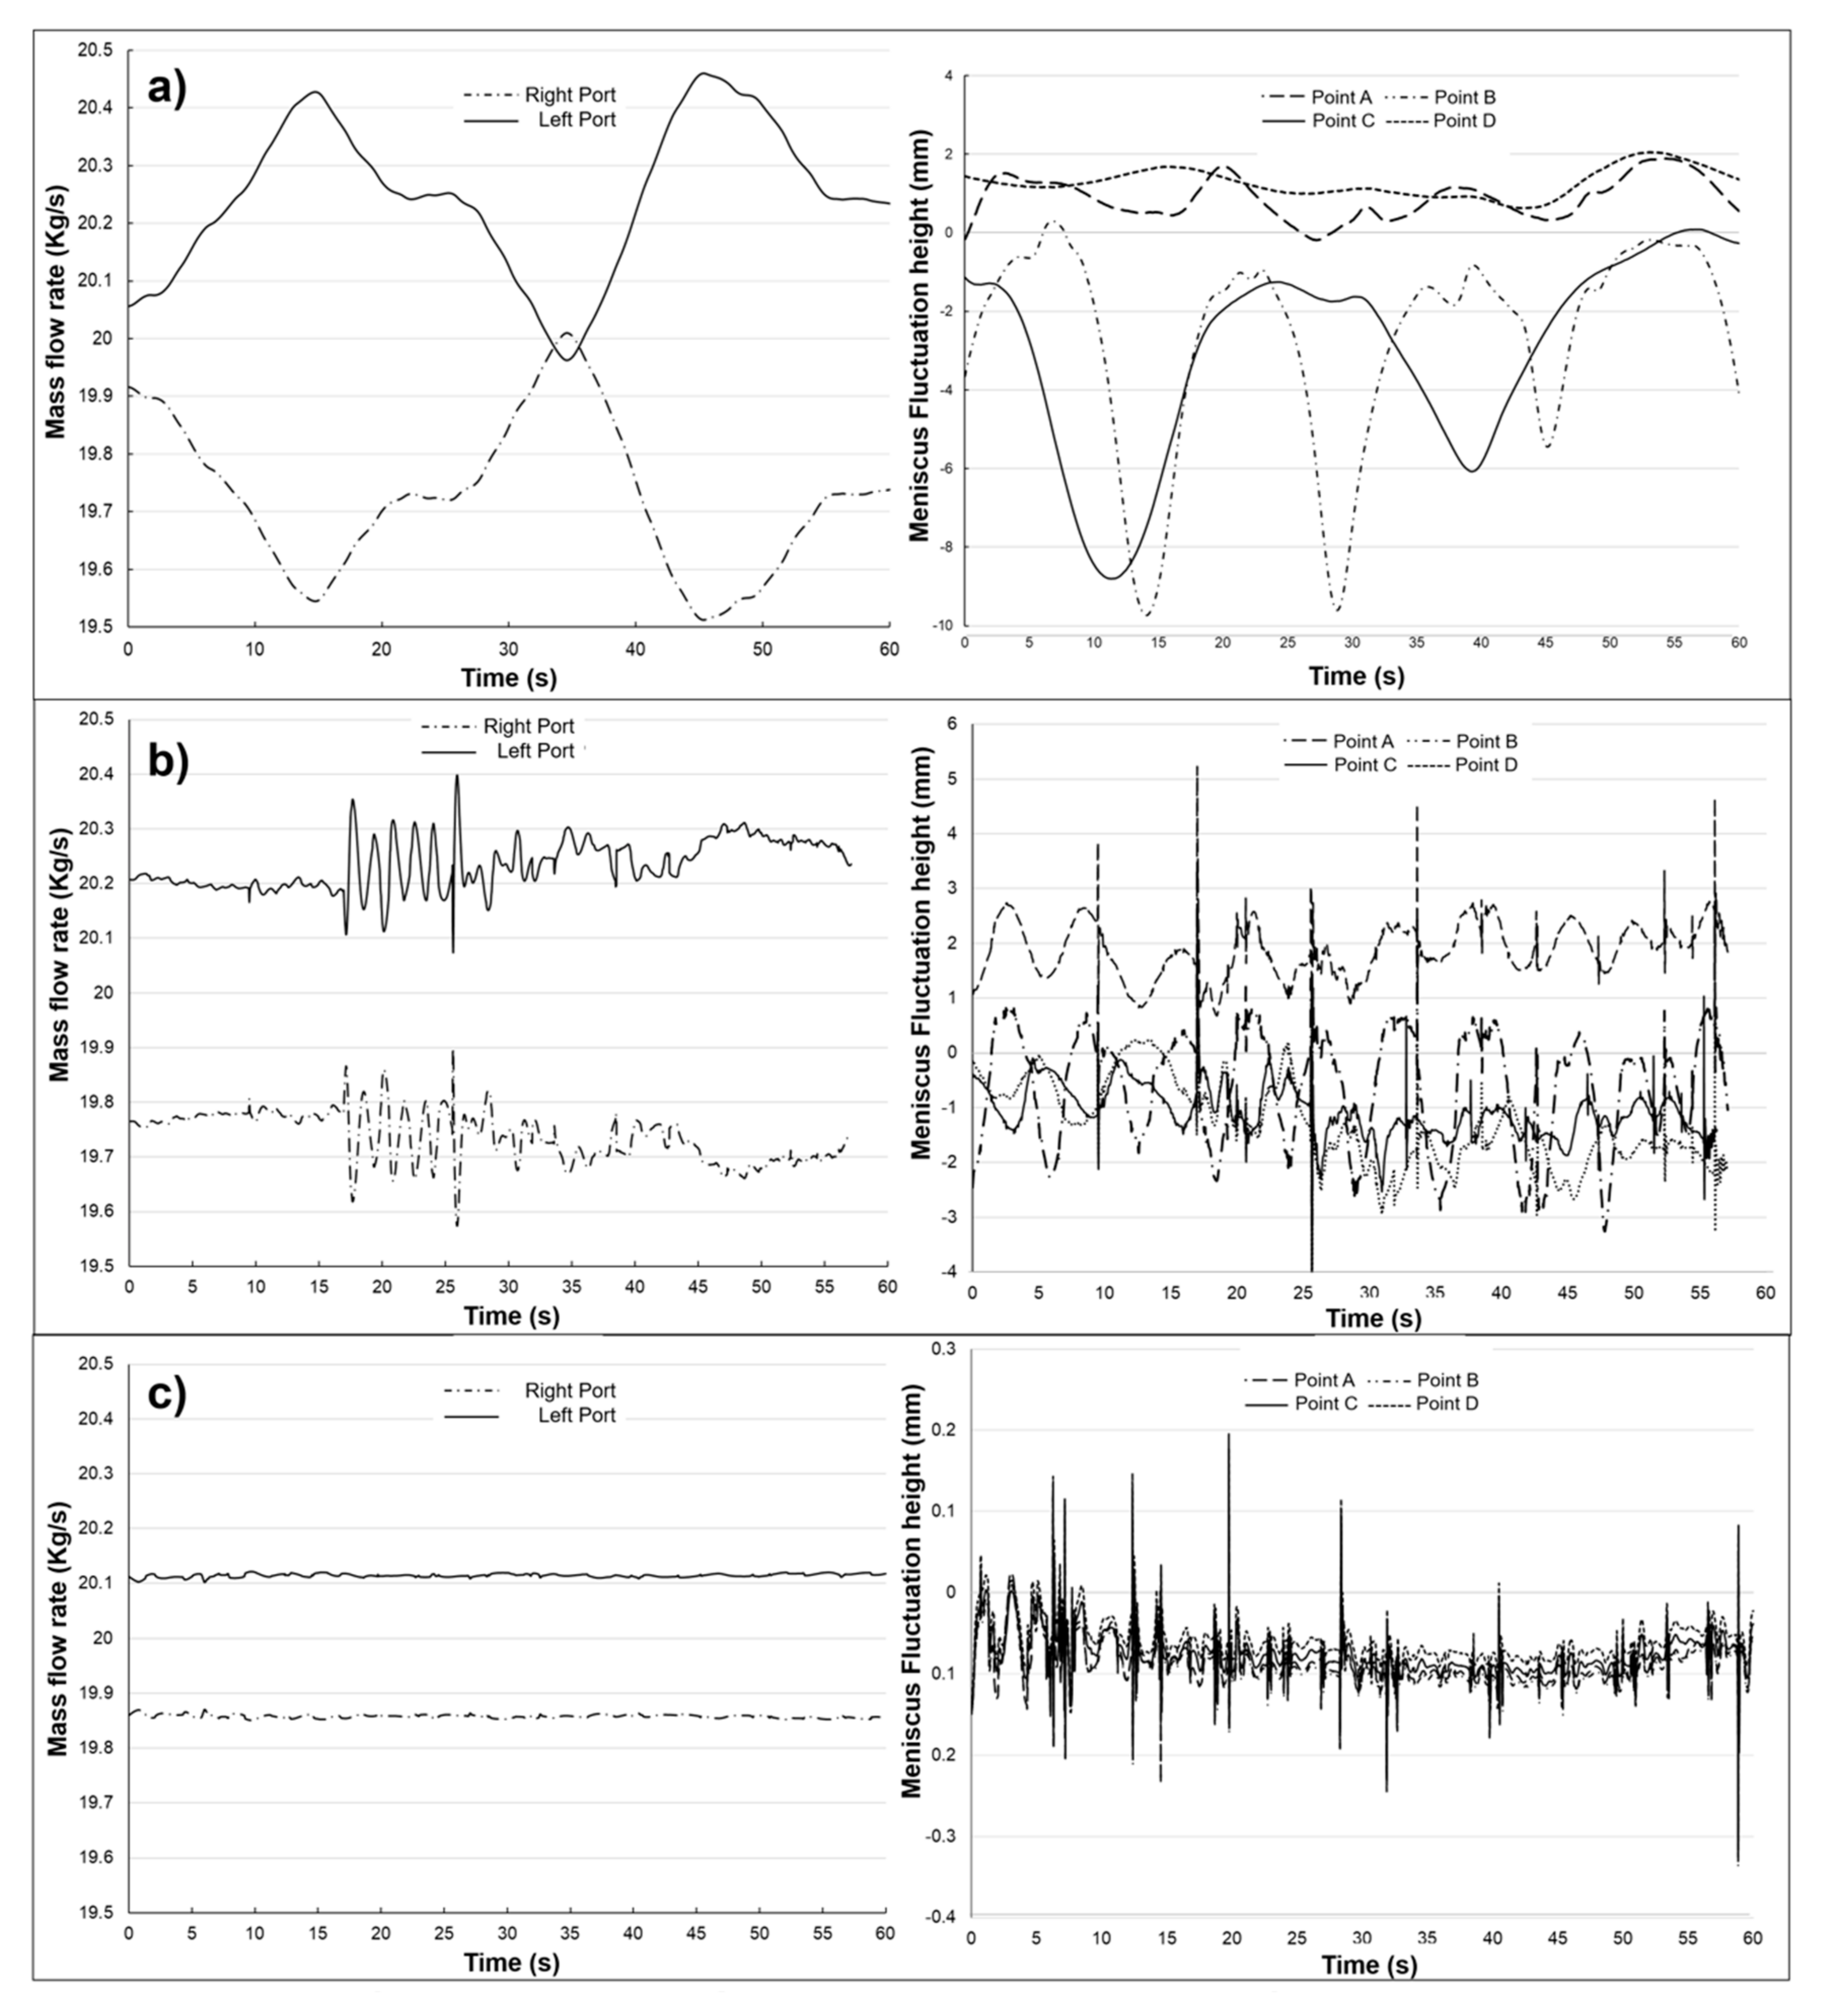
  • The correct observation and analysis of the dynamic distortion phenomenon must be done transitorily by studying the flow patterns under unsteady-state conditions since its occurrence is often in funnel thin slab molds.
  • The meniscus stability analysis in a thin slab mold must be under unsteady-state conditions due to the dynamic distortion phenomenon’s periodicity, which affects the meniscus fluctuation in different magnitudes depending on the DD intensity.
  • The increment in the mass flow rate differences delivered by the SEN ports induces the start of the dynamic distortion phenomenon, which is excellently counteracted by the H-EMBr with an intensity of 0.1T and eliminated by applying higher H-EMBr magnitudes.
  • The H-EMBr counteracts with effectiveness the DD phenomenon’s periodicity effects on the meniscus stability. It reduces the highest meniscus fluctuations from 10 to ± 3 mm with a field intensity of 0.1T and almost to 0 mm for higher field intensities.
  • The V-EMBr effectively reduces the meniscus velocity but does not reduce the highest meniscus fluctuations with any field intensity. This EMBr configuration does not control the DD phenomenon, and even though it eliminates the upper roll flows, it induces new roll flows with small sizes close to the SEN walls.

Author Contributions

Conceptualization, R.M.D. and J.d.J.B.; methodology, E.G. and J.d.J.B.; software, S.G.-H. and C.H.G.-G.; validation R.M.D. and I.C.-R.; formal analysis, S.G.-H. and E.G.; investigation, S.G.-H. and C.H.G.-G.; writing—original draft preparation, S.G.-H.; writing—review and editing, S.G.-H. and R.M.D.; visualization, S.G.-H. and C.H.G.-G.; supervision, J.d.J.B.; All authors have read and agreed to the published version of the manuscript.

Funding

This research received no external funding.

Acknowledgments

The authors give thanks to the institutions TecNM-ITM, IPN and SNI for their permanent support to the Academic Research Group on Simulation of Materials Processing and Fluidynamics.

Conflicts of Interest

The authors declare no conflict of interest.

References

  1. Cho, S.M.; Thomas, B.G. Electromagnetic Forces in Continuous Casting of Steel Slabs. Metals 2019, 9, 471. [Google Scholar] [CrossRef] [Green Version]
  2. Thomas, B.G. Modeling of Continuous Casting Defects Related to Mold Fluid Flow. Iron Steel Technol. 2006, 3, 2–17. [Google Scholar]
  3. Honeyands, T.; Herbertson, J. Flow dynamics in thin slab caster moulds. Steel Res. 1995, 66, 287–293. [Google Scholar] [CrossRef]
  4. Gebert, B.M.; Davidson, M.R.; Rudman, M.J. Computed oscillations of a confined submerged liquid jet. Appl. Math. Model. 1998, 22, 843–850. [Google Scholar] [CrossRef]
  5. Davidson, M.R.; Lawson, N.J. Numerical prediction of submerged oscillating jet flow. In Proceedings of the 2nd International Conference On CFD in the Minerals and Process Industries, CSIRO, Melbourne, Australia, 6–8 December 1999; pp. 223–8. [Google Scholar]
  6. Gupta, D.; Chakraborty, S.; Lahiri, A.K. Asymmetry and Oscillation of the Fluid Flow Pattern in a Continuous Casting Mould: A Water Model Study. ISIJ Int. 1997, 37, 654–658. [Google Scholar] [CrossRef]
  7. Nam, H.; Park, H.S.; Yoon, J.K. Numerical Analysis of Fluid Flow and Heat Transfer in the Funnel Type Mold of a Thin Slab Caster. ISIJ Int. 2000, 40, 886–892. [Google Scholar] [CrossRef] [Green Version]
  8. Park, H.S.; Nam, H.; Yoon, J.K. Numerical Analysis of Fluid Flow and Heat Transfer in the Parallel Type Mold of a Thin Slab Caster. ISIJ Int. 2001, 41, 974–980. [Google Scholar] [CrossRef]
  9. Shen, B.; Shen, H.; Liu, B. Instability of Fluid Flow and Level Fluctuation in Continuous Thin Slab Casting Mould. ISIJ Int. 2007, 47, 427–432. [Google Scholar] [CrossRef] [Green Version]
  10. Torres-Alonso, E.; Morales, R.D.; Demedices, L.G.; Nájera, A.; Palafox-Ramos, J.; Lopez, R. Flow Dynamics in Thin Slab Molds Driven by Sustainable Oscillating Jets from the Feeding SEN. ISIJ Int. 2007, 47, 679–688. [Google Scholar] [CrossRef] [Green Version]
  11. Torres-Alonso, E.; Morales, R.D.; Palafox-Ramos, J.; Lopez, R. Oscillating Jet Flows in a Thin Slab Mold and their Influence on Meniscus Stability. Steel Res. Int. 2008, 79, 553–563. [Google Scholar] [CrossRef]
  12. Jeon, Y.J.; Sung, H.J.; Lee, S. Flow Oscillations and Meniscus Fluctuations in a Funnel-Type Water Mold Model. Metall. Mater. Trans. B 2010, 41, 121–130. [Google Scholar] [CrossRef] [Green Version]
  13. Torres-Alonso, E.; Morales, R.D.; Garcia-Hernandez, S.; Palafox-Ramos, J. Cyclic Turbulent Instabilities in a Thin Slab Mold. Part I: Physical Model. Metall. Mater. Trans. B 2010, 41, 583–597. [Google Scholar] [CrossRef]
  14. Zarea, M.H.; Meysami, A.H.; Mahmoudi, Sh.; Hajisafari, M.; MazarAtabaki, M. Simulation of Fluid Flow and Solidification in the Funnel Type Crystalizer of Thin Slab Continuous Cast. Orient. J. Chem. 1325, 29, 1325–337. [Google Scholar] [CrossRef] [Green Version]
  15. Arcos-Gutiérrez, H.; Barrera-Cardiel, G.; de Barreto, J.J. Simulación Física y Matemática para la Optimización del Diseño de una Buza para el Molde de Colada Continua de Planchón Delgado. Foro Ing. Investig. Mater. Morelia México 2011, 8, 373–379. [Google Scholar]
  16. Morales, R.D.; Tang, Y.; Nitzl, G.; Eglsaeer, C.; Hackl, G. Design of a Submerged Entry Nozzle for Thin Slab Molds Operating at High Casting Speeds. ISIJ Int. 2012, 52, 1607–1615. [Google Scholar] [CrossRef] [Green Version]
  17. Zarea, M.H.; Meysami, A.H.; Mahmoudi, Sh.; Hajisafari, M.; Atabaki, M.M. Simulation of flow field and steel/slag interface in the mold region of a thin slab steel continuous caster with tetra-furcated nozzle. J. Manuf. Process. 2013, 15, 307–317. [Google Scholar] [CrossRef]
  18. Arcos-Gutierrez, H.; Barrera-Cardiel, G.; de Jesus Barreto, J.; Garcia-Hernandez, S. Numerical Study of Internal SEN Design Effects on Jet Oscillations in a Funnel Thin Slab Caster. ISIJ Int. 2014, 54, 1304–1313. [Google Scholar] [CrossRef] [Green Version]
  19. Liu, Z.; Li, B.; Tsukihashi, F. Instability and Periodicity of Asymmetrical Flow in a Funnel Thin Slab Continuous Casting Mold. ISIJ Int. 2015, 55, 805–813. [Google Scholar] [CrossRef] [Green Version]
  20. Hwang, Y.S.; Cha, P.R.; Nam, H.S.; Moon, K.H.; Yoon, J.K. Numerical Analysis of the Influences of Operational Parameters on the Fluid Flow and Meniscus Shape in Slab Caster with EMBR. ISIJ Int. 1997, 37, 659–667. [Google Scholar] [CrossRef]
  21. Ha, M.Y.; Lee, H.G.; Seong, S.H. Numerical simulation of three-dimensional flow, heat transfer, and solidification of steel in continuous casting mold with electromagnetic brake. J. Mater. Process. Technol. 2003, 133, 322–339. [Google Scholar] [CrossRef]
  22. Takatani, K. Effects of Electromagnetic Brake and Meniscus Electromagnetic Stirrer on Transient Molten Steel Flow at Meniscus in a Continuous Casting Mold. ISIJ Int. 2003, 43, 915–922. [Google Scholar] [CrossRef]
  23. Yu, H.; Wang, B.; Li, H.; Li, J. Influence of electromagnetic brake on flow field of liquid steel in the slab continuous casting mold. J. Mater. Process. Technol. 2008, 202, 179–187. [Google Scholar] [CrossRef]
  24. Wang, H.; Zhu, M.; Yu, H. Numerical Analysis of Electromagnetic Field and Flow Field in High Casting Speed Slab Continuous Casting Mold with Traveling Magnetic Field. J. Iron Steel Res. Int. 2010, 17, 25–30. [Google Scholar] [CrossRef]
  25. Garcia-Hernandez, S.; Morales, R.D.; Torres-Alonso, E. Effects of EMBr position, mould curvature and slide gate on fluid flow of steel in slab mould. Ironmak. Steelmak. 2010, 37, 360–368. [Google Scholar] [CrossRef]
  26. Thomas, B.G.; Shing, R.; Chaudhary, R.; Vanka, P. Flow Control with Ruler Electromagnetic Braking (EMBr) in Continuous Casting of Steel Slabs. In Proceedings of the Fifth Baosteel Biennial Academic Conference, Shanghai, China, 4–6 June 2013. [Google Scholar]
  27. Cho, S.M.; Kim, S.H.; Thomas, B.G. Transient Fluid Flow during Steady Continuous Casting of Steel Slabs: Part II. Effect of Double-Ruler Electro-Magnetic Braking. ISIJ Int. 2014, 54, 855–864. [Google Scholar] [CrossRef]
  28. Singh, R.; Thomas, B.G.; Vanka, S.P. Large Eddy Simulations of Double-Ruler Electromagnetic Field Effect on Transient Flow During Continuous Casting. Metall. Mater. Trans. B 2014, 45B, 1098–1115. [Google Scholar] [CrossRef] [Green Version]
  29. Xu, C.J.; Zhang, X.J.; Li, J.; Wang, Z.Y.; Zhang, L.W. Magnetic field distribution in the electromagnetic feeding riser of rectangle steel ingot. Metallurgical 2016, 55, 317–320. [Google Scholar]
  30. Sarkar, S.; Singh, V.; Ajmani, S.K.; Ranjan, R.; Rajasekar, K. Effect of Double Ruler Magnetic Field in Controlling Meniscus Flow and Turbulence Intensity Distribution in Continuous Slab Casting Mold. ISIJ Int. 2016, 56, 2181–2190. [Google Scholar] [CrossRef] [Green Version]
  31. Liu, Z.; Li, L.; Li, B. Large Eddy Simulation of Transient Flow and Inclusions Transport in Continuous Casting Mold under Different Electromagnetic Brakes. Miner. Met. Mater. Soc. 2016, 2180–2190. [Google Scholar] [CrossRef]
  32. Li, F.; Wang, E.; Feng, M.; Li, Z. Simulation Research of Flow Field in Continuous Casting Mold with Vertical Electromagnetic Brake. ISIJ Int. 2015, 55, 814–820. [Google Scholar] [CrossRef] [Green Version]
  33. Xu, L.; Wang, E.; Karcher, C.; Deng, A.; Xu, X. Numerical Simulation of the Effects of Horizontal and Vertical EMBr on Jet Flow and Mold Level Fluctuation in Continuous Casting. Metall. Mater. Trans. B 2018, 49B, 2779–2793. [Google Scholar] [CrossRef]
  34. Li, F.; Wang, E.; Feng, M. Numerical Simulation of Magnetic Field and Flow Control in Mold with Vertical Combination Electromagnetic Brake. La Metallurgia Italiana 2016, 7, 17–25. [Google Scholar]
  35. Yavuz, M.M. The Effects of Electromagnetic Brake on Liquid Steel Flow in Thin Slab Caster. Steel Res. Int. 2011, 82, 809–818. [Google Scholar] [CrossRef]
  36. Tian, X.Y.; Li, B.W.; He, J.C. Electromagnetic Brake Effects on the Funnel Shape Mold of a Thin Slab Caster Based on a New Type Magnet. Metall. Mater. Trans. B 2009, 40B, 596–604. [Google Scholar] [CrossRef]
  37. Liu, H.; Yang, C.; Zhang, H.; Zhai, Q.; Gan, Y. Numerical Simulation of Fluid Flow and Thermal Characteristics of Thin Slab in the Funnel-Type Molds of Two Casters. ISIJ Int. 2011, 51, 392–401. [Google Scholar] [CrossRef] [Green Version]
  38. Zhang, L.S.; Zhang, X.F.; Wang, B.; Liu, Q.; Hu, Z.G. Numerical Analysis of the Influences of Operational Parameters on the Braking Effect of EMBr in a CSP Funnel-Type Mold. Metall. Mater. Trans. B 2014, 45B, 295–306. [Google Scholar] [CrossRef]
  39. Kunstreich, S.; Gautreau, T.; Ren, J.Y.; Codutti, A.; Guastini, F.; Petronio, M. Experimental approach to develop Multi-Mode® EMB, an advanced electromagnetic brake for thin slab casters. In Proceedings of the 8th International Conference on Electromagnetic Processing of Materials, Cannes, France, 12–16 October 2015; pp. 369–372. [Google Scholar]
  40. Chen, H.M.; Hwang, W.S. Effects of Electromagnetic Braking on the Fluid Flow inside a Thin Slab, Continuous Casting Mold through Numerical Simulations. In Proceedings of the 23rd Conference on Metallurgy and Materials, Brno, Czech Republic, 21–23 May 2014. [Google Scholar]
  41. Li, B.; Tsukihashi, F. Effects of Electromagnetic Brake on Vortex Flows in Thin Slab Continuous Casting Mold. ISIJ Int. 2006, 46, 1833–1838. [Google Scholar] [CrossRef] [Green Version]
  42. Wilcox, D.C. Turbulence Modeling for CFD; Industries Inc.: La Cañada Flintridge, CA, USA, 2000; p. 103. [Google Scholar]
  43. Anderson, J.D. Computational Fluid Dynamics; McGraw Hill Inc.: New York, NY, USA, 1995; p. 261. [Google Scholar]
  44. Chung, T.J. Computational Fluid Dynamics; Cambridge University Press: London, UK; New York, NY, USA, 2002; pp. 937–956. [Google Scholar]
  45. Ferziger, J.H.; Peric, M. Computational Methods for Fluid Dynamics; Springer: New York, NY, USA, 2002; pp. 1–71. [Google Scholar]
  46. Pope, S.B. Turbulent Flows; Cambridge Press: New York, NY, USA, 2000; pp. 387–419. [Google Scholar]
  47. ANSYS Inc. Fluent 6.2 User’s Guide, Centerra Resource Park 10 Cavendish Court Lebanon. NH 2005, 3766, 1–4. [Google Scholar]
  48. Daly, B.J.; Harlow, F.H. Transport Equations in Turbulence. Phys. Fluids 1970, 2634–2649. [Google Scholar] [CrossRef]
  49. Rotta, J.C. Statistische Theorie nichthomogener Turbulenz. Z. Phys. 1951, 547–572. [Google Scholar] [CrossRef]
  50. Hirt, C.W.; Nichols, B.D. Volume of fluid (VOF) method for the dynamics of free boundaries. J. Comp. Phys. 1981, 39, 201–225. [Google Scholar] [CrossRef]
  51. Liovic, P.; Liow, J.L.; Rudman, M. A Volume of Fluid (VOF) Method for the Simulation of Metallurgical Flows. ISIJ Int. 2001, 41, 225–233. [Google Scholar] [CrossRef] [Green Version]
  52. Abraham, M.; Becker, R. The Classical Theory of Electricity and Magnetism; Blackie and Sons: London, UK, 1938; pp. 123–139. [Google Scholar]
  53. Hughes, W.F.; Young, F.J. The electromagnetodynamics of fluids. J. Fluid Mech. 1989, 820–823. [Google Scholar] [CrossRef]
  54. Hughes, W.F. Discussion of the magnetohydrodynamic finite step slider bearing. J. Basic Eng. Trans. ASME 1963, 85, 129. [Google Scholar] [CrossRef]
  55. Garcia-Hernandez, S.; Morales, R.D.; Torres-Alonso, E.; Najera-Bastida, A. Effects of Electromagnetic Brake, Mold Curvature and Slide Gate on Fluid Flow of Steel in a Slab Mold. Steel Research Int. 2009, 80, 816–823. [Google Scholar] [CrossRef]
Figure 1. Dimensions in mm, (a) mold, (b) frontal view of the SEN, (c) lateral view of the SEN and (d) physical model.
Crystals 10 00958 g001
Figure 2. Boundary conditions and mesh of the mold, (a) mold, (b) H-EMBr position, (c) V-EMBr position, (d) SEN mesh and (e) mold mesh.
Crystals 10 00958 g002
Figure 3. Model validation, mathematical ((a) velocity contours, (b) velocity vectors profile) and physical flow patterns of the mold (tracer injection at different times, (c) 5s, (d) 6s, (e) 7s, (f) 8s).
Crystals 10 00958 g003
Figure 4. (a) Schematic view of the phases and meniscus position, (b) meniscus fluctuation during steady-state conditions, (c) schematic top view of the mold and (d) meniscus fluctuation during unsteady-state conditions.
Crystals 10 00958 g004
Figure 5. Velocity vectors at the central symmetrical plane of the mold at different times, (a) 120, (b) 130, (c) 140, (d) 150, (e) 160 and (f) 170 s.
Crystals 10 00958 g005
Figure 6. Velocity vectors at the central symmetrical plane of the mold with different intensities of H-EMBr, (a) 0, (b) 0.1, (c) 0.2, (d) 0.3, (e) 0.4 and (f) 0.5 T.
Crystals 10 00958 g006
Figure 7. Velocity vectors at the central symmetrical plane of the mold with different intensities of V-EMBr, (a) 0, (b) 0.1, (c) 0.2, (d) 0.3, (e) 0.3 and (f) 0.5 T.
Crystals 10 00958 g007
Figure 8. Meniscus velocity and meniscus fluctuation during steady-state conditions considering both EMBr types, (a,b) H-EMBr and (c,d) V-EMBr.
Crystals 10 00958 g008
Figure 9. Mass flow rate in the SEN ports and meniscus fluctuation height during 60 seconds at unsteady-state conditions, H-EMBr, (a) 0, (b) 0.1 and (c) 0.2 T.
Crystals 10 00958 g009
Figure 10. Mass flow rate in the SEN ports and meniscus fluctuation height during 60 seconds at unsteady-state conditions, H-EMBr, (a) 0.3, (b) 0.4 and (c) 0.5 T.
Crystals 10 00958 g010
Figure 11. Mass flow rate in the SEN ports and meniscus fluctuation height during 60 seconds at unsteady-state conditions, V-EMBr, (a) 0, (b) 0.1 and (c) 0.2 T.
Crystals 10 00958 g011
Figure 12. Mass flow rate in the SEN ports and meniscus fluctuation height during 60 seconds at unsteady-state conditions, V-EMBr, (a) 0.3, (b) 0.4 and (c) 0.5 T.
Crystals 10 00958 g012
Publisher’s Note: MDPI stays neutral with regard to jurisdictional claims in published maps and institutional affiliations.

