Article

High-Entropy FeCoNiB0.5Si0.5 Alloy Synthesized by Mechanical Alloying and Spark Plasma Sintering

1
Laboratoire de Chimie Inorganique, UR 11-ES-73, Université de Sfax, B.P. 1171, Sfax 3018, Tunisia
2
Laboratoire Interdisciplinaire Carnot de Bourgogne, ICB, UMR 6303 CNRS, Université de Bourgogne Franche Comté, BP 47870, 21078 CEDEX Dijon, France
3
Franche-Comté Electronique Mécanique Thermique et Optique—Sciences et Technologies, FEMTO-ST, UMR 6174 CNRS, Université de Bourgogne Franche Comté, 25000 Besançon, France
4
Department of Physics, Campus Montilivi, University of Girona, 17071 Girona, Spain
*
Author to whom correspondence should be addressed.
Crystals 2020, 10(10), 929; https://doi.org/10.3390/cryst10100929
Submission received: 8 September 2020 / Revised: 8 October 2020 / Accepted: 9 October 2020 / Published: 12 October 2020

Abstract

:
A FeCoNi(B0.5Si0.5) high-entropy alloy with the face-centered cubic (FCC) crystal structure was synthesized by mechanical alloying and spark plasma sintering (SPS). Phase evolution, microstructure, morphology and annealing behaviors were investigated. It was found that a single FCC solid solution appears after 50 h of milling. The grain size was 10 nm after 150 h of milling. Microstructure parameters were calculated by the Rietveld fitting of the X-ray Diffraction patterns. Magnetic characterizations of milled and annealed powders at 650 °C for 1 h were investigated. The heat treatment improves the magnetic properties of the milled powders by enhancing the saturation magnetization value from 94.31 to 127.30 emu/g and decreasing the coercivity from 49.07 to 29.57 Oe. The cohabitation of the FCC phase with the equilibrium crystalline phases observed after annealing is responsible of this magnetic softening. The as-milled powder was also consolidated by spark plasma sintering at 750 and 1000 °C. The obtained specimen consolidated at 750 °C improved the coercivity to 25.06 Oe and exhibited a compressive strength of 1062 Mpa and Vickers hardness of 518 ± 14 HV, with a load of 2 kN. The nanoindentation technique with the Berkovich indentor gave hardness and indentation elastic modulus of 6.3 ± 0.3 Gpa (~640 HV) and 111 ± 4 Gpa for samples consolidated by SPS at 750 °C.

Graphical Abstract

1. Introduction

High-entropy alloys (HEAs) are a new field of metal alloys, discovered by Yeh et al. [1]. It was defined as alloys composed of five or more metallic elements with each elemental concentration ranging from 5 to 35 at.%. HEAs tend to form a single body-centered cubic (BCC) solid solution or a single face-centered cubic (FCC) one, or, a duplex (FCC + BCC). Some other HEAs can exhibit amorphous structure [2]. HEAs were considered as very promising materials for soft magnetic and exceptional mechanical properties like the hardness and wear resistance [3]. The mixing reaction leading to HEAs in the mechanical alloying process is dominated by the entropy, which substantially diminishes the free Gibbs energy (ΔGmix = ΔHmix − T ΔSmix), even at low temperatures. Thus, super-saturated solid solutions can appear rather than ordered phases, which need higher temperatures to be formed. The binary Fe–Co is a soft magnetic alloy, whereas the addition of Ni in Fe enhanced the electrical resistivity and permeability [4]. Hence, the ternary Fe–Co–Ni exhibited good soft magnetic properties, which make this alloy suitable for several technological devices like magnetic recording media and magnetic fluids [5,6]. Very recently, the quinary system Fe25Co25Ni25(B,Si)25 [7] and the senary Fe25Co25Ni25(P,C,B)25 [8] high-entropy bulk metallic glasses (HE-BMGs) were synthesized by the copper mold casting method. They exhibited good soft magnetic and mechanical properties. On the other hand, Wei et al. [9] successfully synthesized a senary Fe26.7Co28.5Ni28.5Si4.6B8.7P3 (HEA) by the melt spinning method, which formed an amorphous phase at high cooling rate and a FCC solid solution at low cooling rate. From the best of our knowledge, most of the research concentrated on mechanical properties of bulk alloys with limited shapes and sizes, and studied their restricted applications, while HEAs synthesis by the mechanical alloying process is still limited. However, HEAs defined by Yeh et al. [1] are microcrystalline and their properties and applications could be definitely enhanced if they were synthesized in nanocrystalline scale. Furthermore, HEAs synthesis by melting or casting can lead to phase segregation and dendritic structure formation [10]. Otherwise, high-entropy alloys can easily be obtained by the mechanical alloying process without phase segregation and usually lead to the formation of homogenous microstructures [11,12,13,14]. As mentioned above, the Fe25Co25Ni25(B,Si)25 system was already synthesized as a high-entropy bulk metallic alloy by the copper mold casting method and it showed excellent mechanical and magnetic properties [7]. Recently, for an in-depth mechanical study, the combination between the mechanical alloying and spark plasma sintering (MA-SPS) was successfully used. Many bulk alloys and bulk high-entropy alloys have been consolidated by spark plasma sintering (SPS) of as-milled powders [15,16,17,18].
In this paper, FeCoNiB0.5Si0.5 high-entropy alloy powder was prepared by mechanical alloying and spark plasma sintering. We studied the influence of milling time on the morphology, phase composition and microstructure of the alloy. The as-milled powder was also annealed, and the magnetic behaviors were investigated before and after the thermal treatment and SPS consolidation. The mechanical property of the alloy was studied after SPS consolidation. Two temperatures were used in the spark plasma sintering technique. First, a consolidation at high temperature, 1000 °C, was used as a reference indicator for 100% dense solid. Then, a reasonably lower temperature, 750 °C, was used for consolidation in order to conserve the nanostructured powder and the high density of crystallographic defects given by the mechanical alloying. Thus, a high-resistance alloy was obtained.

2. Experimental Procedures

Elemental powders of Fe, Co, Ni, B and Si, with purity of higher than 99.6% and particles size of ≤30 µm, were mechanically milled in argon atmosphere by using a high-energy planetary ball mill (Fritsh Pulverisette P7, FRITSH GmbH, Idar-Oberstein, Germany). The boron is in amorphous form, while the other elements are crystalline. The milling process was carried out up to 150 h at 600 rpm with a ball-to-powder weight ratio of 4:5. The milling sequence was chosen as 10 min of milling followed by 5 min of pause to avoid heating. The milling process was regularly interrupted, and small quantities of powder were collected for analysis by X-ray diffraction (XRD) and scanning electron microscopy (SEM).
To study the thermal stability of the compound, the as-milled powder was heat-treated for 1 h at 650 °C in a sealed quartz tube under 10−3 Pa argon atmosphere. Annealing was performed in a Carbolite furnace with a heating rate of 15 °C/min. The alloys were characterized by X-ray diffraction (XRD) by means of Siemens D500 S (Siemen, Munich, Germany) equipment with Cu Kα (λ = 1.54056 Å) radiation. The crystallite size, lattice strain and lattice parameters were determined using the Maud program based on the Rietveld method [19]. The morphology of the alloy powders was observed using scanning electron microscopy (SEM, DSM960A ZEISS, Carl Zeiss GmbH, Oberkochen, Germany) in secondary electron mode operating at a voltage of 15 kV. The saturation magnetization (Ms), coercive field (Hc) and squareness ratio (Mr/Ms) of the as-milled and heat-treated powders were conducted by a superconducting quantum interference device from Quantum Design (Caledonia, MI, USA) SQUID MPMS-XL at 300 K with maximum applied field of 20 kOe.
Subsequently, the as-milled powder was consolidated in vacuum atmosphere by SPS (HPD10, FCT Systeme GmbH, Frankenblick, Germany) at 750 and 1000 °C, using a heating rate of 50 °C/min, under a pressure of 50 Mpa, and then free cooled to room temperature for 10 min. For the SPS consolidation at 750 °C, a dwell time of 10 min was used at maximum temperature (750 °C), before the cooling stage. Densities of the as-sintered samples (discs of 10 mm large and almost 3 mm thick) were measured using the Archimede’s principle. As for the powders, the as-sintered samples were also characterized by SEM and XRD and their magnetic properties were measured. The samples were mechanically polished using SiC paper for coarse grains, then diamond suspension and super-finished using 50 nm colloidal silica suspension. In order to show eventual porosities, the super-finition stage was long (20 min). Vickers hardness of the polished specimens was measured using a hardness tester (Zwick/Roell) with a load of 200 g at a holding time of 10 s. At least nine measurements were performed to obtain the average value of the hardness. Additionally, micro-hardness tests were realized on the powder grains under 10 g of load hold for 10 s. The powder was mounted by mixing it with resin and subsequently polished. The compressive properties at room temperature were measured by a SHIMADZU AGX-V (Shimadzu Corporation, Kyoto, Japan) testing machine at a speed of 0.1 mm/min, and the corresponding fracture surface features were observed by SEM.
Alternative hardness and elastic modulus were made by nanoindentation techniques in order to characterize the alloy and the constitutive phases. Nanoindentation experiments were performed using an Anton Paar UHT ultra nanoindenter (Anton Paar, Graz, Austria). Berkovich tip has been used. Its shape area function has been calibrated using fused silica. Indentation at constant F(t)/F(t) = 0.05 s−1 has been chosen, where F(t) is the load on the indenter at the instant t. Maximum loads of 1 and 45 mN were applied. A sinusoidal signal has been superimposed during the loading stage of the indentation in order to proceed to continuous stiffness measurements [20]. The frequency of the signal is 5 Hz and the amplitude is 10% of the applied load, F(t). Fourteen indentations at 45 mN for global characterization purposes were done. In order to characterize the different phases, 144 indentations at 1 mN were performed and the results were post-processed using statistic methods. Hardness and elastic modulus were evaluated following the Oliver and Pharr method [21]. A Poisson’s ratio of 0.3 was considered for these calculations.

3. Results and Discussion

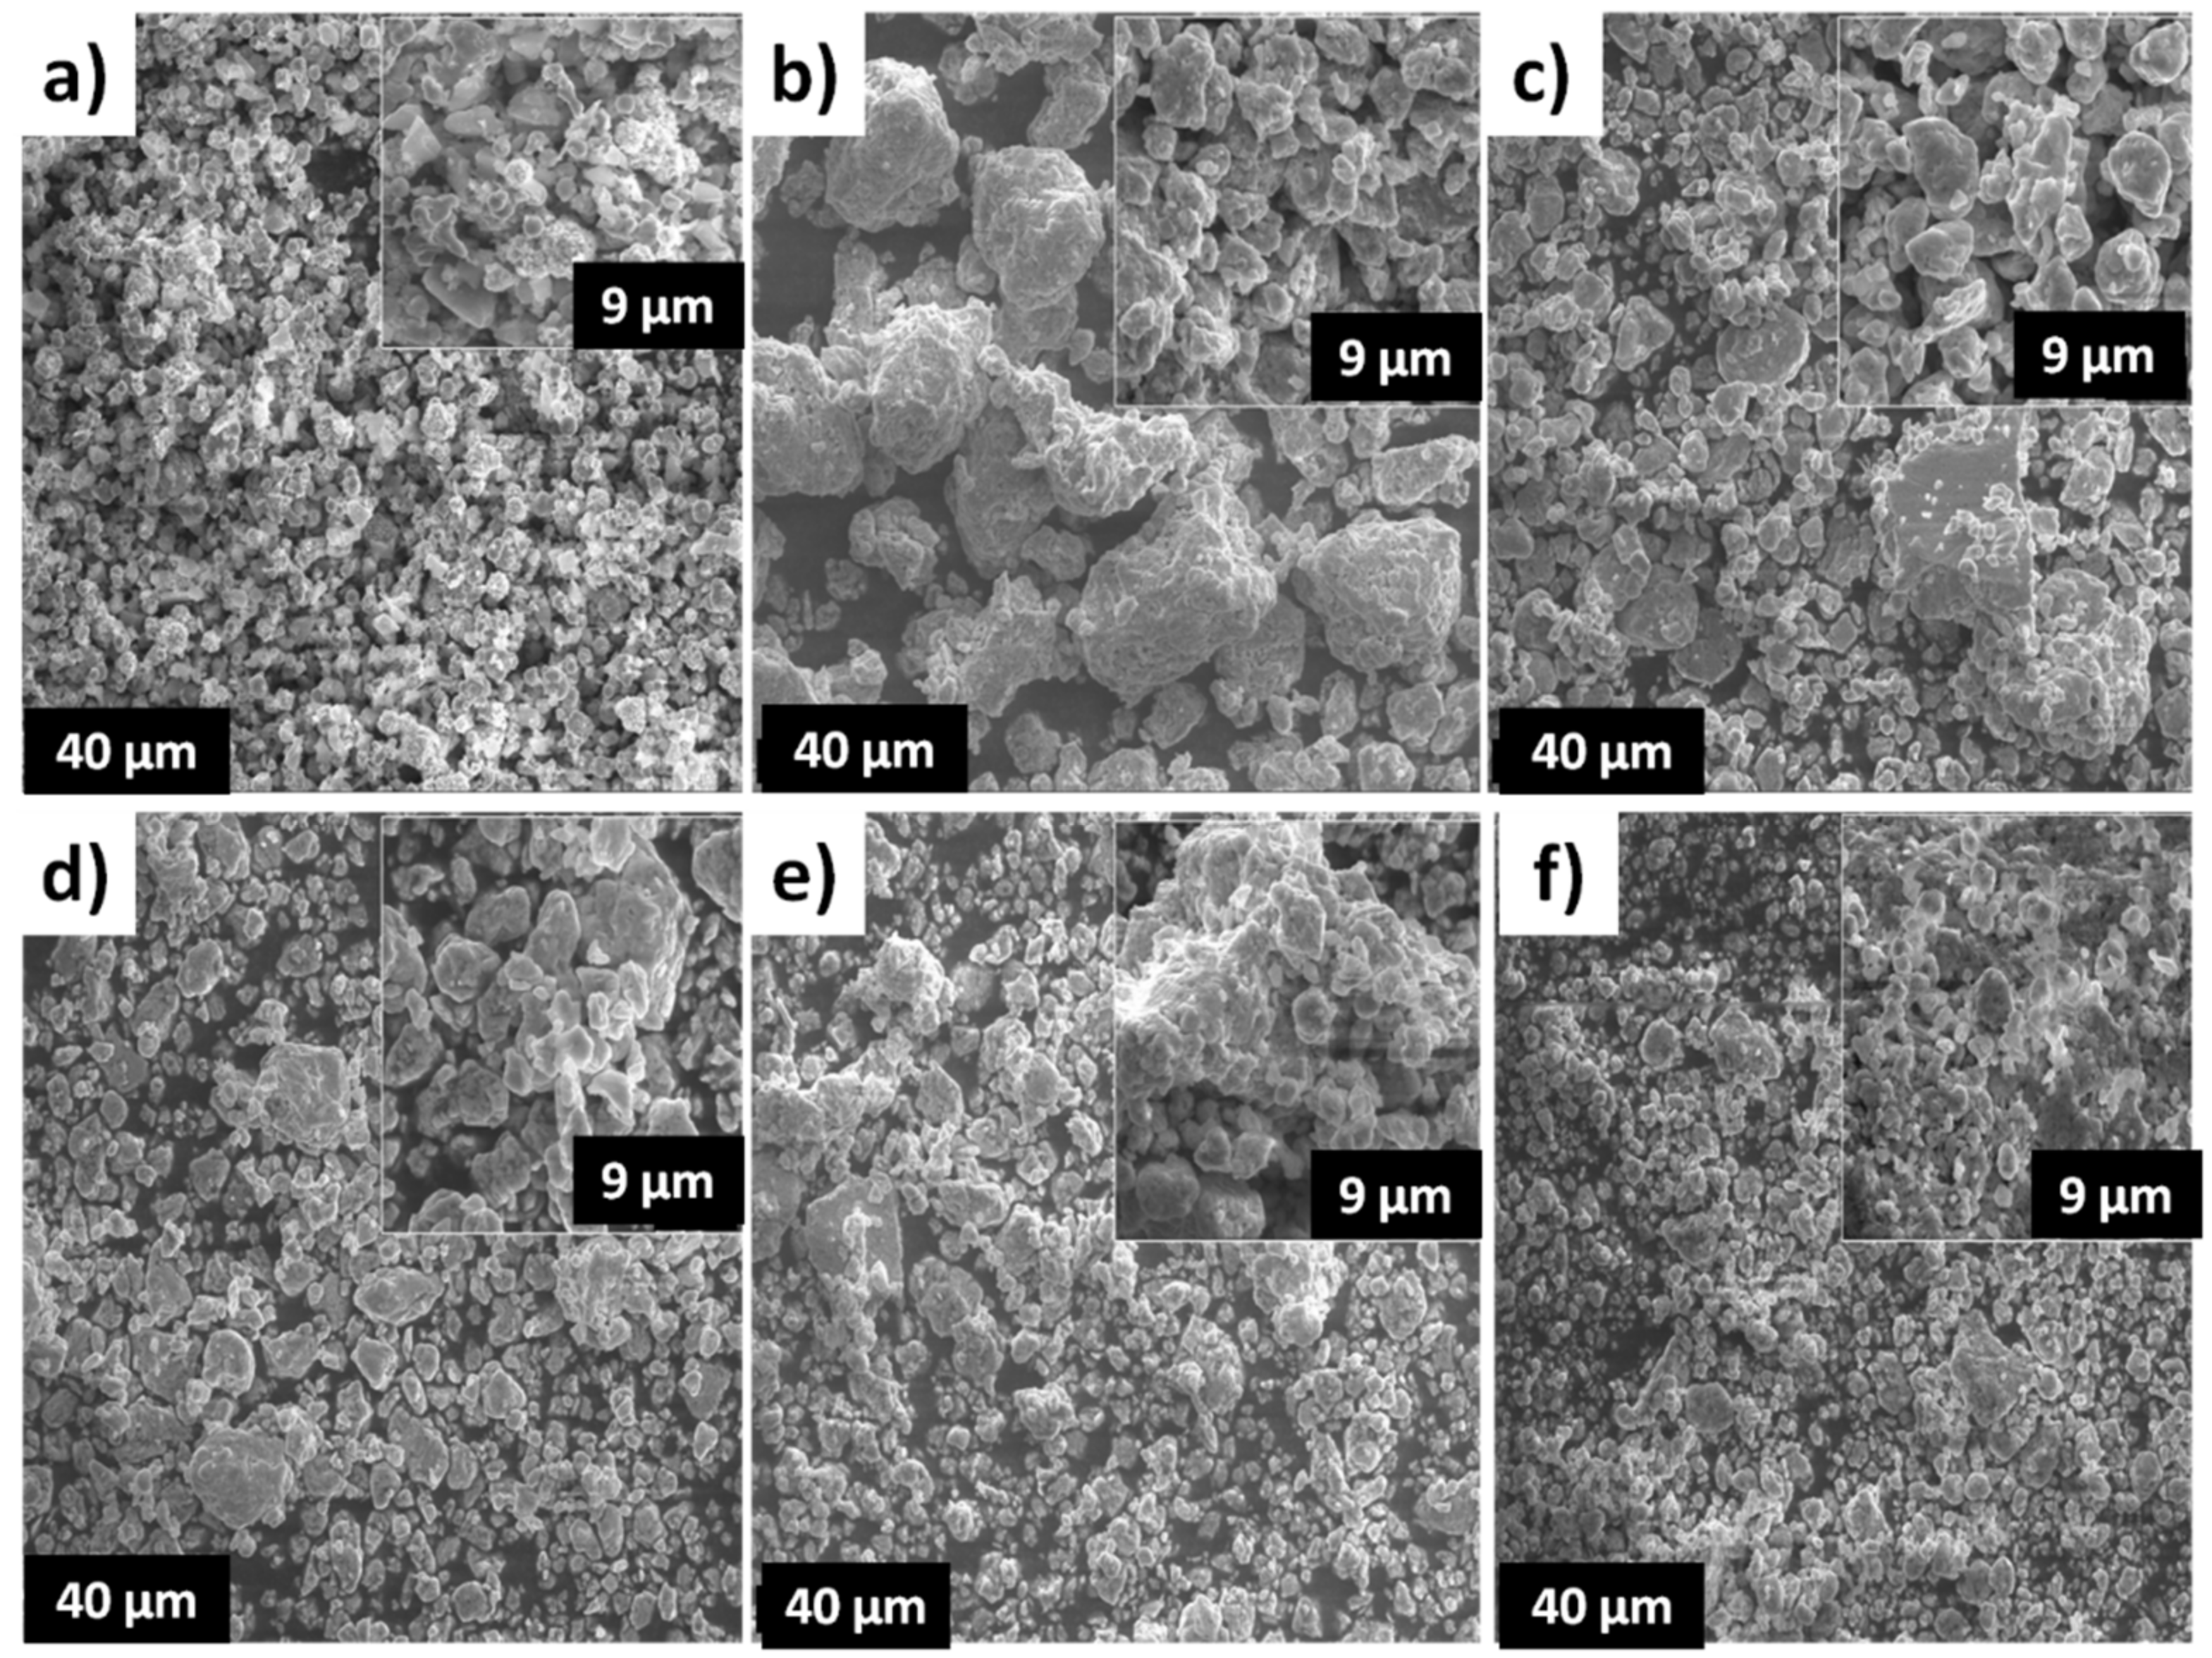
3.1. Morphological Changes

Figure 1 shows the morphological evolution of the alloyed powders at different stages of milling. The un-milled particles are just mixed, and no notable deformation is observed (Figure 1a). Milling for 5 h (Figure 1b) changes the original morphology completely, due to the severe plastic deformation and sequential force of the ball-powder-ball collisions into the particles. So, the cold-welding effect is dominant. This facilitates the diffusion of atoms and then the alloying process takes place. Up to 25 h of milling, divided particles with more uniform sizes and other flattened ones are observed [22] (see Figure 1c). By prolonging milling time after 50 h, the majority of particles became rounded and the homogeneity of the powder is visible. Therefore, a balance between fracture and cold welding is reached [23] (Figure 1d). With increasing milling time, the particles became smaller (Figure 1e) and reached a finer structure at the end of the milling (Figure 1f).

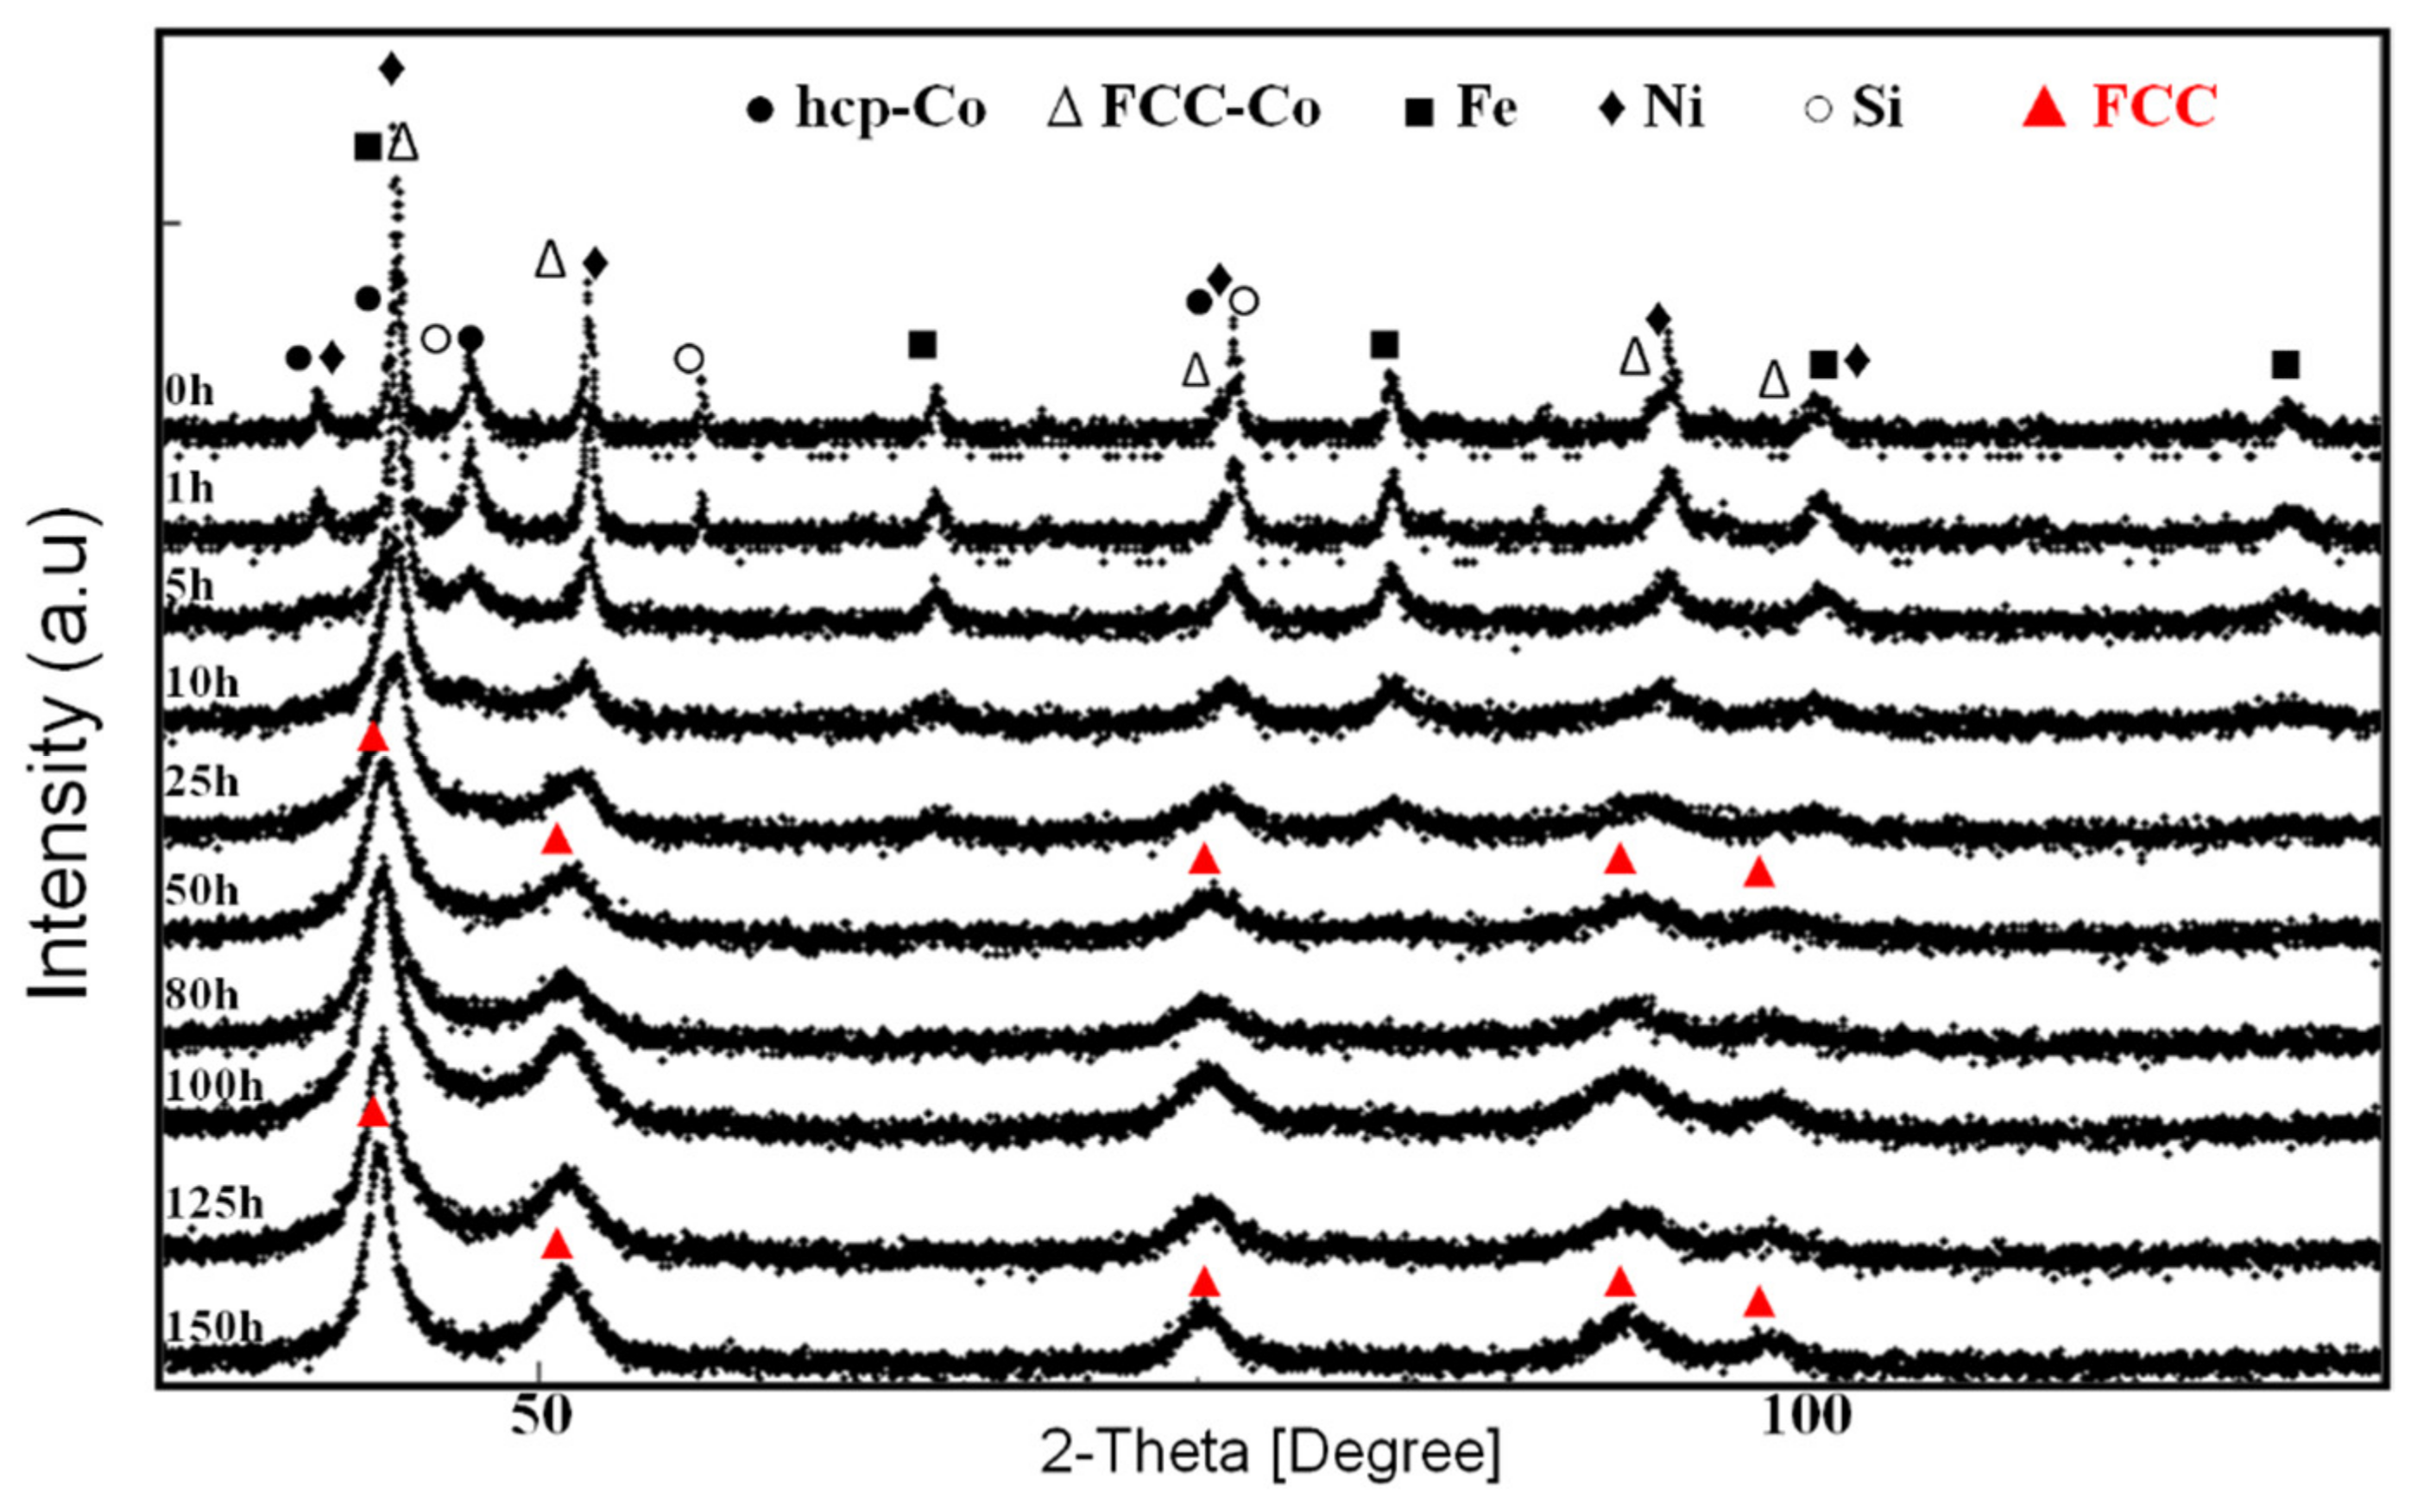
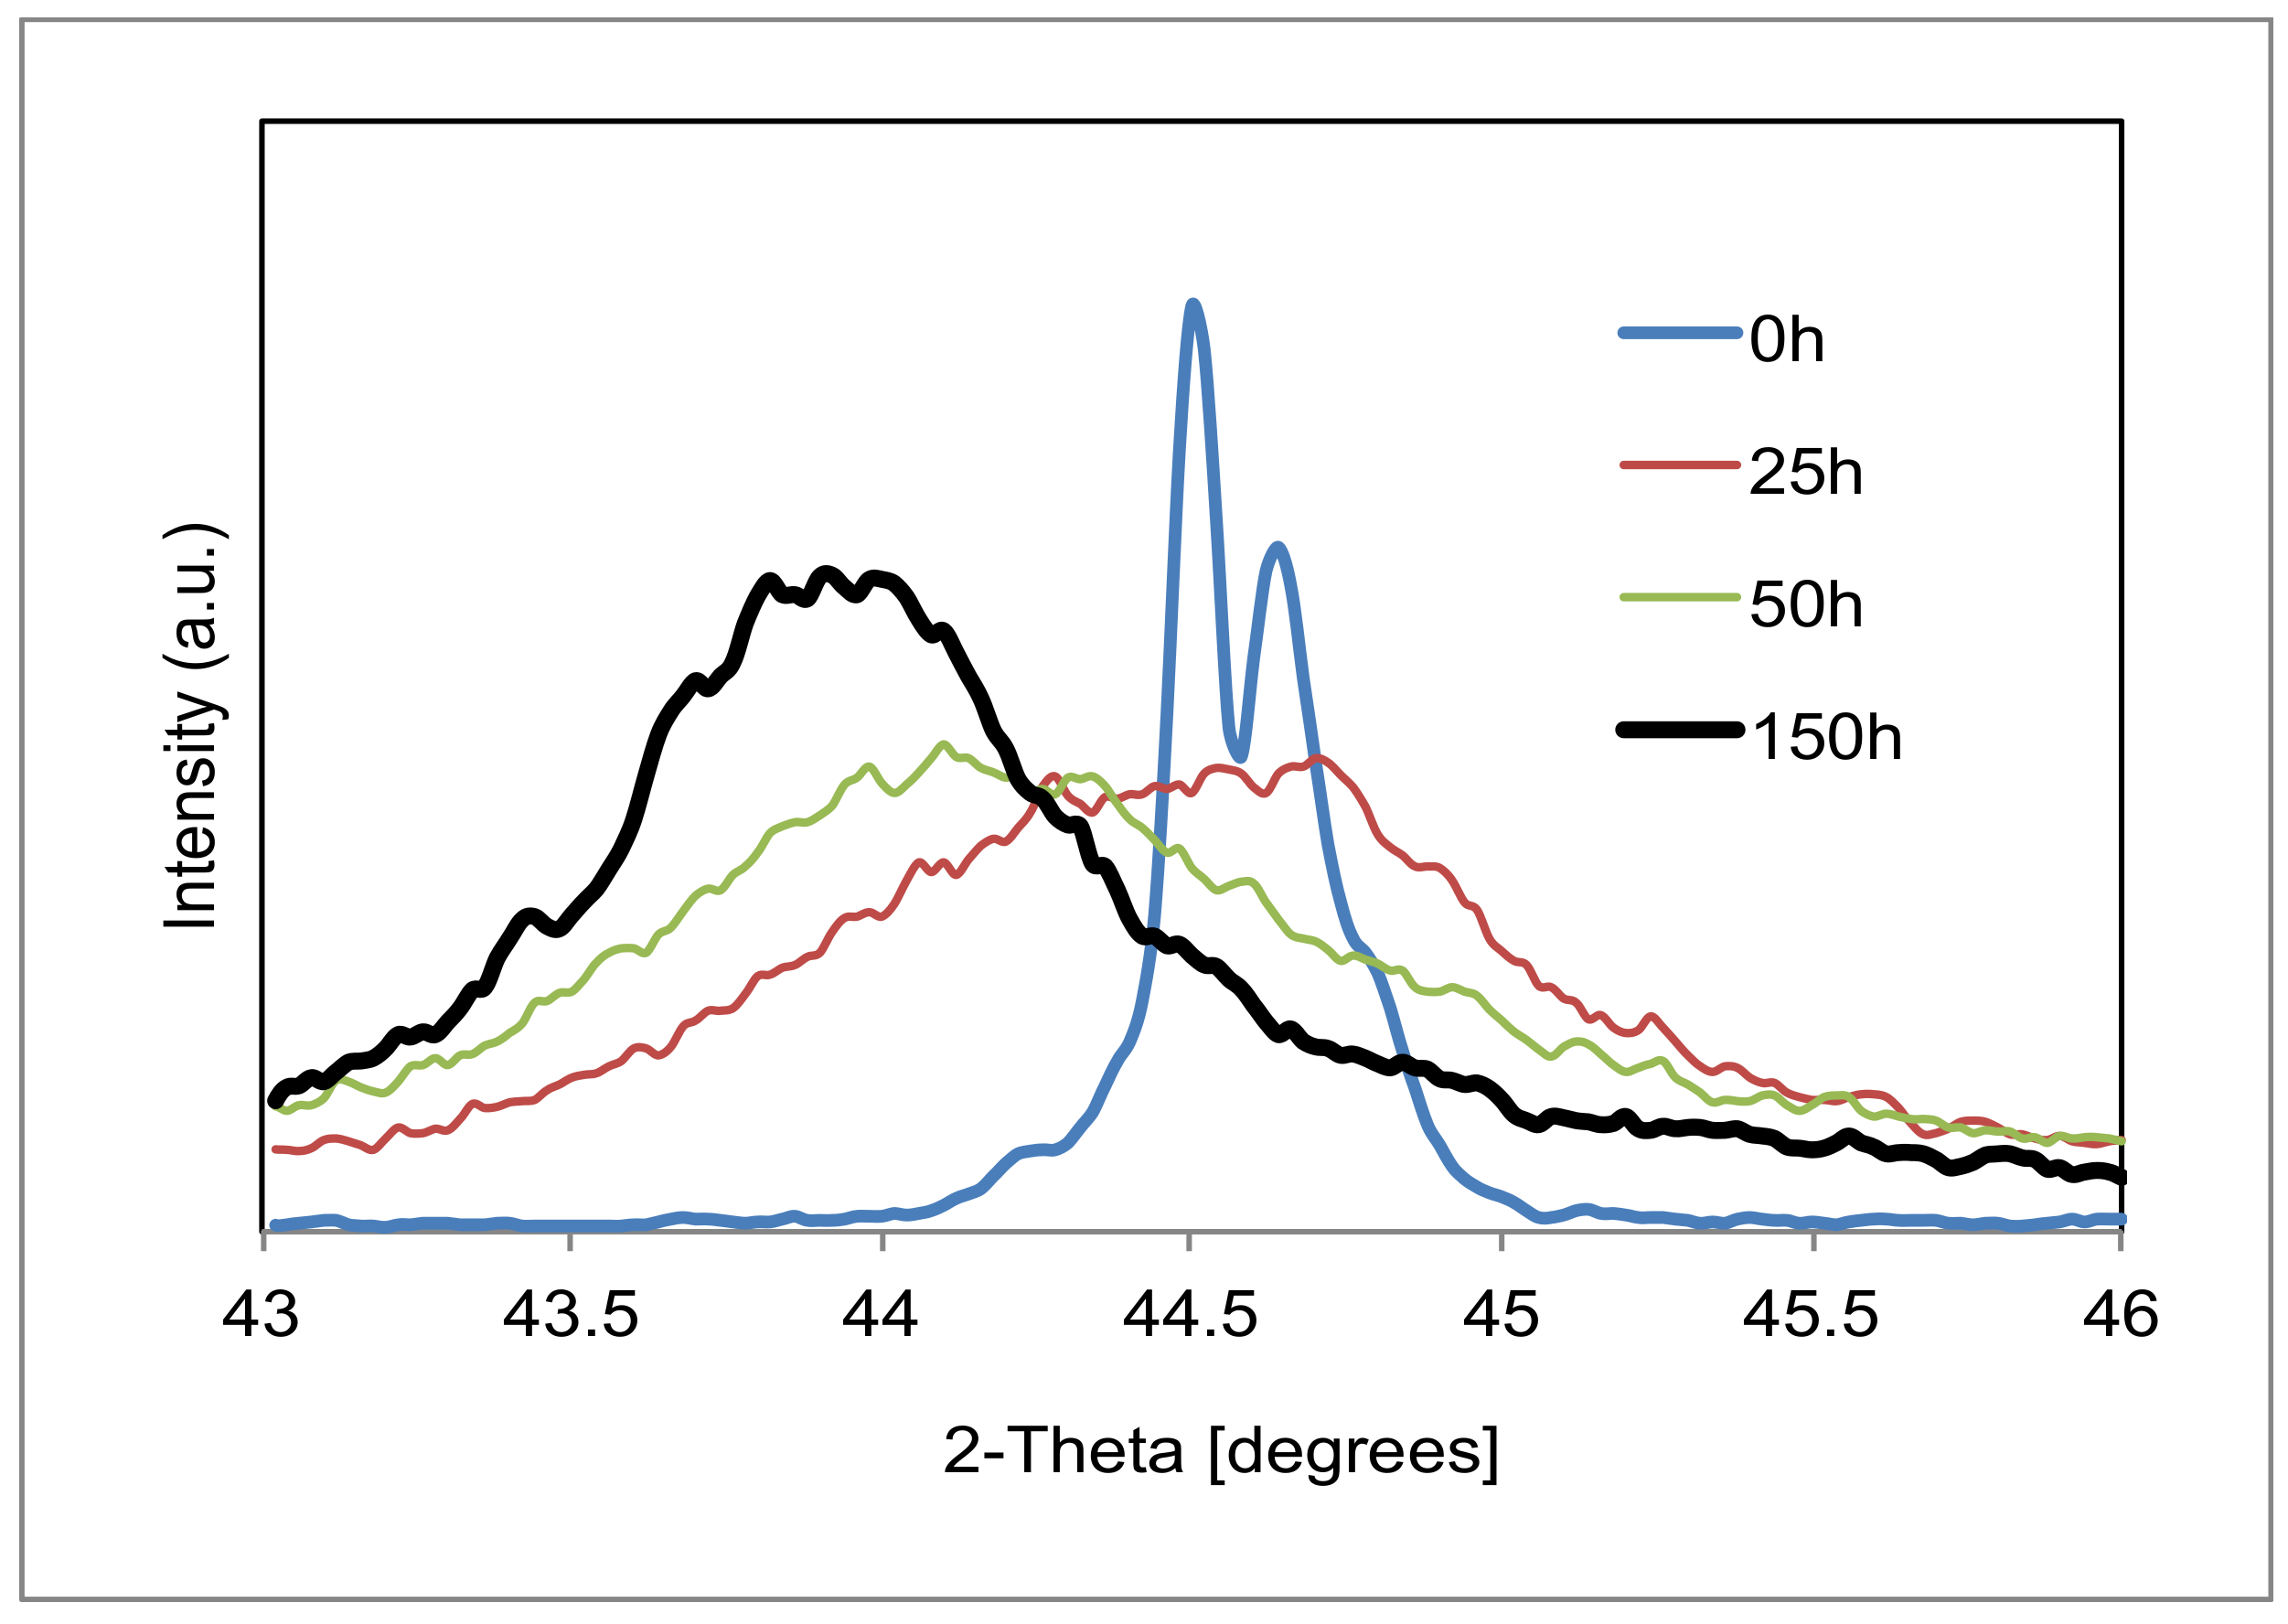
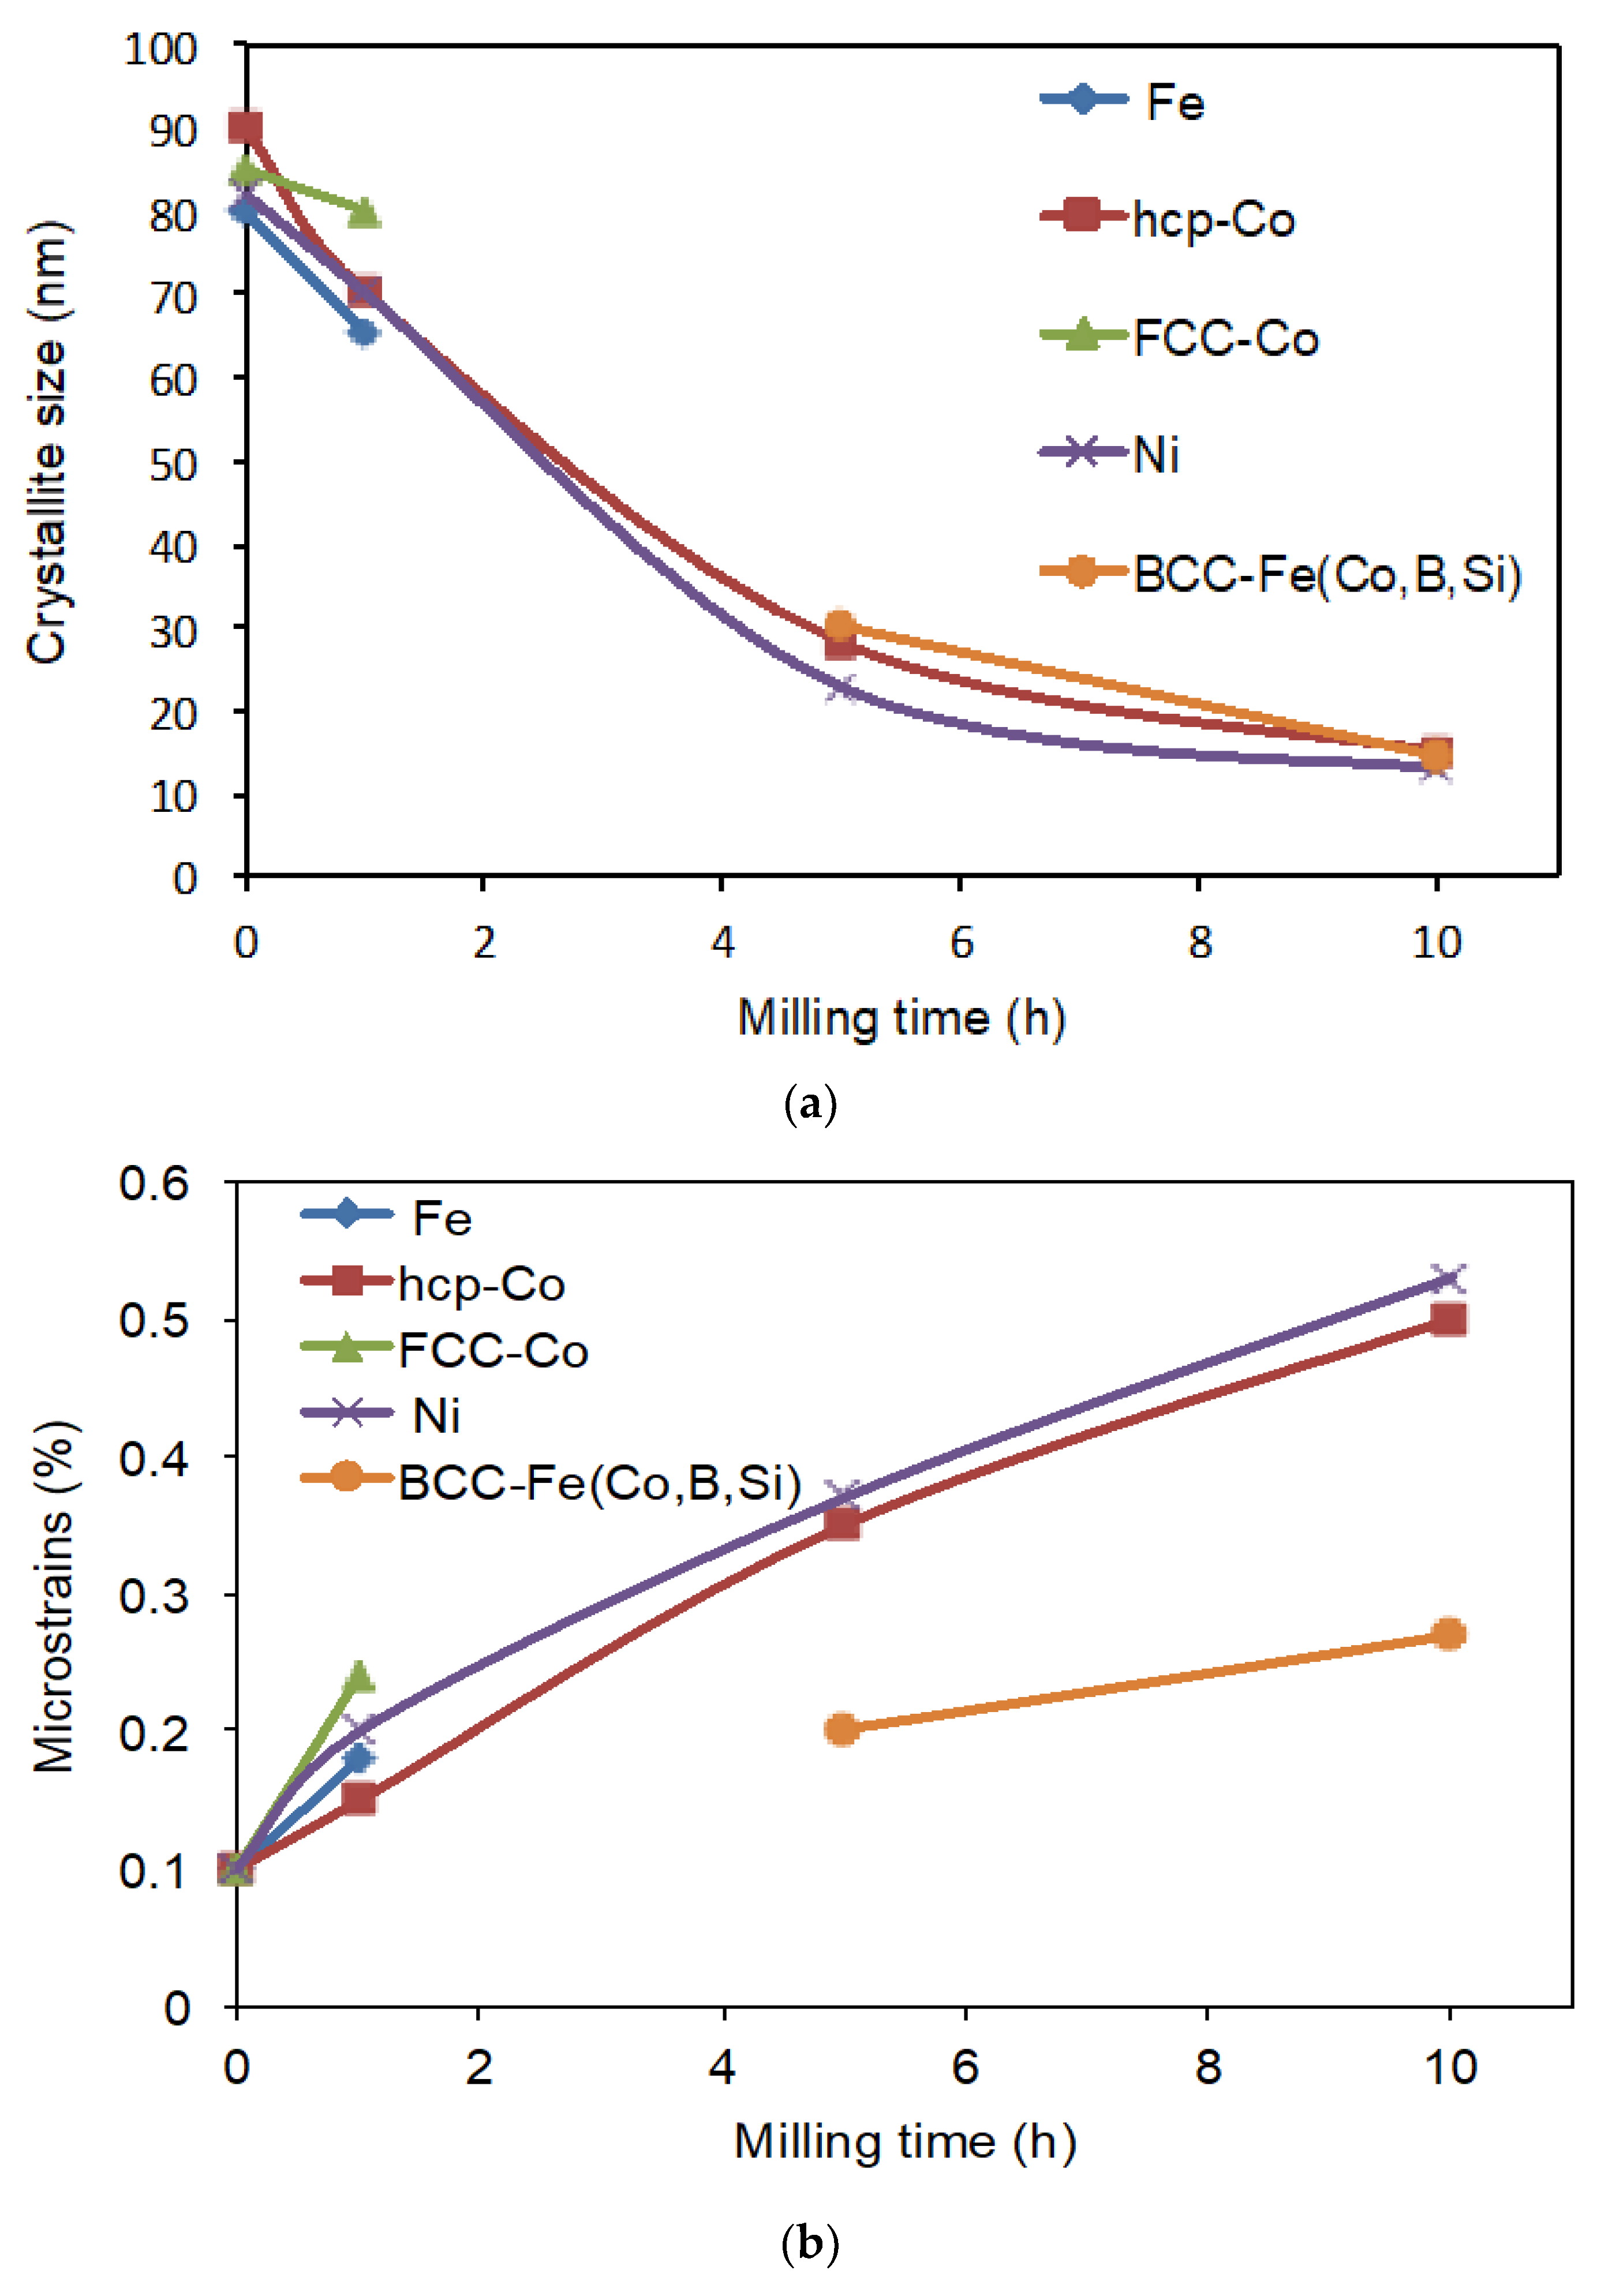
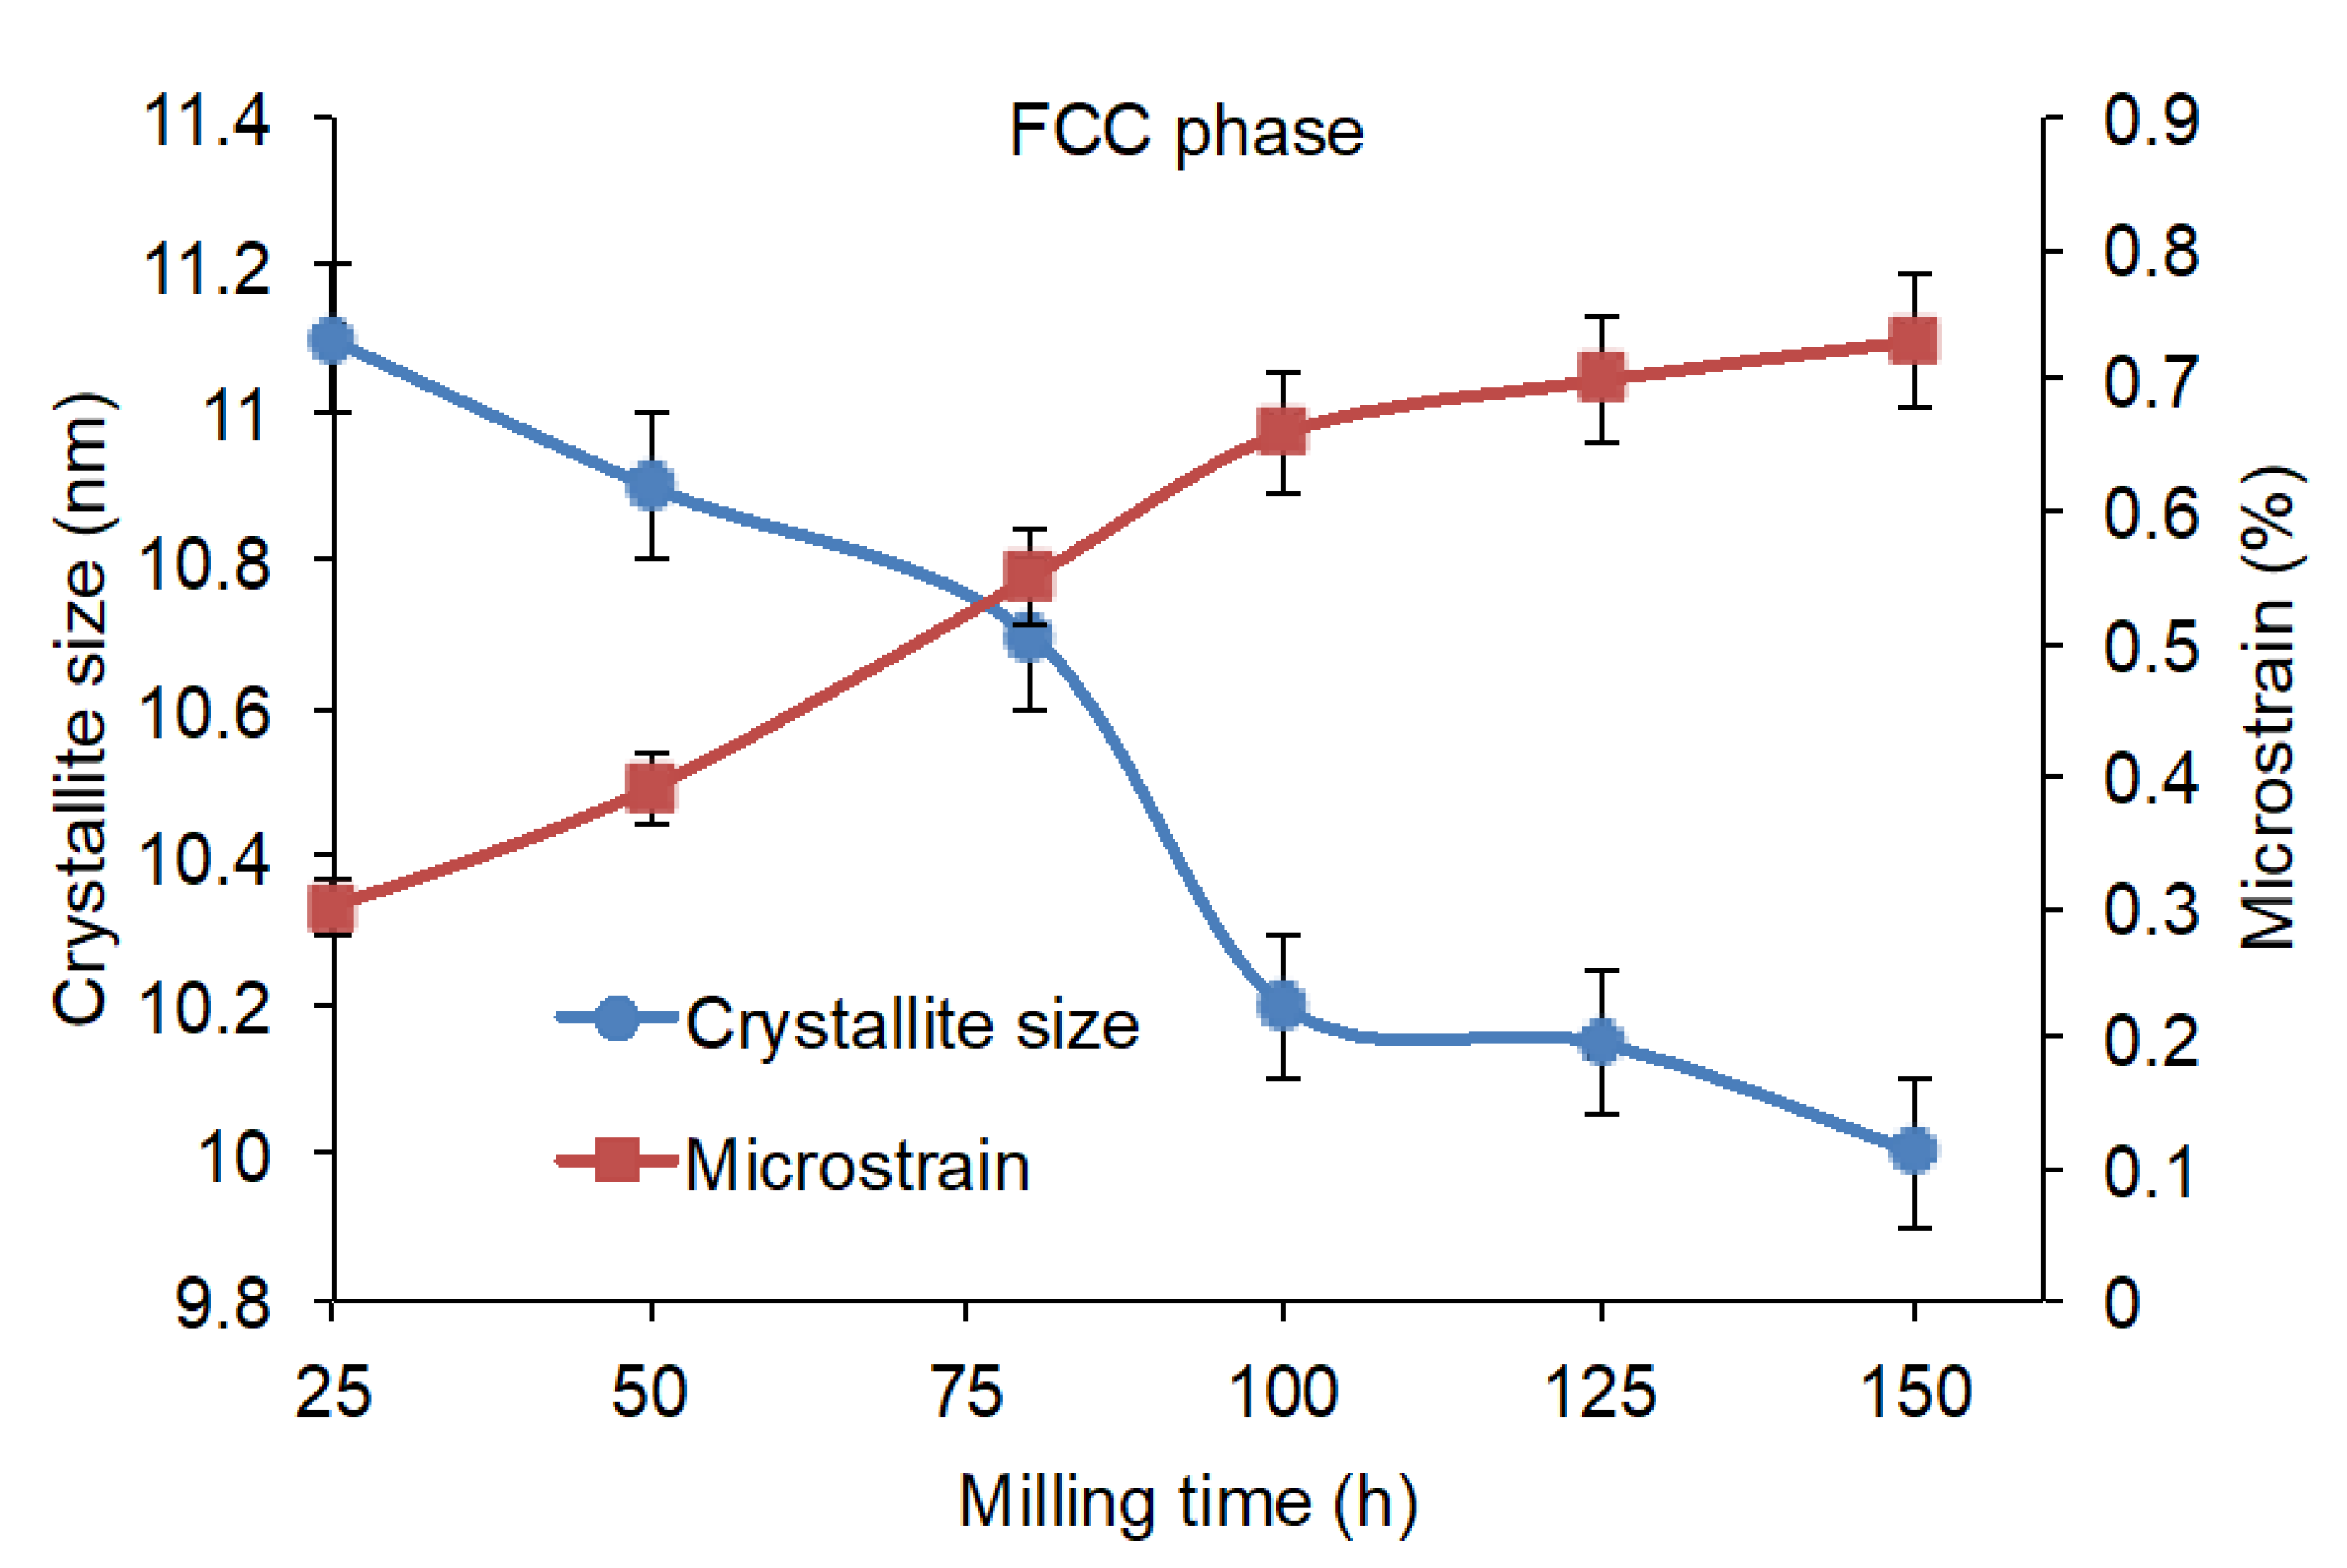
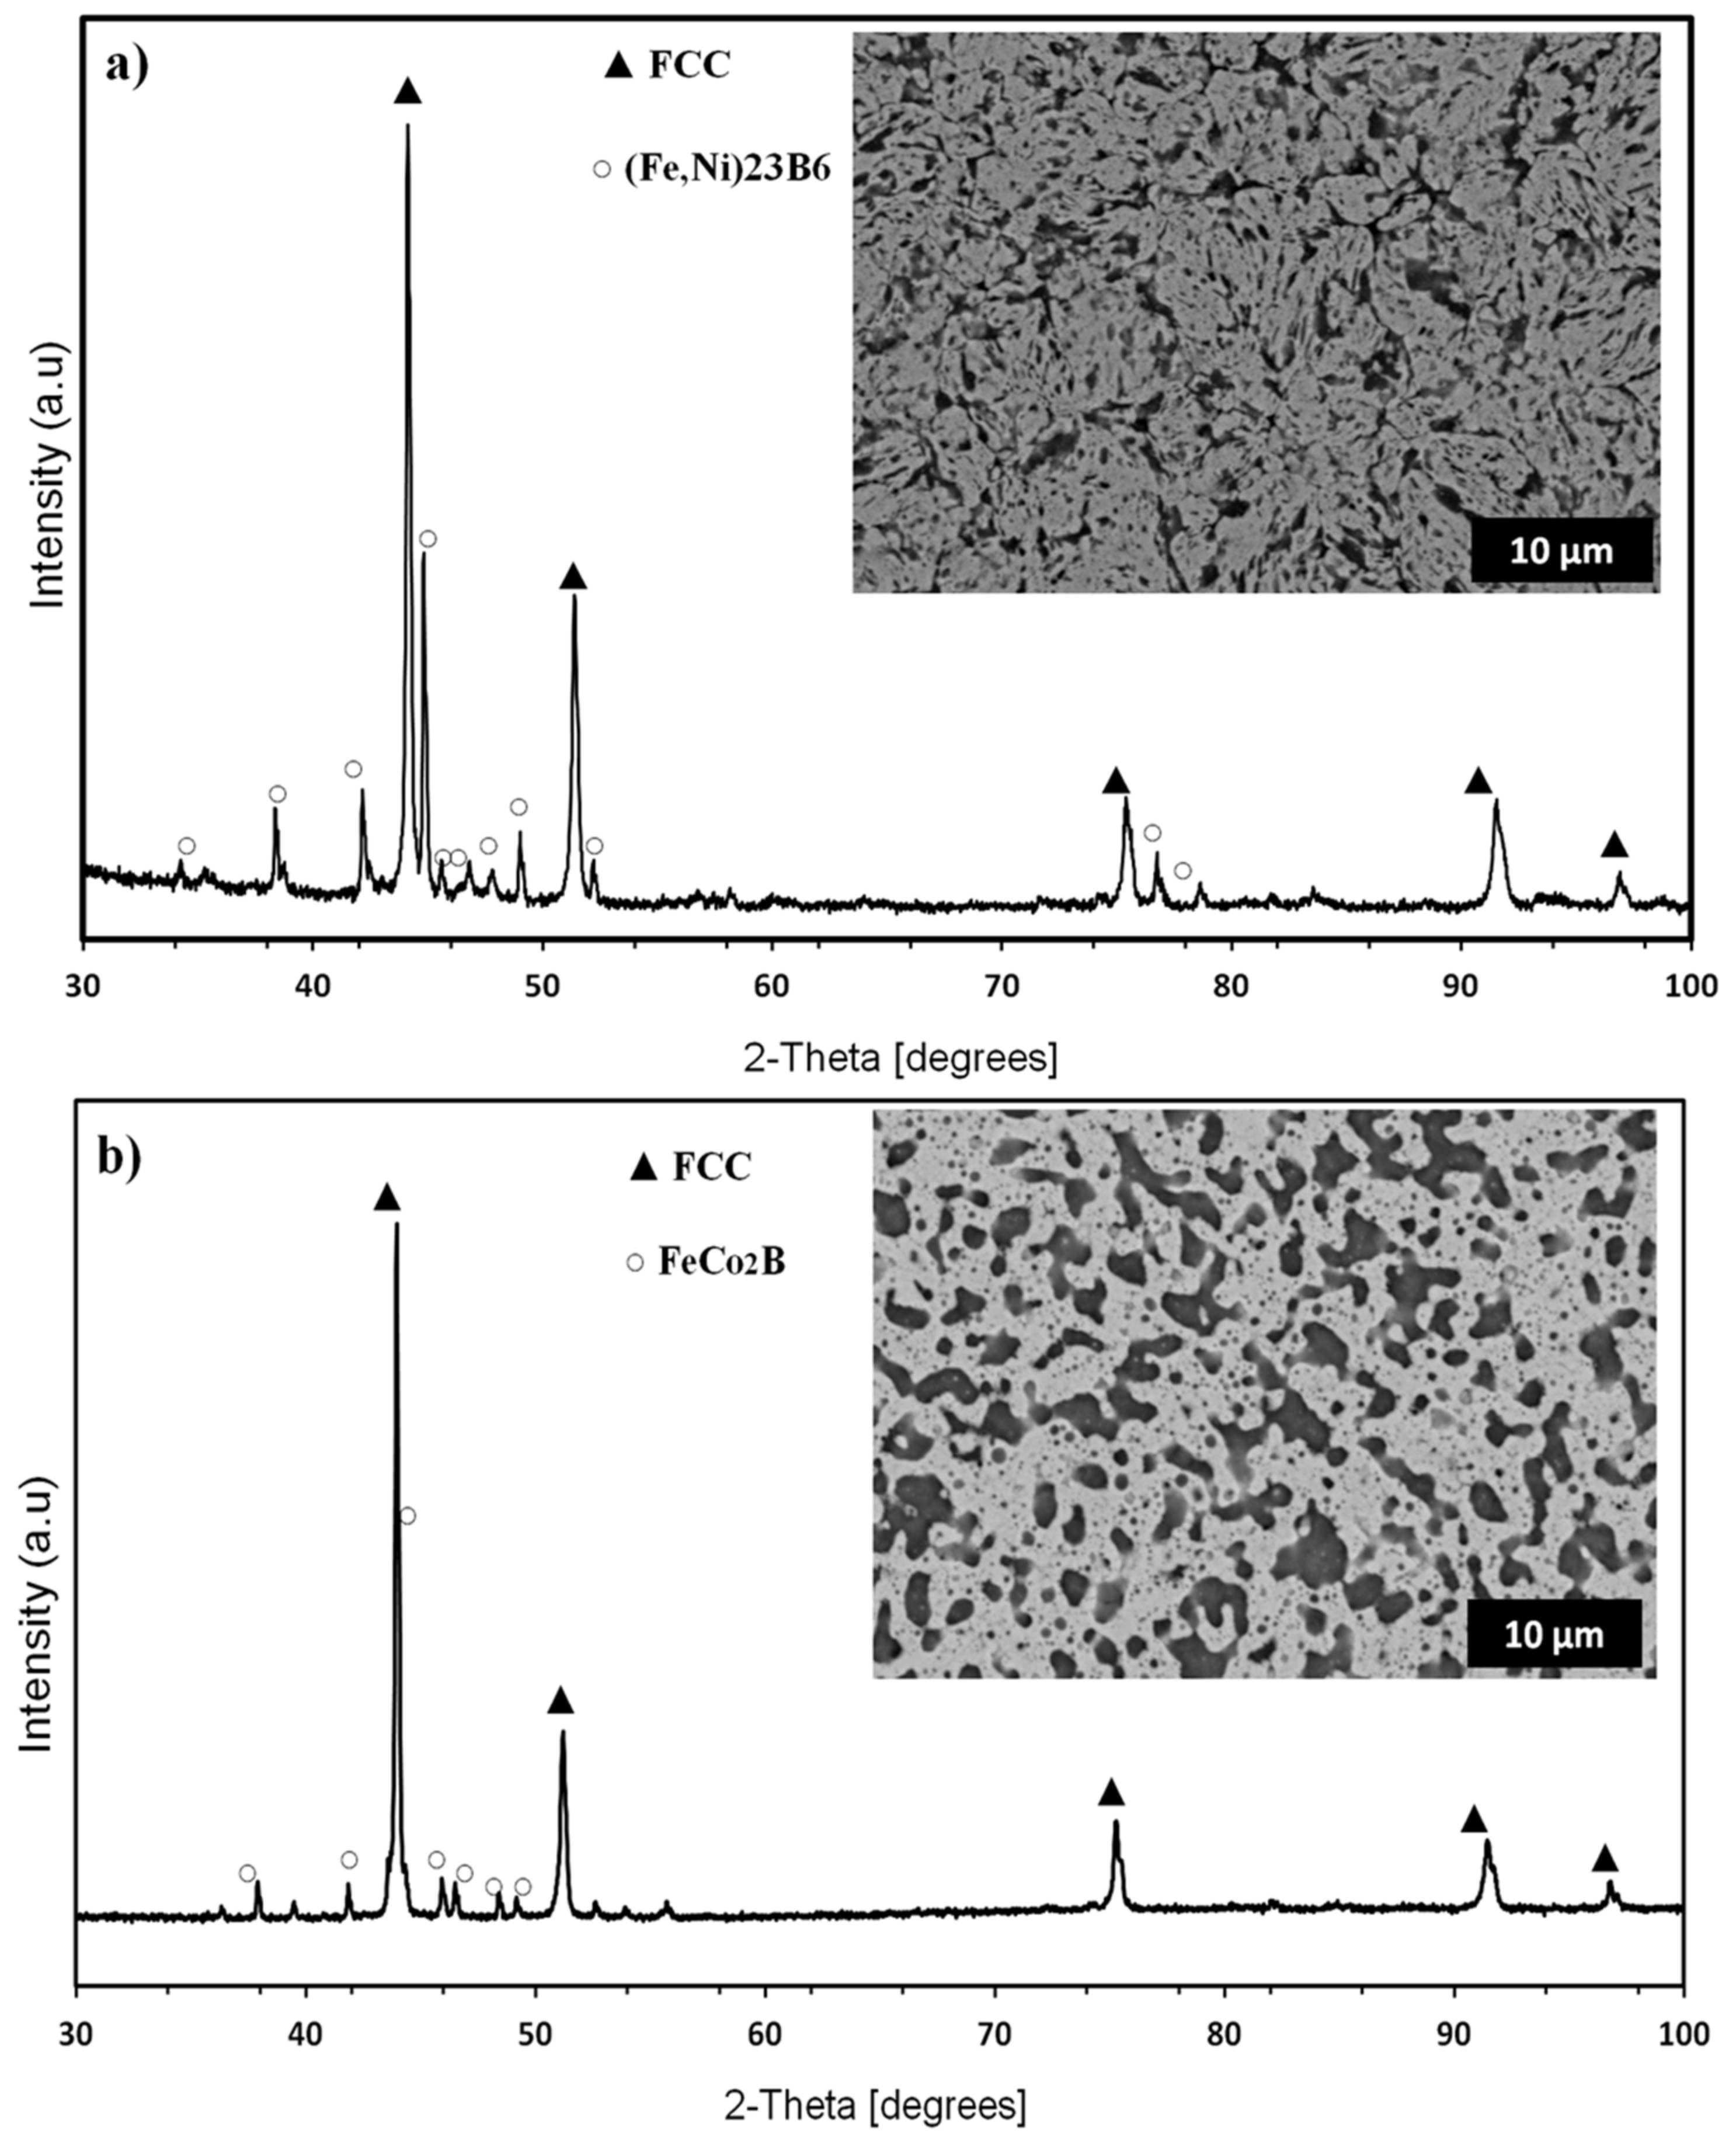
3.2. Structural Changes

Figure 2 and Figure 3 show the XRD patterns of the FeCoNiB0.5Si0.5 high-entropy alloy powders after different milling times. All characteristic peaks for elemental powders can be observed in the XRD pattern of the un-milled powder. Cobalt presents two allotropic structures, face-center cubic (FCC) and hexagonal close-packed (HCP). The characteristic peaks for boron are not observed because amorphous boron powder was used in the present work. The peaks’ intensity decreased dramatically after 5 h of milling. The disappearance of the FCC–Si and FCC–Co diffraction peaks was observed. Some authors noticed the allotropic transformation of Co from FCC to HCP structure during milling [24,25]. In addition, the FCC–Co becomes unstable when mechanical energy is introduced [26]. Peaks are getting broader and some peaks (HCP–Co phase) disappear after 10 h of milling. After 25 h, the HCP–Co peaks completely vanished. The decrease and the broadening of peaks during milling are due to the crystallites’ refinement and to the increase of dislocations density [27]. In addition, the most intense diffraction peak of the primary body-centered cubic BCC–iron phase became asymmetric. The asymmetry of the peak is due to the gradual disappearance of the BCC phase and to the appearance of the FCC solid solution. Shift of the Fe peaks (compared to the reference un-milled powder—0 h) toward smaller angles suggests the increase of the lattice parameter, which can be attributed to the lattice expansion induced by the diffusion of B, Si, Co and Ni into the iron matrix, leading to the cohabitation of BCC and FCC solid solution after 25 h (see Figure 3). On one hand, the interdiffusion of the Ni and Fe leads to the formation of a new FCC phase with a lattice parameter superior to the FCC Ni phase [28]. So, the FCC phase is a result of the diffusion of Fe, Co, B and Si in the Ni matrix. As the milling time reaches up to 50 h, only the peaks characterized by a FCC solid solution phase are evident, while the BCC iron peak vanishes. The significant shift of the peak to 2θ = 44.1° after 50 h indicates the disappearance of the BCC phase (see Figure 3). Thus, the structure of the solid solution can be indicated as supersaturated solid solution. In fact, the solid solubility can be extended due to the interdiffusion between the multiple components, which occurs throughout the prolonged milling. During milling, the grain became refined with nanometric crystallites, and then a large amount of enthalpy can be stocked in nanocrystals alloy because of the high density of defects and the wide grain boundary domain (high density of grain boundaries) [29]. Hence, the formation of solid solution can be enhanced by the energy stoked in the grain boundaries and distorted crystallographic lattice. In addition, the surface tension of nanometric grains can provoke the distortion of the lattice, which can enhance the solubility.
Chen et al. [30] reported that the alloying rates of elements with similar concentrations are inversely proportional to their melting point. The lower the melting point of the element, the higher its diffusivity in the solid state [31]. For the elements with similar melting point like Cobalt (1768 K) and Nickel (1726 K), the alloying rates are in proportion with the brittleness of the pure element [30]. Moreover, the lower the concentration of the element, the higher its alloying rate [32]. Hence, the diffusion sequence of elements for the FeCoNiB0.5Si0.5 HEA should be: Si → B → Co → Ni → Fe.
We can conclude that only a BCC Fe–Co–B–Si supersaturated solid solution (with a slight increase of the lattice parameter compared to BCC–iron) is formed during the first 10 h of milling. After 25 h of milling, the inter-diffusion of the Ni and Fe leads to the coexistence of a mixed BCC and FCC supersaturated solid solution [28]. Continuous milling up to 150 h produces shifts of the FCC peaks to smaller angles besides the decrease of their intensity as well their broadening (Figure 3). Thus, we can deduce the formation of supersaturated solid solution at this stage of milling.
The lattice parameters obtained by fitting using Maud software are given in detail in Table 1. The lattice parameter of the BCC phase increases with increasing milling time due to the insertion of B (RB = 0.82 Å) atoms in the interstitial sites. Izadi et al. [33] noticed similar observations: the substitution of Fe atoms by Si (RSi = 1.15 Å), Co (RCo = 1.25 Å) and Ni (RNi = 1.24 Å). As for the FCC lattice parameter, its increasing is due to substitution of atoms in the Ni matrix and the inter-diffusion between the Fe and Ni atoms.
Figure 4a shows the crystallite size with respect to the milling time. The crystallite size and microstrain of the alloy powders after different milling times were calculated from the XRD patterns by fitting using Maud software (the goodness of fit and the fit parameters are listed in Table 1). With increasing milling time, the crystallite size of all elements as well as the newly formed BCC–Fe (Co,B,Si) supersaturated solid solution decreases rapidly in the early stages of milling. The segregation of the boron atoms to the grain boundaries hindered the grain growth of the BCC phase [34]. As a result, the dissolution of boron diminishes the crystallite size remarkably.
Figure 4b shows the internal microstrain evolution during the milling. The internal strain increases with the milling time. The micro-stress can come from several sources in crystallites such as vacancies, multiplication of the dislocations and other defects [35]. After 10 h, the BCC phase exhibits a crystal size of 14 nm and a lattice strain of 0.3%. The increasing internal microstrain is due to the size mismatch between the initial elements, the increase of grain boundary fraction and the high dislocation density produced by the severe plastic deformation [36,37].
Figure 5 shows the evolution of crystallite size and lattice strain of the formed FCC Fe–Co–Ni–B–Si supersaturated solid solution as a function of the milling time. When the FCC solid solution cohabitates with a BCC Fe–Co–Ni–(B,Si) solid solution (after 25 h), the crystallite size is 11 nm for a microstrain of 0.3%. After 50 h, the FCC solid solution remains the single phase with a crystallite size of about 11 nm and a microstrain of 0.4%. The lattice strain of the FCC phase increases with the milling time. The 150-h milled powder reveals a lattice strain of 0.7%. The crystallite size seems to decrease slightly but constantly with the increasing milling time to reach 10 nm at the end of the milling.

Thermodynamic Considerations

From a thermodynamic point of view, the high entropy of mixing ΔSmix can notably decrease the Gibbs free energy of mixing ΔGmix, even at low temperatures. It has been reported, however, that entropy or free energy considerations only cannot always explain the formation of solid solutions. Indeed, amorphous phases and intermetallics can form as well in HEAs systems [38,39,40]. Thus, counting on the effect of ΔSmix only is not enough to predict the formation of solid solution in HEAs. Based on the mixing entropy ΔSmix and the mixing enthalpy ΔHmix, Yang and Zhang [41] introduced two parameters to define a criterion for the formation of solid solutions: Ω (ratio between the entropy and the enthalpy of mixing) and δ (atomic size mismatch). They are defined as follows:
Ω = T m Δ S mix Δ H mix
δ = i = 1 n C i 1 r i r ¯ 2
with
Δ H mix = 4 i = 1 , i j n Δ H ij C i C j
Δ S mix = R i = 1 n ( C i ln C i )
T m = i = 1 n C i T m i
where, Δ H ij mix represents the enthalpy of mixing of binary liquids i and j alloys, as tabulated in Table 2, Ci is the atomic percentage of the i-th element respectively, ri is the atomic radius of the i-th atoms, r ¯ is the average radius of all atoms, T m i is the theoretical melting point of the i-th element and R is the gas universal constant. According to Yang and Zhang’s method, Ω ≥ 1.1 and δ ≤ 6.6% should be the criterion for forming solid solution phase. The calculated values of these parameters are given in Table 3. As presented, the condition Ω ≥ 1.1 is not satisfied, while the second condition δ ≤ 6.6% is fulfilled. Thus, according to this theory, the super-saturated solid solutions are not likely to form, which seems to be contradicted by our mechanical alloying results.
On the other side, Guo et al. [2,43] reported that the valence electron concentration (VEC) is an important factor controlling the structure (FCC and/or BCC) of the formed solid solution in HEAs. It is defined as follows:
VEC = i n C i VEC i
where (VEC)i is the valence electron count for the i-th element. According to Guo’s method, sole FCC solid solution can exist if VEC ≥ 8.0, duplex FCC + BCC structures co-existed when 6.87 ≤ VEC ≤ 8.00 and single BCC solid solution appears if VEC < 6.87. The calculated VEC for the Fe25Co25Ni25(B0.5Si0.5)25 HEA is given in Table 3. In our alloy, the VEC value of the mix indicates the coexistence of mixed (FCC + BCC) solid solutions. This agrees only with the alloy milled for 25 h but does not agree with the phase composition of the alloys obtained after longer milling times. However, from 50 h until the end of the milling (150 h), the XRD patterns reveal the existence of sole FCC structure.
Generally, the binary atom-pairs Fe–Ni and Ni–Co have high mutual solubility. Many researchers confirmed the obtaining of a single FCC structure on HEA systems based on the Fe, Ni and Co [44,45]. Thus, it is highly probable that the thermodynamic parameters may not apply accurately within the FeCoNiB0.5Si0.5 HEA case. Thus, the milling time plays a key role in the formation of solid solutions during the mechanical alloying process.

3.3. Thermal Analysis

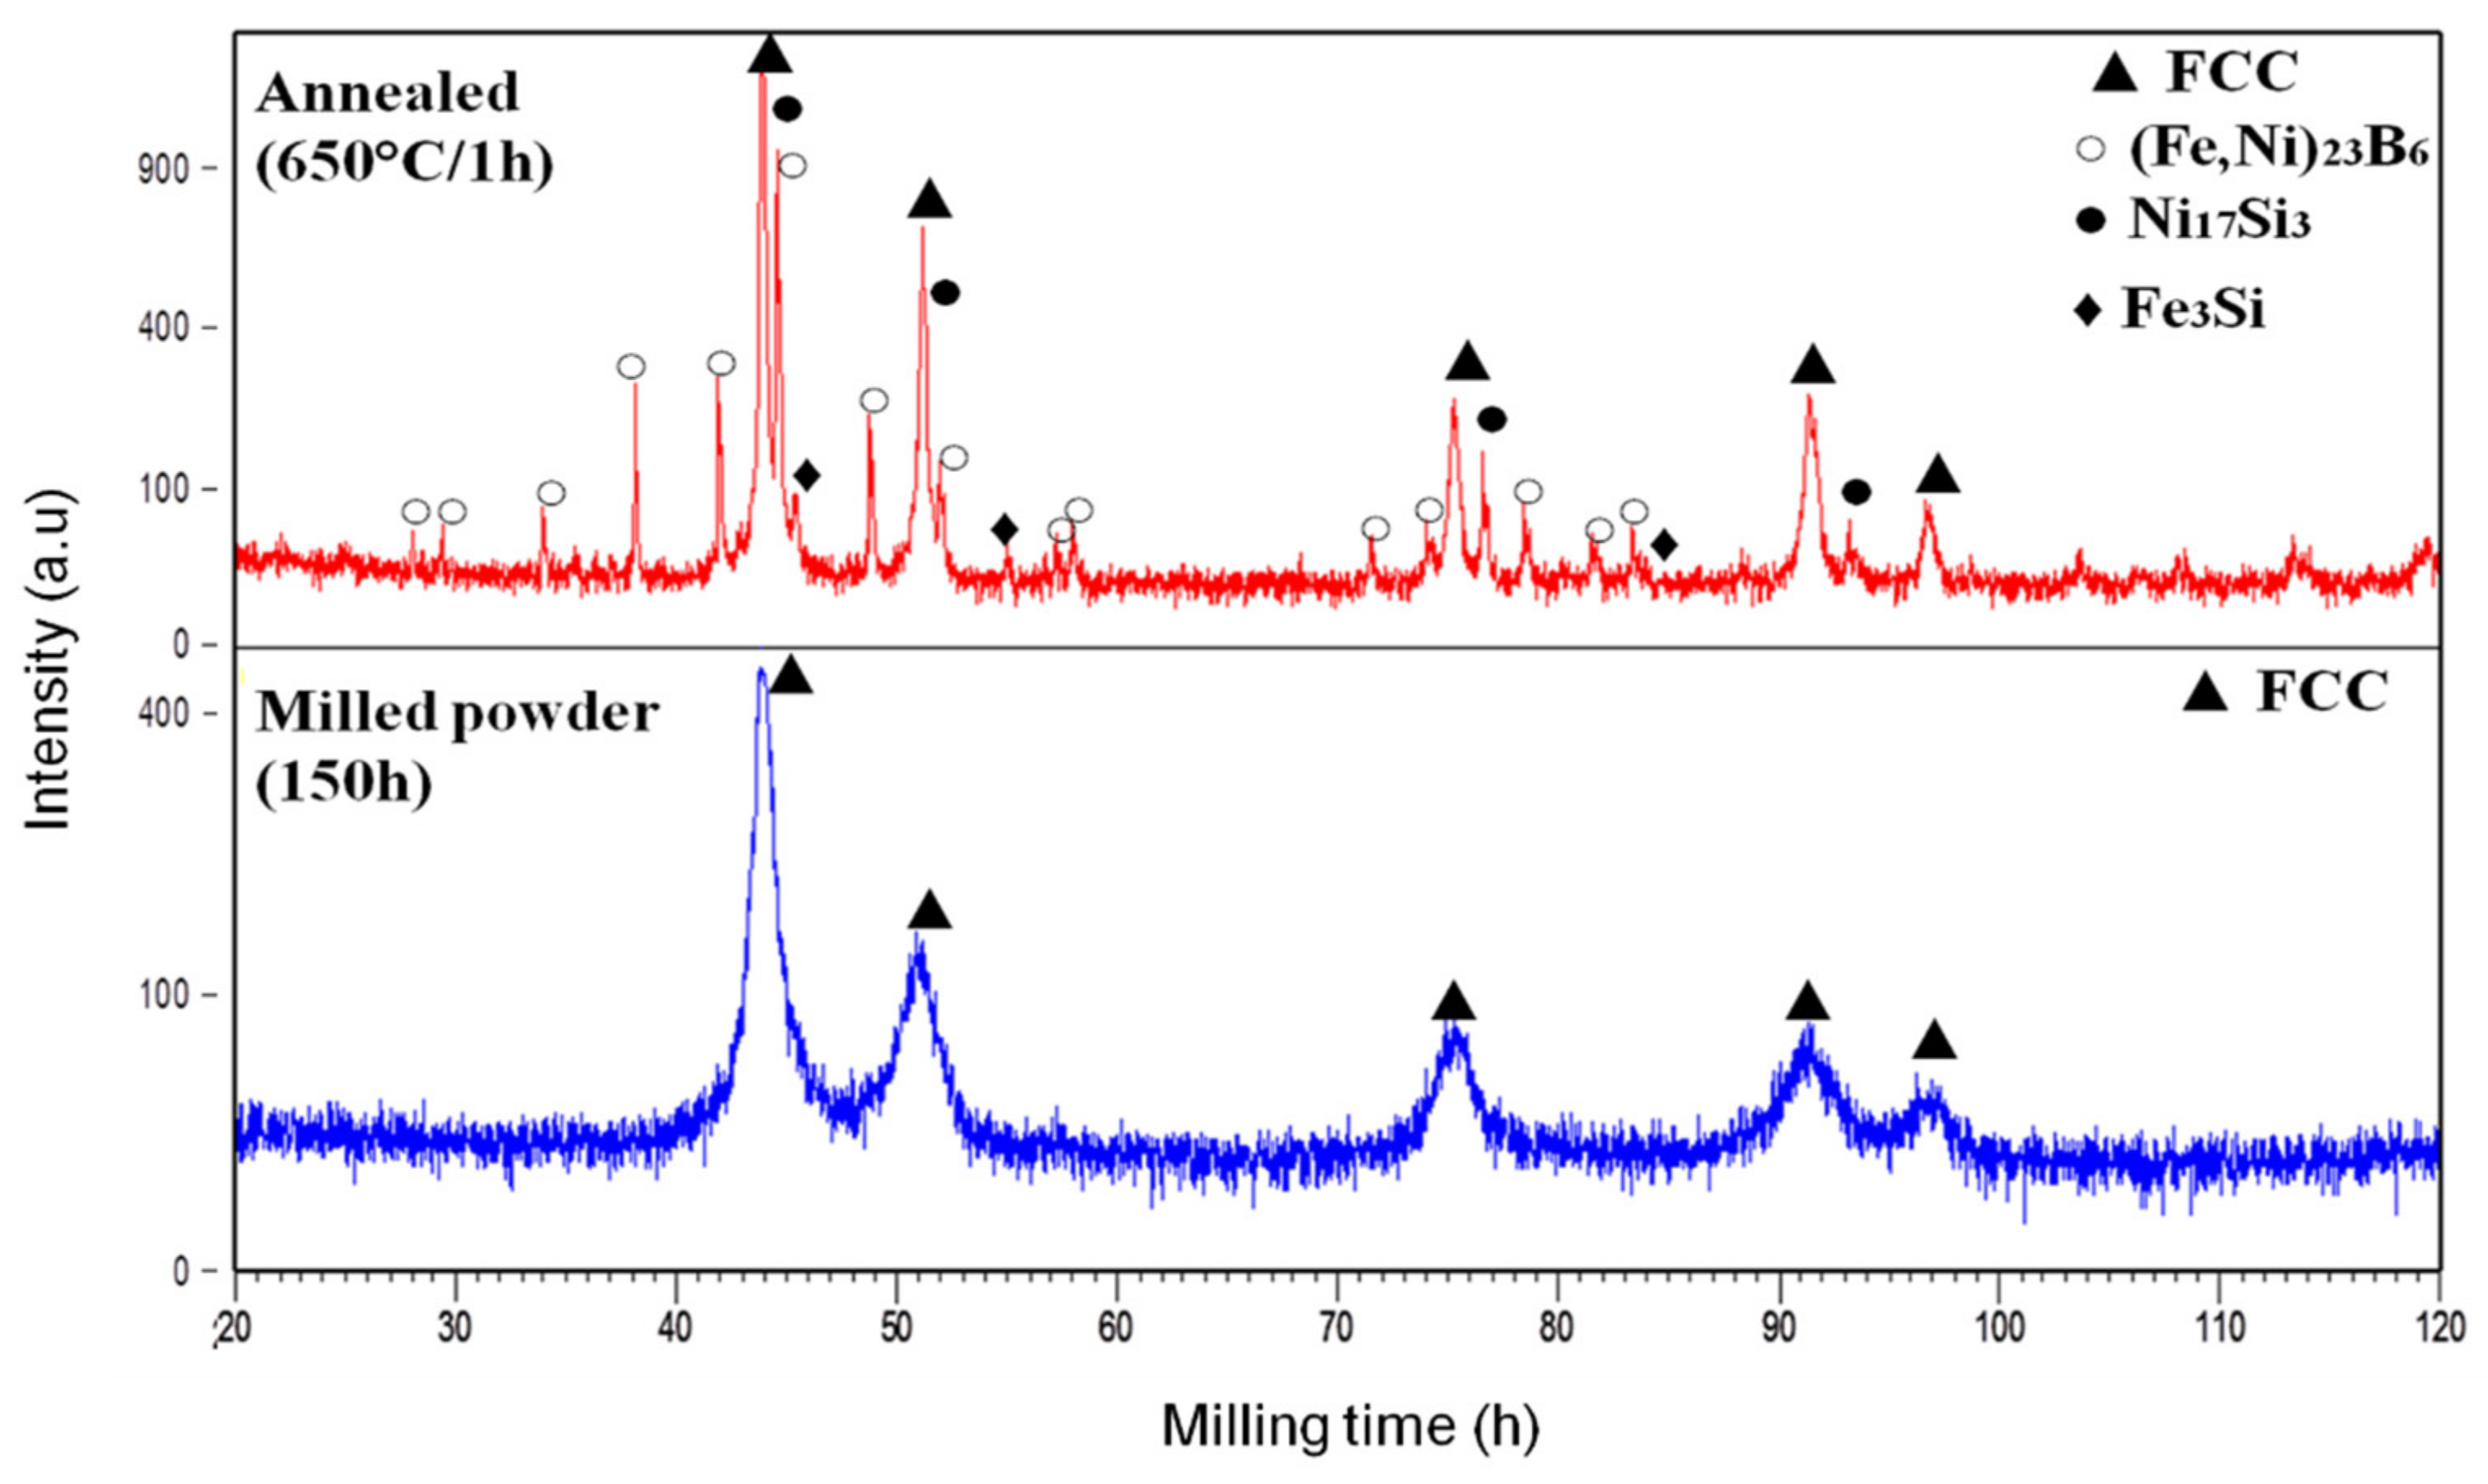
3.3.1. Annealing Treatment

In order to understand the effect of heating on structural and magnetic characterization, the 150-h milled high-entropy alloy powder FeCoNiB0.5Si0.5 was annealed for 1 h at 650 °C under argon atmosphere. The XRD patterns before and after annealing are shown Figure 6. An amount of the FCC solid solution is maintained. Its peak intensity increases due to the crystallite size growth during the heating. Moreover, one can see the appearance of some new crystalline phases: BCC–(Fe,Ni)23B6 (Ref. ICDD Code: 04-001-5987), FCC–Ni17Si3 (Ref. ICDD Code: 03-065-6491) and BCC–Fe3Si (Ref. ICDD Code: 04-004-6643) after the annealing. This stable equilibrium phases result from the metastable structure transformation after annealing.

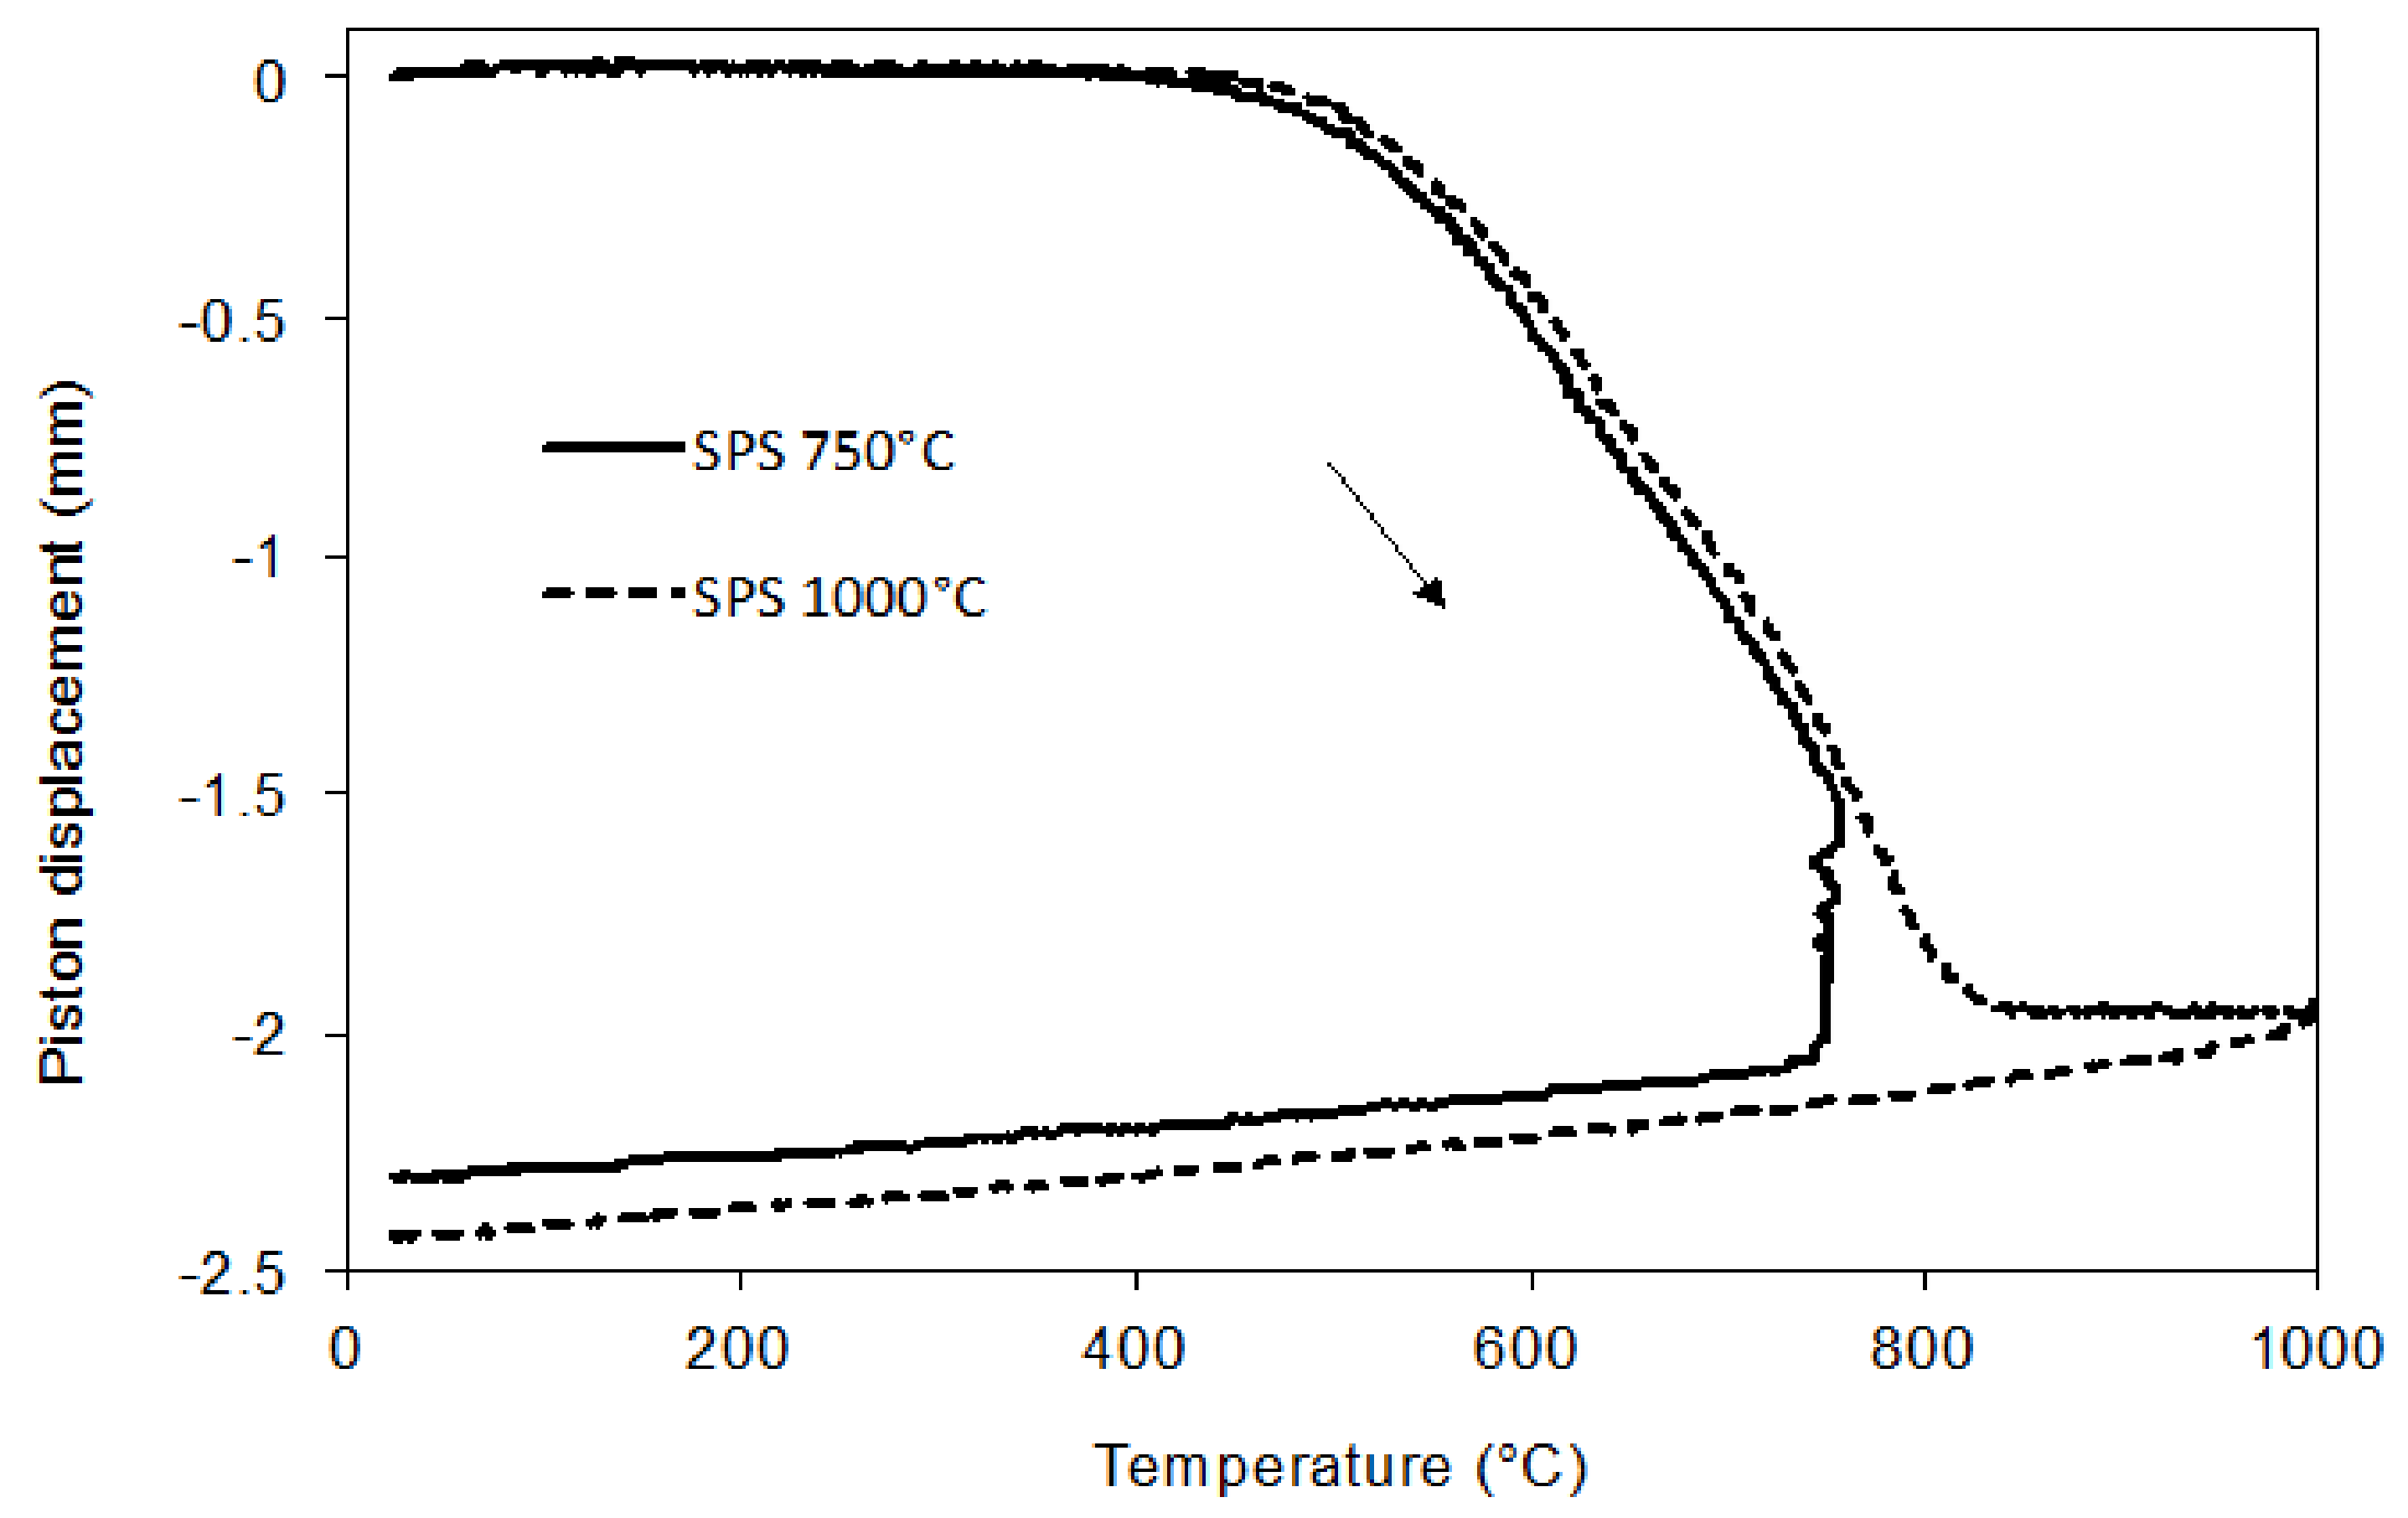
3.3.2. Consolidation of Powders

In order to understand the effect of heating on structural, magnetic and mechanical characterization, the 150-h milled high-entropy alloy powder FeCoNiB0.5Si0.5 was sintered by SPS at 750 and 1000 °C, under vacuum.
Figure 7 shows the piston displacement as a function of the temperature during the sintering of the powder for both tests. The powder starts to sinter around 500 °C. Sintering is achieved beyond 850 °C. The obtained HEA specimens consolidated at 750 and 1000 °C show densities of 5806 kg/m3 and 5938 kg/m3, respectively. This tends to show that the densification is not complete at 750 °C and that porosities of about 2% seem to be present.
Figure 8 shows the XRD pattern and SEM micrographs in secondary electron (SE) mode of the core of the specimens after SPS consolidation. The samples were mechanically polished down to 50 nm colloidal silica suspension. In order to show eventual porosities, the super-finition stage was long (20 min). It can be seen that no porosity was present in the specimens after SPS sintering and also that they exhibit rough surface after polishing. The use of high temperatures like 1000 °C causes a substantial increase of the grain size. The corresponding energy-dispersive X-ray spectra (EDS) of the two sintered bulks and the alternative dark/light zones are shown in Table 4. The boron is absent from the table because EDS is unable to quantify it. The alternative dark/light zones show the topography of the sample. Given the phase proportion revealed by the XRD patterns, the light zone is very probably the FCC phase.

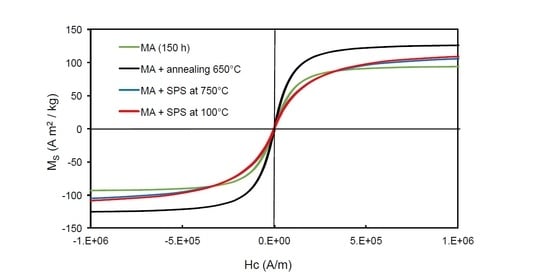
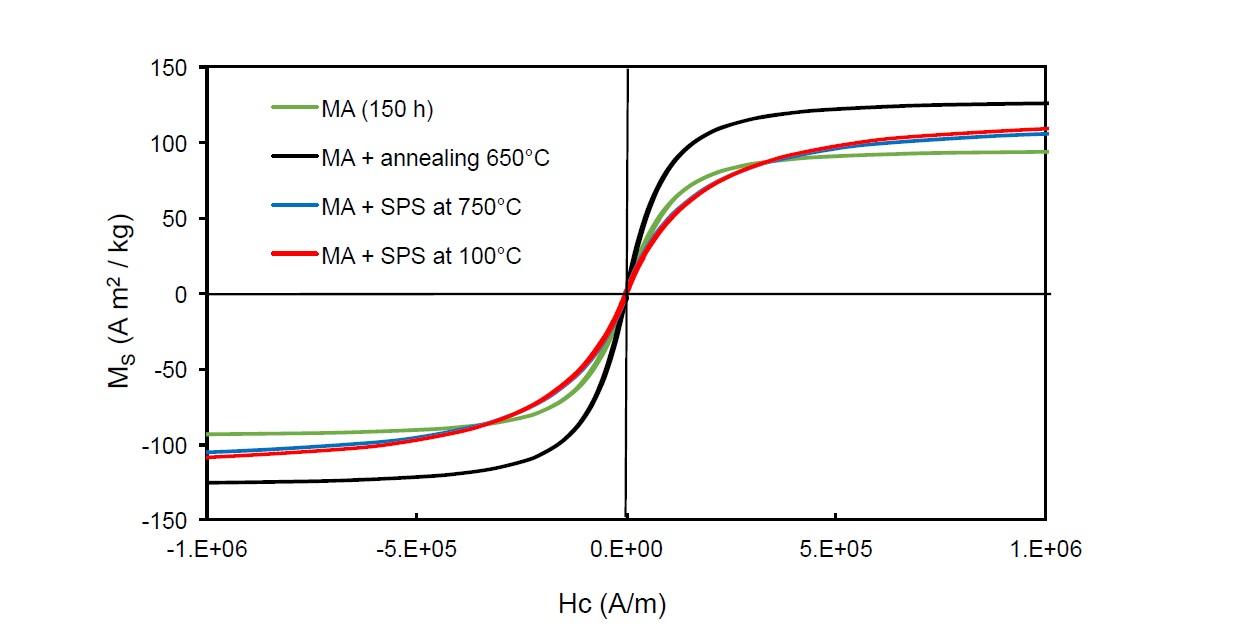
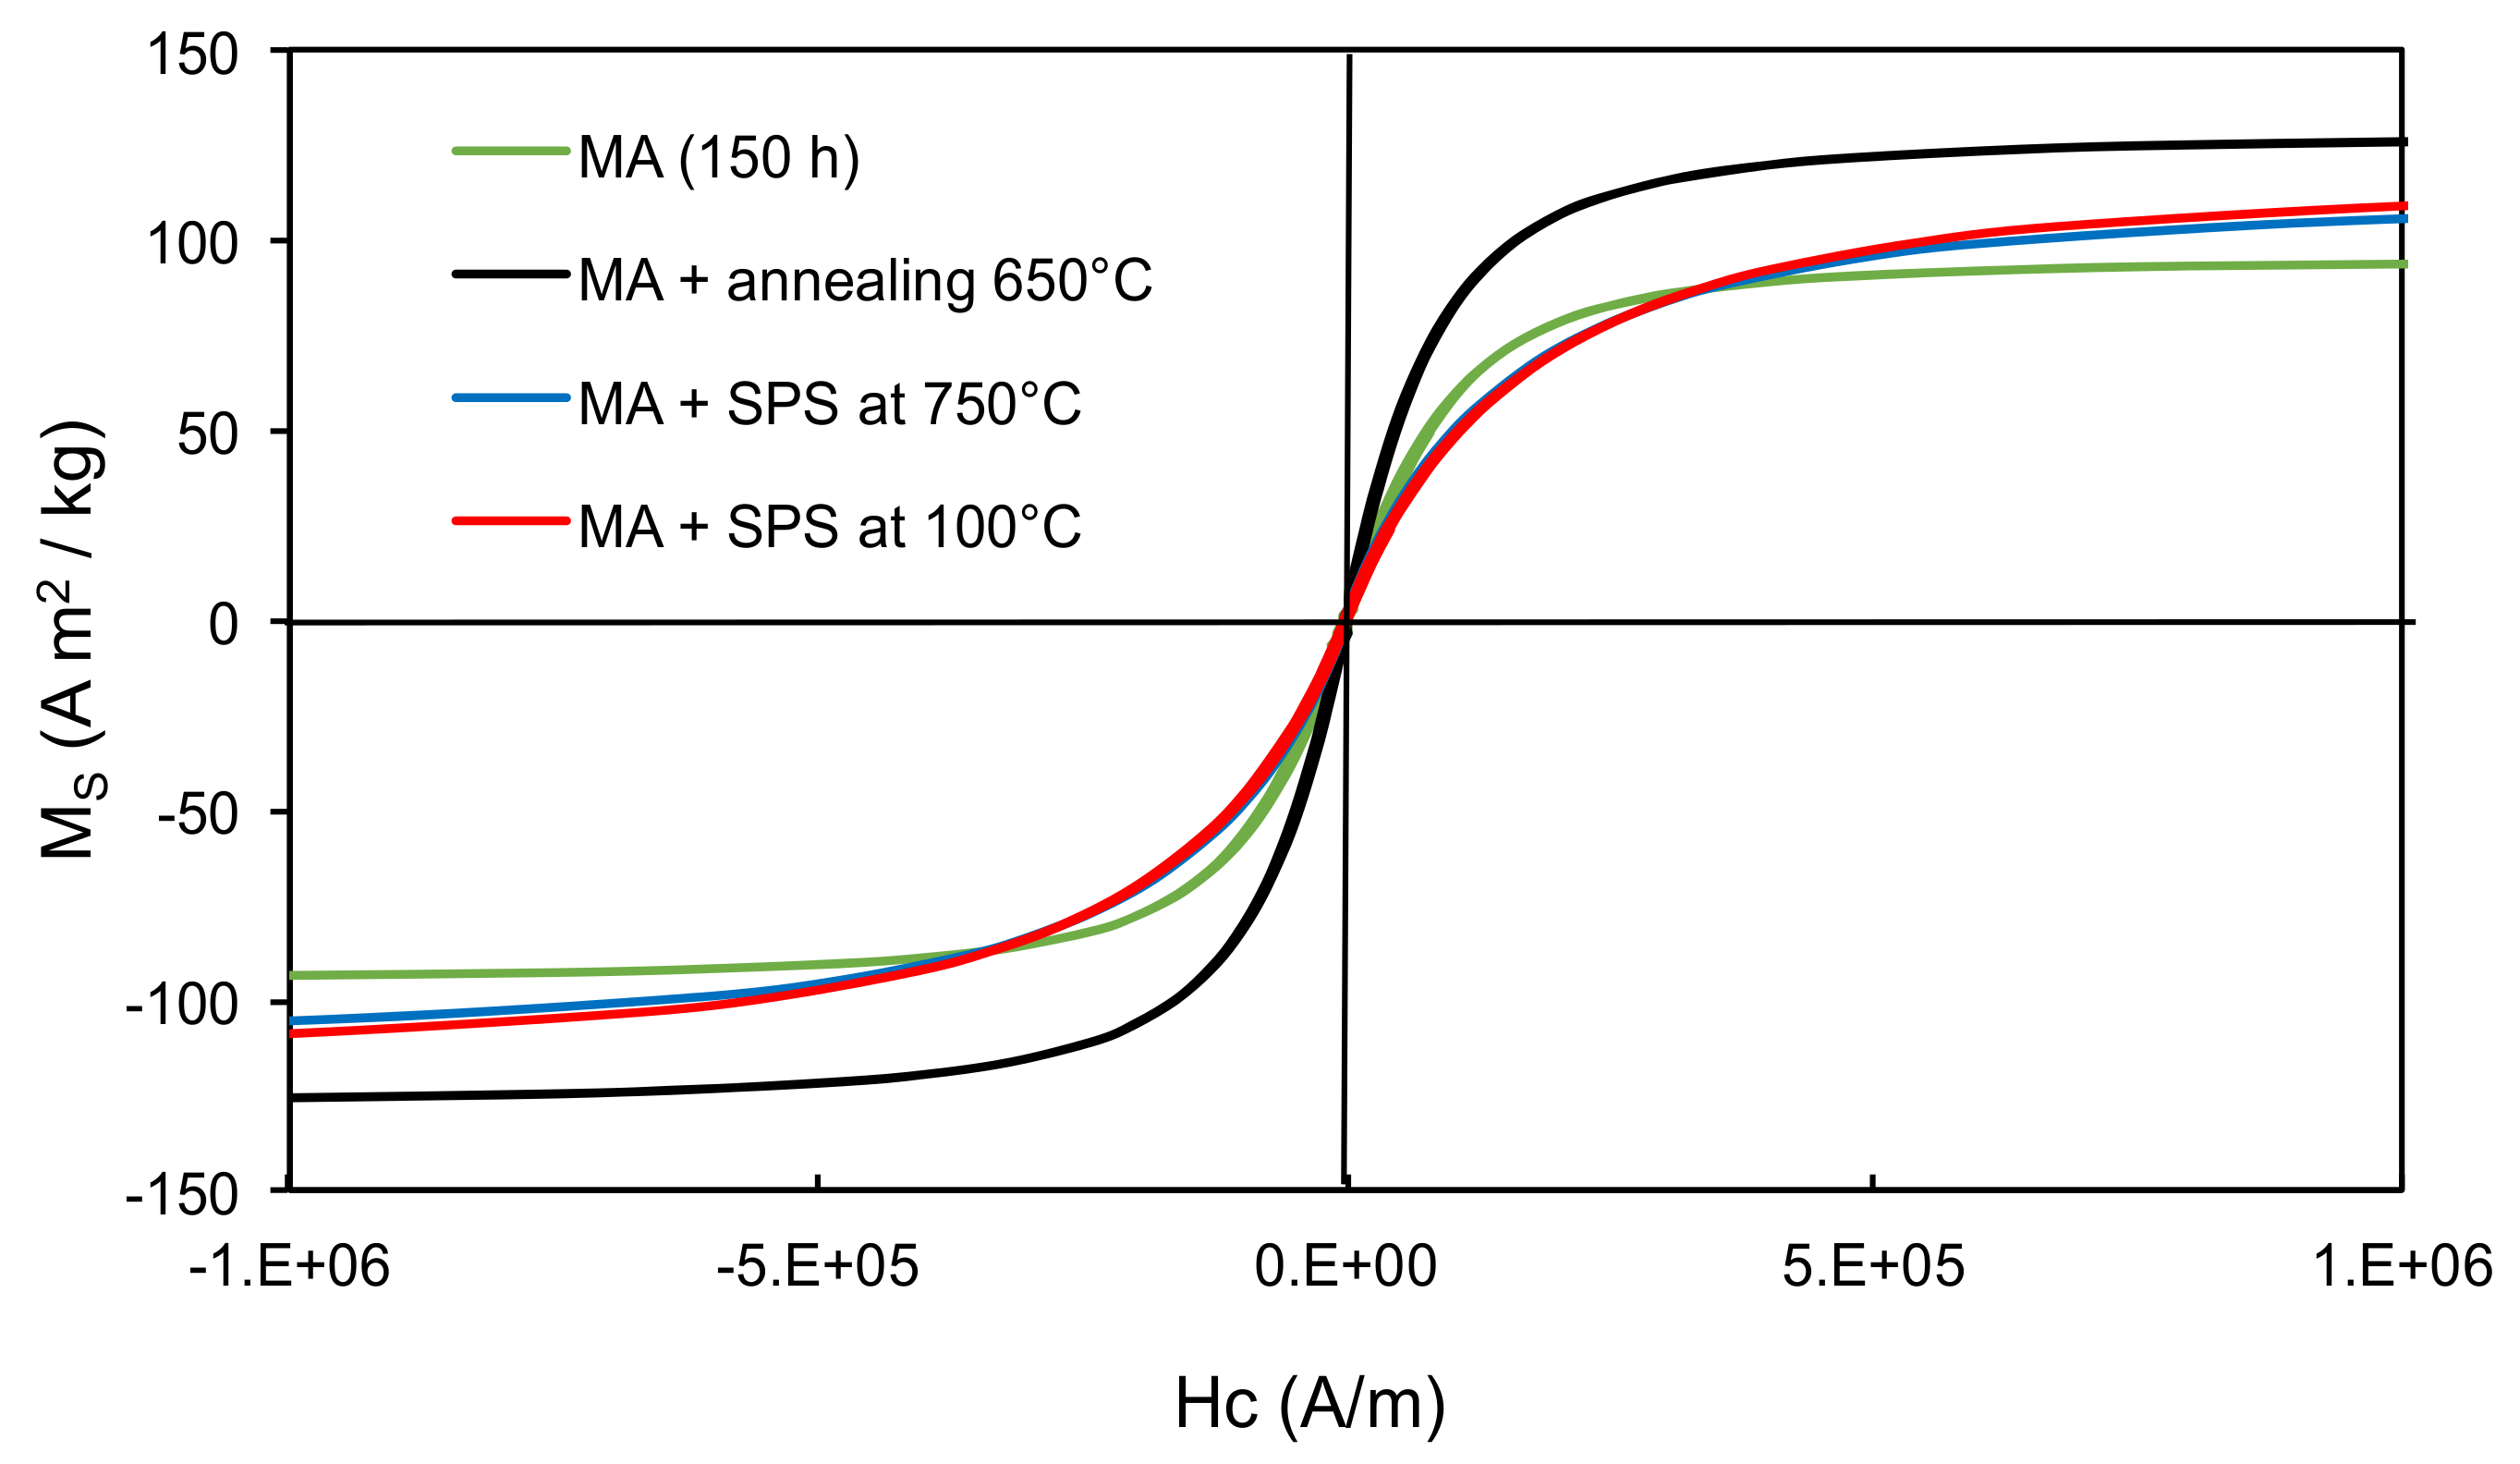
3.4. Magnetic Behavior

Figure 9 shows the hysteresis curve of the 150-h milled FeCoNiB0.5Si0.5 powder before annealing, after annealing at 650 °C for 1 h and after Spark plasma sintering at 750 and 1000 °C. The values of the saturation magnetization (Ms), the remanence to saturation ratio (Mr/Ms) and the coercivity (Hc) are listed in Table 5.
The annealed sample shows larger saturation magnetization and lower coercivity than the as-milled powder. The increase in the saturation magnetization can be attributed to the structures of the BCC phases formed during the annealing. In fact, the BCC structure exhibits higher saturation magnetization than the FCC structure. Zhang et al. [46] and Huang et al. [47] also reported similar results for their HEAs FeCoNi(CuAl)0.8 and FeCrCoNiAlx, respectively. The decrease of the coercivity after the heat treatment depends on the increase in crystallite size, the grain size and the decrease of structural strain. Mishra et al. [48] noticed similar observations. The saturation ratio decreases from 0.034 after milling to 0.025 after annealing and to 0.012 after SPS. This decrease is linked to the release of microstrains and the domain wall energy during the elevation for temperature. The saturation ratio also depends on the phases appearance after annealing and SPS sintering.
On the basis of high saturation magnetization, Ms, and low coercivity, Hc, measurements, it can be concluded that the heat treatment at 650 °C makes the HEAs magnetically softer. The specimens obtained after SPS exhibit improved coercive field values and smaller saturation ration value compared to the simply annealed samples. Also, the consolidated specimens have a lower coercivity, saturation ratio and higher saturation magnetization values than the as-milled powders that they are made from. As a conclusion, a good combination between the coercivity and the saturation magnetization is obtained after Spark Plasma Sintering at 750 °C.
The value of coercivity of the HEA presented here is higher than the coercivity measured by Tianlong et al. [7] on the same chemical composition obtained by the copper cast method. The coercivity (Hc) reflects the degree of freedom for the movement of magnetic domain walls. It can be influenced by several factors in alloys like microstructure, grain size and crystal defects. In the current case, the coercivity has a relation with the crystallite size and the dislocations [49]. Specifically, the high grain boundaries fraction and the dislocations induced by the mechanical alloying process may significantly hinder the movement of magnetic domain walls, giving different coercivity values for the two methods.
Table 6 presents the results of the present study and summarizes the magnetic characteristics of some alloys and HEA compounds presented in the literature (prepared by mechanical alloying). The FeCoNiB0.5Si0.5 shows higher magnetization and lower coercivity compared to most of the mechanically alloyed compounds and HEAs. Hence, this comparison shows that the synthesized FeCoNiB0.5Si0.5 HEA exhibits good soft magnetic properties, especially after consolidation by spark plasma sintering at 750 °C.

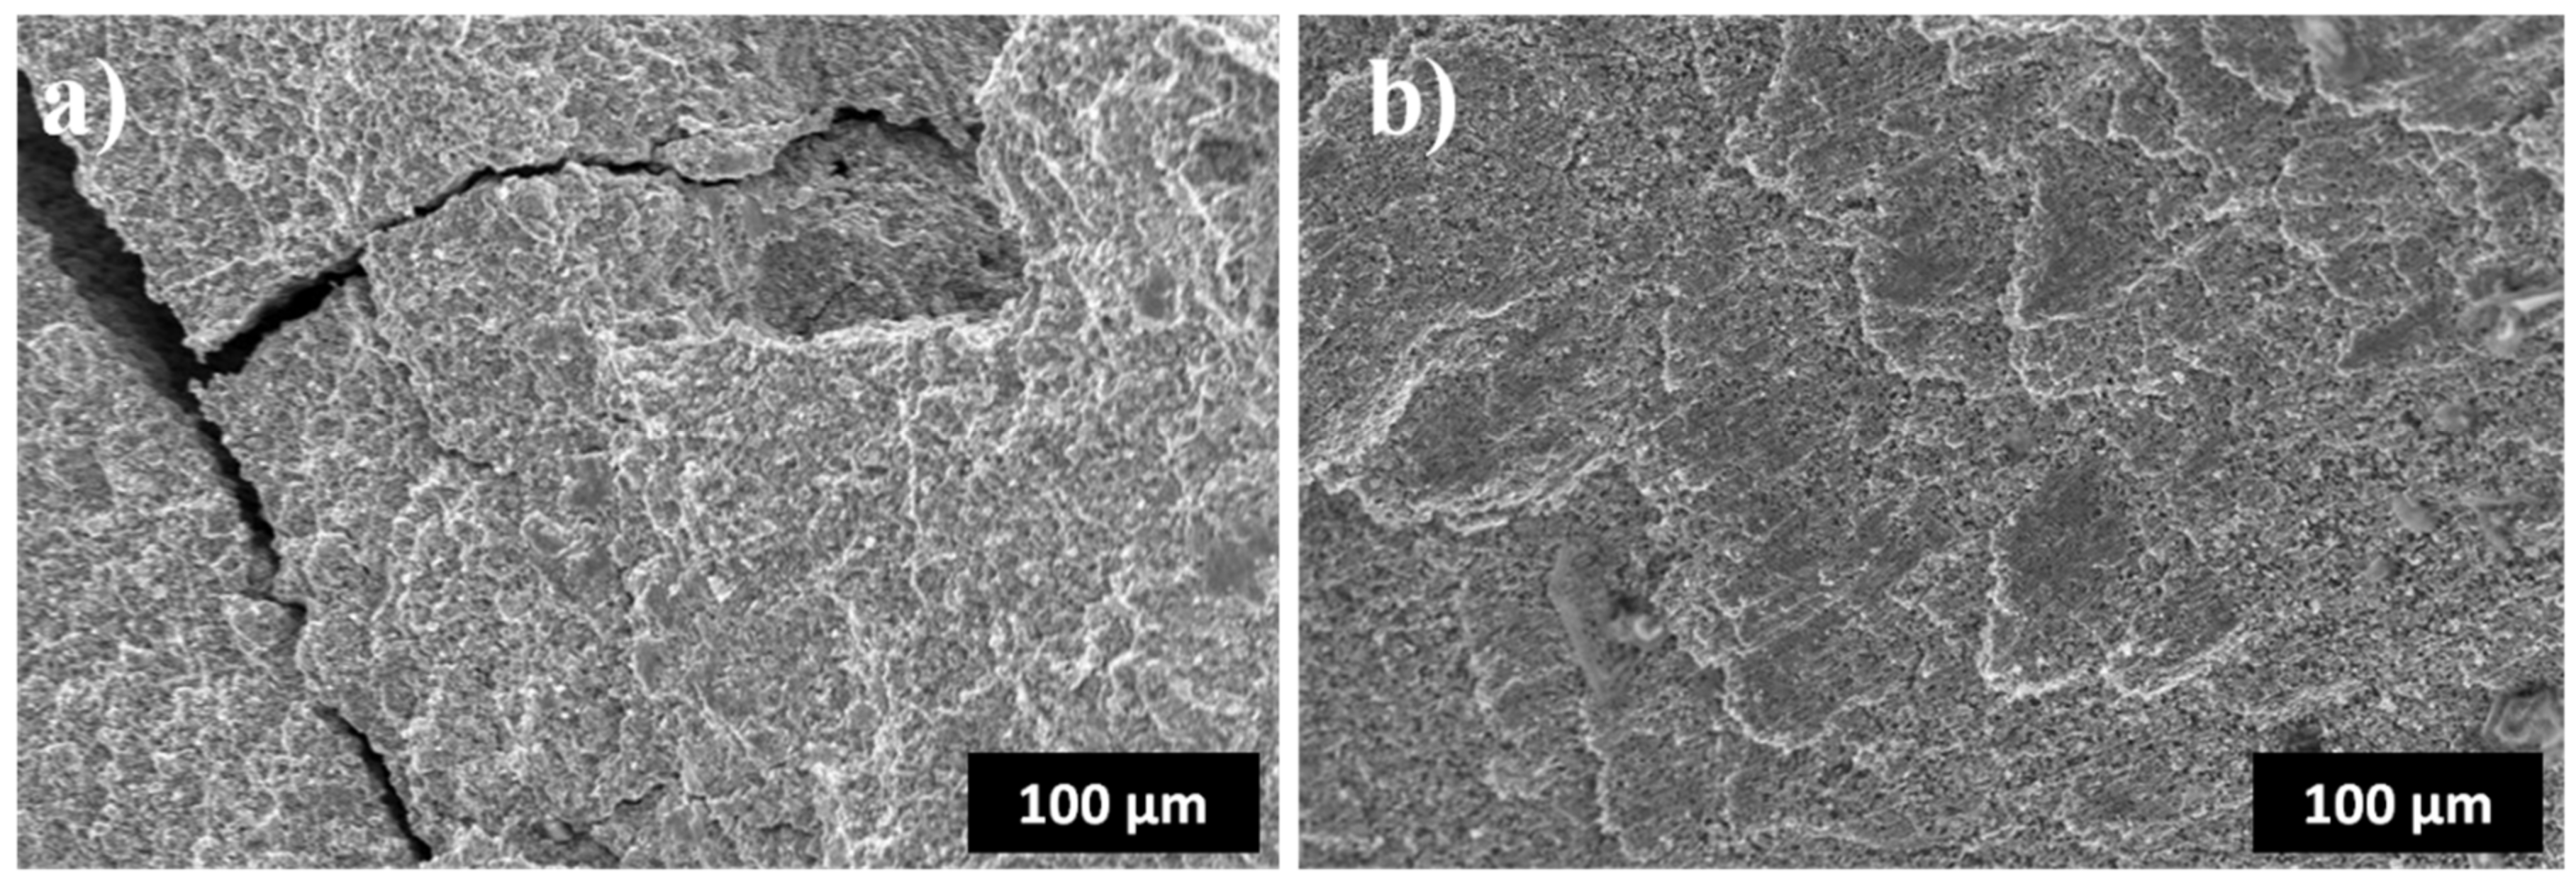
3.5. Mechanical Properties

Room-temperature compressive tests and hardness measurements were realized after SPS consolidation. Moreover, microhardness Vickers tests were made on the powder grains using 10 g of load applied for 10 s. The results are shown in Table 7. With increasing SPS temperature, the compressive strength (σmax) decreases by about 12%, while the yield strength (σy) decreases by 20%. The sample sintered at 750 °C showed crack noises during the compression test, which suggests that the final strength of 1062 MPa is under-evaluated. Supplementary tests must be realized to measure the ultimate compressive strength. The sample sintered at 750 °C is significantly harder (518 HV) than the one processed at 1000 °C (176 HV). Micro-hardness tests made on grains of as-milled powder (mounted by mixing with resin) showed powder gains hardness of about 626 HV. This shows that the major part of the defects introduced by the milling process, which are responsible for the hardening, still persist after sintering at 750 °C. The high value of hardness obtained after SPS at 750 °C depends on the dislocation strengthening and the ultrafine grains. As shown in SEM examination of SPS-consolidated specimens, the increase of temperature causes an increase of the grain size. According to the Hall-Petch relationship, the increase of the grain size results in a clear decrease in the compression yield strength [59]. The HEA consolidated by SPS at 750 °C exhibits a hardness of 518 HV, which is higher than that reported for some HEAs fabricated by SPS or casting methods [11,60,61,62,63] and slightly higher than that of the Stellite commercial alloy which is a commercial hard facing alloy that exhibits a hardness of 500 HV.
Figure 10 shows the corresponding fractographic images after the compressive strength tested alloy consolidated in two different temperatures. As shown Figure 10a, the samples consolidated by SPS at 750 °C show cracks, which explains the intergranular fracture observed with a dimpled texture all over the surface, suggesting that the fracture mode is brittle fracture. On the other hand, the plastic-slipping plane observed with the sample consolidated by SPS at 1000 °C (Figure 10b) suggested that the mode of fracture is a ductile fracture. This suggests that the optimum consolidation temperature should be above 750 °C, in order to make the bulk more ductile.
The value of the elastic modulus cannot be directly measured by compression tests since the dies deformation is not negligible in the vicinity of the contact with the sample. Thus, an alternative method for hardness and elastic modulus measurements was deployed—nanoindentation.
The nanoindentation method can also give information about the constitutive phases in the alloy. Nanoindentation experiments allow the evaluation of hardness, H, and indentation elastic modulus, E, as a function of the penetration depth (h). Figure 11 shows the load-displacement curves for both SPS consolidate samples (at 750 and 1000 °C) for indentation loads of 45 mN. Given the microstructure of these alloys, indentations performed at lower loads give very scattered results, as usually observed for multi-phased materials [64]. The evolution of indentation modulus and hardness withdrawn from the data presented in Figure 11, for the sample consolidated at 750 °C, are shown in Figure 12. Indentations performed at 45 mN allow determining average values of E and H, representative of the global behavior of the sample, as shown on the graphs presented in Figure 12. Parameters H(h) and E(h) show that once a given penetration depth, hd, is reached, the values of E and H tend to stabilize. The depth, hd, depends on the typically microstructure length scale. Table 8 summarizes the obtained mechanical properties for the two temperatures of consolidation (750 and 1000 °C).
In order to evaluate the wear resistance of the two specimens after SPS, we calculated the H/E ratio, which is also called the elastic strain to failure, or plasticity index, first introduced by Oberle [65]. The high value for this ratio, explained by a combination between the low modulus of elasticity and high hardness, would give the material improved fracture toughness. Furthermore, the H3/E2 is a second ratio that gives information on the resistance of the material to the plastic deformation. High values of this ratio mean improved resistance to plastic deformation.
Table 8 also presents the H/E and H3/E2 ratio of the SPS-consolidated samples. One can conclude that the MA + SPS at 750 °C is characterized by higher fracture toughness and high resistance to plastic deformation compared to the MA + SPS at 1000 °C.
SEM as well as optical micrography and XRD patterns clearly show the presence of at least two phases in both SPS sintered materials. To deconvolute the mechanical properties of each phase would be very interesting. In order to perform such type of measure, a statistical approach has been envisaged. As it is classically realized for multi-composed materials, a high number of indentation (144) at low load (1 mN) was performed on both materials. The values of indentation modulus and hardness were used to establish a cumulative density function (cdf). Assuming the presence of 2 phases, and in order to identify the mechanical properties (E and H) of each of them, this experimental cdf was fitted with the following function [66]:
f E = ω 1 2 1 + erf x E 1 2 Δ E 1 + 1 ω 1 2 1 + erf x E 2 2 Δ E 2
where ωn and En are the surface fraction and indentation elastic modulus of the n-th phase, respectively. The term ΔEn is the standard deviation on the indentation elastic modulus. The same kind of function can be used for the hardness. Then, Hn and ΔHn can replace En and ΔEn in Equation (7) as hardness and its standard deviation of the n-th phase.
Table 9 summarizes the values of the extracted data. One can observe that the FCC phase is much softer, as expected, after sintering at higher temperature. At the opposite, the minor phase is much harder after sintering at 1000 °C.

4. Conclusions

The FeCoNiB0.5Si0.5 HEA alloy was successfully synthesized by mechanical alloying with a single solid solution structure, while the thermo-dynamic criteria for obtaining such a phase were not respected. After 25 h of milling, one major BCC supersaturated solid solution and a minor supersaturated FCC solid solution were formed. After 150 h of milling, a homogenous FCC structure with a grain size of about 10 nm was present. The increasing milling time led to peak shifts and broadening caused by the lattice expansion, strains and grain refinement. The heat treatment of the as-milled FeCoNiB0.5Si0.5 HEA produced a material with softer magnetic properties. We believe that the structural modification obtained by the decomposition of the supersaturated FCC HEA alloy into more stable equilibrium phase is the main factor responsible for the magnetic softness. After SPS, the metastable FCC phase decomposed into FCC and a minor (Fe,Ni)23B6 after 750 °C, and into FCC and a minor FeCo2B phase after 1000 °C. The mechanical properties of the alloy consolidated at a temperature of 750 °C are good but can be optimized by rising the temperature of consolidation in order to find the best compromise between ductility and strength. Also, a consolidation under a higher compression pressure (here, 50 MPa) can be tested in order to enhance the sintering efficiency. Thus, consolidation optimum conditions seem to be located above 750 °C and with compression pressures higher than 50 MPa. A specific study will be devoted to the optimization of the SPS consolidation conditions.

Author Contributions

Investigation, K.Z., M.C., S.L.G., Y.G., L.E., J.J.S. and V.O.; Methodology, M.C. and V.O.; Supervision, M.C., J.J.S., F.B., M.K. and V.O.; Validation, J.S., J.S. and F.B.; Writing—original draft, K.Z.; Writing—review and editing, S.L.G. and V.O. All authors have read and agreed to the published version of the manuscript.

Funding

This research received no external funding.

Conflicts of Interest

The authors declare no conflict of interest.

References

  1. Yeh, J.-W.; Chen, S.-K.; Lin, S.-J.; Gan, J.-Y.; Chin, T.-S.; Shun, T.-T.; Tsau, C.-H.; Chang, S.-Y. Nanostructured High-Entropy Alloys with Multiple Principal Elements: Novel Alloy Design Concepts and Outcomes. Adv. Eng. Mater. 2004, 6, 299–303. [Google Scholar] [CrossRef]
  2. Guo, S.; Liu, C. Phase stability in high entropy alloys: Formation of solid-solution phase or amorphous phase. Prog. Nat. Sci. 2011, 21, 433–446. [Google Scholar] [CrossRef] [Green Version]
  3. Senkov, O.; Wilks, G.; Scott, J.M.; Miracle, D. Mechanical properties of Nb25Mo25Ta25W25 and V20Nb20Mo20Ta20W20 refractory high entropy alloys. Intermetallics 2011, 19, 698–706. [Google Scholar] [CrossRef]
  4. Jiles, D. Introduction to Magnetism and Magnetic Materials; Chapman and Hall/CRC Press: New York, NY, USA, 1998. [Google Scholar]
  5. Raanaei, H.; Eskandari, H.; Mohammad-Hosseini, V. Structural and magnetic properties of nanocrystalline Fe–Co–Ni alloy processed by mechanical alloying. J. Magn. Magn. Mater. 2016, 398, 190–195. [Google Scholar] [CrossRef]
  6. Li, X.; Takahashi, S. Synthesis and magnetic properties of Fe–Co–Ni nanoparticles by hydrogen plasma–metal reaction. J. Magn. Magn. Mater. 2000, 214, 195–203. [Google Scholar] [CrossRef]
  7. Tianlong, Q.I.; Yanhui, L.I.; Takeuchi, A.; Guoqiang, X.; Miao, H.; Zhang, W. Soft magnetic Fe25Co25Ni25(B,Si)25 high entropy bulk metallic glasses. Intermetallics 2015, 66, 8–12. [Google Scholar]
  8. Li, Y.; Zhang, W.; Qi, T. New soft magnetic Fe25Co25Ni25(P, C, B)25 high entropy bulk metallic glasses with large supercooled liquid region. J. Alloys Compd. 2017, 693, 25–31. [Google Scholar] [CrossRef]
  9. Wei, R.; Sun, H.; Chen, C.; Han, Z.; Li, F. Effect of cooling rate on the phase structure and magnetic properties of Fe 26.7 Co 28.5 Ni 28.5 Si 4.6 B 8.7 P 3 high entropy alloy. J. Magn. Magn. Mater. 2017, 435, 184–186. [Google Scholar] [CrossRef]
  10. Fu, Z.; Chen, W.; Jiang, Z.; Macdonald, B.E.; Lin, Y.; Chen, F.; Zhang, J.; Lavernia, E.J. Influence of Cr removal on the microstructure and mechanical behaviour of a high-entropy Al0.8Ti0.2CoNiFeCr alloy fabricated by powder metallurgy. Powder Met. 2018, 9, 1–9. [Google Scholar] [CrossRef]
  11. Fu, Z.; Chen, W.; Wen, H.; Zhang, D.; Chen, Z.; Zheng, B.; Zhou, Y.; Lavernia, E.J. Microstructure and strengthening mechanisms in an FCC structured single-phase nanocrystalline Co25Ni25Fe25Al7.5Cu17.5 high-entropy alloy. Acta Mater. 2016, 107, 59–71. [Google Scholar] [CrossRef]
  12. Fu, Z.; Chen, W.; Wen, H.; Chen, Z.; Lavernia, E.J. Effects of Co and sintering method on microstructure and mechanical behavior of a high-entropy Al0.6NiFeCrCo alloy prepared by powder metallurgy. J. Alloys Compd. 2015, 646, 175–182. [Google Scholar] [CrossRef]
  13. Liu, Y.; Wang, J.; Fang, Q.; Liu, B.; Wu, Y.; Chen, S. Preparation of superfine-grained high entropy alloy by spark plasma sintering gas atomized powder. Intermetallics 2016, 68, 16–22. [Google Scholar] [CrossRef]
  14. Liu, B.; Wang, J.; Chen, J.; Fang, Q.; Liu, Y. Ultra-High Strength TiC/Refractory High-Entropy-Alloy Composite Prepared by Powder Metallurgy. JOM 2017, 69, 651–656. [Google Scholar] [CrossRef]
  15. Praveen, S.; Murty, B.; Kottada, R.S. Alloying behavior in multi-component AlCoCrCuFe and NiCoCrCuFe high entropy alloys. Mater. Sci. Eng. A 2012, 534, 83–89. [Google Scholar] [CrossRef]
  16. Fu, Z.; Chen, W.; Xiao, H.; Zhou, L.; Zhu, D.; Yang, S. Fabrication and properties of nanocrystalline Co0.5FeNiCrTi0.5 high entropy alloy by MA–SPS technique. Mater. Des. 2013, 44, 535–539. [Google Scholar] [CrossRef]
  17. Fu, Z.; Chen, W.; Fang, S.; Zhang, D.; Xiao, H.; Zhu, D. Alloying behavior and deformation twinning in a CoNiFeCrAl0.6Ti0.4 high entropy alloy processed by spark plasma sintering. J. Alloys Compd. 2013, 553, 316–323. [Google Scholar] [CrossRef]
  18. Chen, W.; Fu, Z.; Fang, S.; Wang, Y.; Xiao, H.; Zhu, D. Processing, microstructure and properties of Al0.6CoNiFeTi0.4 high entropy alloy with nanoscale twins. Mater. Sci. Eng. A 2013, 565, 439–444. [Google Scholar] [CrossRef]
  19. Lutterotti, L. Maud: A Rietveld analysis program designed for the internet and experiment integration. Acta Crystallogr. Sect. A Found. Crystallogr. 2000, 56, S54. [Google Scholar] [CrossRef] [Green Version]
  20. Li, X.; Bhushan, B. A review of nanoindentation continuous stiffness measurement technique and its applications. Mater. Charact. 2002, 48, 11–36. [Google Scholar] [CrossRef]
  21. Oliver, W.; Pharr, G. An improved technique for determining hardness and elastic modulus using load and displacement sensing indentation experiments. J. Mater. Res. 1992, 7, 1564–1583. [Google Scholar] [CrossRef]
  22. Louidi, S.; Bentayeb, F.-Z.; Suñol, J.-J.; Escoda, L. Formation study of the ball-milled Cr20Co80 alloy. J. Alloys Compd. 2010, 493, 110–115. [Google Scholar] [CrossRef]
  23. Zerniz, N.; Azzaza, S.; Chater, R.; Abbas, H.; Bououdina, M.; Bouchelaghem, W. Magnetic and structural properties of nanostructured Fe–20Al–2Cr powder mixtures. Mater. Charact. 2015, 100, 21–30. [Google Scholar]
  24. Huang, J.; Wu, Y.; Ye, H.; Lu, K. Allotropic transformation of cobalt induced by ball milling. Nanostruct. Mater. 1995, 6, 723–726. [Google Scholar]
  25. Cardellini, F.; Mazzone, G. Thermal and structural study of the h.c.p.-to-f.c.c. transformation in cobalt. Philos. Mag. A 1993, 67, 1289–1300. [Google Scholar] [CrossRef]
  26. Alleg, S.; Azzaza, S.; Bensalem, R.; Suñol, J.-J.; Khene, S.; Fillion, G. Magnetic and structural studies of mechanically alloyed (Fe50Co50)62Nb8B30 powder mixtures. J. Alloys Compd. 2009, 482, 86–89. [Google Scholar] [CrossRef]
  27. Yeh, J.-W.; Chang, S.-Y.; Hong, Y.-D.; Chen, S.-K.; Lin, S.-J. Anomalous decrease in X-ray diffraction intensities of Cu–Ni–Al–Co–Cr–Fe–Si alloy systems with multi-principal elements. Mater. Chem. Phys. 2007, 103, 41–46. [Google Scholar] [CrossRef]
  28. Kaloshkin, S.; Tcherdyntsev, V.; Tomilin, I.; Baldokhin, Y.; Shelekhov, E. Phase transformations in Fe–Ni system at mechanical alloying and consequent annealing of elemental powder mixtures. Phys. B Condens. Matter 2001, 299, 236–241. [Google Scholar] [CrossRef]
  29. Zhang, K.; Fu, Z.; Zhang, J.; Wang, W.; Lee, S.; Niihara, K. Characterization of nanocrystalline CoCrFeNiTiAl high-entropy solid solution processed by mechanical alloying. J. Alloys Compd. 2010, 495, 33–38. [Google Scholar] [CrossRef]
  30. Chen, Y.-L.; Hu, Y.-H.; Hsieh, C.-A.; Yeh, J.-W.; Chen, S.-K. Competition between elements during mechanical alloying in an octonary multi-principal-element alloy system. J. Alloys Compd. 2009, 481, 768–775. [Google Scholar] [CrossRef]
  31. Porter, D.A.; Easterling, K.E. Phase Transformations in Metals and Alloys, 2nd ed.; Springer: Berlin, Germany, 1992. [Google Scholar]
  32. Fu, Z.; Chen, W.; Chen, Z.; Wen, H.; Lavernia, E.J. Influence of Ti addition and sintering method on microstructure and mechanical behavior of a medium-entropy Al 0.6 CoNiFe alloy. Mater. Sci. Eng. A 2014, 619, 137–145. [Google Scholar] [CrossRef]
  33. Izadi, S.; Janghorban, K.; Akbari, G.; Ghafari, M.; Salahinejad, E. Effects of boron addition on mechanical alloying and ordering behaviors of Fe–Al–(B) alloy powders. J. Alloys Compd. 2010, 493, 645–648. [Google Scholar] [CrossRef]
  34. Gharsallah, H.I.; Azabou, M.; Escoda, L.; Suñol, J.-J.; López, I.; Llorca-Isern, N.; Khitouni, M. The magnetic and structural properties of nanostructured (Fe75Al25) 100-xBx alloys prepared by mechanical alloying. J. Alloys Compd. 2017, 729, 776–786. [Google Scholar] [CrossRef] [Green Version]
  35. Sharifati, A.; Sharafi, S. Structural and magnetic properties of nanostructured (Fe70Co30)100−xCux alloy prepared by high energy ball milling. Mater. Des. 2012, 41, 8–15. [Google Scholar] [CrossRef]
  36. Sui, H.; Zhu, M.; Qi, M.; Li, G.B.; Yang, D.Z. The enhancement of solid solubility limits of AlCo intermetallic compound by high-energy ball milling. J. Appl. Phys. 1992, 71, 2945–2949. [Google Scholar] [CrossRef]
  37. Yavari, A.R.; Desré, P.J.; Benameur, T. Mechanically driven alloying of immiscible elements. Phys. Rev. Lett. 1992, 68, 2235. [Google Scholar] [CrossRef] [PubMed]
  38. Zhang, Y.; Zuo, T.T.; Tang, Z.; Gao, M.C.; Dahmen, K.A.; Liaw, P.K.; Lu, Z.P. Microstructures and properties of high-entropy alloys. Prog. Mater. Sci. 2014, 61, 1–93. [Google Scholar] [CrossRef]
  39. Shun, T.-T.; Chang, L.-Y.; Shiu, M.-H. Microstructure and mechanical properties of multiprincipal component CoCrFeNiMox alloys. Mater. Charact. 2012, 70, 63–67. [Google Scholar] [CrossRef]
  40. Shun, T.-T.; Chang, L.-Y.; Shiu, M.-H. Microstructures and mechanical properties of multiprincipal component CoCrFeNiTix alloys. Mater. Sci. Eng. A 2012, 556, 170–174. [Google Scholar] [CrossRef]
  41. Yang, X.; Zhang, Y. Prediction of high-entropy stabilized solid-solution in multi-component alloys. Mater. Chem. Phys. 2012, 132, 233–238. [Google Scholar] [CrossRef]
  42. Takeuchi, A.; Inoue, A. Classification of Bulk Metallic Glasses by Atomic Size Difference, Heat of Mixing and Period of Constituent Elements and Its Application to Characterization of the Main Alloying Element. Mater. Trans. 2005, 46, 2817–2829. [Google Scholar] [CrossRef] [Green Version]
  43. Guo, S.; Ng, C.; Lu, J.; Liu, C.T. Effect of valence electron concentration on stability of fcc or bcc phase in high entropy alloys. J. Appl. Phys. 2011, 109, 103–505. [Google Scholar] [CrossRef] [Green Version]
  44. Otto, F.; Dlouhý, A.; Pradeep, K.; Kuběnová, M.; Raabe, D.; Eggeler, G.; George, E. Decomposition of the single-phase high-entropy alloy CrMnFeCoNi after prolonged anneals at intermediate temperatures. Acta Mater. 2016, 112, 40–52. [Google Scholar] [CrossRef] [Green Version]
  45. Wu, Z.; Bei, H.; Otto, F.; Pharr, G.M.; George, E. Recovery, recrystallization, grain growth and phase stability of a family of FCC-structured multi-component equiatomic solid solution alloys. Intermetallics 2014, 46, 131–140. [Google Scholar] [CrossRef]
  46. Zhang, Q.; Xu, H.; Tan, X.H.; Hou, X.L.; Wu, S.W.; Tan, G.S.; Yu, L.Y. The effects of phase constitution on magnetic and mechanical properties of FeCoNi(CuAl)x (x = 0–1.2) high-entropy alloys. J. Alloys Compd. 2017, 693, 1061–1067. [Google Scholar] [CrossRef]
  47. Huang, S.; Li, W.; Li, X.; Schönecker, S.; Bergqvist, L.; Holmström, E.; Varga, L.K.; Vitos, L. Mechanism of magnetic transition in FeCrCoNi-based high entropy alloys. Mater. Des. 2016, 103, 71–74. [Google Scholar] [CrossRef]
  48. Mishra, R.K.; Shahi, R.R. Phase evolution and magnetic characteristics of TiFeNiCr and TiFeNiCrM (M = Mn, Co) high entropy alloys. J. Magn. Magn. Mater. 2017, 442, 218–223. [Google Scholar] [CrossRef]
  49. Li, P.; Wang, A.; Liu, C. Composition dependence of structure, physical and mechanical properties of FeCoNi(MnAl) x high entropy alloys. Intermetallics 2017, 87, 21–26. [Google Scholar] [CrossRef]
  50. Nowroozi, M.; Shokrollahi, H. The effects of milling time and heat treatment on the micro-structural and magnetic behavior of Fe42Ni28Zr8Ta2B10C10 synthesized by mechanical alloying. J. Magn. Magn. Mater. 2013, 335, 53–58. [Google Scholar] [CrossRef]
  51. Gómez-Esparza, C.; Baldenebro-López, F.; Santillán-Rodríguez, C.; Guel, I.E.; Matutes-Aquino, J.; Herrera-Ramirez, J.; Martínez-Sánchez, R. Microstructural and magnetic behavior of an equiatomic NiCoAlFe alloy prepared by mechanical alloying. J. Alloys Compd. 2014, 615, S317–S323. [Google Scholar] [CrossRef]
  52. Wang, J.; Zheng, Z.; Xu, J.; Wang, Y. Microstructure and magnetic properties of mechanically alloyed FeSiBAlNi (Nb) high entropy alloys. J. Magn. Magn. Mater. 2014, 355, 58–64. [Google Scholar] [CrossRef]
  53. Avar, B.; Ozcan, S. Characterization and amorphous phase formation of mechanically alloyed Co60Fe5Ni5Ti25B5 powders. J. Alloys Compd. 2015, 650, 53–58. [Google Scholar] [CrossRef]
  54. Khosravi, S.; Alizadeh, M.; Sharafi, S.; Karimi-Maleh, H.; Atar, N. Structural, magnetic and electron transfer effect of Cr additive on Fe65Co35 nanopowder fabricated mechanical alloying. Powder Technol. 2015, 279, 262–268. [Google Scholar] [CrossRef]
  55. Xu, J.; Shang, C.; Ge, W.; Jia, H.; Liaw, P.K.; Wang, Y. Effects of elemental addition on the microstructure, thermal stability, and magnetic properties of the mechanically alloyed FeSiBAlNi high entropy alloys. Adv. Powder Technol. 2016, 27, 1418–1426. [Google Scholar] [CrossRef]
  56. Xu, J.; Axinte, E.; Zhao, Z.; Wang, Y. Effect of C and Ce addition on the microstructure and magnetic property of the mechanically alloyed FeSiBAlNi high entropy alloys. J. Magn. Magn. Mater. 2016, 414, 59–68. [Google Scholar] [CrossRef]
  57. Abbasi, S.; Eslamizadeh, H.; Raanaei, H. Study of synthesis, structural and magnetic properties of nanostructured (Fe67 Ni33)70 Ti10 B20 alloy. J. Magn. Magn. Mater. 2018, 451, 780–786. [Google Scholar] [CrossRef]
  58. Yekta, E.B.; Taghvaei, A.H.; Sharafi, S. Glass formation and magnetic study of new Fe70Ta5Si10C15 powders prepared by mechanical alloying with high thermal stability. Powder Technol. 2017, 322, 241–249. [Google Scholar] [CrossRef]
  59. Fadeeva, V.; Leonov, A.; Szewczak, E.; Matyja, H. Structural defects and thermal stability of Ti(Al) solid solution obtained by mechanical alloying. Mater. Sci. Eng. A 1998, 242, 230–234. [Google Scholar] [CrossRef]
  60. Wang, X.; Zhang, Y.; Qiao, Y.; Chen, G.L. Novel microstructure and properties of multicomponent CoCrCuFeNiTix alloys. Intermetallics 2007, 15, 357–362. [Google Scholar] [CrossRef]
  61. Tung, C.-C.; Yeh, J.-W.; Shun, T.-T.; Chen, S.-K.; Huang, Y.-S.; Chen, H.-C. On the elemental effect of AlCoCrCuFeNi high-entropy alloy system. Mater. Lett. 2007, 61, 1–5. [Google Scholar] [CrossRef]
  62. Li, C.; Li, J.; Zhao, M.; Jiang, Q. Effect of alloying elements on microstructure and properties of multiprincipal elements high-entropy alloys. J. Alloys Compd. 2009, 475, 752–757. [Google Scholar] [CrossRef]
  63. Wang, F.; Zhang, Y.; Chen, G.; Davies, H.A. Tensile and compressive mechanical behavior of a CoCrCuFeNiAl0.5 high entropy alloy. Int. J. Mod. Phys. B 2009, 23, 1254–1259. [Google Scholar]
  64. Argatov, I.I.; Sabina, F.J. A two-phase self-consistent model for the grid indentation testing of composite materials. Int. J. Eng. Sci. 2017, 121, 52–59. [Google Scholar] [CrossRef]
  65. Oberle, T.L. Properties influencing wear of metals. J. Met. 1951, 3, 438–439. [Google Scholar]
  66. Tromas, C.; Arnoux, M.; Milhet, X. Hardness cartography to increase the nanoindentation resolution in heterogeneous materials: Application to a Ni-based single-crystal superalloy. Scr. Mater. 2012, 66, 77–80. [Google Scholar] [CrossRef]
Figure 1. Scanning electron micrographs (SEM) of mechanically milled powders: (a) 0 h, (b) 5 h, (c) 25 h, (d) 50 h, (e) 100 h and (f) 150 h.
Crystals 10 00929 g001
Figure 2. X-ray diffraction (XRD) patterns of FeCoNiB0.5Si0.5 powders as a function of mechanical alloying time.
Crystals 10 00929 g002
Figure 3. Details of the principal BCC and FCC peaks during milling time.
Crystals 10 00929 g003
Figure 4. Dependence of the microstructure parameters of the Fe, FCC–Co, HCP–Co, Ni and BCC–Fe (Co,B,Si) as a function of milling time. (a) crystallite size and (b) microstrains.
Crystals 10 00929 g004
Figure 5. Dependence of the microstructure parameters of the FCC Fe–Co–Ni–(B,Si) as a function of the milling time.
Crystals 10 00929 g005
Figure 6. X-ray diffraction patterns of mecanically alloyed FeCoNiB0.5Si0.5 powders for 150 h of milling and after annealing at 650 °C for 1 h.
Crystals 10 00929 g006
Figure 7. Piston displacement as a function of the temperature during the sintering of the powders.
Crystals 10 00929 g007
Figure 8. X-ray diffraction pattern and the scanning electron micrographs of the HEA at the two temperatures, (a) SPS at 750 °C and (b) SPS at 1000 °C.
Crystals 10 00929 g008
Figure 9. Magnetic hysteresis plots of 150-h milled FeCoNiB0.5Si0.5 powders after annealing, MA + SPS at 750 °C and MA + SPS at 1000 °C.
Crystals 10 00929 g009
Figure 10. Fractography by SEM of the fracture surfaces of the specimens consolidated by SPS, (a) SPS at 750 °C and (b) SPS at 1000 °C.
Crystals 10 00929 g010
Figure 11. Loading-unloading indentation curves with maximum load of 45 mN for the samples consolidated by SPS at 750 °C (blue) and 1000 °C (red).
Crystals 10 00929 g011
Figure 12. Elastic modulus and hardness curves with the depth for the SPS 750 °C sample, (a) Elastic modulus (b) Hardness.
Crystals 10 00929 g012
Table 1. Lattice parameter, goodness of fit and fit parameters during milling.
SamplesPhasesLattice Parameter (Å)Goodness of FitFit Parameters (%)
0 hBCC–Fe2.866(7)1.16Rb: 3.12
Rexp: 3.46
Rwp: 4.019
FCC–Ni3.523(0)
HCP–Co2.507(1)
c = 4.068(5)
FCC–Co3.544(2)
FCC–Si5.430(3)
1 hBCC–Fe(B)2.867(1)1.14Rb: 2.41
Rexp: 2.95
Rwp: 3.39
FCC–Ni3.523(6)
HCP–Co2.508(5)
c = 4.065(6)
FCC–Co3.538(2)
FCC–Si5.430(4)
5 hBCC–Fe(Co,B,Si)2.868(1)1.06Rb: 1.70
Rexp: 2.10
Rwp: 2.23
FCC–Ni3.525(3)
HCP–Co2.512(6)
c = 4.079(6)
10 hBCC–Fe(Co,B,Si)2.868(6)1.12Rb: 1.53
Rexp: 1.91
Rwp: 2.15
FCC–Ni3.526(0)
HCP–Co2.502(6)
c = 4.119(3)
25 hBCC Fe–Co–Ni(B,Si)2.869(2)1.08Rb: 1.59
Rexp: 1.96
Rwp: 2.13
FCC Fe–Co–Ni(B,Si)3.541(5)
50 hFCC Fe–Co–Ni(B,Si)3.601(2)1.08Rb: 1.39
Rexp: 1.84
Rwp: 2.00
100 hFCC Fe–Co–Ni(B,Si)3.626(0)1.13Rb: 1.18
Rexp: 1.34
Rwp: 1.52
150 hFCC Fe–Co–Ni(B,Si)3.630(8)1.07Rb: 1.55
Rexp: 1.94
Rwp: 2.09
Table 2. Enthalpy of mixing (ΔHmix (kJ mol−1)) in binary equiatomic alloys calculated with Miedema’s approach [42].
Element (Atomic Radius, Å)FeCoNiBSi
Fe (1.24)-−1−2−26−35
Co (1.25)−1-0−24−38
Ni (1.24)−20-−24−40
B (0.82)−26−24−24_-−14
Si (1.15)−35−38−40−14-
Table 3. Calculated parameters for FeCoNiB0.5Si0.5 high-entropy alloy (HEA).
AlloyΔHmix (kJ mol−1)ΔSmix (JK−1 mol−1)Tm (K)δ (%)ΩVEC *
FeCoNi(B0.5Si0.5)−24.1212.961831.500.110.987.625
* VEC = valence electron concentration.
Table 4. Chemical composition (in at. %) of the specimens given by energy-dispersive X-ray spectra (EDS).
ElementZoneFeCoNiSiO
SPS at 1000 °CBlack
Grey
8.38
25.58
5.17
25.46
5.10
25.11
32.07
23.85
48.65
-
SPS at 750 °CBlack
Grey
13.47
25.39
10.55
25.38
10.41
25.23
21.28
24.00
44.29
-
Table 5. Magnetic characteristics of the milled FeCoNiB0.5Si0.5 HEA powder before and after annealing.
SamplesMs (A m2/kg)Hc (A/m)Mr/Ms
As-milled94.3139050.034
Annealed at 650 °C127.3023530.025
MA + SPS at 750 °C110.9119940.012
MA + SPS at 1000 °C115.8422200.012
Table 6. Comparison of magnetic characteristics of some reported HEAs with the present work.
AlloyPhaseMs (Am2/kg)Hc (A/m)Reference
Fe42Ni28Zr8Ta2B10C10 (198 h MA)Amorphous + BCC93.912654[50]
NiCoAlFe (MA)FCC + BCC89.501732[51]
FeSiBAlNi (260 h MA)Amorphous123,077[52]
FeSiBAlNiNb HEA (100 h MA)BCC + FCC + Amorphous~10~27,852[52]
Co60Fe5Ni5Ti25B5 (7 h MA)Amorphous53.4605[53]
(Fe65Co35)95Cr5 (100 h MA) BCC~205~5570[54]
FeSiBAlNiCo HEA (140 h MA)Amorphous~2~18,303[55]
FeSiBAlNiCe HEA (MA)Amorphous118,303[56]
TiFeNiCrCo HEA (MA)FCC24.4411,900[48]
(Fe67Ni33)70Ti10B20 HEA
(120 h MA)
Amorphous + nanocrystalline phase105.382925[57]
Fe70Ta5Si10C15 (150 h MA)Amorphous/nanocrystalline-2720[58]
FeCoNiB0.5Si0.5 (150 h MA)FCC94.313905This work
FeCoNiB0.5Si0.5 (150 h MA
+ 1 h 650 °C annealing)
FCC + BCC phases127.302353This work
FeCoNiB0.5Si0.5 (150 h MA
+ SPS at 750 °C)
FCC + (Fe,Ni)23B6110.911994This work
FeCoNiB0.5Si0.5 (150 h MA
+ SPS at 1000 °C)
FCC + FeCo2B115.842220This work
Table 7. Mechanical properties: compressive strength (σmax), yield strength (σy) and Vickers hardness.
AlloyProcessσy (MPa)σmax (MPa)Hardness (HV)
FeCoNiB0.5Si0.5 FeCoNiB0.5Si0.5MA (powder)
MA + SPS at 1000 °C
-
722
-
926
626
176
FeCoNiB0.5Si0.5MA + SPS at 750 °C9131062518
Table 8. Hardness (H), Elastic modulus (E) and ratios H/E and H3/E2 for consolidated powders at 750 °C and 1000 °C.
Hardness (GPa)Indentation Elastic Modulus (GPa)H/EH3/E2
MA + SPS at 750 °C6.3 ± 0.3111 ± 40.0570.02
MA + SPS at 1000 °C3.6 ± 0.08102 ± 40.0350.0045
Table 9. Extracted values of indentation modulus and hardness from the statistical study of the 144 dynamic nanoindentation tests at 1 mN.
Surface FractionHardness (GPa)Indentation Modulus (GPa)
SPS 750 (FeNi)23B6 phase0.25 ± 0.072.3 ± 0.665 ± 13
SPS 750 FCC phasebalance8.2 ± 2192 ± 59
SPS 1000 FeCo2B phase0.30 ± 0.077.4 ± 1.438 ± 11
SPS 1000 FCC phasebalance2.3 ± 1.2177 ± 72
Publisher’s Note: MDPI stays neutral with regard to jurisdictional claims in published maps and institutional affiliations.

