Article

Thermal Expansion of MgTiO3 Made by Sol-Gel Technique at Temperature Range 25–890 °C

1
Department of Materials Engineering, Ben-Gurion University of the Negev, Beer-Sheva 84105, Israel
2
Department of Materials Science and Engineering, Tel Aviv University, Ramat Aviv 69978001, Israel
3
Institutes for Applied Research, Ben-Gurion University of the Negev, Beer-Sheva 84105, Israel
*
Author to whom correspondence should be addressed.
Crystals 2020, 10(10), 887; https://doi.org/10.3390/cryst10100887
Submission received: 2 September 2020 / Revised: 23 September 2020 / Accepted: 29 September 2020 / Published: 1 October 2020
(This article belongs to the Special Issue Intermetallic Compound)

Abstract

:
MgTiO3 is a material commonly used in the industry as capacitors and resistors. The high-temperature structure of MgTiO3 has been reported only for materials synthesized by the solid-state method. This study deals with MgTiO3 formed at low temperatures by the sol-gel synthesis technique. Co-precipitated xerogel precursors of nanocrystalline magnesium titanates, with Mg:Ti ratio near 1:1, were subjected to thermal treatment at 1200 °C for 5 h in air. A sample with fine powders of MgTiO3 (geikielite) as a major phase with Mg2TiO4 (qandilite) as a minor phase was obtained. The powder was scanned on a hot-stage X-ray powder diffractometer at temperatures between 25 and 890 °C. The lattice parameters and the atomic positions of the two phases were determined as a function of temperature. The thermal expansion coefficients of the geikielite were derived and compared with previously published data using the solid-state synthesis technique, providing insights on trends in materials properties at elevated temperature as a function of synthesis. It was found that the deviation of the present results in comparison to previously reported data do not originate from the method of synthesis but rather from the fact that there is an asymmetric solubility gap in geikielite. The lattice parameters of this study present the property of stoichiometric MgTiO3 and are compared to previously reported non-stoichiometric MgTiO3 with excess of Ti. The values of lattice parameters of the non-stoichiometric versus temperature of geikielite found the same for both solid-state reaction and sol-gel products.

Graphical Abstract

1. Introduction

The MgO-TiO2 ceramic system includes three stoichiometric magnesium titanate phases: Mg2TiO4 (qandilite), MgTiO3 (geikielite) and MgTi2O5 (karrooite) [1]. Their crystal structures have been determined by X-ray diffraction and neutron diffraction [2,3]. The phases are:
(a)
Geikielite, MgTiO3, is rhombohedral of ilmenite type, space group R-3 (148), Pearson Symbol hR10.0; formed at temperatures above 600 °C, is stable from room temperature to its melting point;
(b)
Qandilite, Mg2TiO4, cubic of inverse spinel type, space group Fd-3m (227), Pearson Symbol cF56.0, formed at above 1150 °C;
(c)
Karrooite, MgTi2O5, orthorhombic of pseudo-brookite type, space group Cmcm (63), Pearson Symbol oC32.0 formed above 500 °C.
High-temperature X-ray diffraction (HT-XRD) studies have been published for all three stoichiometric Mg titanates prepared by the sol-gel technique during their transformation from the xerogel precursor to their final oxide form for a range of temperatures between 700 and 1300 °C [4]. High-temperature neutron diffraction (HT-ND) studies have been made on Mg2TiO4 synthesized by the solid-state reaction at temperatures between 90 to 1400 °C [5]. In this study, there was agreement between the lattice parameter of the HT-XRD and HT-ND data in the temperature range between 800 and 1300 °C [6]. Importantly, the in-situ HT-XRD studies of MgTiO3 during the firing of xerogel powders between 700 and 1300 °C yielded linear thermal expansion coefficients (TECs).
There are two additional publications with ND-XRD data for MgTiO3, which by contrast, showed non-linear TECs [7,8]. Both publications are for the same sample -Kar2-, studied where the MgTi2O5 (karrooite) phase was the major component and the MgTiO3 (geikielite) and TiO2 (rutile) phases were the minor components (by mass). In these publications, the phases were obtained by the solid-state reaction between MgCO3 and TiO2 fine powders, and the HT-ND data [7,8] were collected on sample Kar2 between 23 and 1305 °C.
Further examination of the HT diffraction works on geikielite showed that there is a significant gap in the lattice parameters between the HT-XRD data received from sol-gel product [4], and HT-ND data received from geikielite using the solid state reaction in that the lattice parameters of the sol-gel product were slightly lower. A key difference in the collection of the data was that the sol-gel data were obtained using a different sample at each temperature after 1 h firing, and the solid-state version was a single sample for all temperatures. In order to determine if the gap originated from the experimental methods or inherent differences in the synthesis (sol-gel vs. solid state), it was decided to investigate a single geikielite sample determining lattice parameters between RT up to 900 °C.
In this work, we complete the HT crystallographic data of sol-gel product of MgTiO3 using HT-XRD measurements of MgTiO3 made by sol-gel technique between 25 and 900 °C and provide insight to the differences in TEC behavior.

2. Materials and Methods

2.1. Synthesis

The magnesium titanates were prepared by the sol-gel method using metalorganic precursors: diethyl ethoxymagnesiomalonate, prepared by metallation of diethyl malonate (1), and titanium(IV) tetra-tert-butoxide (Aldrich), dissolved in anhydrous 2-propanol. The hydrolysis step was carried out at nearly room temperature, using a stream of hot air (about 100 °C) containing water vapor (superheated steam), during about 3 hours, to ensure total hydrolysis. The precipitated solid was filtered, washed with 2-propanol and left to dry in air for several days, until a constant weight was obtained. After analysis of the Mg and Ti content, this solid served as starting material for thermal treatment.
The powders were initially fired at 600 °C for 3 h. After the initial treatment, the sample with Mg:Ti 1.1:1 found as a single geikielite phase, where a = 5.0537 (3) Å; c = 13.897 (5) Å; atomic positions: z(Mg) = 0.3563 (2); z(Ti) = 0.1445 (2); x(O) = 0.315(1); y(O) = 0.0225(1); z(O) = 0.247(1). However, the expected Mg:Ti ratio was confirmed by inductively coupled plasma (ICP). The amount of impurities was below 10 ppm. Additional treatments were made at 1200 °C for 5 h in order to obtain well-crystallized powders. After the 1200 °C treatment, the sample was found with 95% geikielite and 5% qandilite. It was designated as “GQ” (major phase geikielite and minor phase qandilite) and will be referred to as such throughout the manuscript. The qandilite within GQ served as the internal standard.

2.2. RT XRD Measurements

The samples for HT-XRD studies were characterized by a Rigaku powder X-Ray Diffractometer. Data were collected in the conventional Bragg–Brentano configuration (theta/2theta) by means of Cu Kα radiation at 40 kV and 30 mA. The Kβ was filtered out by graphite monochromator attached to the detector. Phase characterization from XRD data was made by using public domain FullProf/WinPlotter software [9]).

2.3. HT XRD Measurements

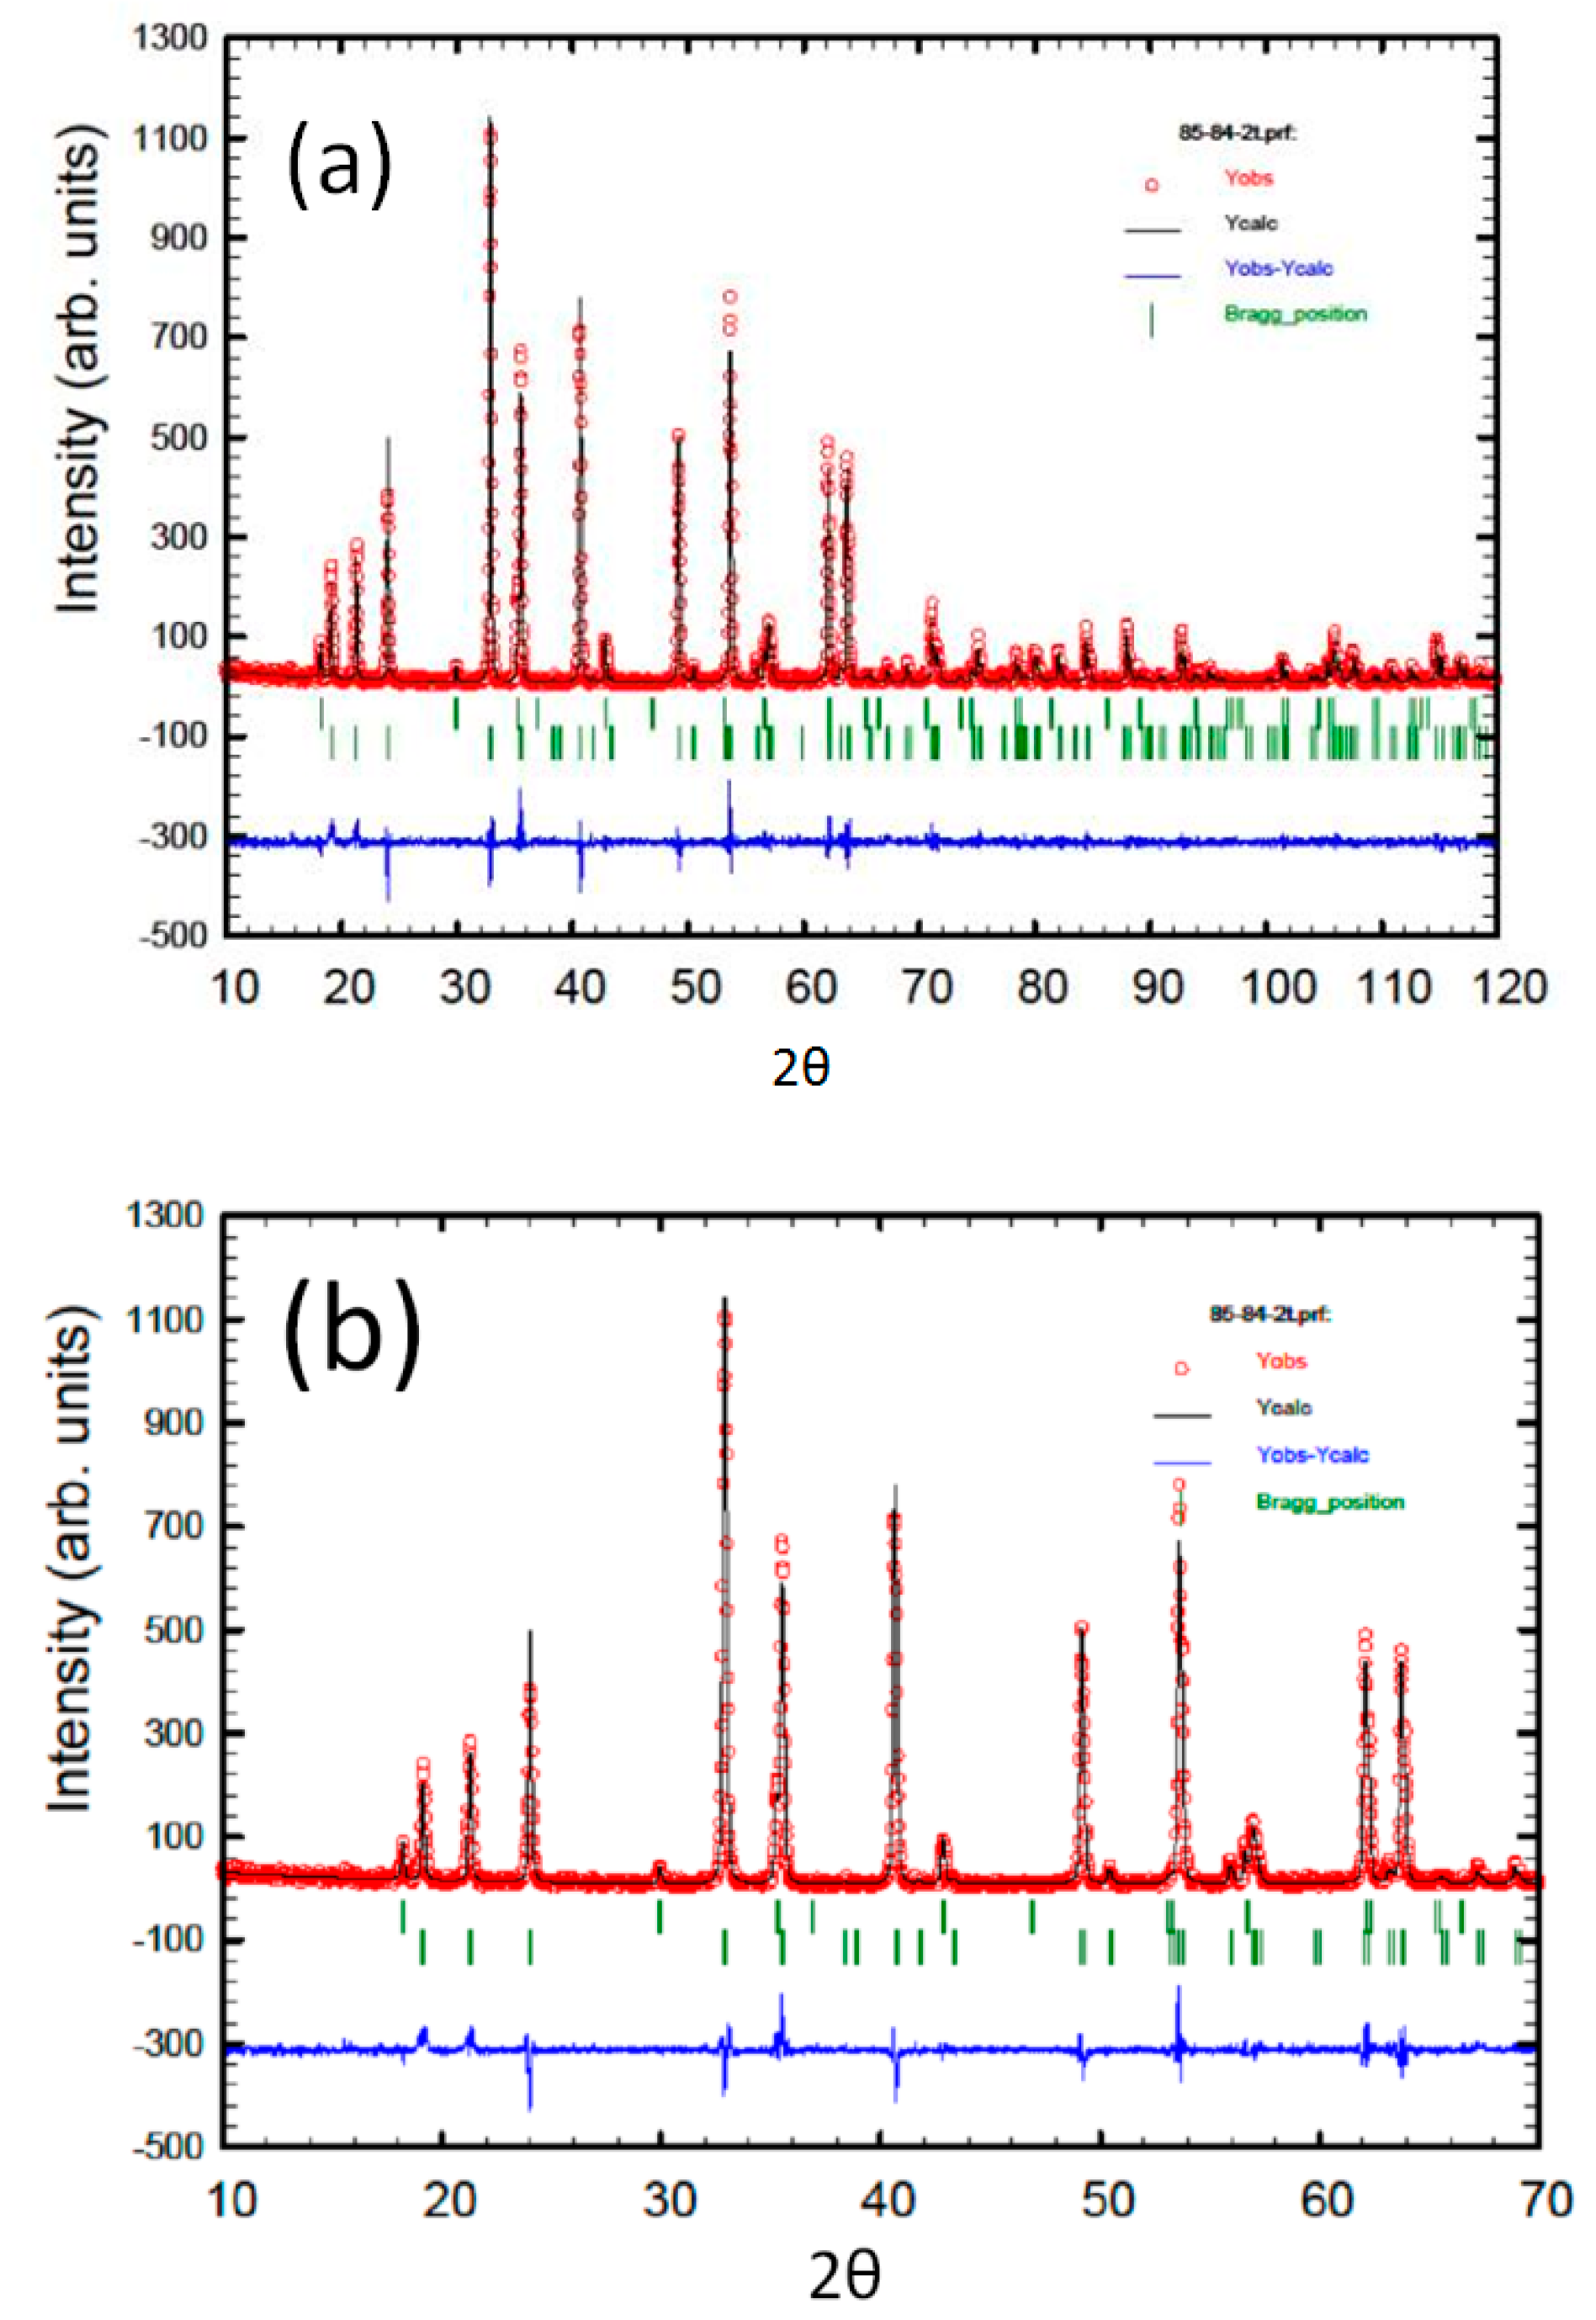
X-ray diffraction was performed on a Bruker D8 Advance in Bragg–Brentano geometry using an X-ray source with a Cu anode having a Kα1 emission wavelength of 1.5406 angstroms. Samples were placed in an Anton Paar XRK-900 high-temperature reaction chamber using a Macor sample stage. The influence of the thermal expansion of the stage was measured by calibrating the stage height as a function of temperature using an alignment slit. The temperature of the sample was controlled using and Anton Paar TCU 750 controller by mounting a K-type thermocouple in the sample holder adjacent to the sample. A linear PSD detector (LYNXEYE XE-T) was used with an opening of 2.94 degrees. The diffraction pattern was recorded from two-theta of 10 degrees until 120 degrees using a coupled theta/two-theta scan type. Data points were acquired in increments of 0.02 degrees with an acquisition time of 0.25 s. Lattice parameters were fitted using TOPAS software with a TCHZ function. The refined parameters included the lattice parameters, sample displacement and zero error. The line position and effect of instrumental broadening and asymmetry were calibrated by SRM 660c LaB6.
The diffractograms were also analyzed by the program Powder-Cell [
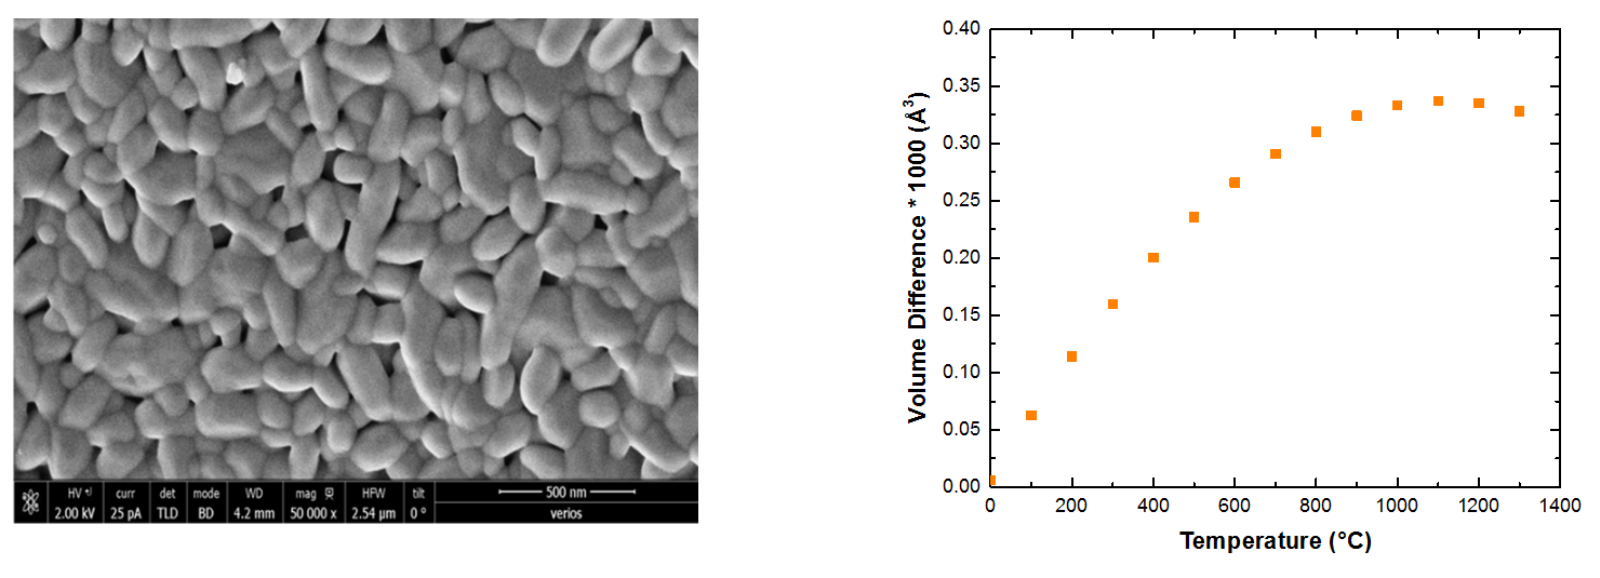
10]. In this step, the phases were easily identified, and the unit cells were verified for the thermal expansion. Grain shape and size was assessed by HR-SEM.

2.4. Thermal Expansion Methodology

It is essential to know the dimensions of ceramic materials as function of temperatures in order to calculate the dimensions of objects working at elevated temperatures and to evaluate thermal stresses during temperature changes. For practical reasons it is suggested to define the relative dimension change of a material by Equation (1):
[L(T) − L0]/L0 = f(TT0)
where L(T) is the size of one dimension at temperature T, L0 is the size of the same dimension at ambient temperature, T is the working temperature and T0 is the ambient temperature (usually the ambient temperature is 25 °C).
In the case of linear thermal expansion, Equation (1) becomes
[L(T) − L0]/L0 = α(TT0)
where α is the linear thermal expansion coefficient. For a general case it is possible to define
ΔL/L0 = α1 ΔT + α2 ΔT2 + ·· + αn ΔTn
or
L(T) = L0(1+ α1 ΔT+ α2 ΔT2+ ·· + αn ΔTn)
where
ΔL = L(T) − L0 and ΔT = TT0
Neglecting the contribution of enhanced vacancy formation at higher temperatures to the size of a sample of matter, the thermal expansion of a periodical crystalline matter can be modeled by measuring its lattice parameters as function of temperature. By using HT diffraction, each lattice parameter, Aj, can be obtained directly from the measurement as
Aj(T) = Aj0 + k1 ΔT + k2 ΔT2 + ·· + kn ΔTn
In this case, the non-linear thermal coefficients will be given as
αij = ki/Aj0
From Equation (3) it is then possible to define an overall thermal expansion coefficient along a crystal axis Aj as
αAj = ΔAj/(Aj0 ΔT)= α1 + α2 ΔT + ·· + αn ΔTn1
Similarly, for unit cell volume V we define the volumetric thermal expansion as
γ = ΔV/(V0 ΔT) = γ1+ γ2 ΔT + ·· + γn ΔTn1
It should be noted that this methodology is valid only where there is no phase transformation or significant crystal structure change in the range of measurements.

3. Results

3.1. As-Received Sample

HR-SEM showed that GQ sample contained fine powder with average grain size at the range of 250–350 nm. This yielded high-quality XRPD diffractograms without preferred orientation
The crystal structures of Mg2TiO4 and MgTiO3 in sample GQ after 5 h annealing at 1200 °C and scanned at room temperature by XRD and analyzed by Rietveld software are given below, in comparison with previously published data. The Rietveld diagram is shown in Figure 1. The phase amounts in sample GQ found as 95.5 wt% MgTiO3 with 4.5 wt% MgTiO4.
The lattice parameters of MgTiO3 in sample GQ at room temperature after annealing at 1200 °C for 5 h in comparison with ICDD data base are given in Table 1.
The lattice parameters of Mg2TiO4 in sample GQ at room temperature after annealing at 1200 °C for 5 h in comparison with ICDD data base are given in Table 2.
The atomic positions of MgTiO3 in sample GQ at room temperature as refined after annealing at 1200 °C for 5 h in comparison with Reference [3] are given in Table 3 (*Rwp 11.88, χ2 = 1.34).
The atomic position of Mg2TiO4 in sample GQ at room temperature after annealing at 1200 °C for 5 h in comparison with Reference [3] is given in Table 4.

3.2. High-Temperature XRD (HT-XRD)

The lattice parameters versus temperature for the sample GQ containing geikielite and qandilite are listed in Table 5. The lattice parameters for the sample, which was scanned after 1 h in previous study [4], are given in Table 6.
Figure 2 shows that the lattice parameters versus temperature of the Mg2TiO4 perfectly integrated with literature data obtained by HT-ND [5].

3.3. Thermal Expansion Coefficients for the Reference Material (Mg2TiO4)

The lattice parameters versus T-25 (°C) were fitted as a polynomial Aj(T) = Aj0 + k1 (T − 25)+ k2 (T − 25)2 as in Equation (5). Then, using Equation (6), αij = ki/Aj0 obtaining αAj = (Aj- Aj0)/[Aj0 (T − 25)] = α1+ α2 (T − 25) as given in Equation (7), or γ = (Vj- Vj0)/[Vj0 (T − 25)] = γ1+ γ2 (T − 25) as given in Equation (8). The thermal expansion coefficients (TEC) for the Mg2TiO4 were calculated from the data of Table 1 and compared with published data [5] made by ND with the selection of similar temperature range. Equation (9) shows the TECs of Mg2TiO4 from this study HT-XRD (GQ sample) 25–890 °C
αa = 8.3 × 10⁶ + 2.9 × 10⁹ (T − 25) [1/°C]
 γ = 2.5 × 10⁵ + 9.3 × 10⁹ (T − 25) [1/°C]
Since the uncertainty of the lattice parameter is ~0.1% and the uncertainty in the temperature is ~0.2%, the maximum uncertainty of the terms in the reported equations for thermal expansion coefficient is ~0.3%. Equation (10) shows the TEC of Mg2TiO4 from previously published data [5], studied by HT-ND for selected temperature range 25–890 °C.
αa = 9.2 × 10⁻⁶ + 1.9 × 10⁻⁹ (T − 25) [1/°C]
 γ = 2.7 × 10⁻⁵ + 6.2 × 10⁻⁹ (T − 25) [1/°C]

3.4. Thermal Expansion Coefficients for MgTiO3

There was excellent agreement between the high-temperature lattice parameter data of MgTiO3 made in the present investigation by comparison to the results found in the higher temperature range for xerogels from the HT-XRD in situ study of seven samples [4], as shown in Table 6. It seems that the presence of qandilite did not affect the TECs of the geikielite. HT-XRD data of the GQ sample together with published data [4,8] of MgTiO3 are plotted in Figure 3.
For the present HT-XRD study, with the data collected at a temperature range between 25 and 890 °C, the overall thermal expansion coefficients for the MgTiO3 are given in Equation (11).
αa = 8.4 × 10⁻⁶ + 2.0 × 10⁻⁹ (T − 25) [1/°C]
αc = 1.1 × 10⁻⁵ + 1.7 × 10⁻⁹ (T − 25) [1/°C]
γ = 2.8 × 10⁻⁵ + 6.5 × 10⁻⁹ (T − 25) [1/°C]
TECs obtained from previous sol-gel product at a temperature range between 700 and 1300 °C [4] (using Table 6) are given in Equation (12).
αa = 8.6 × 10⁻⁶ + 1.8 × 10⁻⁹ (T − 25) [1/°C]
αc = 1.3 × 10⁻⁵ + 9.510−10 (T − 25) [1/°C]
γ = 2.1 × 10⁻⁵ + 3.0*10−9 (T − 25) [1/°C]
Thermal expansion expression for the sol-gel derived products are calculated by combining the present and previous HT-XRD data [4] (Table 5 and Table 6) with the whole temperature range (25–1300 °C), and the overall thermal expansion coefficients for MgTiO3 are given in Equation (13).
αa = 8.5 × 10⁻⁶ + 1.9 × 10⁻⁹ (T − 25) [1/°C]
αc = 1.1 × 10⁻⁵ + 1.7 × 10⁻⁹ (T − 25) [1/°C]
γ = 2.8 × 10⁻⁵ + 6.0 × 10⁻⁹ (T − 25) [1/°C]
Thermal expansion expressions for solid-state reaction products calculated from HT-ND studies between 23 and 1212 °C of MgTiO3 made by solid-state reaction [7,8] are given in Equation (14).
αa = 9.4 × 10⁻⁶ + 1.8 × 10⁻⁹ (T − 25) [1/°C]
αc = 1.2 × 10⁻⁵ + 1.2 × 10⁻⁹ (T − 25) [1/°C]
γ = 3.1 × 10⁻⁵ + 4.0 × 10⁻⁹ (T − 25) [1/°C]

3.5. Atomic Positions

Selected data of the refined atomic positions for geikielite as refined by the Rietveld method, are given in Table 7.
After cooling to room temperature, the sample returned into the initial as-received RT crystallographic data of qandilite and geikielite. The lattice parameters were in (Å): MgTi2O4 (qandilite) a = 8.4404 (6) and MgTiO3 (geikielite): a = 5.054 (1); c = 13.905 (2). The atomic positions for the geikielite are given in Table 7 (column GQPOST).

4. Discussion

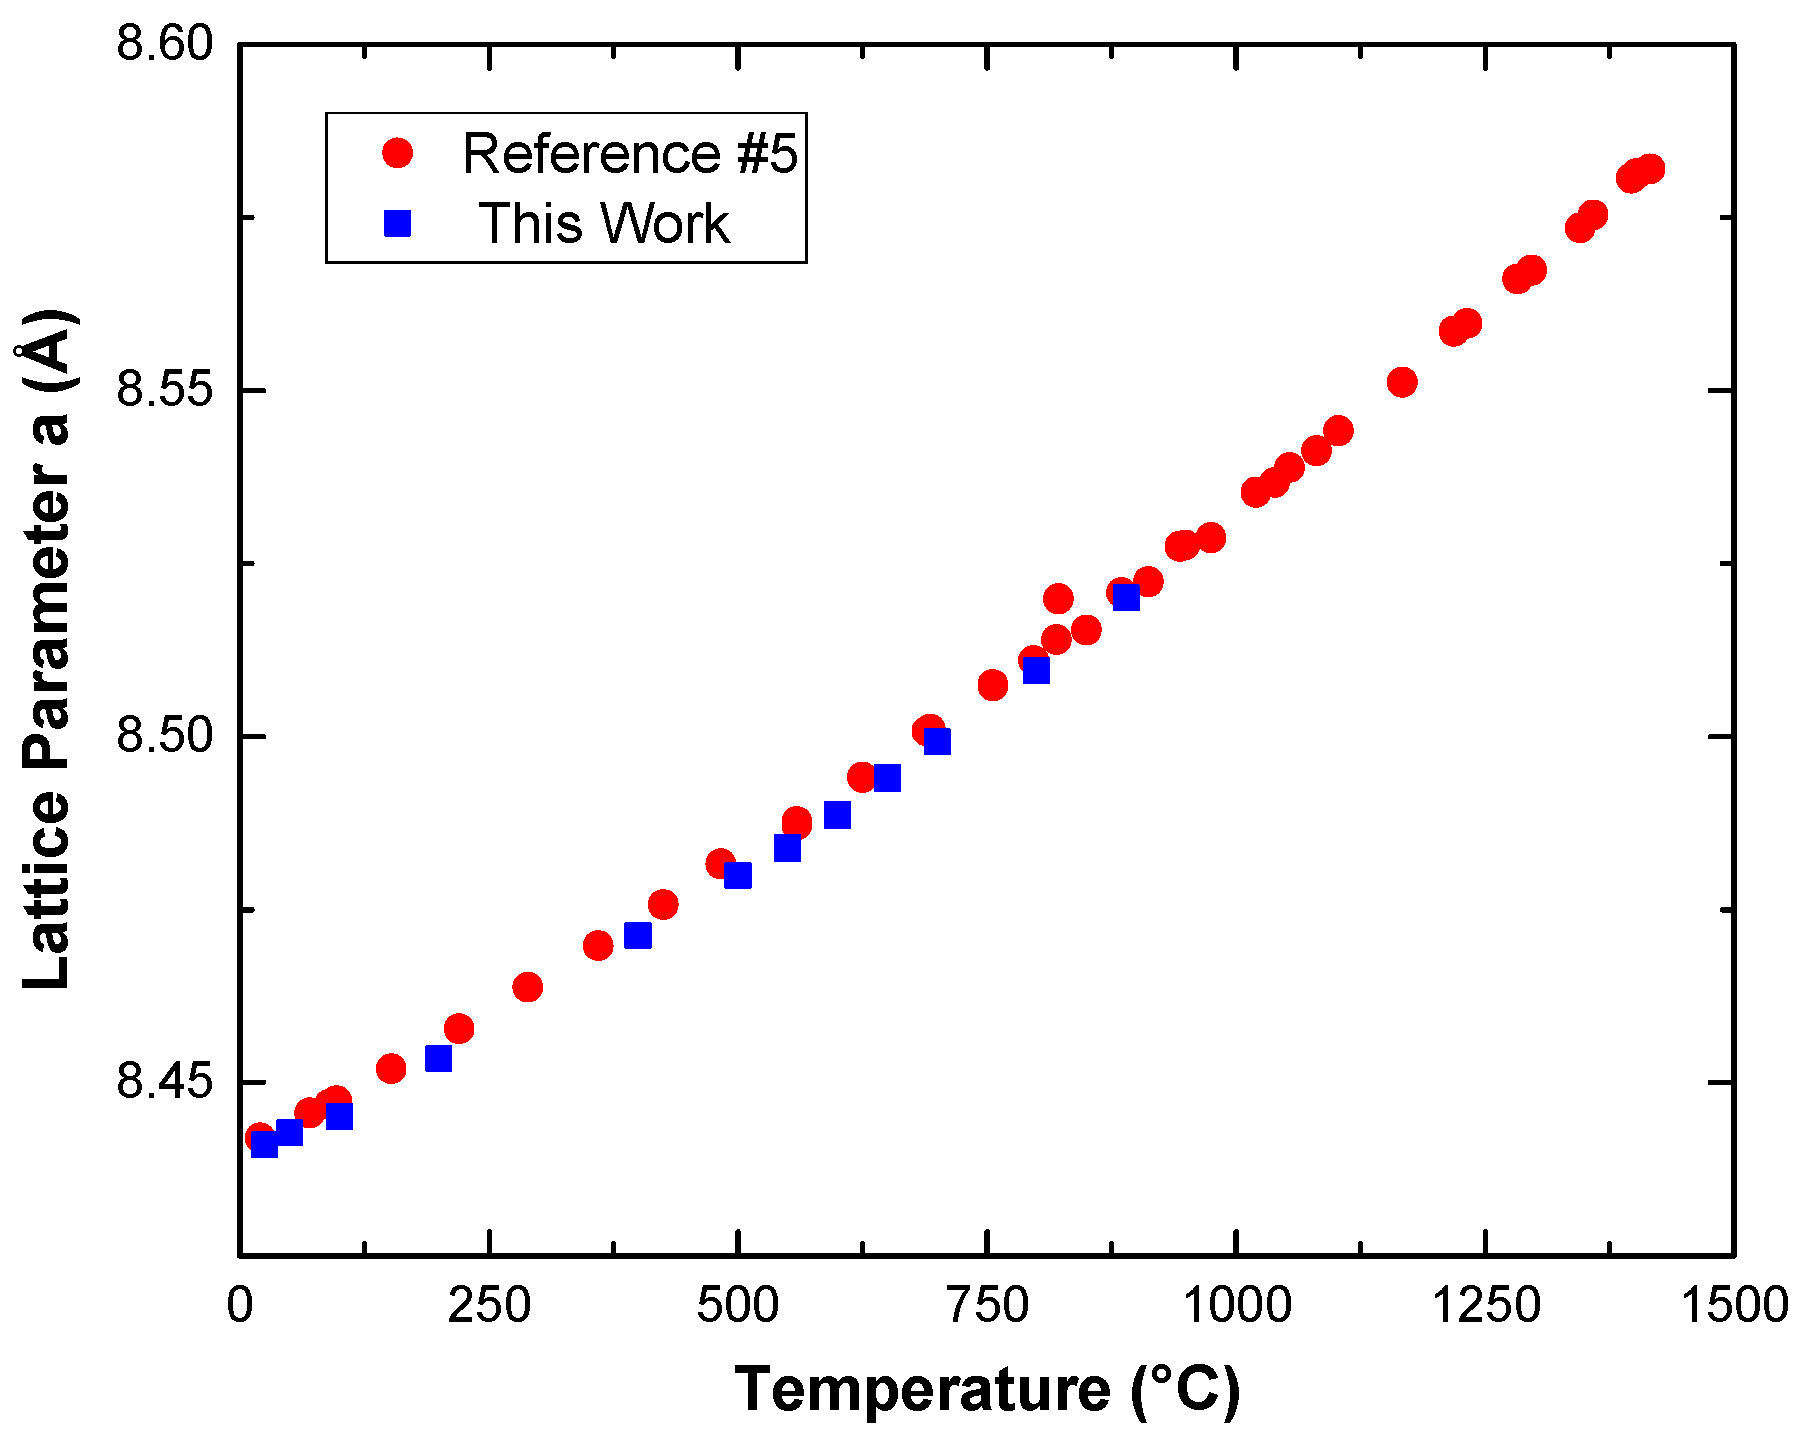
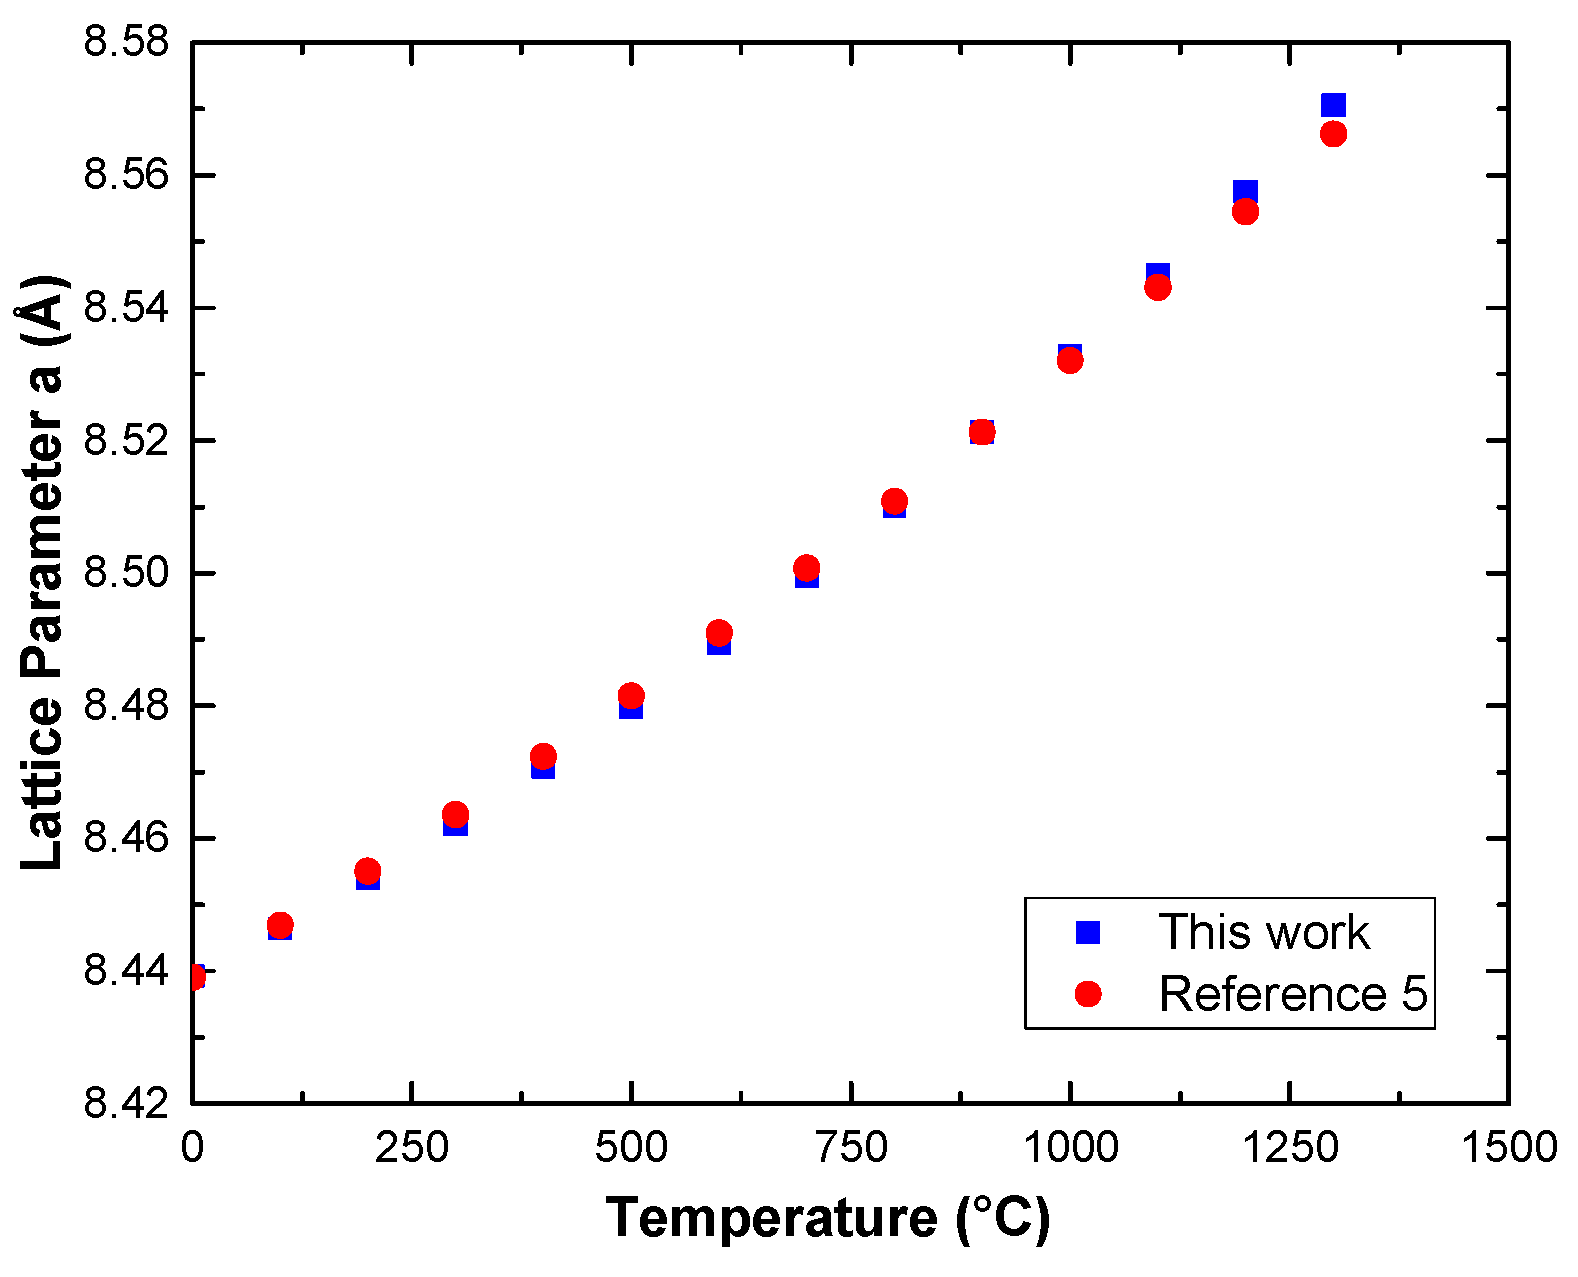
Figure 2 shows that the lattice parameters versus temperature of the reference material, Mg2TiO4, are in excellent agreement with the published HT-ND data [5]. Figure 4 shows a comparison between calculated lattice parameters versus temperature derived from Equations (9) and (10) showing complete overlapping of the lattice parameters of the reference material (Mg2TiO4) (Equation (9)) and published HT-ND study of Mg2TiO4 [5].
A comparison of Table 5 and Table 6 shows that in MgTiO3 there was no significant change in the atomic positions along the experimental temperature range (25–890 °C).
There was excellent agreement with present and previous HT-XRD data of a sol-gel MgTiO3 product after 1 h firing [4] (Figure 3). The agreement with former HT-XRD on sol-gel products should be appreciated because, in contrast to usual TEC investigations, which are done on a single sample, it was done with different sample at each temperature. In order to eliminate the experimental scattering, the calculated lattice parameters versus temperature were plotted. 
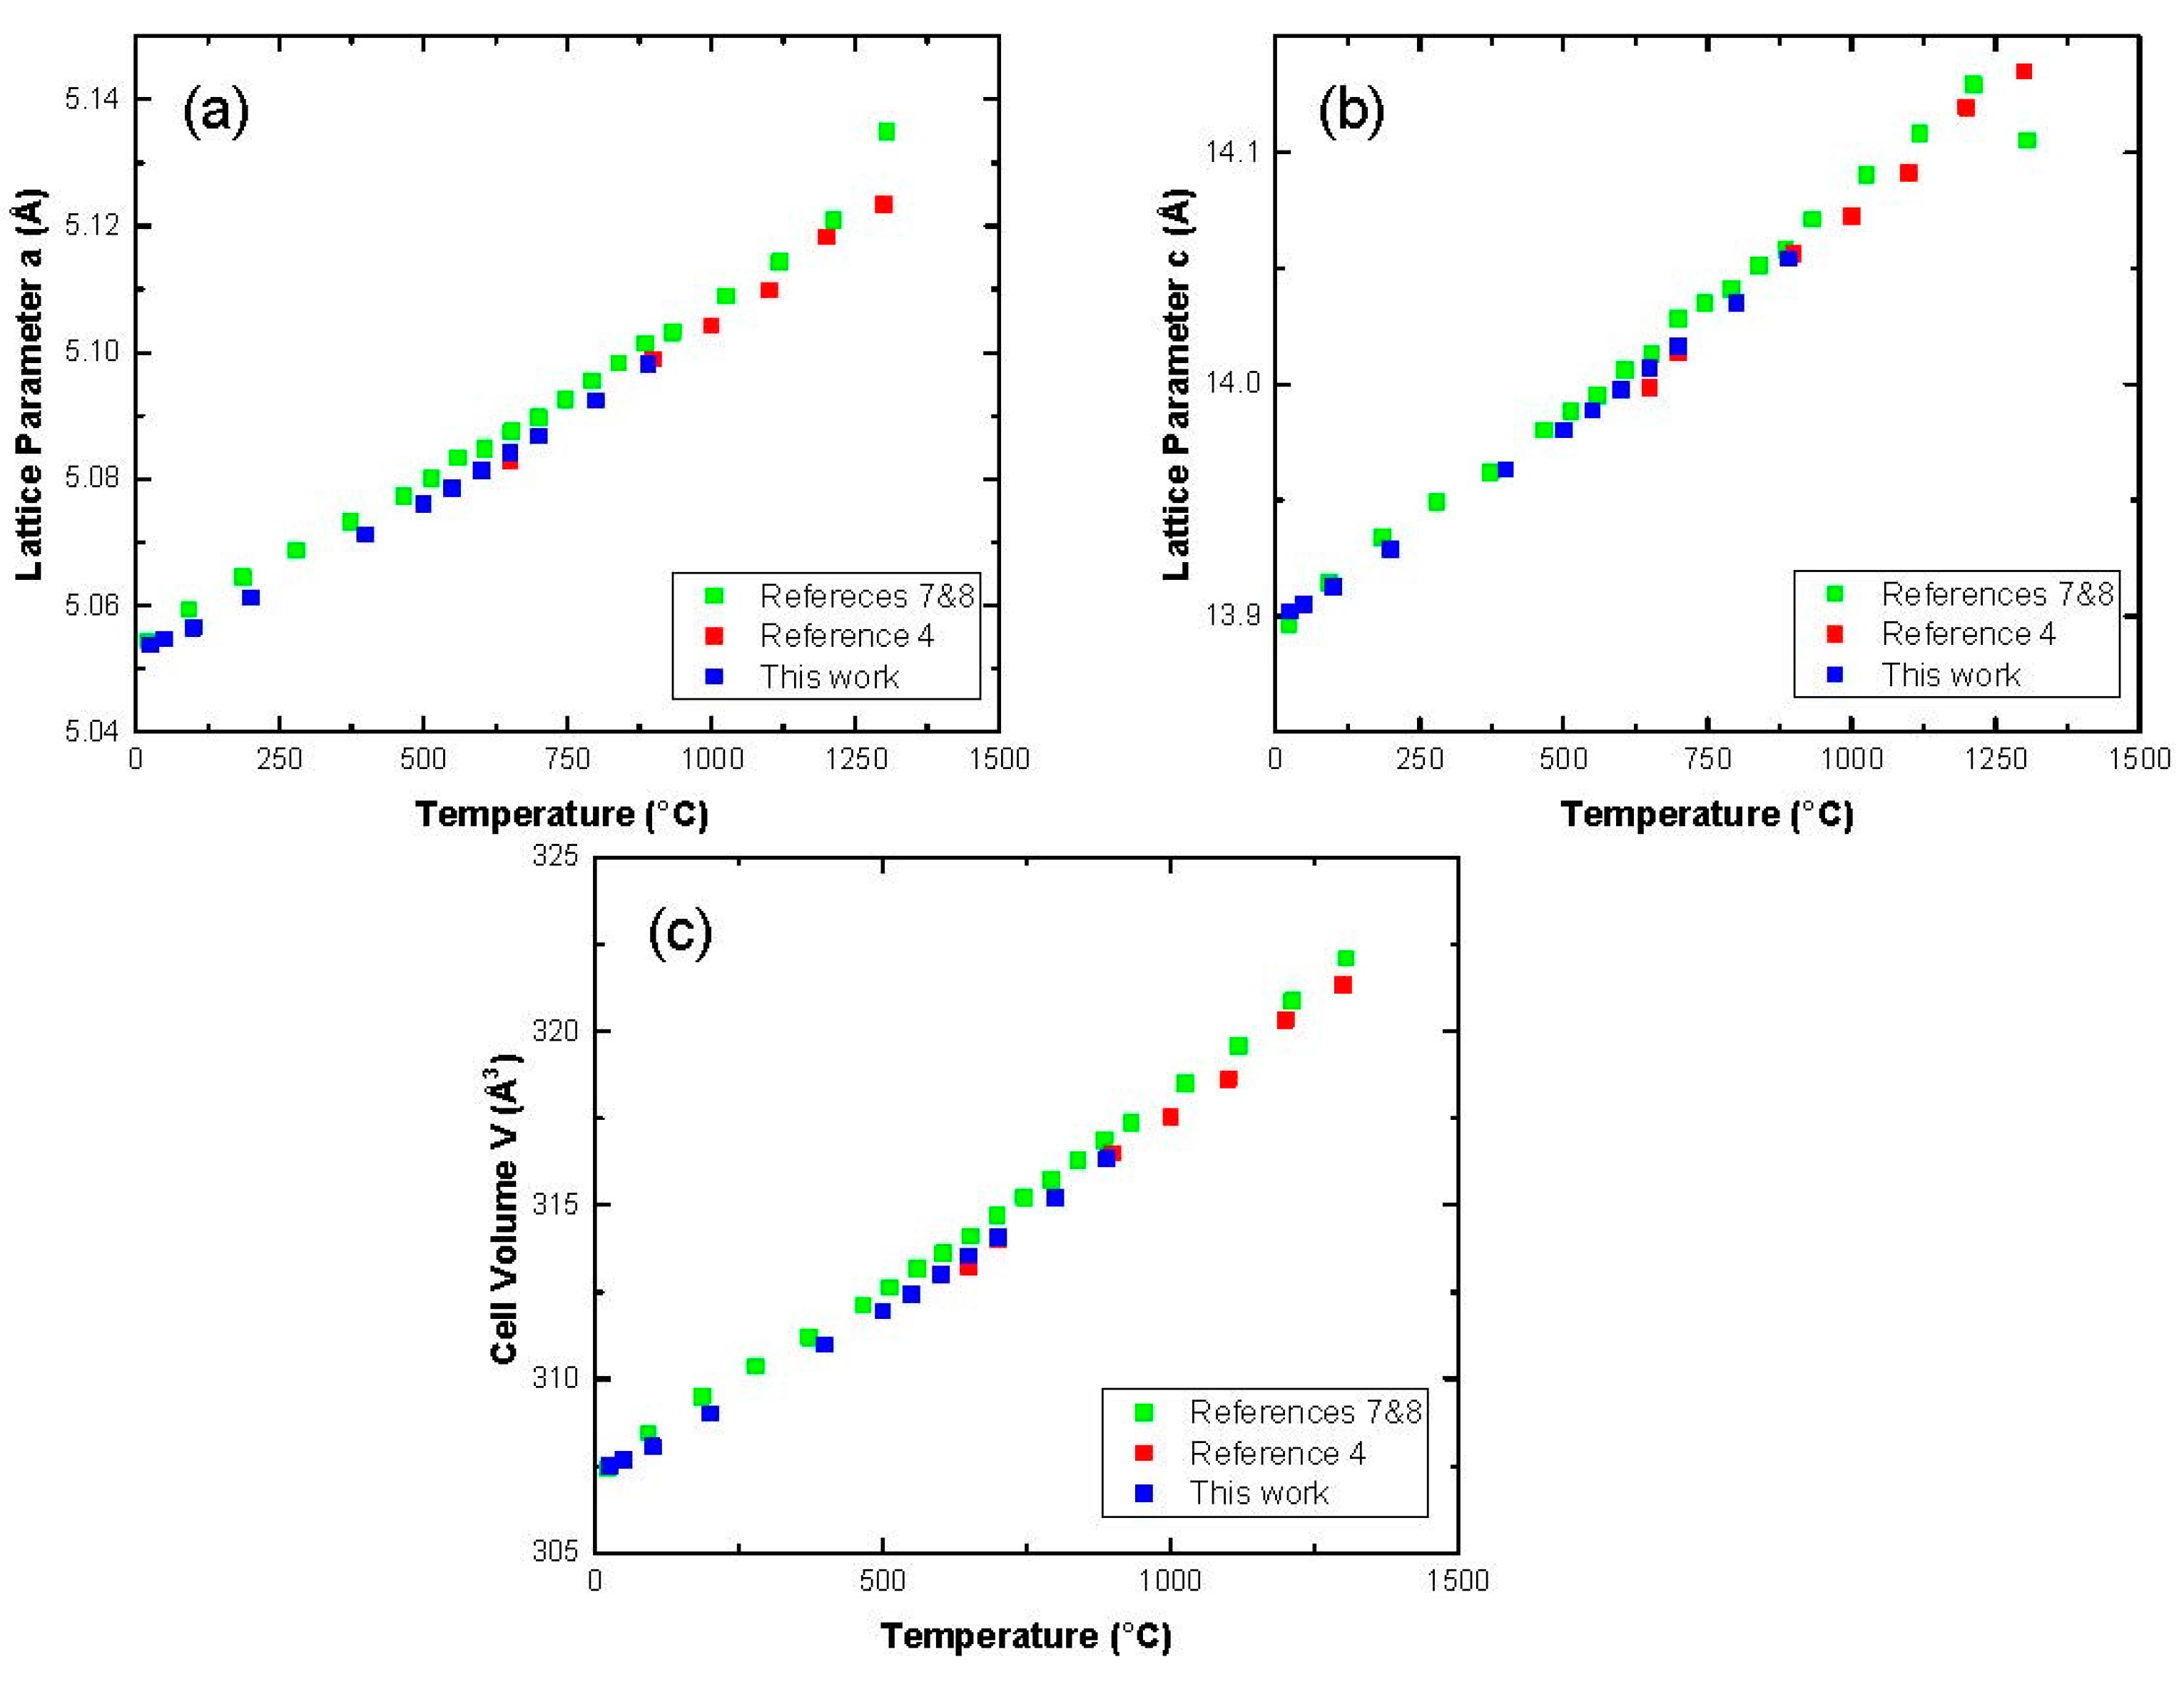
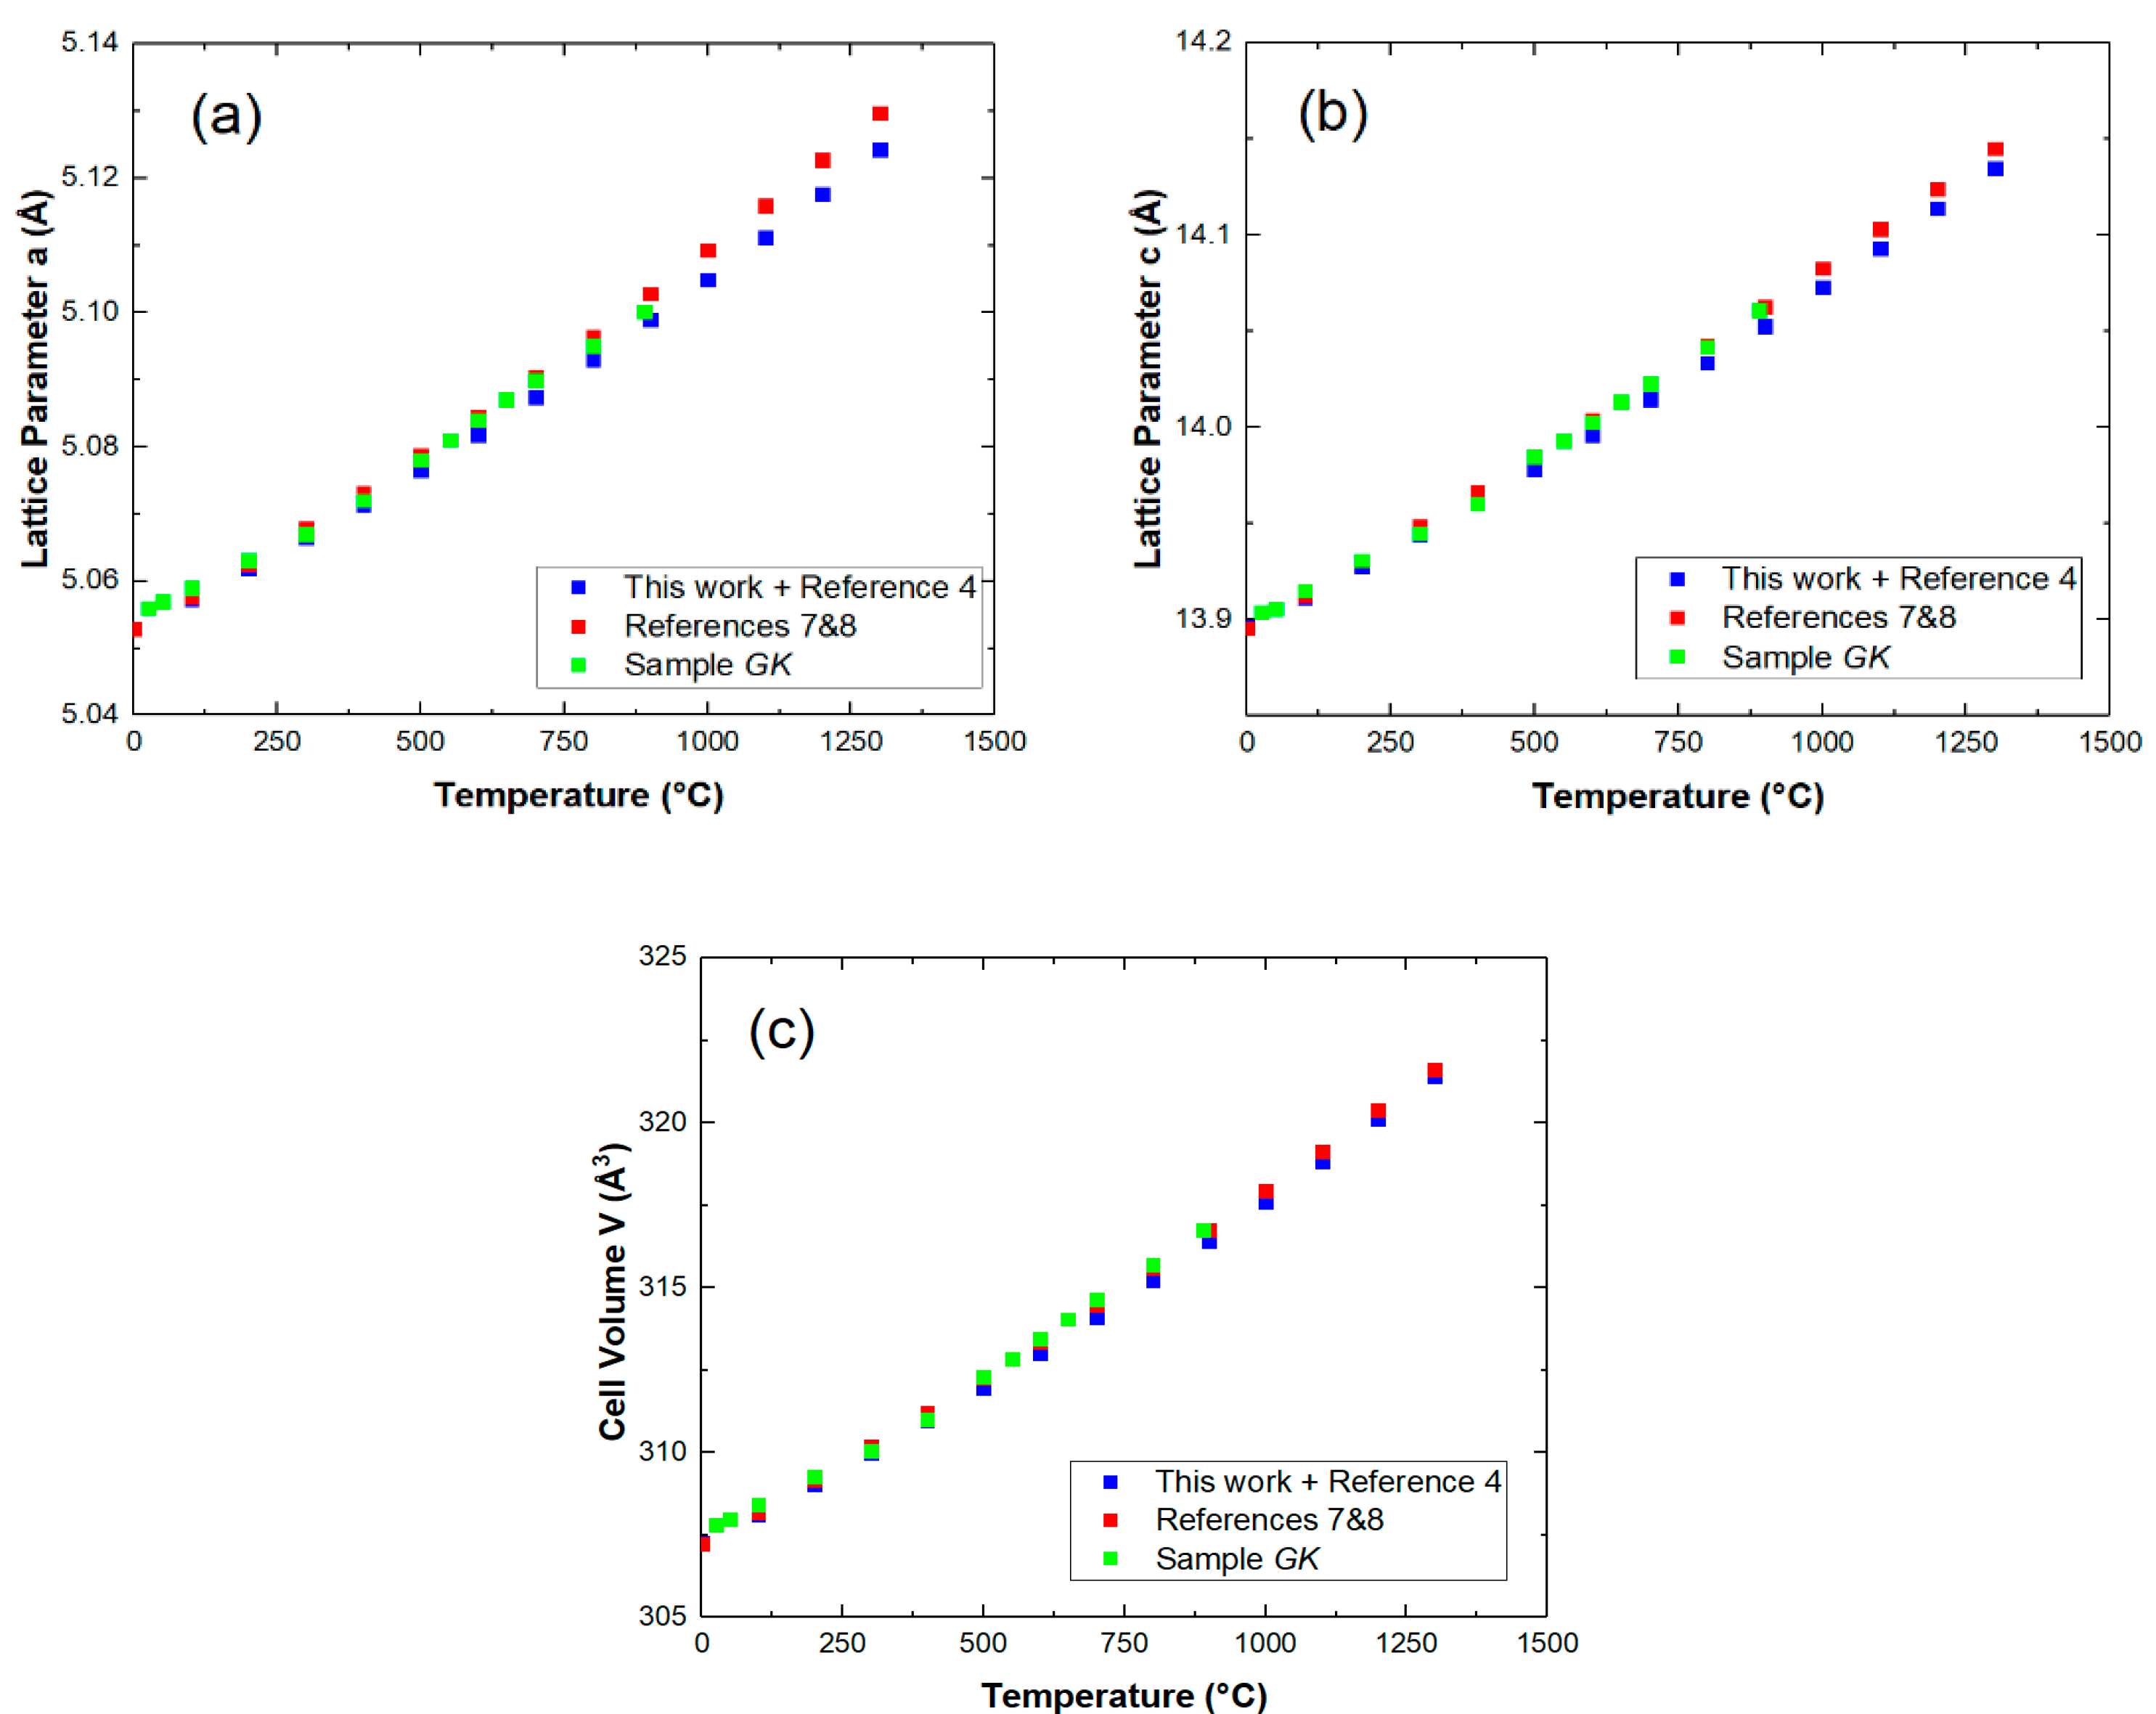
Figure 5 shows that there was fair agreement between the lattice parameters versus temperature, between RT and 1300 °C, of all the sol-gel products of MgTiO3 studied in HT-XRD data (present work and Reference [4]) in comparison with published results of minor MgTiO3 phase in reference [7,8].
However, the lattice parameters of the sol-gel products were slightly lower. As presented in the literature [1,2], there is an asymmetric solubility gap in the geikielite with dissolving some amount of Ti at elevated temperatures. The lattice parameters of sample GQ (MgTiO3 with a small amount of Mg2TiO4) fit those of stoichiometric MgTiO3 as reported in Reference [4]. This supports the phase diagram [1,2] that there is no Mg solubility. Since sample Kar2 [7,8] was a mixture of small amounts of MgTiO3 and TiO2 with MgTi2O5 as a major compound, it is reasonable to attribute the slight decrease of the lattice parameter of MgTiO3 as stated in Reference [8] to some excess of Ti. In order to verify this hypothesis, we conducted an additional HT-XRD study of a second sol-gel product with a mixture of MgTiO3 and MgTi2O5. The xerogel with 1 < Mg:Ti < 2 was annealed 5 h at 1200 °C forming 78 wt% geikielite and 22 wt% karrooite. We designated this sample as “GK”.
Figure 5 shows that at elevated temperatures, the lattice parameters of the MgTiO3 as obtained from HT-XRD were slightly higher than those in sample GQ and in reference [4]. Moreover, they fit very well with those of sample Kar2 [7,8]. This confirms our assumption that the gap between the lattice parameters originated from excess of Ti in the Kar2 geikielite sample from references [7,8].
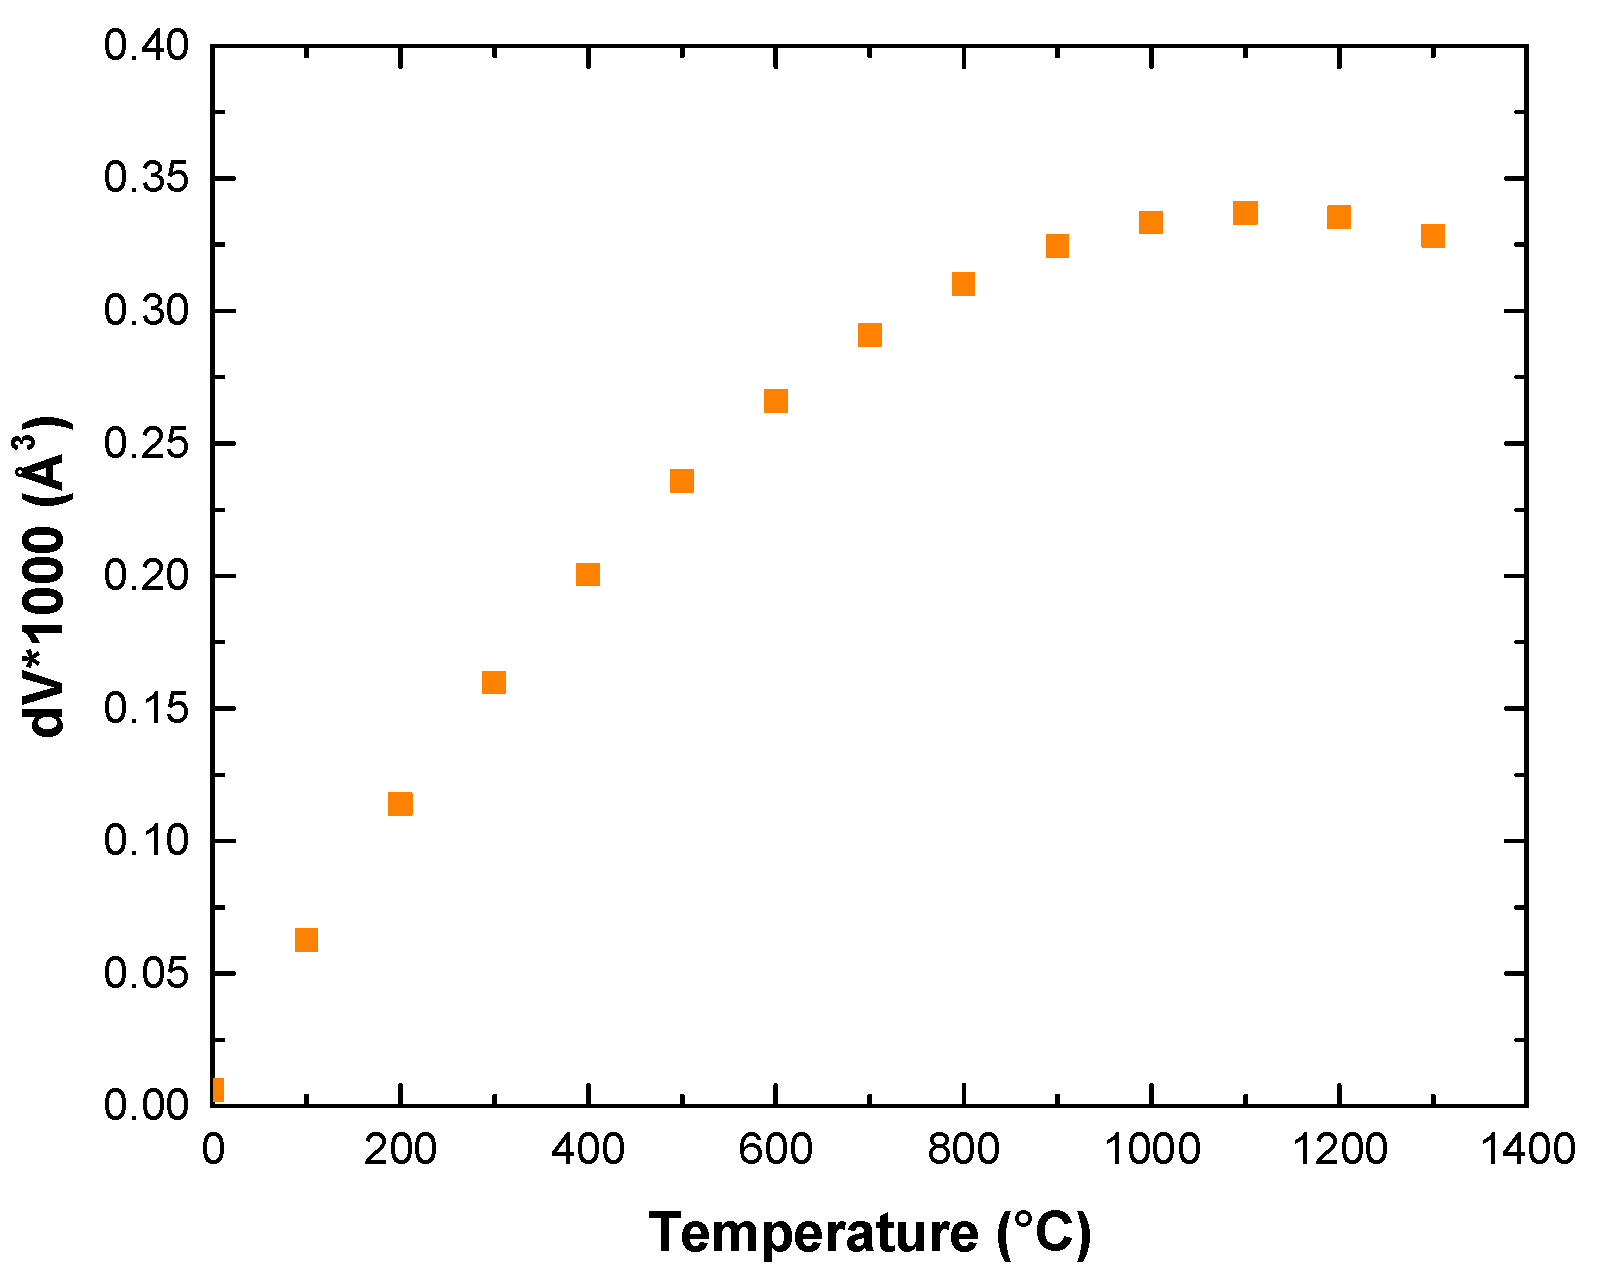
The difference between the lattice volumes for sample GQ+ Reference [4] and sample GK+kar2 versus temperature is given in Figure 6, which shows that the gap between the lattice parameters increased with temperature until 1000 °C and then slightly decreased.
In this work, stoichiometric geikielite from eight samples made by sol-gel technique yielded new HT-XRD data. Therefore, as a result of the present work, it was found that there is no single set of TECs for the geikielite. It agrees with the phase diagram determined by Shindo [1] with an asymmetric solubility range in the geikielite. Both the sol-gel sample (GK) measured by HT-XRD and solid-state reaction (Kar2) measured by HT-ND were mixtures of geikielite and karrooite with maximum excess of Ti in the geikielite. Furthermore, both GK and Kar2 samples had similar lattice parameters, higher than the new data of the stoichiometric geikielite. Neither sample preparation nor diffraction method modified the TECs in geikielite. The fact that the sample GQ data integrated in seven stoichiometric samples [4] agrees with the phase diagram determined by Shindo [1] with absence of Mg solubility.

5. Conclusions

Accurate thermal expansion coefficients were measured for sol-gel products of stoichiometric MgTiO3. The lattice parameters of MgTiO3 made by sol-gel synthesis measured in HT-XRD between 25 and 890 °C are well integrated with the previously reported HT-XRD study of sol-gel MgTiO3 product between 700 and 1300 °C. The lattice parameters of stoichiometric MgTiO3 sol-gel products are slightly lower than nonstoichiometric MgTiO3 with maximal excess of Ti. It is assumed the TECs of geikielite depend on deviations from stoichiometry. Neither sample preparation nor diffraction method modified the TECS in geikielite.

Author Contributions

T.T., student coordinator, literature survey, cross-checking all XRD results; G.K., R.T., XRD analysis of all XRD by Fullprof; B.A.R., collected the high-temperature XRD and performed the Rietveld analysis in Topas; J.Z., samples’ production by sol-gel technique; H.D. and R.Z.S. synthesis of samples. All authors have read and agreed to the published version of the manuscript.

Funding

This research received no external funding.

Acknowledgments

The authors wish to acknowledge Elena Goncharov for the contribution to the synthesis.

Conflicts of Interest

The authors declare no conflict of interest.

References

  1. Shindo, I. Determination of the phase diagram by the slow cooling float zone method: The MgO-TiO2 system. J. Cryst. Growth 1980, 50, 839–851. [Google Scholar] [CrossRef]
  2. Wechsler, B.A.; Navrotsky, A. Thermodynamics and structure chemistry of compounds in the system MgO-TiO2. J. Solid State Chem. 1984, 55, 165–180. [Google Scholar] [CrossRef]
  3. Wechsler, B.A.; Von Dreele, R.B. Structure refinements of Mg2TiO4, MgTiO3, MgTi2O5 by time to flight neutron powder diffraction. Acta Cryst. 1989, B45, 542–549. [Google Scholar] [CrossRef]
  4. Zabicky, J.; Kimmel, G.; Goncharov, E.; Guirado, F. Magnesium titanate phases from xerogels by hot stage X-ray powder Diffractometry. Z. Krist. Suppl. 2009, 30, 347–352. [Google Scholar] [CrossRef]
  5. O’Neill, H.S.C.; Redfern, S.A.T.; Kesson, S.; Short, S.M. An in situ neutron diffraction study of cation disordering in synthetic qandilite Mg2TiO4 at high temperatures. Am. Mineralog. 2003, 88, 860–865. [Google Scholar] [CrossRef]
  6. Tuval, T.; Zabicky, J.; Gispert-Guiardo, G.; Kimmel, G.; Gomcharoc, E.; Shneck, R.Z. In situ HTXRD formation of magnesium titanates. J. Am. Ceram. Soc. 2018, 101, 4367–4374. [Google Scholar] [CrossRef]
  7. Lennie, A.R.; Knight, K.S.; Michael, C.; Henderson, B. Cation ordering in MgTi2O5 (karrooite): Probing temperature dependent effects with neutrons. Am. Mineral. 2007, 92, 165–1180. [Google Scholar] [CrossRef]
  8. Henderson, C.M.B.; Knight, K.S.; Lennie, A.R. Temperature dependence of rutile (TiO2) and geikielite (MgTiO3). Open Mineral. J. 2009, 3, 1–11. [Google Scholar] [CrossRef]
  9. Rodriguez-Carvajal, J. Recent advances in magnetic structure determination by neutron powder diffraction. Phys. B Condens. Matter 1993, 192, 55–69. [Google Scholar] [CrossRef]
  10. Kraus, K.; Nolze, G. Powder cell—A program for the representation and manipulation of crystal structures and calculation of the resulting X-ray powder patterns. J. Appl. Cryst. 1996, 29, 301–303. [Google Scholar] [CrossRef]
Figure 1. (a) Rietveld diagram (FullProf) of sample GQ after 5 h annealing at 1200 °C and scanned in a Rigaku diffractometer at room temperature (whole 2θ range). (b) Rietveld diagram (FullProf) of sample GQ after 5 h annealing at 1200 °C and scanned in Rigaku diffractometer at room temperature (small 2θ range).
Crystals 10 00887 g001
Figure 2. Lattice parameter a of the reference Mg2TiO4 material versus temperature from HT-XRD of sample GQ in comparison to reported HT-ND data [5].
Crystals 10 00887 g002
Figure 3. (a) Lattice parameter a, (b) lattice parameter c and (c) cell volume versus temperature for MgTiO3 from present GQ and previous samples HT diffraction. Data taken from this work and [4,7,8].
Crystals 10 00887 g003
Figure 4. Calculated lattice parameters of Mg2TiO4 versus temperature, derived from Equations (9) and (10).
Crystals 10 00887 g004
Figure 5. (a) Calculated lattice parameter a of MgTiO3 versus temperature, derived from Equations (13) and (14) and experimental lattice parameter a of geikielite from sample GK. (b) Calculated lattice parameter c of MgTiO3 versus temperature, derived from Equations (13) and (14) and experimental lattice parameter c of geikielite from sample GK. (c) Calculated lattice volume of MgTiO3 versus temperature, derived from Equations (13) and (14) and experimental lattice volume of geikielite from sample GK.
Crystals 10 00887 g005
Figure 6. Difference between lattice volume of geikielite in GK sample in this work + references [7,8] and the GQ sample in this work+ reference [5] as function of temperature (using calculated data).
Crystals 10 00887 g006
Table 1. RT lattice parameter of MgTiO3.
Lattice ParametersLattice VolumeICDD #Comment
a [Å]c [Å]V [Å3] Quality
5.05713.903307.901-073-7748Star
5.05713.903307.901-075-8341Star
5.05413.899307.501-79-0831Star
5.056 (2)13.902 (2)307.8 (3)ICDDAverage
5.054 (1)13.904 (2)307.6 (3)GQ ARReitveld, FullProf
5.054 (1)13.902 (2)307.5 (3)GQ ARReitveld, Topas *
* Rwp 11.88, χ2 = 1.34.
Table 2. Room temperature lattice parameters of Mg2TiO4.
Lattice ParameterICDD #Comment
a [Å] Quality
8.44201-072-6966Star
8.44701-072-6977Star
8.44701-72-6967Star
8.44100-025-1157Star
8.444 (3)ICDDAverage
8.442 (1)GQ ARAmbient
8.441 (1)GQ ARHot stage *
* Rwp 11.88, χ2 = 1.34.
Table 3. Ion positions in MgTiO3 as received. (*) Hot stage before heat treatment; (**) Rigaku conventional diffractometer.
MgTiO3
ion/positionGQ- *GQ- **Reference [3]
z(Mg2+)0.35610.35560.3556
z(Ti4+)0.14450.14460.1451
x(O2−)0.31080.31730.3159
y(O2−)0.01400.02150.0215
z(O2−)0.24910.24650.2470
Table 4. The atomic position of Mg2TiO4 (XRD data from Rigaku conventional diffractometer).
Mg2TiO4
Ion/positionGQReference [3]
z(O2−)0.25880.2605
Table 5. Lattice parameters of MgTiO3 and Mg2TiO4 as function of temperature in the present investigation (sample GQ). All parameters are given in Å.
MgTiO3Mg2TiO4
T °Ca * [Å]c # [Å]a # [Å]
255.05413.9028.441
505.05513.9058.443
1005.05613.9138.445
2005.06113.9298.453
4005.07113.9638.471
5005.07613.9808.480
5505.07913.9898.484
6005.08113.9988.489
6505.08414.0078.494
7005.08714.0168.499
8005.09214.0358.510
8905.09814.0548.520
* uncertainty = 0.0003 Å. # uncertainty = 0.0008 Å.
Table 6. Lattice parameters of MgTiO3 as function of temperature in a previous investigation [4] of sol-gel product.
Geikielite
T °Ca [Å]c [Å]
7005.08714.014
8005.09214.035
9005.09814.050
10005.10414.072
11005.11114.093
12005.11714.115
13005.12314.136
A uncertainty = 0.0002 Å. c uncertainty = 0.0005 Å.
Table 7. Atomic positions for MgTiO3 in sample GQ as function of temperature (hot-stage).
SampleGQ (AR)GQ25GQ200GQ400GQ600GQ800GQ900GQPOST
PositionT [°C]252520040060080089025
cz(Mg)0.35560.35620.35630.35630.35710.35690.35740.3565
cz(Ti)0.14460.14440.14450.14450.14470.14500.14510.1453
fx(O)0.31730.31980.32030. 31990. 31930. 31420. 31690.3166
fy(O)0.02150.02140.02180. 02110. 02060. 01830.01900.0252
fz(O)0.24650.24330.24330. 24330. 24330. 24570. 24260.2465
Rp14.39.899.668.328.128.017.974.93
Rwp19.811.8811.529.749.359.269.052.1
χ21.261.341.311.291.371.261.267.1

