Article

Iron-Doped Lithium Tantalate Thin Films Deposited by Magnetron Sputtering: A Study of the Iron Role in the Structure and the Derived Magnetic Properties

by
Sergio David Villalobos Mendoza
1,
José Trinidad Holguín Momaca
2,
José Trinidad Elizalde Galindo
1,
Diana María Carrillo Flores
1,
Sion Federico Olive Méndez
2 and
José Rurik Farías Mancilla
1,*
1
Departamento de Física y Matemáticas, Instituto de Ingeniería y Tecnología, Universidad Autónoma de Ciudad Juárez, Av. del Charro 450, Cd. Juárez, Chihuahua 32310, Mexico
2
Laboratorio Nacional de Nanotecnología, Centro de Investigación en Materiales Avanzados S.C., Miguel de Cervantes 120, Chihuahua 31136, Mexico
*
Author to whom correspondence should be addressed.
Crystals 2020, 10(1), 50; https://doi.org/10.3390/cryst10010050
Submission received: 22 October 2019 / Revised: 8 January 2020 / Accepted: 12 January 2020 / Published: 19 January 2020
(This article belongs to the Section Crystalline Materials)

Abstract

:
Fe-doped LiTaO3 thin films with a low and high Fe concentration (labeled as LTO:Fe-LC and LTO:Fe-HC, respectively) were deposited by magnetron sputtering from two home-made targets. The dopant directly influenced the crystalline structure of the LiTaO3 thin films, causing the contraction of the unit cell, which was related to the incorporation of Fe3+ ions into the LiTaO3 structure, which occupied Li positions. This substitution was corroborated by Raman spectroscopy, where the bands associated with Li-O bonds broadened in the spectra of the samples. Magnetic hysteresis loops, zero-field cooling curves, and field cooling curves were obtained in a vibrating sample magnetometer. The LTO:Fe-HC sample demonstrates superparamagnetic behavior with a blocking temperature of 100 K, mainly associated with the appearance of Fe clusters in the thin film. On the other hand, a room temperature ferromagnetic behavior was found in the LTO:Fe-LC layer where saturation magnetization (3.80 kAm−1) and magnetic coercivities were not temperature-dependent. Moreover, the crystallinity and morphology of the samples were evaluated by X-ray diffraction and scanning electron microscopy, respectively.

Graphical Abstract

1. Introduction

ABO3-type oxides represent an important group of materials in the classification of advanced ceramics since a large variety of physical properties can be ascribed to them, such as ferroelectricity, piezoelectricity, electrostriction, and pyroelectricity [1]. Nowadays, it is common to modify the physical properties of ABO3-type materials by the addition of different kinds of dopants at the A or B sites. Concerning their magnetic properties, it is well known that ferromagnetism can be induced in these types of materials by doping with elements containing d, f, and sp electrons, as well as promoting cation and anion vacancies. Ferromagnetic (FM) behavior in ABO3 oxides has been reported by doping with 3d-transition metals, as, for example, Mn-doped LiNbO3 thin films, Co-doped SrTiO3 particles, Fe-doped BaTiO3 particles, Fe-LiTaO3 particles, and Fe-LiNbO3 thin films [2,3,4,5,6].
Lithium tantalate (LT) is an important ABO3 material that presents good pyroelectric and piezoelectric properties, a high Curie temperature of 605 °C, and a significant spontaneous electric polarization of 60 μC cm−2 [7]. Over the years, LT has been synthesized in the form of particles [8,9,10], pellets [11], and thin films [12]. Different deposition methods have been reported for the growth of LT thin films, with ferroelectric, dielectric, and pyroelectric properties [13,14,15,16]. Among the most important applications, electro-optical devices, infrared detectors, and surface acoustic wave devices stand out [5,13]. LT and lithium niobate (LiNbO3; LN) are isostructural materials (trigonal) with space group R3c and point group 3m. Frenkel-type defects, such as Li vacancies (VLi−1) and Nb/Ta-antisites, are the main structural defects in congruent LN/LT crystals [7,17]. In the case of LN, the NbLi5+-antisite is generated when the excess of Nb in the congruent LN composition occupies the Li sites [7,18,19]. Due to the similar ionic radii of Li and Nb ions, a tendency of Nb to occupy Li positions has been observed, thus creating an antisite defect. Hence, Li vacancies compensate for the difference in electric charge that arises from the Li and Nb ions, maintaining electronic neutrality [19]. The occupancy site of Fe ions in Fe-doped LN has been studied in the past few decades. Zhao et al. showed evidence of Fe incorporation into the regular Nb sites [20]. Gog et al. concluded that Fe ions occupy Li sites [21], meanwhile, the micro-Raman analysis of Mignoni et al. showed that the Fe ions occupies Li sites and restore the Nb-antisite ions to their initial positions [22,23]. In general, the most accepted conceptual framework is that Fe ions are incorporated into the regular Li sites [24,25,26]. Frenkel defects thus play an essential role in the doping of LN/LT.
These reports are the basis to imply that a different LT solid solution can be obtained by the addition of 3d dopants, being, in principle, a good candidate to present magnetic behavior. This phenomenon has not been studied previously in LT thin films, and it would give rise to the understanding of the influence of the dopant in its structural and physical properties. This work aims to analyze the effect of Fe dopant in the LT structure and the derived magnetic properties by synthesizing Fe-doped LT thin films on indium tin oxide (ITO) substrates (using magnetron sputtering).

2. Experimental Details

A mechanochemical-calcination method was used to obtain LT nanoparticles (NPs) using a SPEX-8000M high-energy mill. The used precursors were lithium carbonate and tantalum pentoxide, with a purity of 99.0%. The stoichiometric reaction of the compounds is:
Li 2 C O 3 ( s ) + T a 2 O 5 ( s )   2 LiTa O 3 ( s ) + C O 2 ( g )
The mechano-activated powders were thermally treated at 700 °C for 3 h to achieve complete crystallization. After corroborating the LT crystalline phase of the NPs by X-ray diffraction (XRD) and Raman Spectroscopy (RS), they were ground in the high-energy mill with αFe2O3 (99.99% purity) in a weight ratio of 0.5 wt.% (grinding 1) and 1.8 wt.% (grinding 2).
Powders from grinding 1 were pressed with an axial force of 6 500 Kgf to get a green pellet, which was sintered at 1100 °C for 6 h with a heating rate of 3 °C per minute (equal to the cooling rate); following this process, a first target (T1) was obtained. The same procedure was repeated for grinding 2. As a result, a second target (T2) was obtained. From T1 and T2, Fe-doped LiTaO3 thin films with low- (LTO:Fe-LC) and high-Fe concentrations (LTO:Fe-HC) were synthesized, respectively. The thin films were grown on ITO/Pyrex substrates by magnetron sputtering (AJA international- Orion 5) using a radio-frequency power source. The deposition conditions for LTO:Fe-LC and LTO:Fe-HC are shown in Table 1. According to [27], the main variables that influence the structure in thin films during a sputtering process are the substrate temperature, substrate, working pressure, atmosphere, and RF power. All the aforementioned variables were kept constant in the sputtering process of our thin films, with the exception of the RF power, which was varied slightly (50 W for LTO: Fe-HC and 30 W for LTO: Fe-LC). Finally, the thin films were thermally treated in an oxidizing atmosphere (air) with a heating rate of 5 °C min−1, an isotherm of 600 °C for 3 h, and a cooling rate of 10 °C min−1 for the LTO:Fe-LC sample, while the LTO:Fe-HC layer was thermally treated by a heating ramp of 40 °C min−1 and an isotherm of 600 °C for 1 h (cooled to room temperature). The parameters and conditions used in the synthesis of LTO:Fe-HC and LTO:Fe-LC will play a very important role in the magnetic behavior of the samples, as will be discussed later in the section of magnetic properties.
The structural analysis of the thin films was carried out using XRD in a Panalytical X-Pert equipment with a Cu-Kα radiation source (λ = 1.5418 Å), in a Bragg–Brentano θ–2θ configuration, at 40 keV and 30 mA, with steps of 0.0170° every 1 s, and from a 2θ range of 20° to 60°. The Crystallography Open Database (COD) 2101846 contains the supplementary crystallographic data of the LiTaO3 phase. These data can be obtained free of charge via [28].
The Fe concentration in the films was evaluated using energy-dispersive X-ray spectroscopy (EDS). The Raman spectra were obtained using a Witec confocal-Raman microscope with an excitation wavelength of 532 nm; the laser intensities can be varied from a 0.649 W·cm−2 to 9.538 W·cm−2 (focus spot of 700 μm). The integration time used in the experiments was 5 sec with 12 accumulations (at maximum intensity). The surface morphology of the samples was observed by scanning electron microscopy (SEM), using a JEOL JSM-7401F. On the other hand, magnetic hysteresis loops (M–H), zero-field cooling and field cooling (ZFC-FC) curves were obtained using a VersaLab equipment from Quantum Design.

3. Results and Discussion

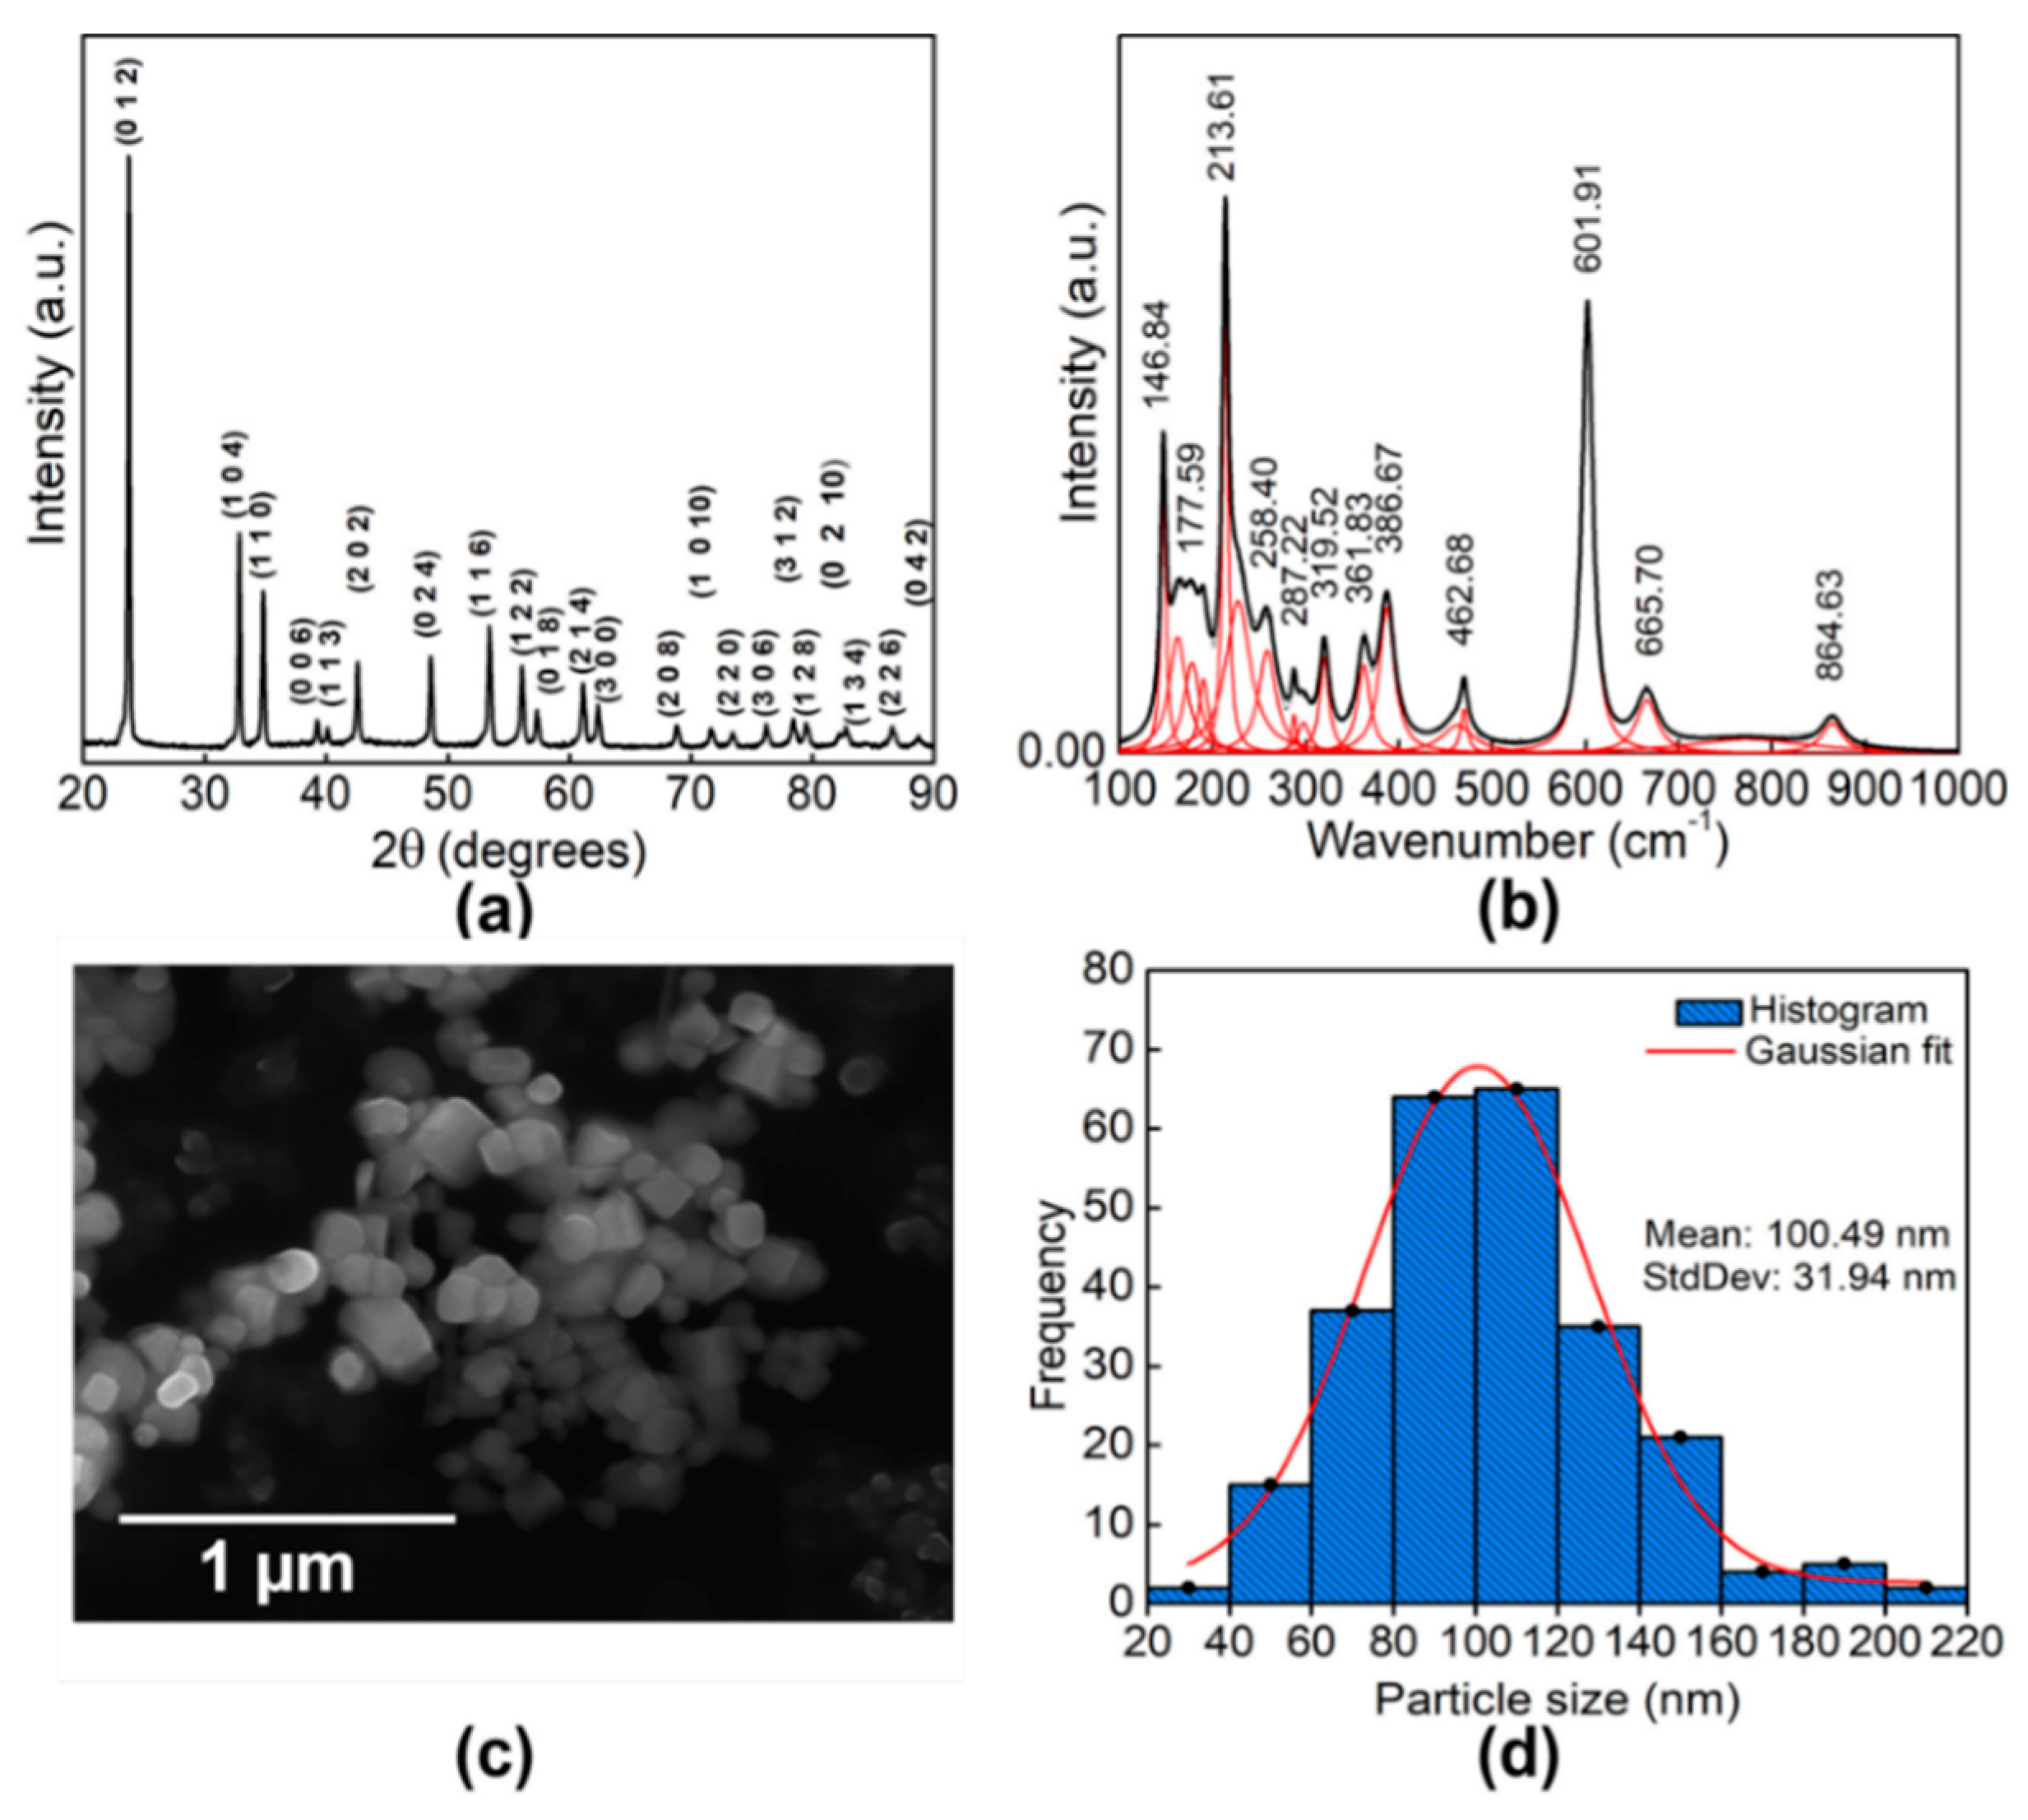
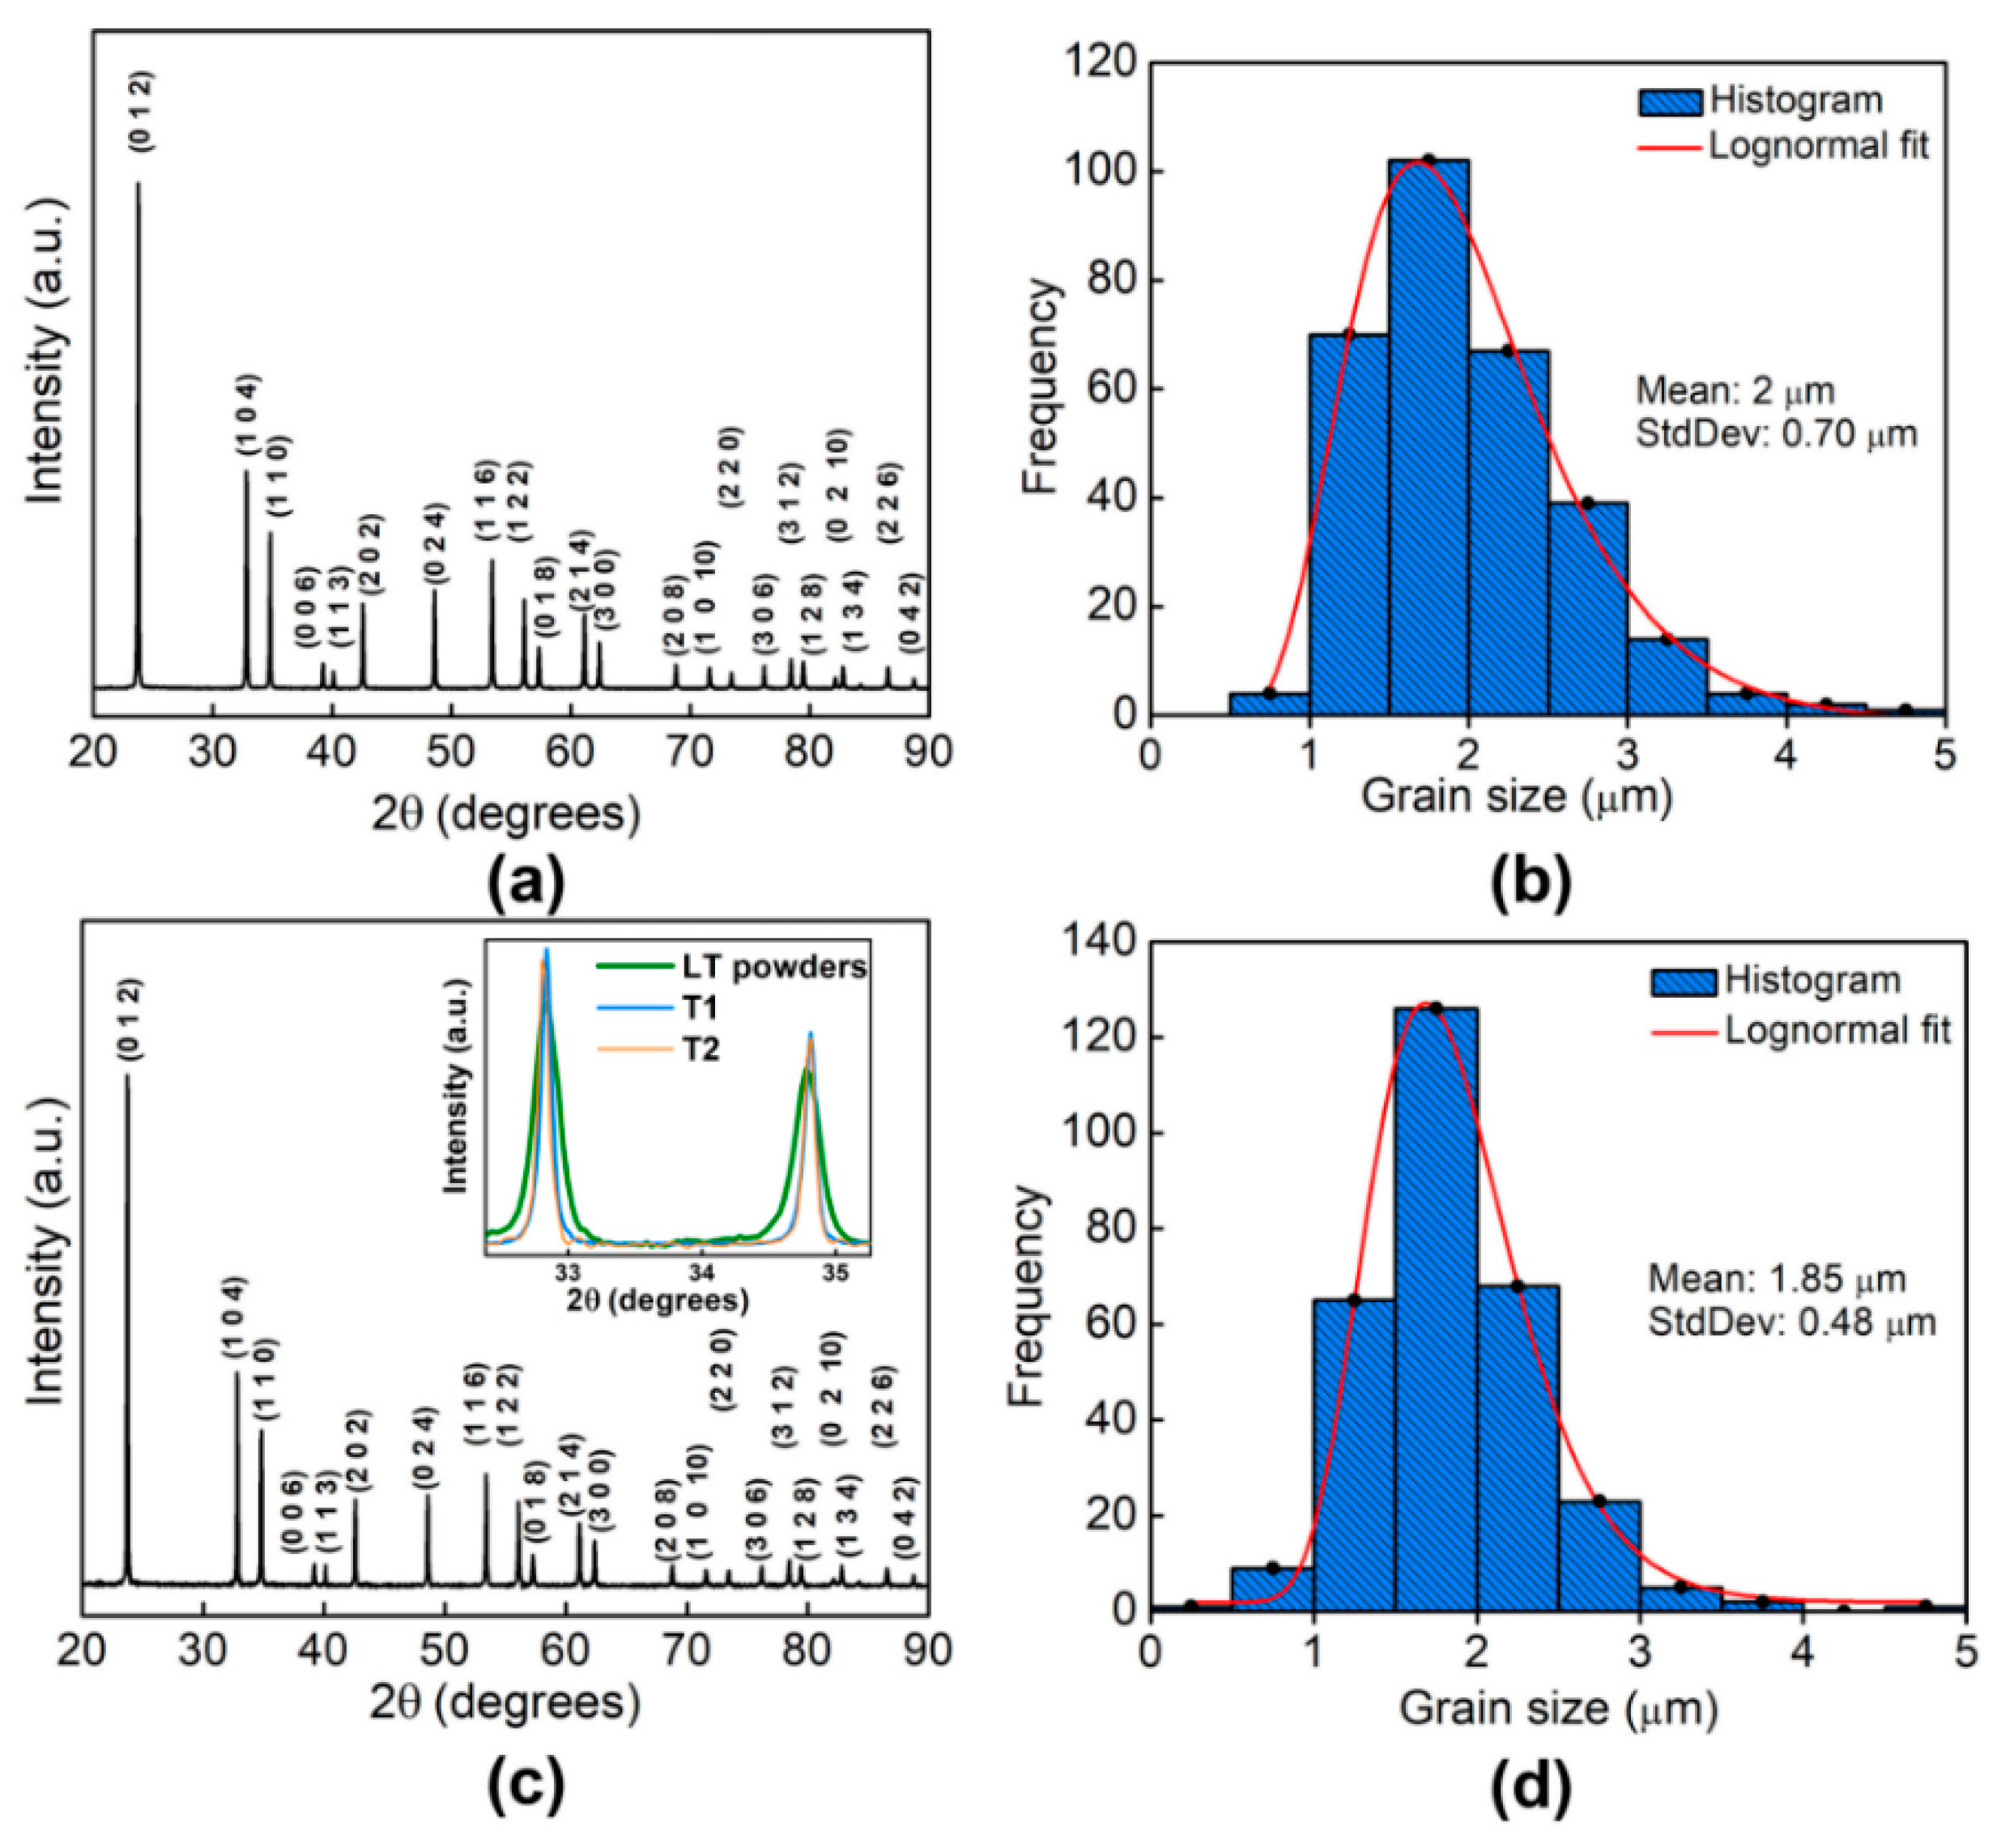
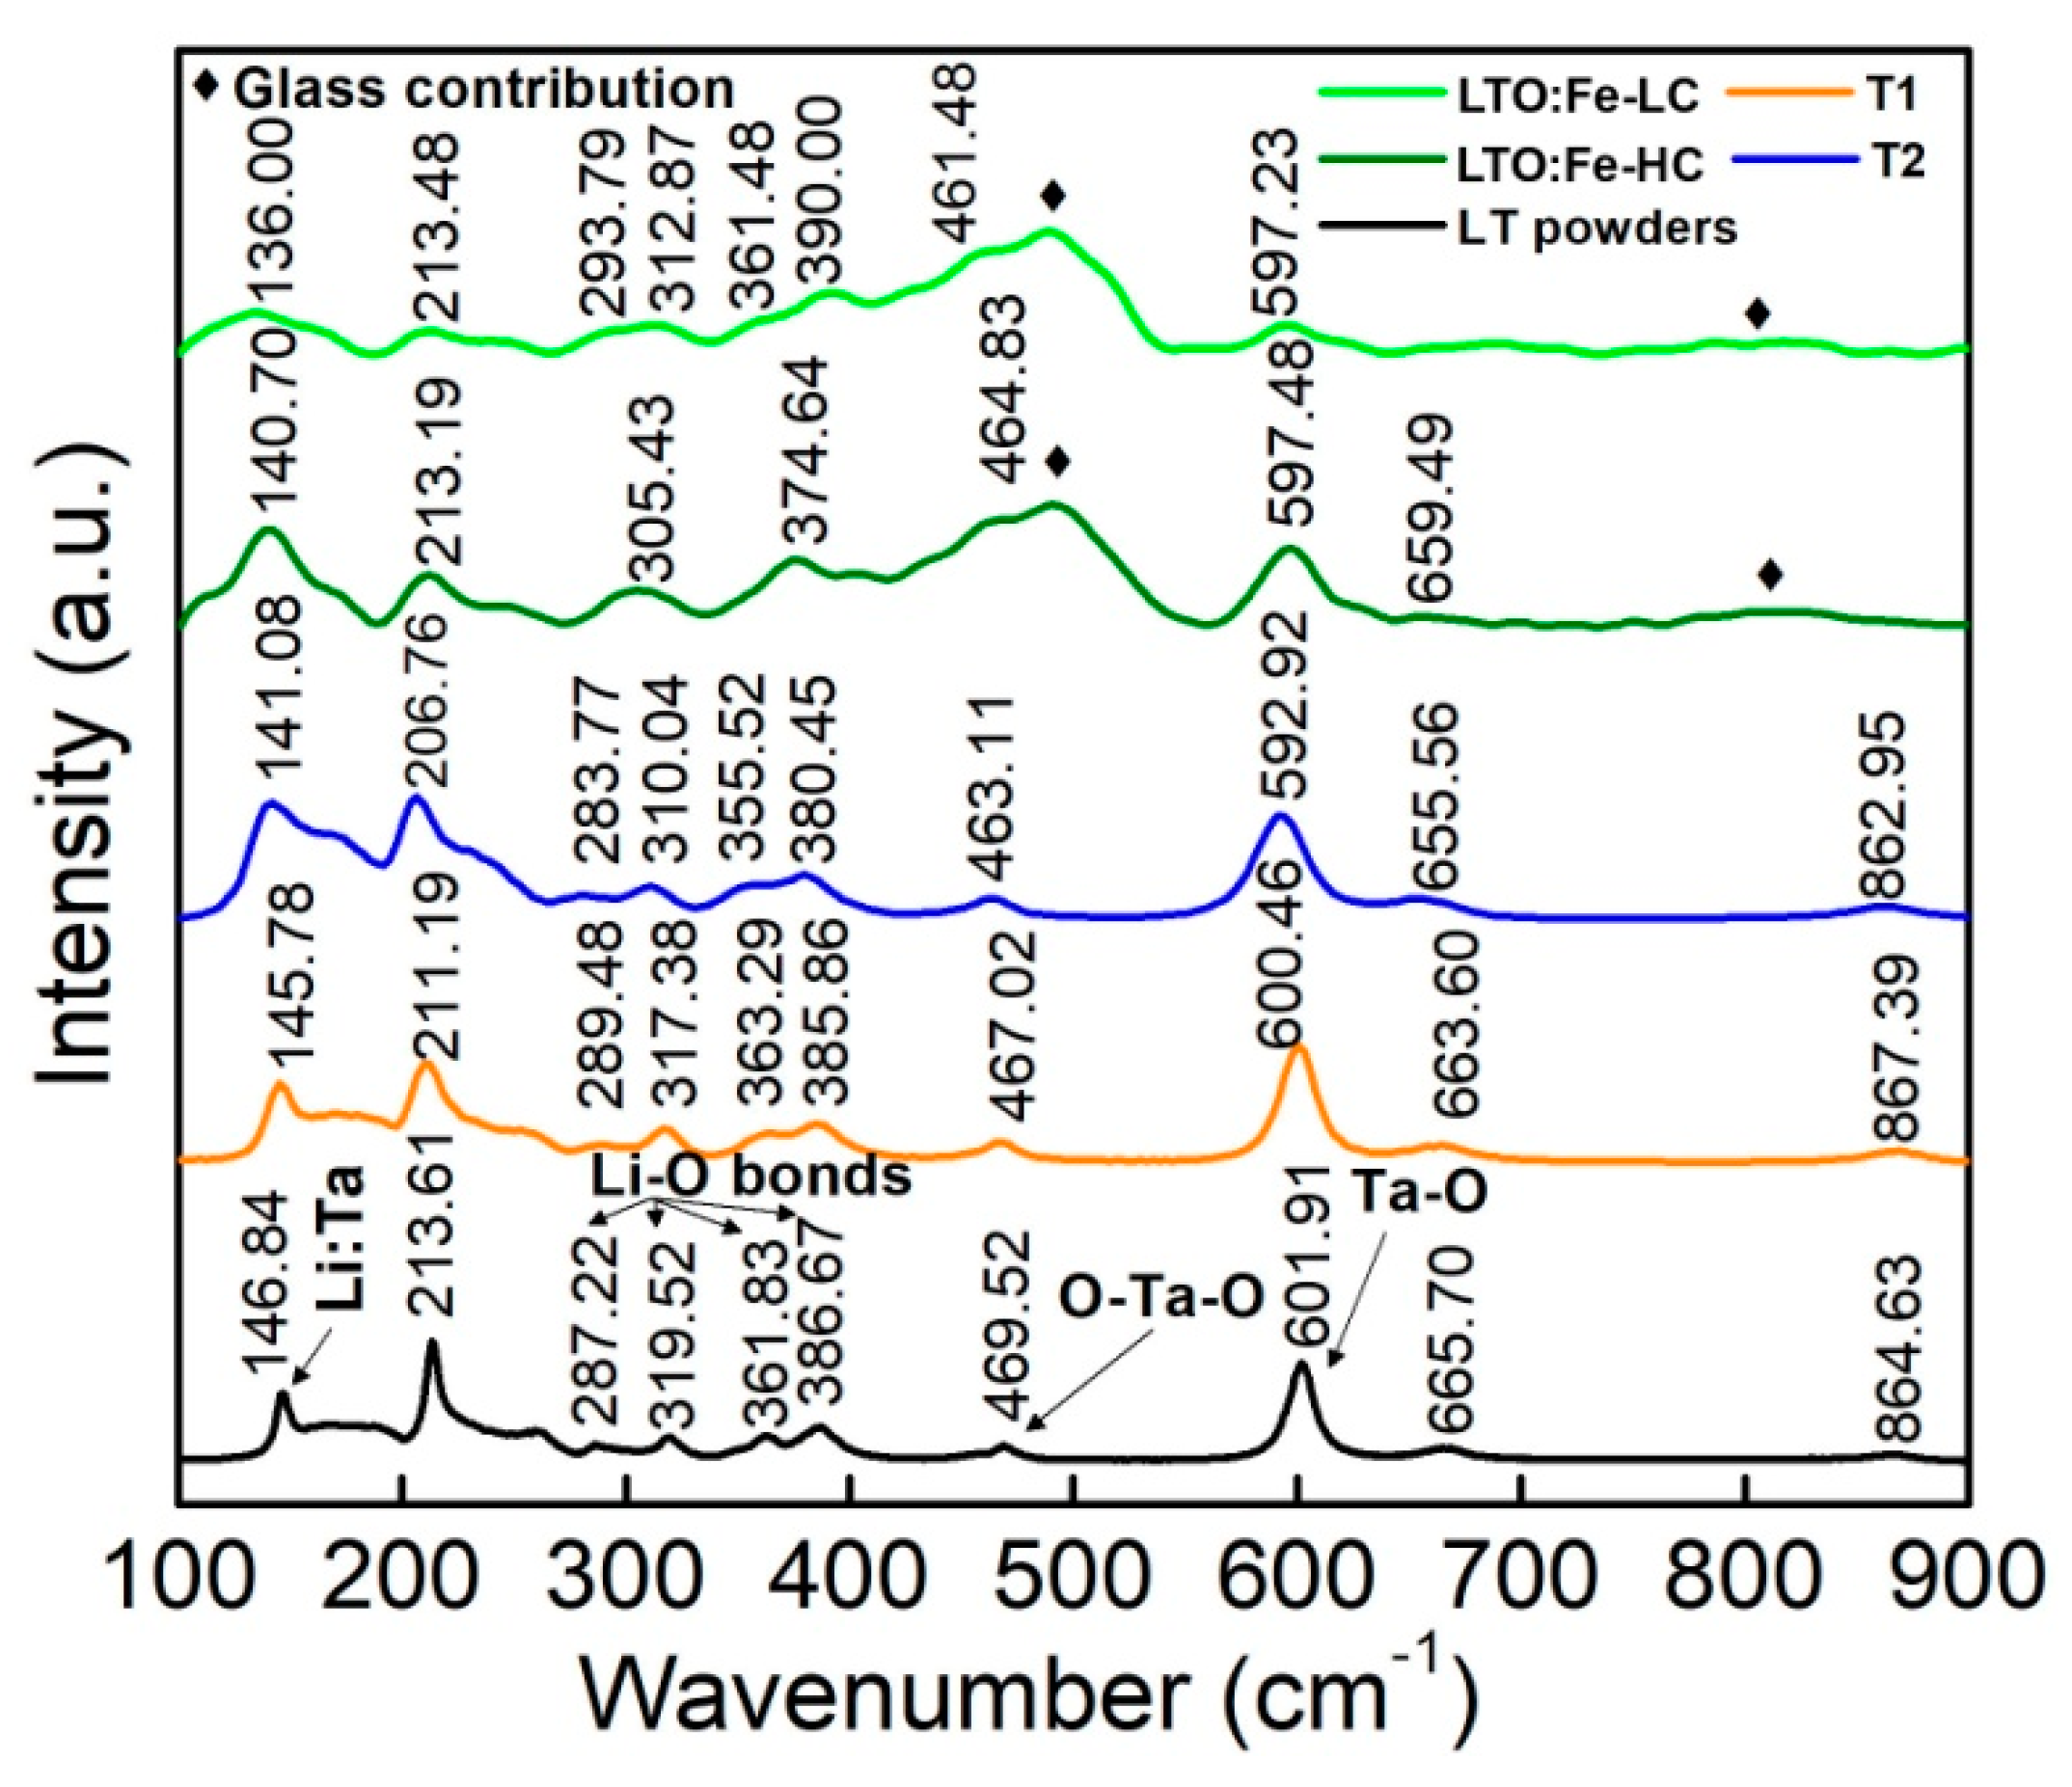
3.1. Structural and Morphological Properties of the LT NPs, T1, and T2

The LT NPs were structurally characterized by XRD and RS to verify the crystalline phase. According to the COD 2101846, the obtained XRD pattern (Figure 1a) belongs to the trigonal structure and space group R3c of the LT crystalline structure. In the Raman analysis, the E modes were located at 146.8 cm−1 (Ta-O), 213.61 cm−1 (Ta-O), 319.52 cm−1 (Li-O), 386.67 cm−1 (Li-O), 462.68 cm−1 (O-Ta-O), and 601.91 cm−1 (Ta-O) for the LT crystalline phase (Figure 1b), whereas the A1 modes were assigned to the bands located at 258.40 cm1 and 361.83 cm1 (Li-O) [29,30]. All the band positions in the experimental Raman spectrum of Figure 1b were resolved through a multi-peak Lorentzian fitting. The LT NPs have a square-like morphology (Figure 1c), with a mean particle size of 100.49 nm and a standard deviation of 31.94 nm (Figure 1d); the averaged crystallite size was calculated to be 74 nm using the Scherrer equation [31].
Verification of the stability of the phase previously obtained on the NPs was done by characterizing T1 and T2 by XRD (Figure 2a,c) and RS. T1 and T2 presented a larger averaged crystallite size of 132.3 nm and 117.9 nm, respectively; as expected, the peaks in the XRD pattern are sharper [32]. The overall increment in the crystallite size was attributed to the high temperature used during the sintering process, which induces crystallite growth. After obtaining the grain size distribution curves of T1 (Figure 2b) and T2 (Figure 2d) through a lognormal fitting, the calculated mean grain size was of 2 μm for T1 (with a standard deviation of 0.70 μm) and 1.85 μm for T2 (with a standard deviation of 0.48 μm). In the inset of Figure 2c, it can be seen that the XRD patterns (enlarged view) of T1 and T2 are very similar to each other due to their crystallite size being similar (132.3 nm and 117.9 nm, respectively). However, as the crystallite size of the LT powders is smaller (74 nm) than presented by T1 and T2, the peak width in the XRD pattern corresponding to the LT powders was larger.
Regarding the Raman results, structural changes were observed, particularly in the vibrational modes associated with Li-O bonds (270 cm−1 to 400 cm−1). The bands located at 287.22 cm−1, 319.52 cm−1, 361.83 cm−1, and 386.67 cm−1 (for the LT NPs, Figure 1b) were shifted for both the Raman spectrum of T1 and T2, resulting in bands located at 289.48 cm−1, 317.38 cm−1, 363.29 cm−1, and 385.86 cm−1 for T1 and 283.77 cm−1, 310.04 cm−1, 355.52 cm−1, and 380.45 cm−1 for T2. Also, for the mentioned bands, a broadening in the linewidth was observed. These changes have been associated with Li vacancies created during the sintering process due to the volatility of Li at high temperatures. A continuous decrease in the Raman linewidths with an effective increment of the Li content has been previously reported for LT [33].

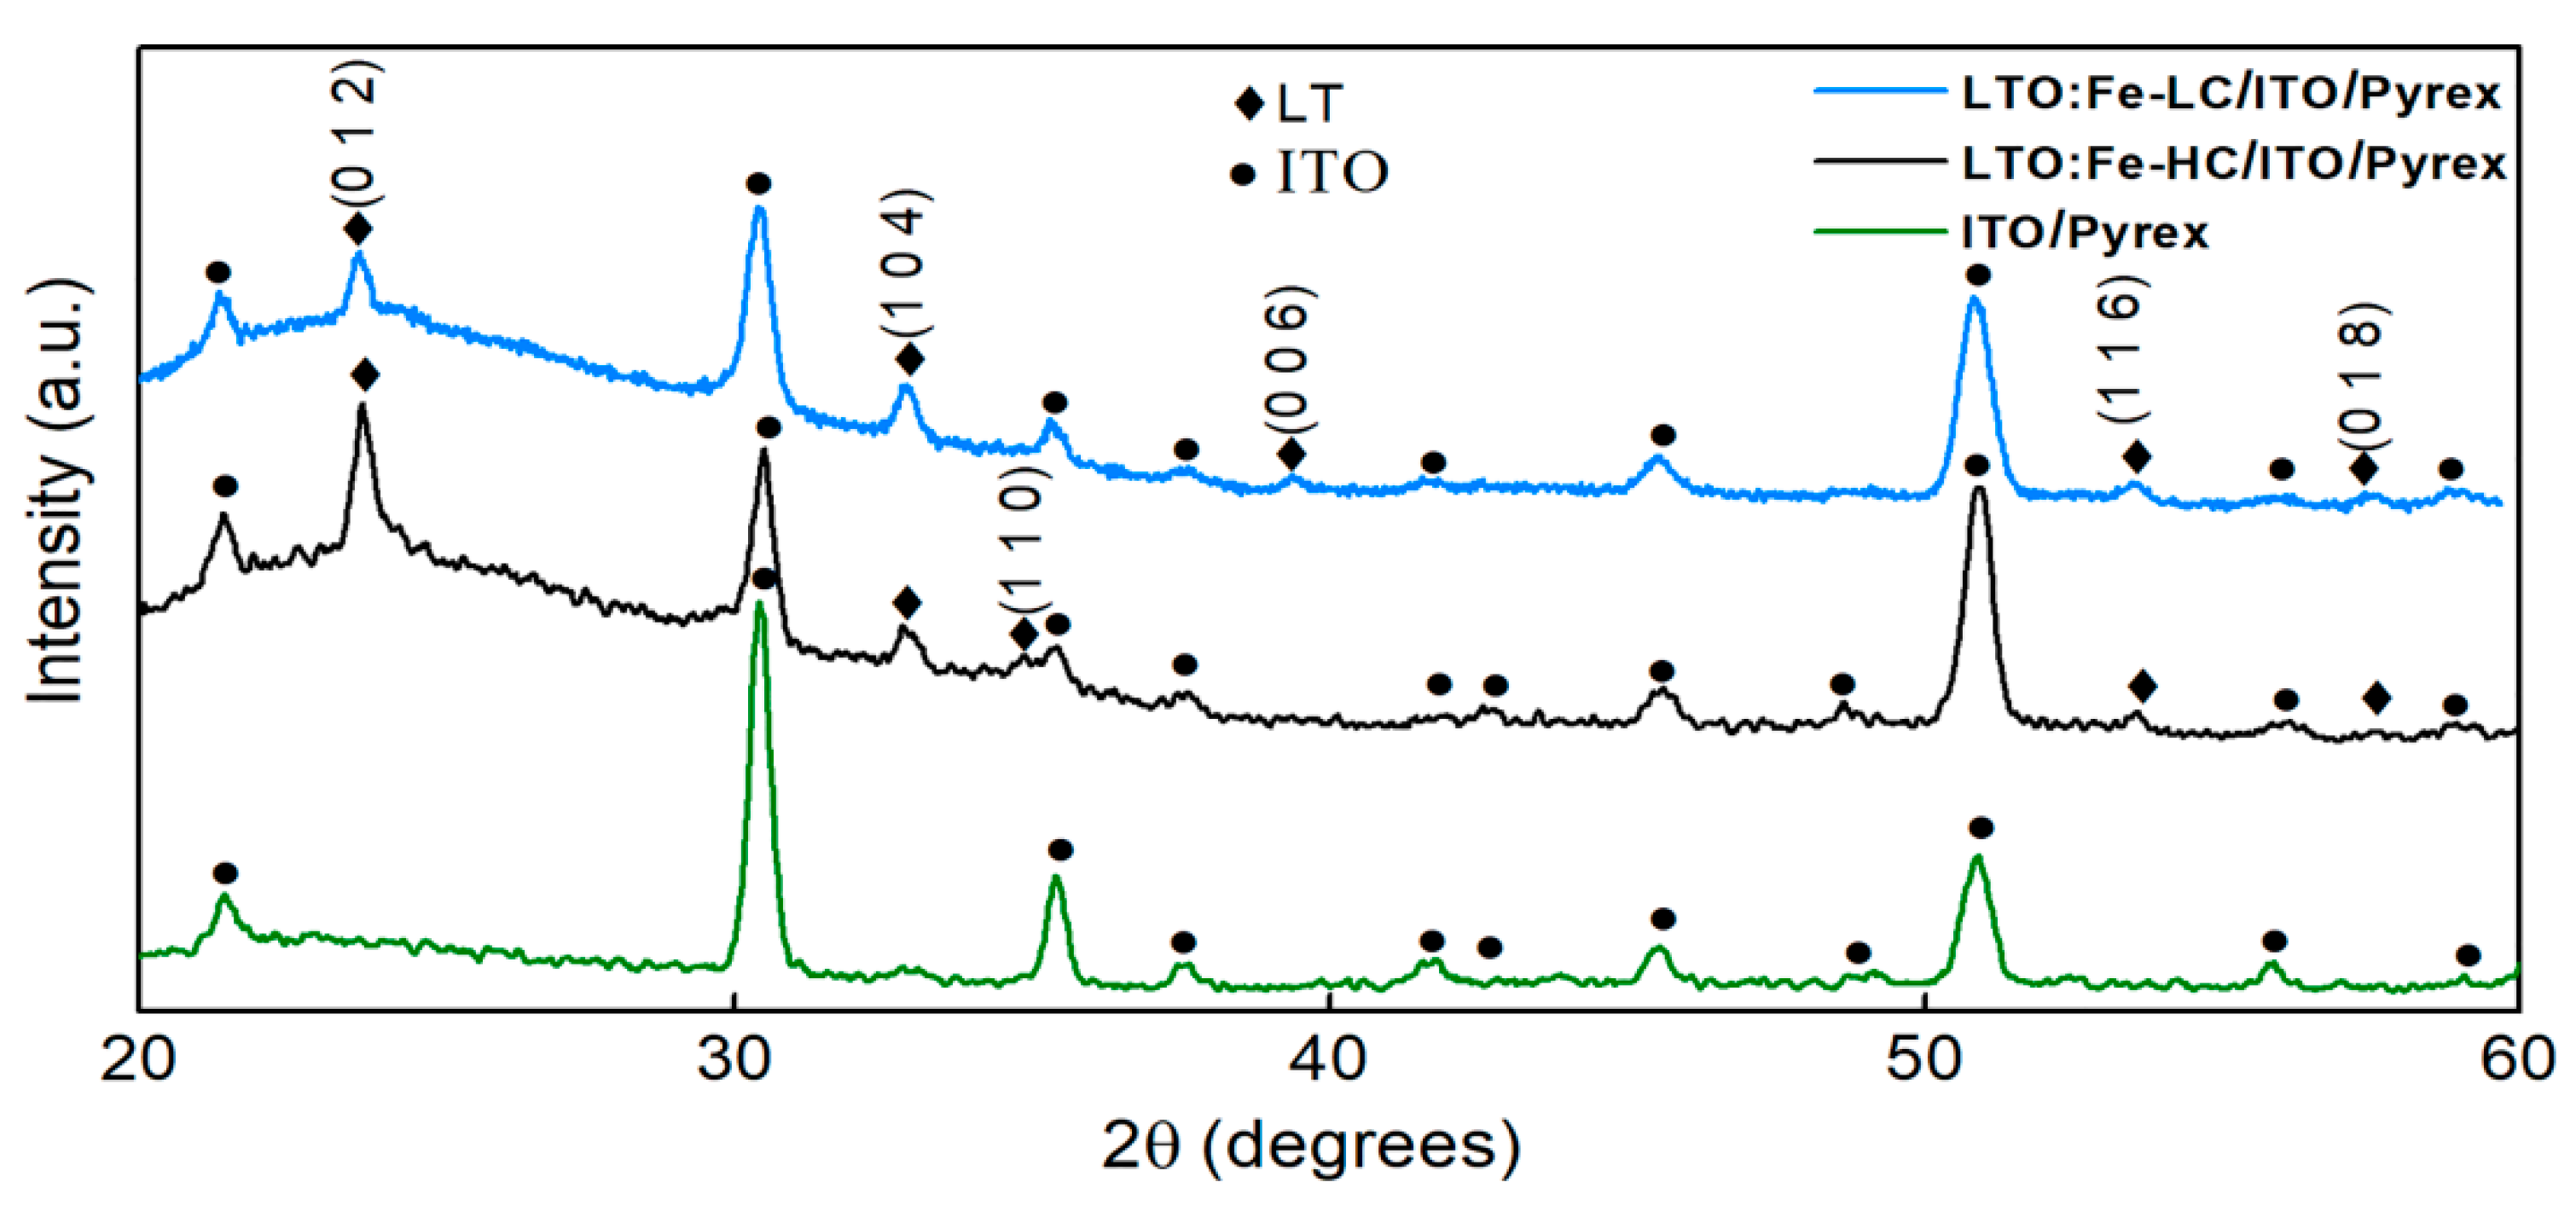
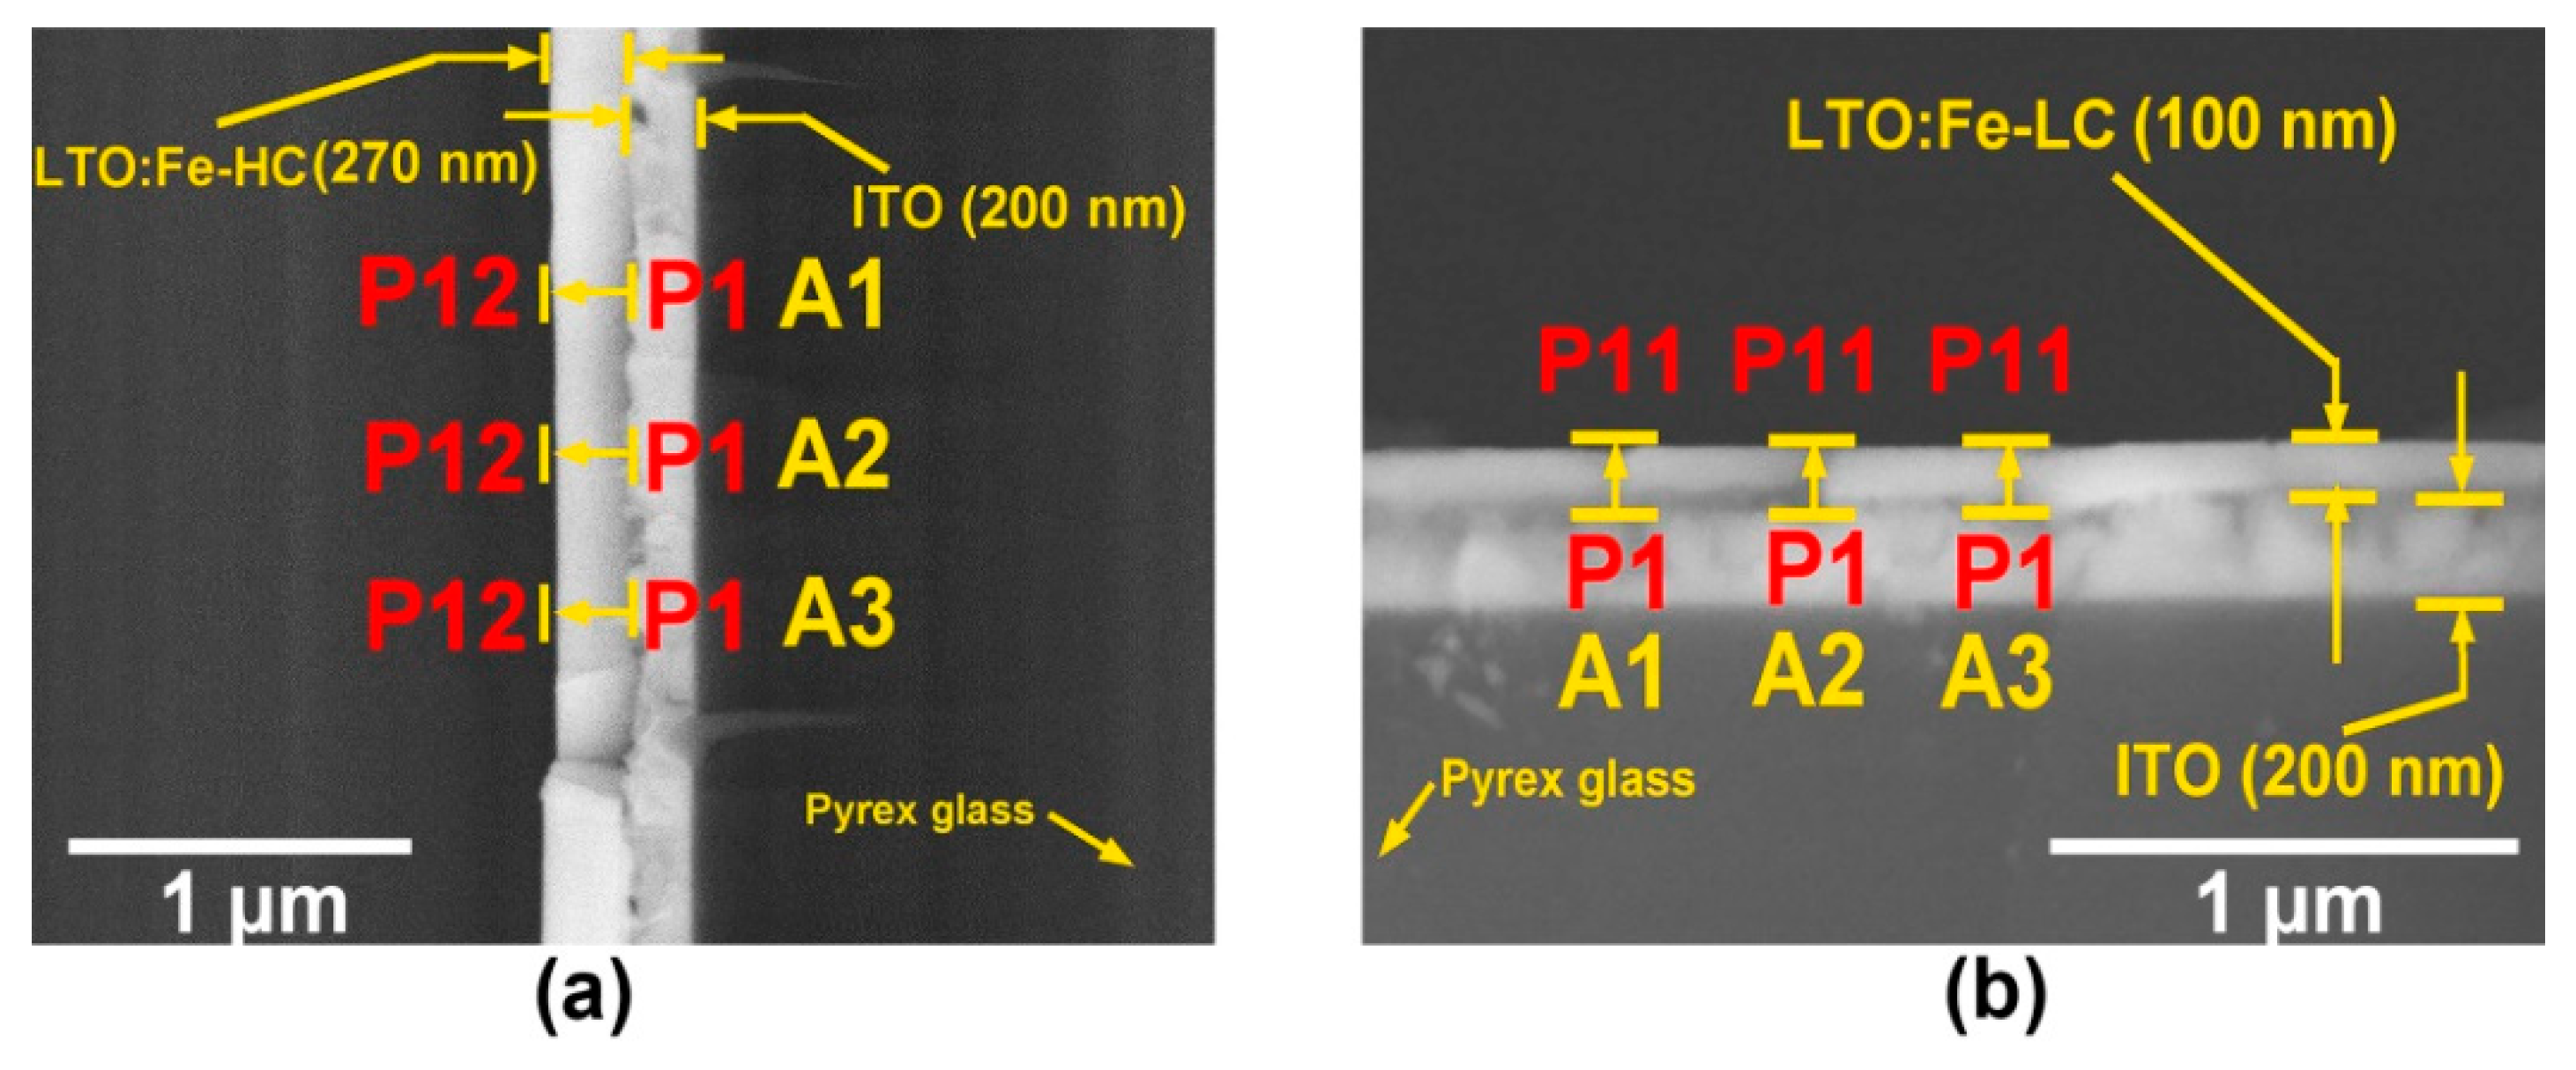
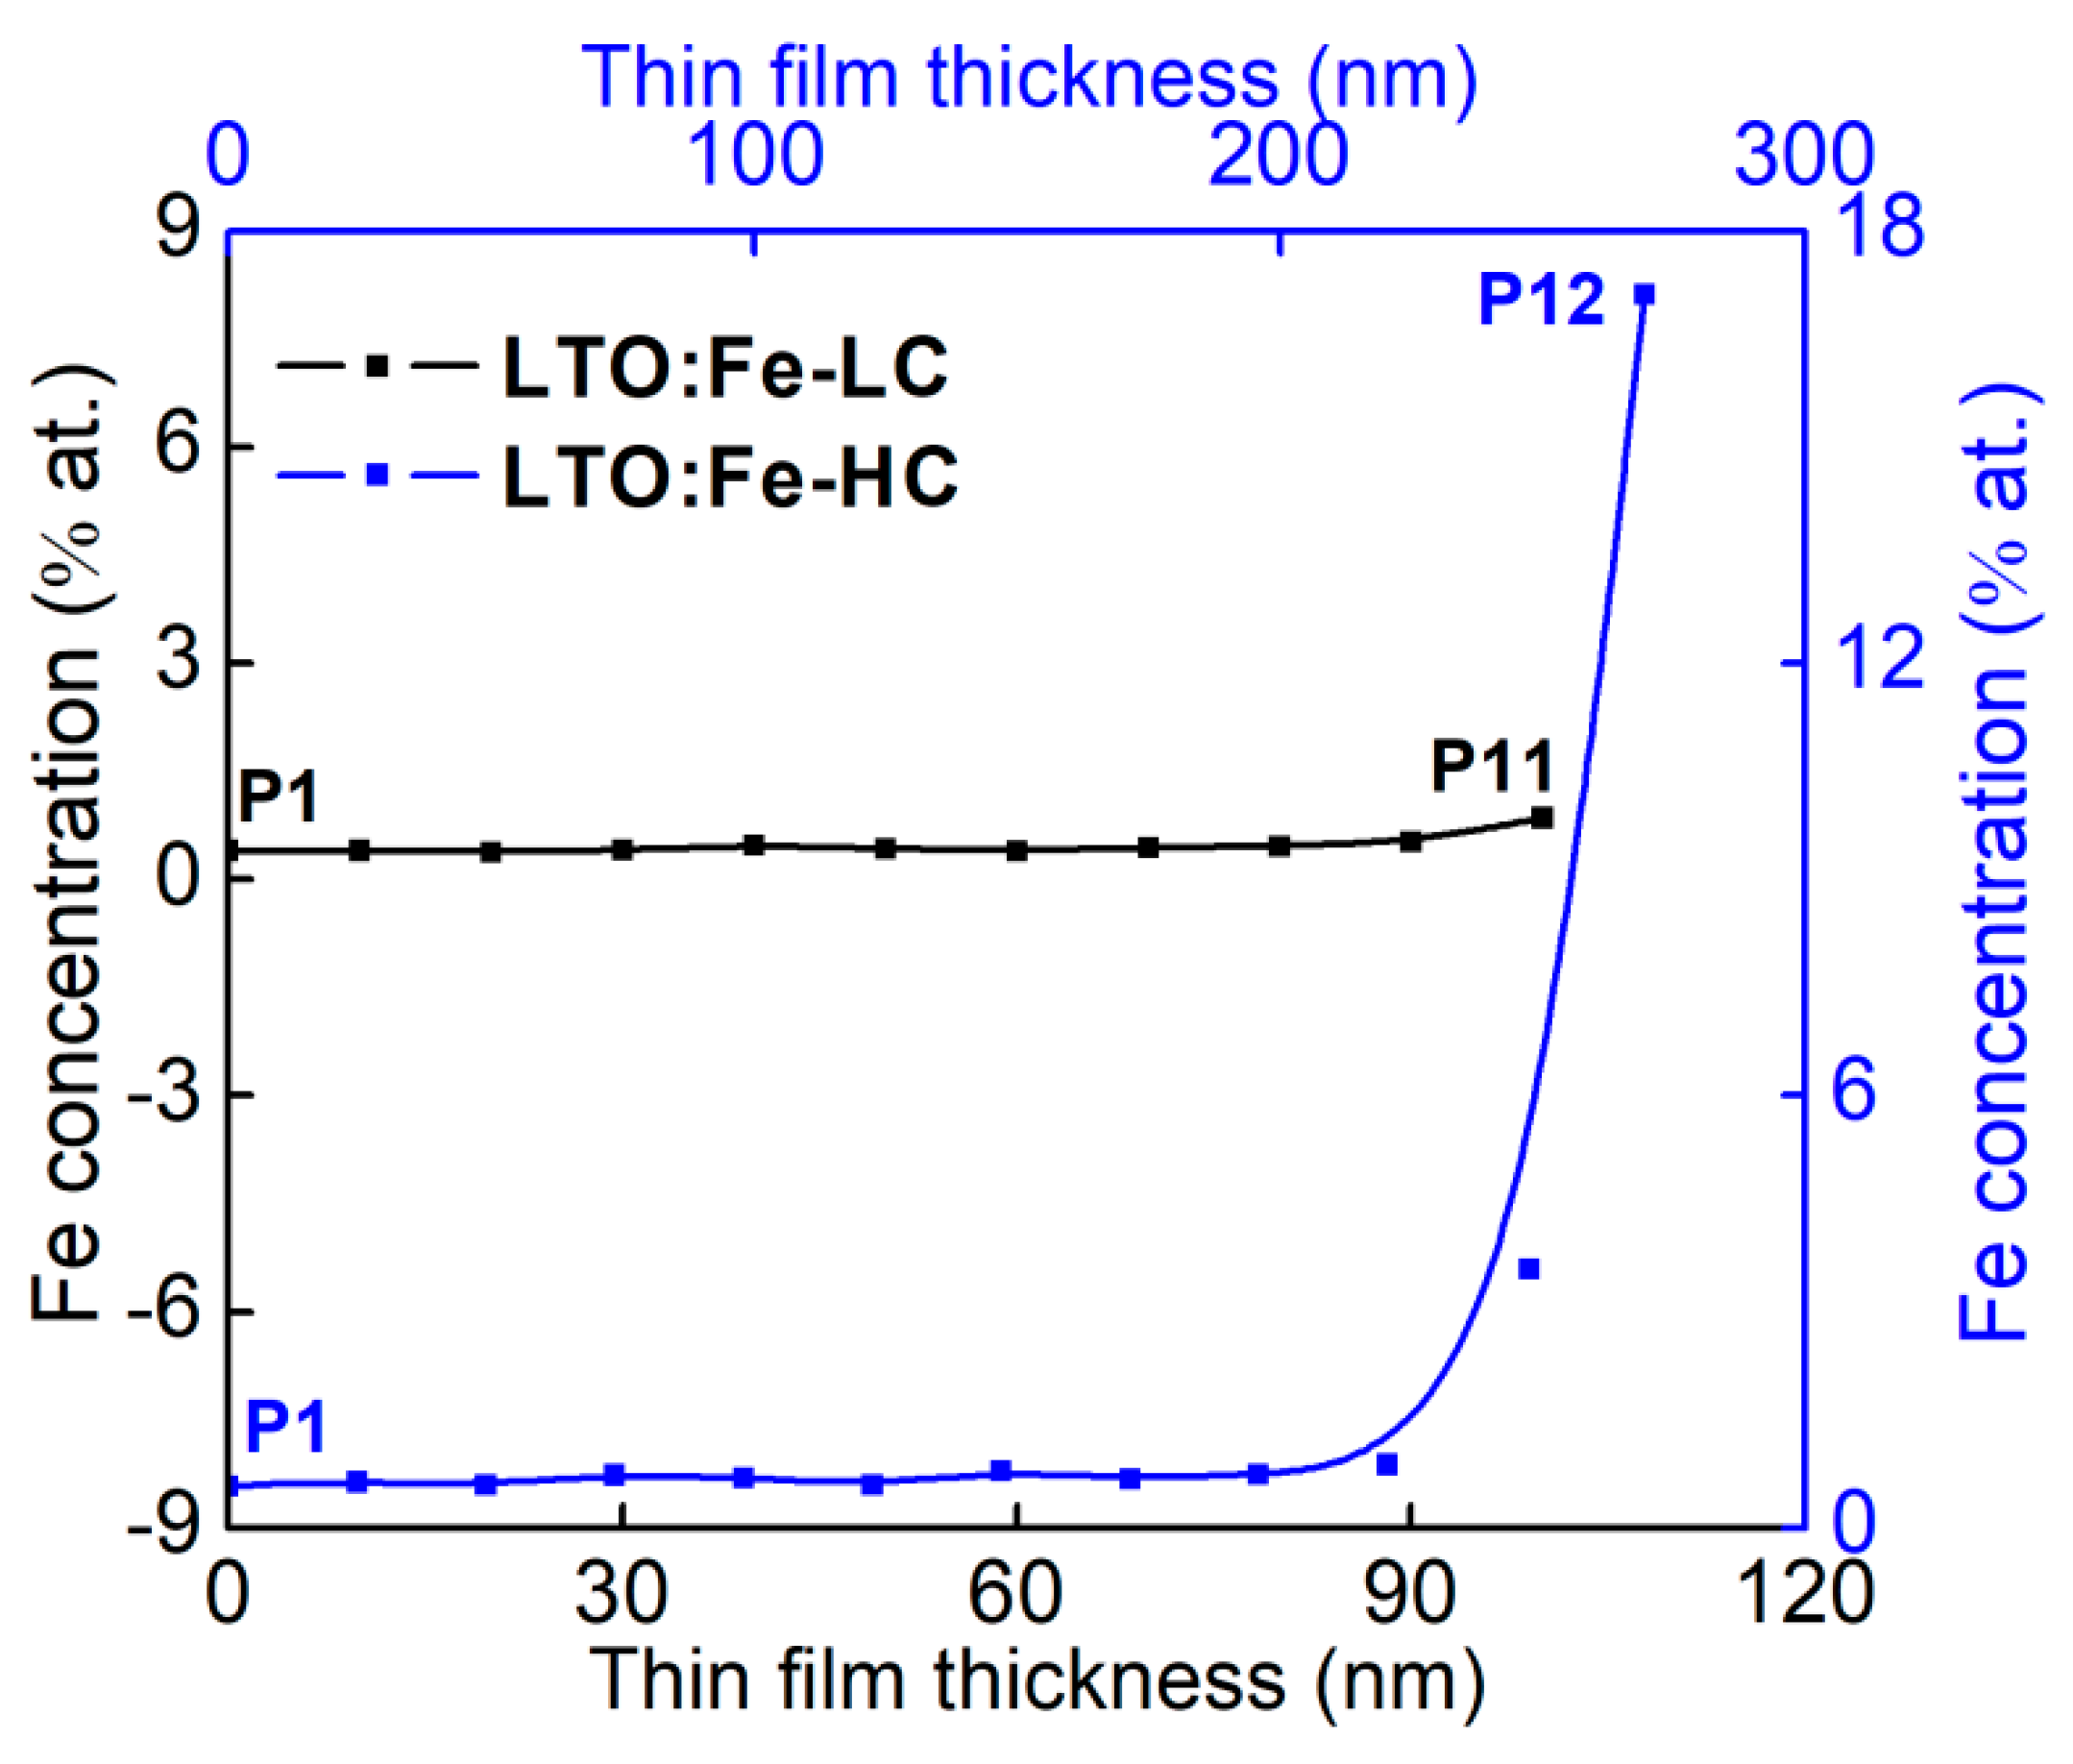
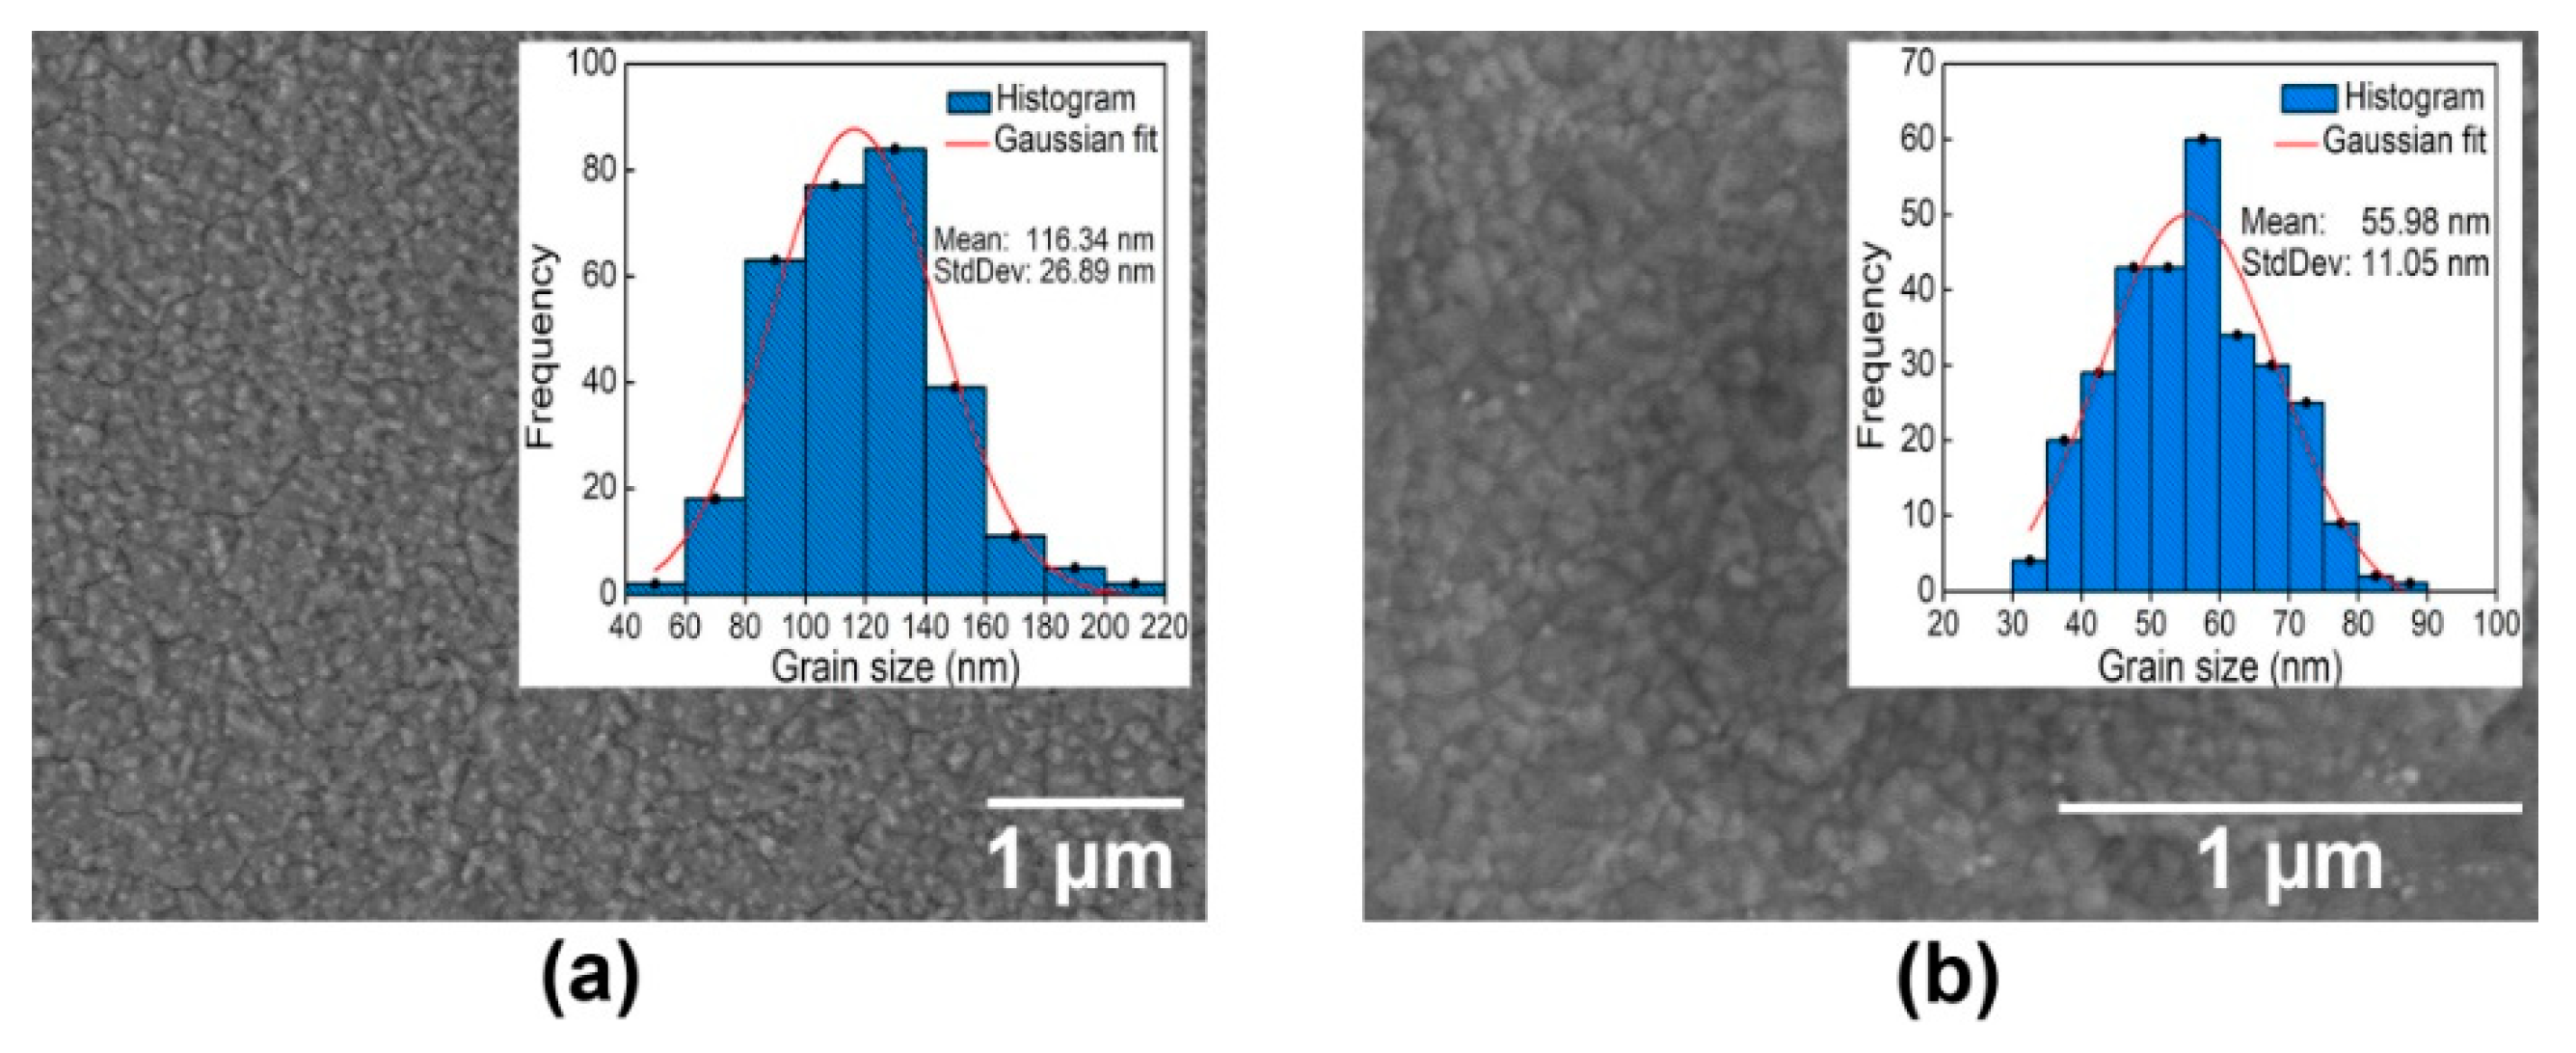
3.2. Structural and Morphological Properties of the LTO:Fe-LC and LTO:Fe-HC Thin Films

The obtained thin films were analyzed structurally and morphologically. Figure 3 shows the XRD patterns for the combined systems: ITO/Pyrex glass substrate, LTO:Fe-HC/ITO/Pyrex substrate, and LTO:Fe-LC /ITO/Pyrex substrate. The main diffracted planes (012), (104), (110), (006), (116), and (018) correspond to the LT crystalline phase.
The crystal lattice parameters a = b and c for the three systems studied were obtained after a Rietveld analysis (described in Appendix A) and given in Table 2. Since the ITO thin film was deposited over the pyrex glass, an amorphous background was observed in the XRD patterns of LTO:Fe-HC/ITO/Pyrex and LTO:Fe-LC/ITO/Pyrex. The amorphous contribution of the pyrex glass substrate was considered as the background in the refinement of the structures. Table 2 shows a similar unit cell volume for T1, T2, and the LT powders, indicating that the Fe did not substitute completely into the crystalline structure of targets. After the synthesis of LTO:Fe-HC and LTO:Fe-LC by magnetron sputtering and a post-thermal treatment in an oxidizing atmosphere at 600 °C, the unit cell volume of the Fe-doped LT thin films decreased in comparison with the unit cell volumes of the LT powders, T1, and T2. In a recent study, Fierro et al. found—after considering that the ionic radii of Fe2+, Fe3+, and Li+ are 78 pm, 64.5 pm, and 76 pm, respectively [7]—that an oxidation thermal treatment for Fe-doped LN NPs homogenizes the valence state of Fe2+ into Fe3+, causing a multitudinous decrease of ionic radii from 78 pm to 64.5 pm of all Fe ions present in Li sites, which, in turn, leads to a significant contraction of the unit cell volume [34]. In the current investigation, a reduction of the cell volume for LTO:Fe-HC and LTO:Fe-LC was observed too, and thus attributed to the substitution of Fe3+ ions into the LT structure in Li atomic positions at low dopant concentrations, as reported for Fe-doped LiNbO3 in [34]. Again, as previously noted, it is important to emphasize that LN and LT are isostructural materials.
Three linear EDS analysis A1, A2, and A3 were performed to examine the variation of Fe concentration through the cross-section of the thin films. As shown in Figure 4a, the EDS analysis of the sample LTO:Fe-HC comprises twelve punctual analysis (P1 to P12), while the analysis of the sample LTO:Fe-LC (Figure 4b) comprises eleven EDS punctual analysis (P1 to P11). The Fe concentration varied from a minimum to a maximum from the interface to the surface for both LTO:Fe-HC and LTO:Fe-LC. Since the EDS analysis does not detect lithium, it is important to note that the analysis performed is only a qualitative way of examining the behavior of the Fe in the films. The maximum Fe concentration found in LTO:Fe-HC was 17 %at. (P12), which is greater than the maximum found (P11) in LTO:Fe-LC (0.86 %at.). On the other hand, the minimum Fe concentrations found in LTO:Fe-HC and LTO:Fe-LC were 0.58 %at. (P1) and 0.40 %at. (P1), respectively. In Figure 5, the behavior previously mentioned can be observed. The difference in the Fe concentrations between both films will play a very important role in their magnetic properties, as will be described later. On the other hand, the inhomogeneity of the dopant in the thin films could be mainly associated with Fe diffusion processes during the synthesis. The study of iron diffusion processes in LT thin films is a very interesting topic but outside the scope of this research; therefore, it is proposed for future research.
In regards to the thicknesses of the thin films, in the SEM image shown in Figure 4a, it can be appreciated that the thickness of the LTO:Fe-HC film is 270 nm. On the other hand, in the SEM image 4b, it can be observed that the thickness of the LTO:Fe-LC film is 100 nm.
On the other hand, RS is sensitive to atomic displacements and slight structural modifications by ion substitution [35]. These changes are linked to frequency shifts and band-shape modifications in the Raman spectra [30]. According to Fontana and Bourson, in LN, intrinsic and extrinsic (doping) defects lead to atomic disorder in the lattice, which increases from the stoichiometric to the congruent composition [36]. They used RS for the study of three samples, undoped stoichiometric LN, undoped congruent LN and 8% mol Hf-doped congruent LN, and found a progressive broadening of lines for the low-wavenumber E(TO) mode, which was associated with the increased density of structural defects [36].
In the present work, Raman characterization was performed to analyze the Fe dopant effect in the LT structure of the three systems under investigation, as shown in Figure 6. Highly crystalline LT powders were obtained, as their corresponding Raman spectrum shows sharp bands. Sintering of T1 and T2 caused the linewidth broadening of the bands associated with the Li–O bonds located between 270 cm−1 and 400 cm−1. Regarding the LTO:Fe-HC and LTO:Fe-LC samples, their Raman spectra present notable differences in comparison with the spectra of T1, T2, and LT powders, mainly in the Li–O vibrational modes. It can be observed how the two bands located at 283.77 cm−1 and 310.04 cm−1 in the case of T2, broadened enough to merge into a single band located at 305.43 cm−1 for LTO:Fe-HC. The behavior mentioned above was also seen for the bands located at 355.52 cm−1 and 380.45 cm−1, which, in turn, merge into the single band located at 374.64 cm−1. Also, as the Li octahedron (LiO6) is linked to the Ta octahedron (TaO6) by sharing one face and three oxygen atoms [30], any change in the Li position directly affects the TaO6 octahedron located at 597.48 cm−1 (LTO:Fe-HC), which is addressed to the linewidth broadening of this band. The bands at 492 cm−1 and 818.37 cm−1 are assigned to the glass substrate [37], while the main vibrational active modes for the ITO phase are located at 144 cm−1 and 175 cm−1 [38]. However, the latter could have been overlapped by the bands located at 140.70 cm−1 and 167.15 cm−1, which correspond to the signal of LTO:Fe-HC. The behavior described above regarding the broadening of peaks was also observed in the Raman spectrum of LTO:Fe-LC; moreover, the peaks located at 289.48 cm−1, 317.38 cm−1, 363.29 cm−1, and 385.86 cm−1 (for T1) shifted their position to 293.79 cm−1, 312.87 cm−1, 361.48 cm−1 and 390.00 cm-1 for the LTO:Fe-LC spectrum.
Recently, it has been demonstrated that the Fe dopant directly influences the vibrational modes A1(TO1) and A1(TO2) of the Raman spectrum of the LN, which, in turn, is associated with the Li–O bonds located at the wavenumbers of 257 cm−1 and 276 cm−1, respectively [23,35]. As the doping concentration increases, these vibrational modes tend to broaden and merge, implying that the Fe ions substitute into the regular Li sites, strongly influencing the Li–O bond in the LN lattice. This behavior has also been reported by Bachiri et al. for Ni-doped LN [39]. In another case, Fierro et al. found—by RS—that the bands located at the 265 cm−1 and 334 cm−1 frequencies (linked to Li cation displacements) broaden as the Fe concentration increases, which has been interpreted as a substitution of Fe in Li positions for Fe-doped LN NPs [34]. In our case, the similarity in the observed trends indicates that the Fe ions directly influenced Li–O bonds in the crystal lattice of LT. The above-mentioned discussion can be understood in terms of the mechanism of Fe incorporation into the LN structure reported by Li et al. [23]: as VLi sites become occupied by Fe ions, TaLi antisites are created, forcing ions of Ta to occupy its original site. After this, the Fe ions start to interstitially fill the surface of the film until they reach a high atomic percentage. The changes observed in the Raman spectra (broadening of bands) of Figure 6 were progressive as the number of intrinsic and extrinsic defects increased. Hence, the crystallinity of the thin films is directly affected, in agreement with Fontana and Bourson, who reported the influence of extrinsic defects on the crystallinity of LN [36]. The LTO:Fe-HC presented a regular morphology, an average particle size of 116.34 nm with a standard deviation of 26.89 nm (Figure 7a), and a crystallite size of 56.1 nm (calculated with the Sherrer equation). Regarding the LTO: Fe-LC sample, the average particle size was 55.98 nm with a standard deviation of 11.05 nm (Figure 7b) and crystallite size of 50.3 nm.

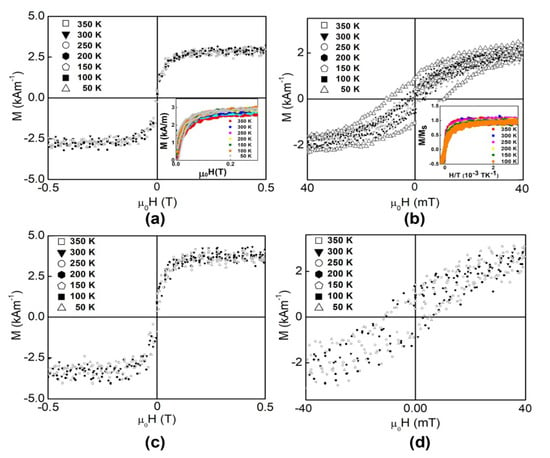
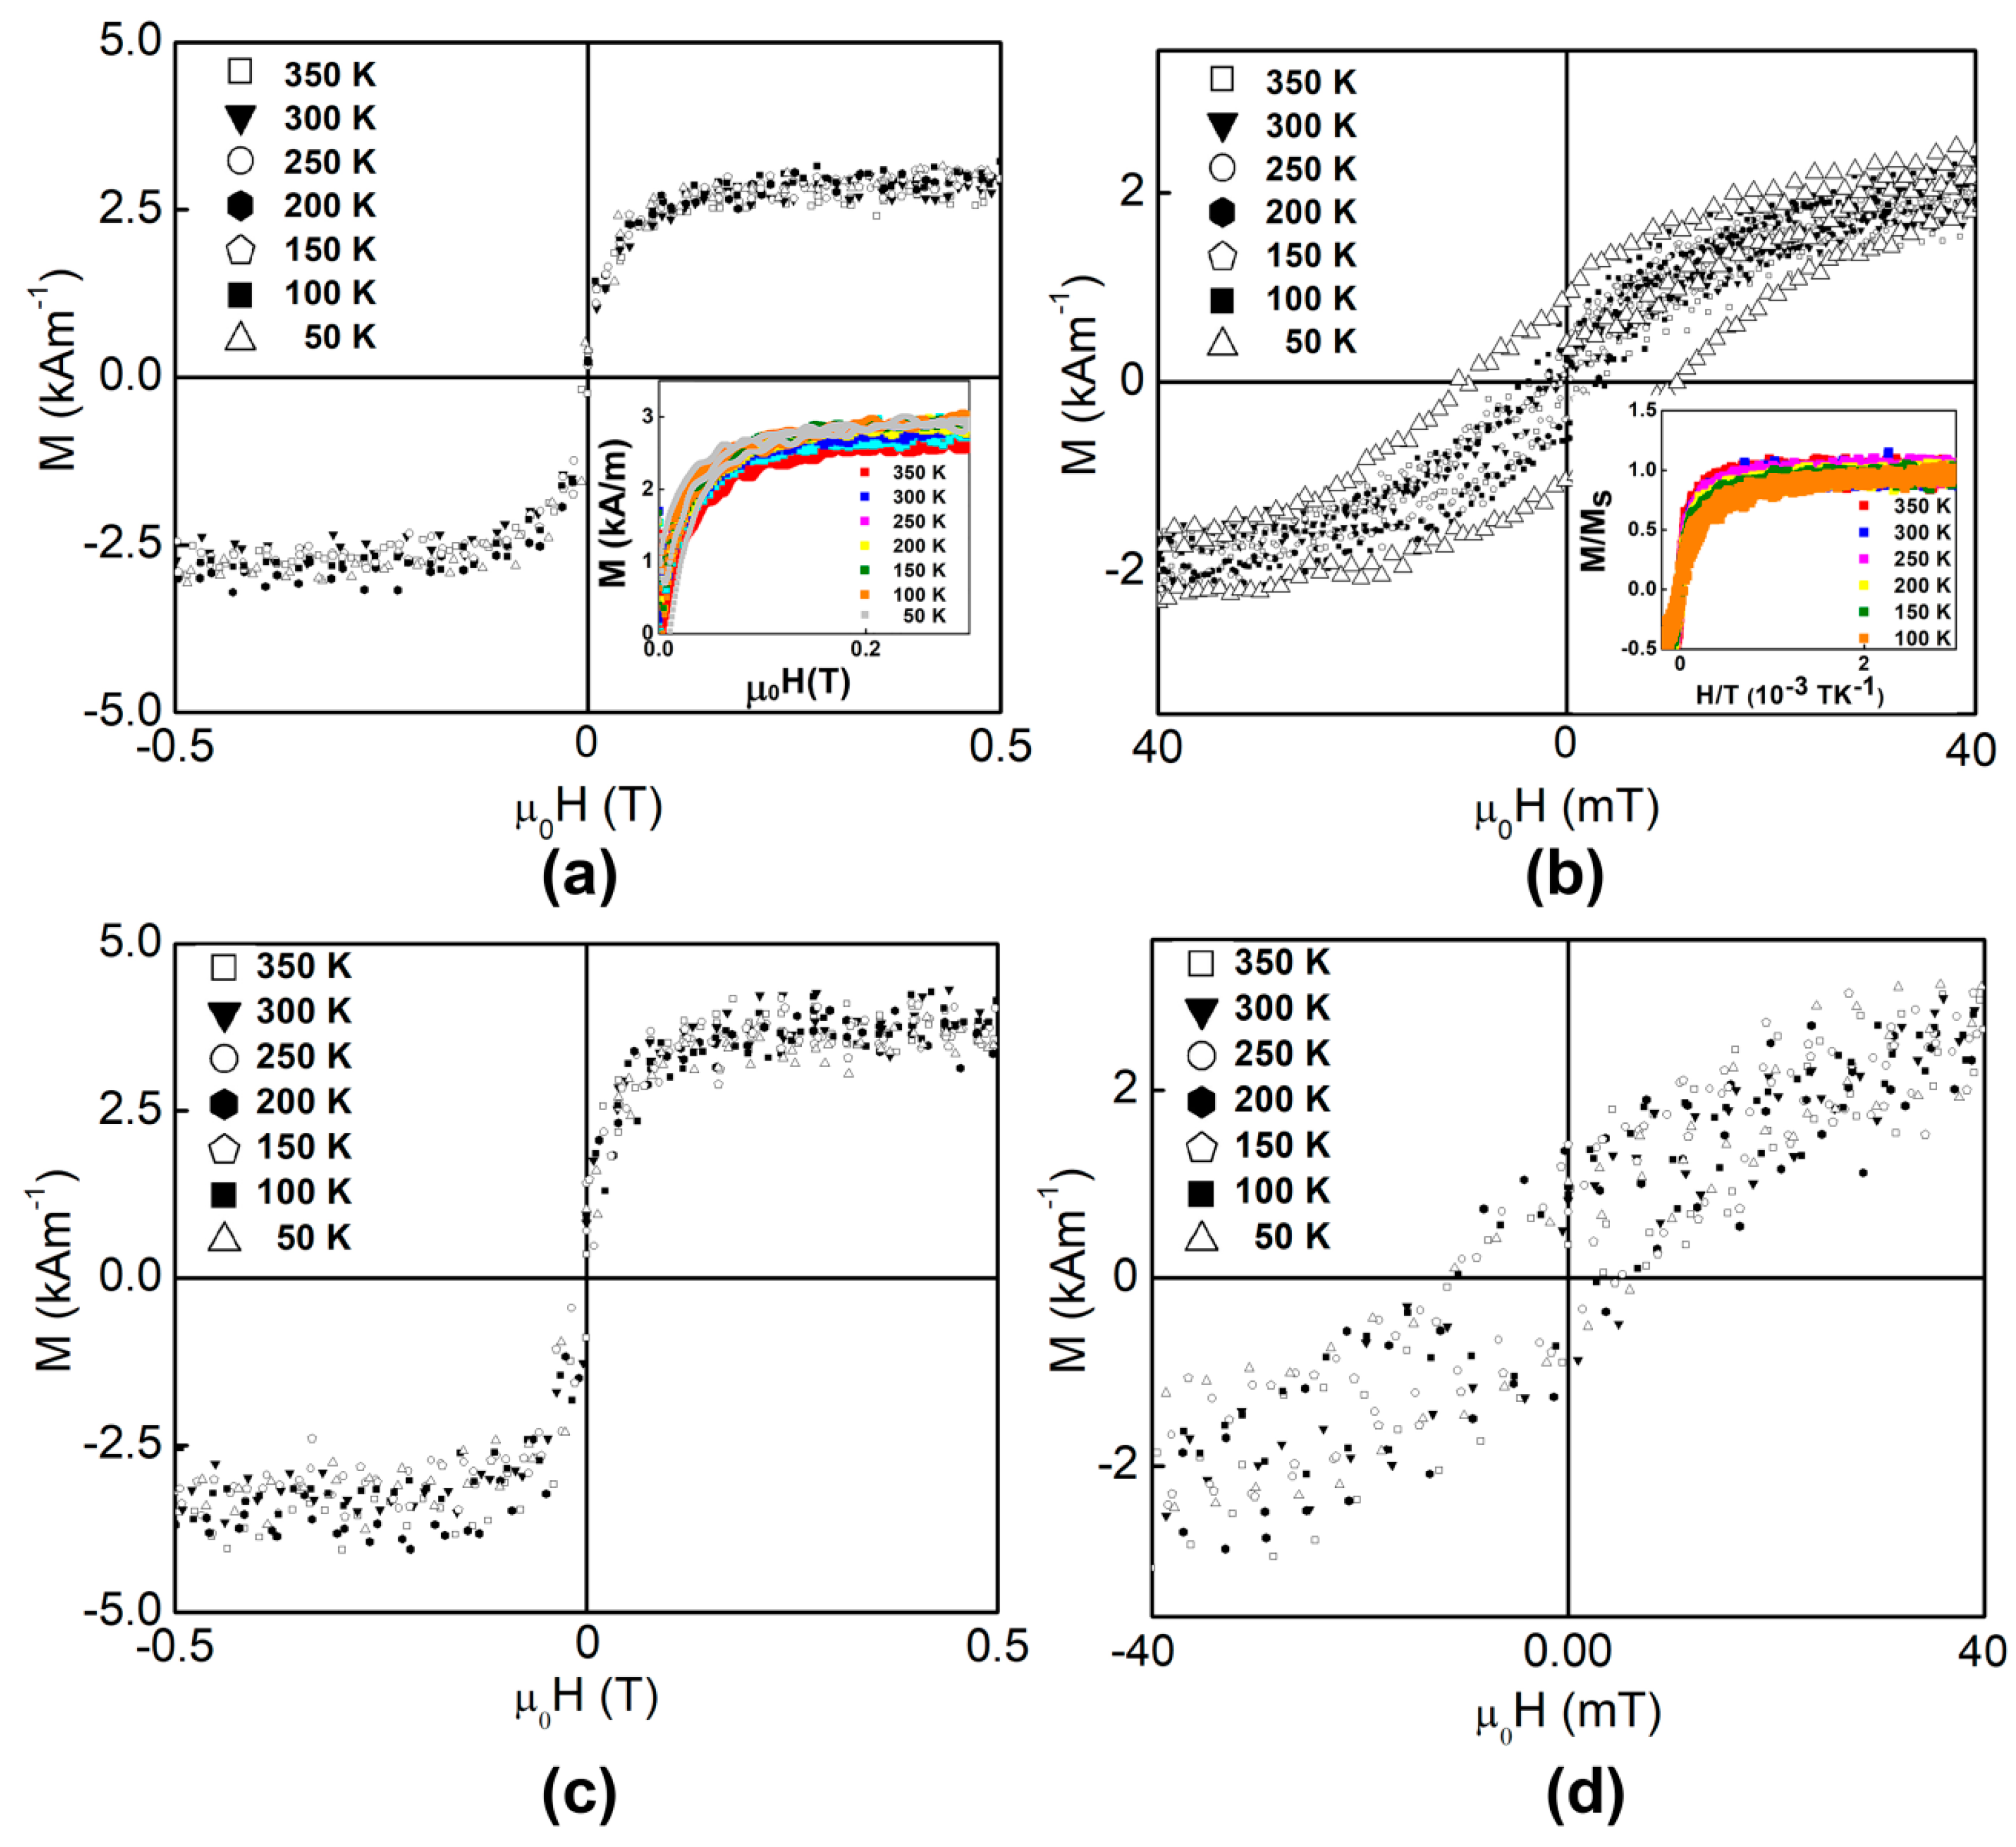
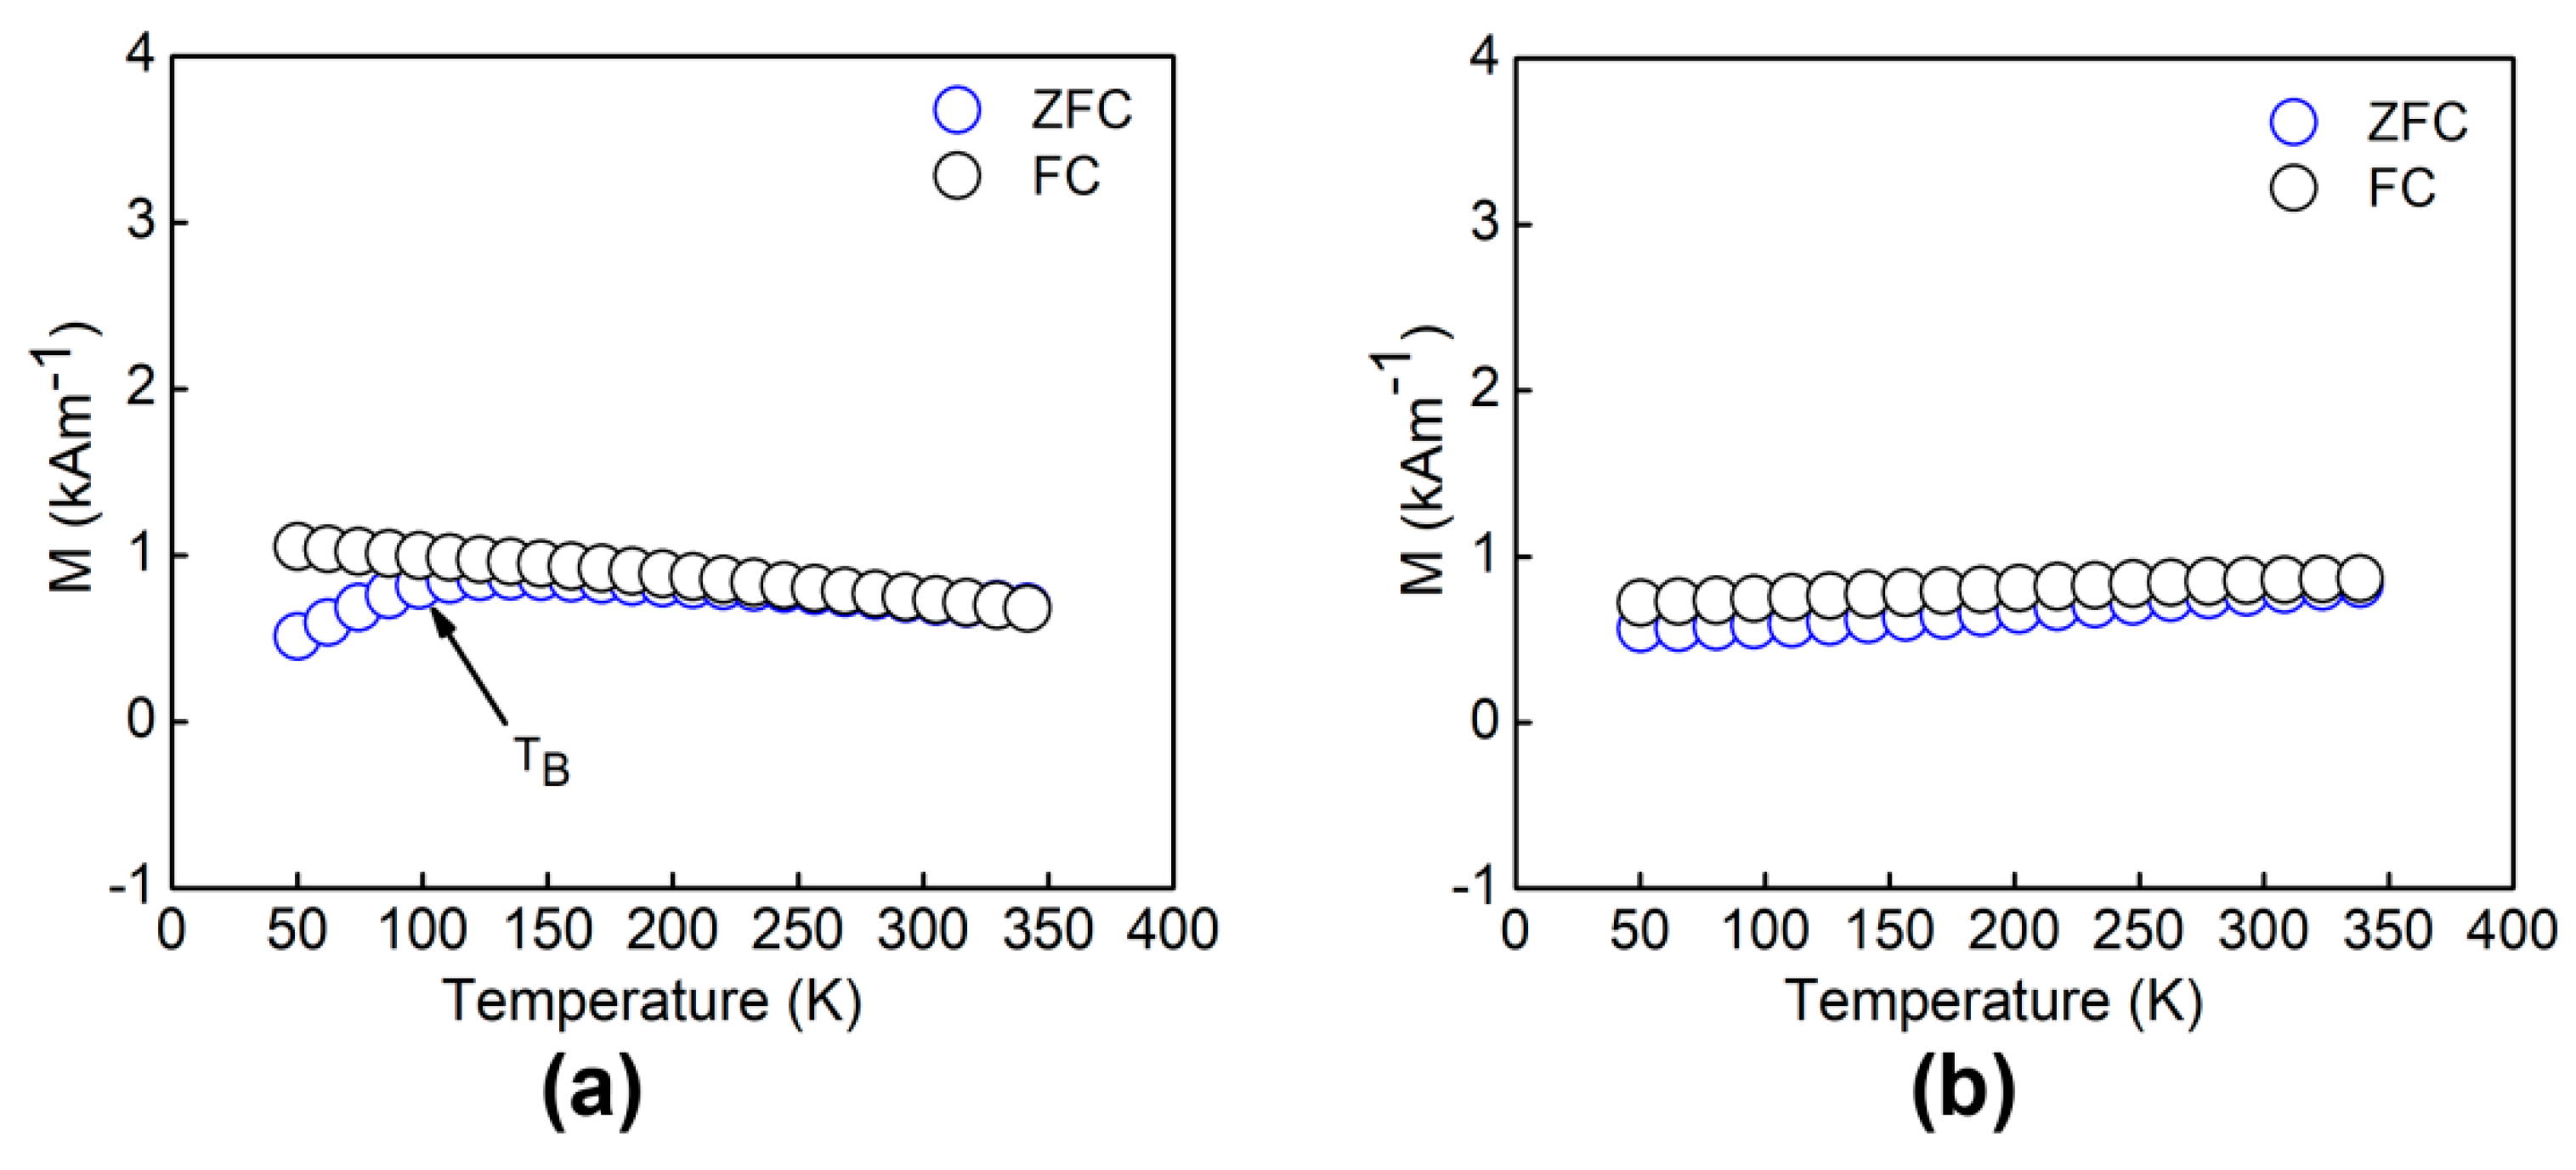
3.3. Magnetic Properties of the LTO:Fe-HC and LTO:Fe-LC Thin Films

Magnetic hysteresis loops M–H (Figure 8) and ZFC–FC curves (Figure 9) were obtained from the thin films to analyze the Fe dopant effect on the magnetic properties. The magnetic hysteresis loops were obtained from 50 K to 350 K at a maximum magnetic field applied of 1 T, while the ZFC–FC curves were obtained by applying a constant magnetic field of 10 mT in a temperature range of 50 K to 350 K. In Figure 8a, the magnetic hysteresis loops obtained for LTO:Fe-HC at different temperatures are shown. The inset of Figure 8a shows a zoomed view in the vicinity of the saturation magnetizations of the LTO: Fe-HC sample, where it can be observed that there is a small variation in the saturation tendency with respect to temperature. After an enlarged view in the vicinity of the origin (Figure 8b), it is clear that all magnetic coercivities practically disappear for the magnetic hysteresis loops measured from 100 K to 350 K; nevertheless, the coercivity of 10 mT for the curve measured at 50 K differs from all others. According to [40], among the main features of superparamagnetism is that its curves superpose when M/Ms versus H/T is plotted. In the inset of Figure 8b, it can be seen that the magnetic hysteresis curves of LTO:Fe-HC superpose when M/Ms versus H/T is plotted; hence, a superparamagnetism behavior was associated with the LTO:Fe-HC sample, which is consistent with their corresponding ZFC–FC curves (Figure 9a), where a broad peak was formed by the ZFC curve and its respective divergence from the FC curve below a critical temperature was observed. The magnetic behavior observed in LTO:Fe-HC exhibits the basic features of a superparamagnetic behavior, according to Chen et al. [41]. The temperature at which the ZFC curve reaches its maximum is approximately 98.6 K and is called the blocking temperature (TB) [42]. When T < TB, the divergence in the ZFC–FC curves is characteristic of ferromagnetism, when T > TB, the overlapping of the ZFC–FC curves represents paramagnetism [41], this is highly correlated with the M–H curves. In Figure 8b, it can be observed that below the blocking temperature (98.6 K), the curve obtained at 50 K is the one with the highest coercivity (ferromagnetism), as expected, above the blocking temperature, the magnetic hysteresis practically disappeared (superparamagnetism).
The superparamagnetic behavior observed in some non-magnetic oxides doped with 3d transition-metal cations is a well known phenomenon, which is mainly associated with magnetic clusters embedded in the host oxide matrix [43,44,45,46]. These magnetic clusters are mainly formed by an excess of dopant. In our case, LTO:Fe-HC showed a high concentration of Fe near the surface of the thin film (17 at.%), this was correlated with the formation of magnetic clusters that favored the superparamagnetic behavior.
Analyzing LTO:Fe-LC (Figure 8c), the results showed that the magnetic hysteresis loops superpose and present a saturation magnetization, which was approximately 3.80 kAm−1. After a zoomed view in the vicinity of the origin (Figure 8d), it can be seen that all the magnetic coercivities of the hysteresis curves overlap, so it is concluded that both the magnetic coercivities and the saturation magnetizations are not temperature-dependent. Moreover, ZFC–FC curves were obtained (Figure 9b), where it can be observed that the magnetic moment varies slightly with temperature, this behavior has already been reported for oxides doped with 3d transition-metal cations [47], and it is associated with Curie temperatures above room temperature. Also, there is no indication of a magnetic phase that could be reflected in the ZFC–FC measurements due to a change in the trend of curves below or above a critical temperature.
The magnetic behavior observed in the LTO:Fe-LC sample has basic features that resemble those presented in dilute magnetic oxides (DMOs); according to Coey [48], DMOs are non-magnetic oxides doped with 3d transition-metal cations that exhibit magnetic behavior. Among the main features of DMOs are that both magnetic coercivity and saturation magnetizations are not temperature-dependent [48], as was observed for LTO:Fe-LC. In DMOs, the ferromagnetic exchange is mediated by shallow donor electrons, which overlap to create a spin-split impurity band, all theory can be found in [49]. The magnetization of LTO:Fe-LC can be defined by Equation (2) [48,50,51]:
M = M s tanh ( H / H 0 )
where Ms corresponds to the saturation magnetization, H is the applied field, and H0 is an effective field constant that prevents saturation. H0 can be estimated from the slope of the experimental curves, which reaches the saturation magnetization when H = H0. According to [51], the initial magnetic susceptibility Xm = MsH0−1, thus H0 = 57.71 kAm−1 for LTO:Fe-LC. Normally, for metallic Fe particles, H0 is around 270 kAm−1 ± 40 kAm−1 [48], which causes a saturation magnetization to be obtained at high applied magnetic fields, while for non-magnetic oxides doped with 3d transition-metals, this constant is found within the range of 30 kAm−1 to 200 kAm−1 [48], in turn, this indicates that they saturate at low applied magnetic fields, as happened for LTO:Fe-LC.
There are different mechanisms by which ferromagnetism is generated in non-magnetic oxides doped with 3d transition-metals, one of the most studied systems is the LiNbO3, where Li et al. obtained a saturation magnetization of 1.18 Am2kg−1 in Fe-doped LiNbO3 (5% mol) [35], which was attributed mainly to the substitution of Fe3+ ions in lithium positions accompanied by a large lattice distortion and a strong coupling of spin Fe–Nb. On the other hand, Fierro et al. found a dependence on magnetization in relation to the concentration of Fe in the structure of LiNbO3 [34], where Fe initially occupied lithium sites; they obtained a saturation magnetization of 0.94 Am2kg-1 for a dopant concentration of 2.20 wt.%. In our case, for the sample with a low dopant concentration (LTO:Fe-LC), a saturation magnetization of 0.51 Am2kg−1 was obtained for an iron concentration of less than 1 at.%.
As a framework, when crystals of LiNbO3 or LiTaO3 are thermally treated (400–600 °C) either in a vacuum, in a hydrogen atmosphere or in an inert gas, a process of chemical reduction is generated (a loss of oxygen on the surface of the molecule is accompanied by a redistribution of VLi and TaLi). In this process, oxygen leaves the surface of the crystal, but oxygen vacancies do not appear at the end; the released electrons (donors) are captured by traps [7]. In DMOs, the donors form bound magnetic polarons, coupling the 3d moments of the dopant ions. If magnetic polarons overlap sufficiently and under certain conditions (mainly related to the concentration of the dopant), a ferromagnetic ordering is created—all theory can be found in [49]. The appearance of ferromagnetism in DMOs has been reported for dopant concentrations of up to 10 at.% [52]. However, it has been reported in the literature that there is a maximum limit of dopant concentration (which varies for each material) above which the ferromagnetic ordering begins to decrease and even gets destroyed [53,54,55,56].
Since the growth of LTO:Fe-HC and LTO:Fe-LC was performed inside a deposit chamber, in an inert atmosphere (argon), and at 450 °C, a chemical reduction accompanied by point defects (donors) is expected. Considering that the deposit time used in LTO:Fe-HC was longer than in LTO:Fe-LC, a greater number of defects would be expected in LTO:Fe-HC than in LTO:Fe-LC. At this stage, the sample’s surface appears dark. After deposits were made, thermal treatments were performed in an air atmosphere at 600 °C for both samples. However, for LTO:Fe-HC, a faster process was performed, this was achieved by modifying the times of the heating ramp, isotherm, and cooling ramp. On the other hand, for the LTO:Fe-LC sample, a slower process was carried out. The post-deposit annealing would help the formation of the LiTaO3 phase and the homogenization of the valence state of the Fe into Fe3+. Since the exposure time of LTO:Fe-LC was longer than in LTO:Fe-HC, the homogenization of the valency state is expected to be greater in LTO:Fe-LC than in LTO:Fe-HC, i.e., most Fe ions would be found in a Fe3+ valence. At this stage, the sample’s surface appears transparent. On the other hand, the RF power used in the growth of LTO:Fe-HC and LTO:Fe-LC was different (50 W and 30 W, respectively), and, as a consequence, some differences in structure between both samples are observed. It is well known that at a higher applied RF power (in a sputtering process), the adatoms will become more mobile, which will favor the diffusion of adatoms among adjacent grains and densification (the higher the applied RF power, the larger the grain size) [57,58,59]. The grain size observed in LTO:Fe-HC and LTO:Fe-LC is mainly associated with the densification acquired during the deposit process as a result of the RF power applied. Additionally, as mentioned earlier, the RF power directly influences the diffusion processes in thin films, so the dopant concentration variation in LTO:Fe-HC and LTO:Fe-LC is closely linked to the RF power used, the dopant concentration in targets, and the annealing times. For all the above, the ferromagnetism observed in LTO:Fe-LC was associated to point defects (as donors) created during thin film synthesis and highly correlated with low Fe concentration (less than 1 at.%). The synthesis conditions and the parameters used in the attainment of LTO:Fe-LC influenced in the generation of the magnetic behavior, which resembles that observed in DMOs and supported by the magnetic polaron model [49]. On the other hand, the superparamagnetic behavior observed in LTO:Fe-HC is associated with the high Fe concentration (above 10 at.%) found on the thin film, where the synthesis conditions promoted the generation of the magnetic behavior. It has been reported that high amounts of dopant destroy the ferromagnetic order in DMOs and other types of magnetic behavior may arise [53,54,55,56]. In our case, the LTO:Fe-HC sample presented a superparamagnetic behavior.

4. Conclusions

When a structural analysis was performed on lithium tantalate nanoparticles, a 0.5 wt.% Fe-doped lithium tantalate target (T1), and a 1.8 wt.% Fe-doped lithium tantalate target (T2), the computed volumes of the unit cells were similar, which indicated that the Fe did not substitute completely into the crystalline structure of targets. Also, by Raman spectroscopy, it was concluded that the Li–O bonds of the crystalline structure of T1 and T2 were affected during the sintering process due to the generation of lithium vacancies, which was reflected by the broadening of Raman peaks associated to the Li–O bonds.
Targets T1 and T2 were used in a sputtering process to synthesize two Fe-doped lithium tantalate thin films (LTO:Fe-LC and LTO:Fe-HC, respectively). After EDS analysis, it was demonstrated that the Fe concentration (%at.) in LTO:Fe-HC varied from 0.58 to 17 along the cross-section of the thin film, while in LTO:Fe-LC, it varied from 0.40 to 0.86. After conducting structural analyses, it was found that the calculated unit cell volumes of LTO:Fe-LC and LTO:Fe-HC decreased in comparison with the unit cell volumes of the lithium tantalate powders, T1 and T2. The contraction of the unit cells was associated with the substitution of Fe3+ ions into the LT structure at Li atomic positions. On the other hand, by Raman spectroscopy, it was observed that the bands associated with Li–O bonds in the spectra of LTO:Fe-LC and LTO:Fe-HC presented some changes, such as displacement and widening, which were attributed to the effect of the dopant on the structure.
The ferromagnetism observed in LTO:Fe-LC was associated with point defects (as donors) created during the thin film synthesis and highly correlated with the low Fe concentration (less than 1 at.%). The synthesis conditions and the parameters used in the attainment of LTO:Fe-LC influenced the resultant magnetic behavior, which resembles that observed in DMOs and supported by the magnetic polaron model. On the other hand, the superparamagnetic behavior observed in LTO:Fe-HC is associated with the high Fe concentration (above 10 at.%) found on the thin film, where the synthesis conditions promoted the generation of the magnetic behavior. It has been reported that high amounts of dopant destroy the ferromagnetic order in DMOs and other types of magnetic behavior may arise. In our case, the LTO:Fe-HC sample presented a superparamagnetic behavior.

Author Contributions

Conceptualization, J.R.F.M.; Formal analysis, S.D.V.M., J.T.E.G. and D.M.C.F.; Funding acquisition, D.M.C.F. and J.R.F.M.; Investigation, S.F.O.M. and J.R.F.M.; Methodology, S.D.V.M. and J.T.H.M.; Project administration, J.R.F.M.; Resources, J.TE.G., S.F.O.M. and J.R.F.M.; Supervision, S.F.O.M. and J.R.F.M.; Validation, S.D.V.M. and J.T.H.M.; Visualization, S.D.V.M.; Writing—original draft, S.D.V.M.; Writing—review & editing, S.F.O.M. and J.R.F.M. All authors have read and agreed to the published version of the manuscript.

Funding

This research was funded by the Consejo Nacional de Ciencia y Tecnología, grant number 429444.

Acknowledgments

The authors thank the technical assistance of C.R. Santillan-Rodríguez, Ó. Solis-Canto and C.E. Ornelas Gutiérrez from CIMAV-Chihuahua.

Conflicts of Interest

All contributing authors declare no conflicts of interest. The founding sponsors had no role in the design of the study; in the collection, analyses, or interpretation of data; in the writing of the manuscript, or in the decision to publish the results.

Appendix A

X’Pert HighScore Plus software from PANalytical was used to perform the Rietveld analysis [60]. Instructions from the section Rietveld Analysis/Semi-Automatic mode from the HighScore Online Plus Help were followed to develop the study of our samples. A file with information about the atomic coordinates of LT (“2101846.cif”) was downloaded from The Crystallographic Open Database [28]. The coordinates, lattice parameters, space group name, occupancy, and Wyckoff positions of the LT COD 2101846 were manually loaded and saved in the section of Analysis/Rietveld/Enter New Structure. This file was inserted along with experimental data and the Rietveld analysis in “Semi-Automatic Mode” was iteratively executed, in which different “Profile Parameters” were allowed to vary until satisfactory agreement indices were obtained. On the other hand, the a,b, and c lattice parameters of the sample LTO:Fe-LC were refined with the unit cell software, where the methodology and the theory can be found in reference [61].

References

  1. Ishihara, T. Inorganic Perovskite Oxides. In Springer Handbook of Electronic and Photonic Materials; Kasap, S., Peter, C., Eds.; Springer International Publishing: Cham, Switzerland, 2017; p. 1. [Google Scholar]
  2. Chen, C.; Zeng, F.; Li, J.H.; Sheng, P.; Luo, J.T.; Yang, Y.C.; Pan, F.; Zou, Y.; Huang, Y.Y.; Jiang, Z. Strong d–d electron interaction inducing ferromagnetism in Mn-doped LiNbO3. Thin Solid Films 2011, 520, 764–768. [Google Scholar] [CrossRef]
  3. Yao, D.; Zhou, X.; Ge, S. Raman scattering and room temperature ferromagnetism in Co-doped SrTiO3 particles. Appl. Surf. Sci. 2011, 257, 9233–9236. [Google Scholar] [CrossRef]
  4. Verma, K.C.; Gupta, V.; Kaur, J.; Kotnala, R.K. Raman spectra, photoluminescence, magnetism and magnetoelectric coupling in pure and Fe doped BaTiO3 nanostructures. J. Alloys Compd. 2013, 578, 5–11. [Google Scholar] [CrossRef]
  5. Song, Y.J.; Zhang, Q.H.; Shen, X.; Ni, X.D.; Yao, Y.; Yu, R.C. Room-Temperature Magnetism Realized by Doping Fe into Ferroelectric LiTaO3. Chin. Phys. Lett. 2014, 31, 017501. [Google Scholar] [CrossRef]
  6. Zeng, F.; Sheng, P.; Tang, G.S.; Pan, F.; Yan, W.S.; Hu, F.C.; Zou, Y.; Huang, Y.Y.; Jiang, Z.; Guo, D. Electronic structure and magnetism of Fe-doped LiNbO3. Mater. Chem. Phys. 2012, 136, 783–788. [Google Scholar] [CrossRef]
  7. Volk, T.; Wöhlecke, M. Lithium Niobate: Defects, Photorefraction and Ferroelectric Switching, 1st ed.; Hull, R., Osgood, R.M., Parisi, J., Warlimont, H., Eds.; Springer: Berlin, Germany, 2008; ISBN 3540707662. [Google Scholar]
  8. Takasugi, S.; Tomita, K.; Iwaoka, M.; Kato, H.; Kakihana, M. The hydrothermal and solvothermal synthesis of LiTaO3 photocatalyst: Suppressing the deterioration of the water splitting activity without using a cocatalyst. Int. J. Hydrog. Energy 2015, 40, 5638–5643. [Google Scholar] [CrossRef]
  9. Yang, T.; Liu, Y.; Zhang, L.; Hu, M.; Yang, Q.; Huang, Z.; Fang, M. Powder synthesis and properties of LiTaO3 ceramics. Adv. Powder Technol. 2014, 25, 933–936. [Google Scholar] [CrossRef]
  10. Gutmann, E.; Benke, A.; Gerth, K.; Böttcher, H.; Mehner, E.; Klein, C.; Krause-Buchholz, U.; Bergmann, U.; Pompe, W.; Meyer, D.C. Pyroelectrocatalytic Disinfection Using the Pyroelectric Effect of Nano- and Microcrystalline LiNbO3 and LiTaO3 Particles. J. Phys. Chem. C 2012, 116, 5383–5393. [Google Scholar] [CrossRef] [Green Version]
  11. Bamba, N.; Takaoka, J.; Chino, T.; Fukami, T.; Elouadi, B. Improved Piezoelectric Properties of LiTaO3 Family Solid Solution Ceramics with Modified Composition. Jpn. J. Appl. Phys. 2006, 45, 7426–7430. [Google Scholar] [CrossRef]
  12. Sun, B.; Wang, J.; Gou, J.; Liu, X.; Jiang, Y. Influence of thermal annealing on structural and optical properties of RF-sputtered LiTaO3 thin films. Mater. Res. Express 2018, 6, 026405. [Google Scholar] [CrossRef]
  13. Pan, D.; Wang, J.; Sun, B.; Gou, J. Study of the crystalline and optical properties of lithium tantalate thin films deposited by high power RF magnetron sputtering. Mater. Res. Express 2017, 4, 026402. [Google Scholar] [CrossRef]
  14. Combette, P.; Nougaret, L.; Giani, A.; Pascal-delannoy, F. RF magnetron-sputtering deposition of pyroelectric lithium tantalate thin films on ruthenium dioxide. J. Cryst. Growth 2007, 304, 90–96. [Google Scholar] [CrossRef]
  15. Nougaret, L.; Combette, P.; Pascal-Delannoy, F. Growth of lithium tantalate thin films by radio-frequency magnetron sputtering with lithium enriched target. Thin Solid Films 2009, 517, 1784–1789. [Google Scholar] [CrossRef]
  16. Zhang, D.Y.; Qian, W.; Li, K.; Xie, J.S. Ferroelectric Property of Ion Beam Enhanced Deposited Lithium Tantalate Thin Film. Adv. Mater. Res. 2011, 335, 1418–1423. [Google Scholar] [CrossRef]
  17. Riefer, A.; Sanna, S.; Schmidt, W.G. LiNb1-xTaxO3 Electronic Structure and Optical Response from First-Principles Calculations. Ferroelectrics 2013, 447, 78–85. [Google Scholar] [CrossRef]
  18. He, X.; Li, K.; Liu, M.; He, Y.; Zhang, X.; Zhao, Y.; Xue, D. An optical spectroscopy study of defects in lithium tantalate single crystals. Opt. Commun. 2008, 281, 2531–2534. [Google Scholar] [CrossRef]
  19. Bhatt, R.; Bhaumik, I.; Ganesamoorthy, S.; Bright, R.; Soharab, M.; Karnal, A.; Gupta, P. Control of Intrinsic Defects in Lithium Niobate Single Crystal for Optoelectronic Applications. Crystals 2017, 7, 23. [Google Scholar] [CrossRef] [Green Version]
  20. Zhao, M.G.; Chiu, M. Substitution site of the Fe3+ impurity in crystalline LiNbO3. Phys. Rev. B 1994, 49, 12556–12558. [Google Scholar] [CrossRef]
  21. Gog, T.; Schotters, P.; Falta, J.; Materlik, G.; Grodzicki, M. The lattice position of Fe in Fe-doped LiNbO 3. J. Phys. Condens. Matter 1995, 7, 6971–6980. [Google Scholar] [CrossRef]
  22. Mignoni, S.; Fontana, M.D.; Bazzan, M.; Ciampolillo, M.V.; Zaltron, A.M.; Argiolas, N.; Sada, C. Micro-Raman analysis of Fe-diffused lithium niobate waveguides. Appl. Phys. B 2010, 101, 541–546. [Google Scholar] [CrossRef]
  23. Li, Y.Y.; Chen, H.L.; Chen, G.J.; Kuo, C.L.; Hsieh, P.H.; Hwang, W.S. Investigation of the Defect Structure of Congruent and Fe-Doped LiNbO3 Powders Synthesized by the Combustion Method. Materials 2017, 10, 380. [Google Scholar] [CrossRef] [PubMed] [Green Version]
  24. Vitova, T.; Hormes, J.; Falk, M.; Buse, K. Site-selective investigation of site symmetry and site occupation of iron in Fe-doped lithium niobate crystals. J. Appl. Phys. 2009, 105, 013524. [Google Scholar] [CrossRef] [Green Version]
  25. Olimov, K.; Falk, M.; Buse, K.; Woike, T.; Hormes, J.; Modrow, H. X-ray absorption near edge spectroscopy investigations of valency and lattice occupation site of Fe in highly iron-doped lithium niobate crystals. J. Phys. Condens. Matter 2006, 18, 5135–5146. [Google Scholar] [CrossRef]
  26. Bush, T.S.; Catlow, C.R.A.; Chadwick, A.V.; Cole, M.; Geatches, R.M.; Greaves, G.N.; Tomlinson, S.M. Studies of cation dopant sites in metal oxides by EXAFS and computer-simulation techniques. J. Mater. Chem. 1992, 2, 309. [Google Scholar] [CrossRef]
  27. Alfonso, E.; Olaya, J.; Cubillos, G. Thin Film Growth Through Sputtering Technique and Its Applications. In Crystallization—Science and Technology; Barsi Andreeta, M.R., Ed.; InTech: Rijeka, Croatia, 2012; pp. 398–432. [Google Scholar]
  28. Crystallography Open Database. Available online: http://www.crystallography.net/cod/2101846.html (accessed on 3 September 2018).
  29. Sanna, S.; Neufeld, S.; Rüsing, M.; Berth, G.; Zrenner, A.; Schmidt, W.G. Raman scattering efficiency in LiTaO3 and LiNbO3 crystals. Phys. Rev. B 2015, 91, 224302. [Google Scholar] [CrossRef]
  30. Repelin, Y.; Husson, E.; Bennani, F.; Proust, C. Raman spectroscopy of lithium niobate and lithium tantalate. Force field calculations. J. Phys. Chem. Solids 1999, 60, 819–825. [Google Scholar] [CrossRef]
  31. Klug, H.P.; Harold, P.; Alexander, L.E.; Leroy, E. X-ray Diffraction Procedures for Polycrystalline and Amorphous Materials, 2nd ed.; John Wiley & Sons, Ltd.: New York, NY, USA, 1974; ISBN 9780471493693. [Google Scholar]
  32. Rahaman, M.N. Ceramic Processing and Sintering, 2nd ed.; Dekker, M., Ed.; M. Dekker: New York, NY, USA, 2003; ISBN 9780824709884. [Google Scholar]
  33. Shi, L.; Kong, Y.; Yan, W.; Sun, J.; Chen, S.; Zhang, L.; Zhang, W.; Liu, H.; Li, X.; Xie, X.; et al. Determination of the composition of lithium tantalate by means of Raman and OH− absorption measurements. Mater. Chem. Phys. 2006, 95, 229–234. [Google Scholar] [CrossRef]
  34. Fierro-Ruiz, C.; Sánchez-Dena, O.; Cabral-Larquier, E.; Elizalde-Galindo, J.; Farías, R. Structural and Magnetic Behavior of Oxidized and Reduced Fe Doped LiNbO3 Powders. Crystals 2018, 8, 108. [Google Scholar] [CrossRef] [Green Version]
  35. Li, Y.Y.; Chen, H.L.; Kuo, C.L.; Hsieh, P.H.; Hwang, W.S. Raman spectra and ferromagnetism of nanocrystalline Fe-doped Li0.43Nb0.57O3+δ. Ceram. Int. 2016, 42, 10764–10769. [Google Scholar] [CrossRef]
  36. Fontana, M.D.; Bourson, P. Microstructure and defects probed by Raman spectroscopy in lithium niobate crystals and devices. Appl. Phys. Rev. 2015, 2, 40602. [Google Scholar] [CrossRef]
  37. Yadav, A.K.; Singh, P. A review of the structures of oxide glasses by Raman spectroscopy. RSC Adv. 2015, 5, 67583–67609. [Google Scholar] [CrossRef]
  38. Berengue, O.M.; Rodrigues, A.D.; Dalmaschio, C.J.; Lanfredi, A.J.C.; Leite, E.R.; Chiquito, A.J. Structural characterization of indium oxide nanostructures: A Raman analysis. J. Phys. D Appl. Phys. 2010, 43, 45401. [Google Scholar] [CrossRef]
  39. Bachiri, E.; El Bachiri, A.; El Hasnaoui, M.; Bennani, F.; Bousselamti, M. Effect of Ni-doping Charge on Structure and Properties of LiNbO3. J. Mater. Environ. Sci. 2016, 7, 3353–3361. [Google Scholar]
  40. Cullity, B.D.; Graham, C.D. Introduction to Magnetic Materials, 2nd ed.; Hanzo, L., Ed.; IEEE/Wiley: Hoboken, NJ, USA, 2009; ISBN 9780471477419. [Google Scholar]
  41. Chen, C.C.; Hsu, Y.J.; Lin, Y.F.; Lu, S.Y. Superparamagnetism Found in Diluted Magnetic Semiconductor Nanowires: Mn-Doped CdSe. J. Phys. Chem. C 2008, 112, 17964–17968. [Google Scholar] [CrossRef]
  42. Fonseca, F.C.; Goya, G.F.; Jardim, R.F.; Muccillo, R.; Carreño, N.L.V.; Longo, E.; Leite, E.R. Superparamagnetism and magnetic properties of Ni nanoparticles embedded in SiO2. Phys. Rev. B 2002, 66, 104406. [Google Scholar] [CrossRef] [Green Version]
  43. Borges, R.P.; da Silva, R.C.; Cruz, M.M.; Godinho, M. Influence of structural transitions of BaTiO3 on the magnetic properties of Fe nanoparticles. J. Phys. Conf. Ser. 2010, 200, 072014. [Google Scholar] [CrossRef] [Green Version]
  44. Wei, H.; Yao, T.; Pan, Z.; Mai, C.; Sun, Z.; Wu, Z.; Hu, F.; Jiang, Y.; Yan, W. Role of Co clusters in wurtzite Co:ZnO dilute magnetic semiconductor thin films. J. Appl. Phys. 2009, 105, 043903. [Google Scholar] [CrossRef]
  45. Park, J.H.; Kim, M.G.; Jang, H.M.; Ryu, S.; Kim, Y.M. Co-metal clustering as the origin of ferromagnetism in Co-doped ZnO thin films. Appl. Phys. Lett. 2004, 84, 1338–1340. [Google Scholar] [CrossRef] [Green Version]
  46. Shinde, S.R.; Ogale, S.B.; Higgins, J.S.; Zheng, H.; Millis, A.J.; Kulkarni, V.N.; Ramesh, R.; Greene, R.L.; Venkatesan, T. Co-occurrence of Superparamagnetism and Anomalous Hall Effect in Highly Reduced Cobalt-Doped Rutile TiO2−δ Films. Phys. Rev. Lett. 2004, 92, 166601. [Google Scholar] [CrossRef] [Green Version]
  47. Yang, Z.; Zuo, Z.; Zhou, H.M.; Beyermann, W.P.; Liu, J.L. Epitaxial Mn-doped ZnO diluted magnetic semiconductor thin films grown by plasma-assisted molecular-beam epitaxy. J. Cryst. Growth 2011, 314, 97–103. [Google Scholar] [CrossRef]
  48. Coey, J.M.D.; Mlack, J.T.; Venkatesan, M.; Stamenov, P. Magnetization Process in Dilute Magnetic Oxides. IEEE Trans. Magn. 2010, 46, 2501–2503. [Google Scholar] [CrossRef]
  49. Coey, J.M.D.; Venkatesan, M.; Fitzgerald, C.B. Donor impurity band exchange in dilute ferromagnetic oxides. Nat. Mater. 2005, 4, 173–179. [Google Scholar] [CrossRef] [PubMed]
  50. Ackland, K.; Monzon, L.M.A.; Venkatesan, M.; Coey, J.M.D. Magnetism of Nanostructured CeO2. IEEE Trans. Magn. 2011, 47. [Google Scholar] [CrossRef]
  51. Mosivand, S.; Monzon, L.M.A.; Ackland, K.; Kazeminezhad, I.; Coey, J.M.D. Structural and magnetic properties of sonoelectrocrystallized magnetite nanoparticles. J. Phys. D Appl. Phys. 2014, 47, 13. [Google Scholar] [CrossRef]
  52. Coey, J.M.D. Dilute magnetic oxides. Curr. Opin. Solid State Mater. Sci. 2006, 10, 83–92. [Google Scholar] [CrossRef]
  53. Yadav, A.K.; Haque, S.M.; Shukla, D.; Choudhary, R.J.; Jha, S.N.; Bhattacharyya, D. X-ray absorption spectroscopy of Mn doped ZnO thin films prepared by rf sputtering technique. AIP Adv. 2015, 5. [Google Scholar] [CrossRef] [Green Version]
  54. Hu, L.; Zhu, L.; He, H.; Zhang, L.; Ye, Z. Acceptor defect-participating magnetic exchange in ZnO:Cu nanocrystalline film: Defect structure evolution, Cu-N synergetic role and magnetic control. J. Mater. Chem. C 2015, 3, 1330–1346. [Google Scholar] [CrossRef]
  55. Singhal, R.K.; Dhawan, M.S.; Gaur, S.K.; Dolia, S.N.; Kumar, S.; Shripathi, T.; Deshpande, U.P.; Xing, Y.T.; Saitovitch, E.; Garg, K.B. Study of ferromagnetism in Mn doped ZnO dilute semiconductor system. J. Phys. Conf. Ser. 2009, 153. [Google Scholar] [CrossRef]
  56. Rajkumar, N.; Susila, V.M.; Ramachandran, K. On the possibility of ferromagnetism in CdO:Mn at room temperature. J. Exp. Nanosci. 2011, 6, 389–398. [Google Scholar] [CrossRef]
  57. Depla, D.; Mahieu, S.; Greene, J.E. Sputter Deposition Processes. In Handbook of Deposition Technologies for Films and Coatings; Elsevier Inc.: Amsterdam, The Netherlands, 2010; pp. 253–296. ISBN 9780815520313. [Google Scholar]
  58. Khalaf, M.K.; Al-Taay, H.F.; Ali, D.S. Effect of radio frequency magnetron sputtering power on structural and optical properties of Ti6Al4V thin films. Photonic Sens. 2017, 7, 163–170. [Google Scholar] [CrossRef] [Green Version]
  59. Cheng, H.; Sun, Y.; Hing, P. The influence of deposition conditions on structure and morphology of aluminum nitride films deposited by radio frequency reactive sputtering. Thin Solid Films 2003, 434, 112–120. [Google Scholar] [CrossRef]
  60. Degen, T.; Sadki, M.; Bron, E.; König, U.; Nénert, G. The HighScore suite. Powder Diffr. 2014, 29, S13–S18. [Google Scholar] [CrossRef] [Green Version]
  61. Holland, T.J.B.; Redfern, S.A.T. Unit cell refinement from powder diffraction data: The use of regression diagnostics. Mineral. Mag. 1997, 61, 65–77. [Google Scholar] [CrossRef]
Figure 1. Structural and morphological characterization of LT NPs: (a) XRD pattern; (b) Raman spectrum; (c) SEM micrograph; (d) Particle size distribution.
Crystals 10 00050 g001
Figure 2. Structural and morphological characterization of the targets: (a,c) XRD pattern of T1 and T2, respectively; (b,d) grain size distribution of T1 and T2, respectively.
Crystals 10 00050 g002
Figure 3. XRD pattern of ITO/Pyrex, LTO:Fe-HC/ITO/Pyrex, and LTO:Fe-LC/ITO/Pyrex systems.
Crystals 10 00050 g003
Figure 4. Thin-film thickness: (a) LTO:Fe-HC; (b) LTO:Fe-LC.
Crystals 10 00050 g004
Figure 5. Variation in the Fe concentration through the cross-section of the thin films.
Crystals 10 00050 g005
Figure 6. Raman spectra of the LT powders, T1, T2, LTO:Fe-HC, and LTO:Fe-LC samples.
Crystals 10 00050 g006
Figure 7. Morphology characterization (SEM): (a) LTO:Fe-HC; (b) LTO:Fe-LC.
Crystals 10 00050 g007
Figure 8. Magnetic hysteresis loops and zoomed views of the magnetic coercivities: (a,b) LTO:Fe-HC; (c,d) LTO:Fe-LC.
Crystals 10 00050 g008
Figure 9. ZFC and FC curves: (a) LTO:Fe-HC and (b) LTO:Fe-LC.
Crystals 10 00050 g009
Table 1. Deposition conditions of LTO:Fe-LC and LTO:Fe-HC.
LTO:Fe-LCLTO:Fe-HC
TargetT1 (LT-0.5%wt. Fe)T2 (LT-1.8%wt. Fe)
AtmosphereArgonArgon
Handling pressure0.4 Pa0.4 Pa
R.F. gun power30 W50 W
Substrate temperature450 °C450 °C
Substrate-target distance16 cm16 cm
Deposition time1.5 h2.5 h
Table 2. Crystal lattice parameters and unit cell volumes.
Lattice Parameters (Å)Unit Cell Volume (Å3)Weighted R ProfileGoodness of Fit
a = bc
LT powders5.15513.766316.798.214.08
T15.15413.780316.999.265.03
T25.15213.783316.8210.382.05
LTO:Fe-HC5.14013.753314.665.731.25
LTO:Fe-LC5.14913.700314.59Sigmafit = 4.96

