Article

In Situ TEM Crystallization of Amorphous Iron Particles

NABLA Lab, Biological and Environmental Sciences and Engineering (BESE) Division, King Abdullah University of Science and Technology (KAUST), Thuwal 23955-6900, Saudi Arabia
*
Authors to whom correspondence should be addressed.
The authors contributed equally.
Crystals 2020, 10(1), 41; https://doi.org/10.3390/cryst10010041
Submission received: 18 November 2019 / Revised: 1 January 2020 / Accepted: 8 January 2020 / Published: 17 January 2020
(This article belongs to the Section Crystal Engineering)

Abstract

:
Even though sub-micron and nano-sized iron particles generally display single or polycrystalline structures, a growing interest has also been dedicated to the class of amorphous ones, whose absence of a crystal structure is capable of modifying their physical properties. Among the several routes so far described to prepare amorphous iron particles, we report here about the crystallization of those prepared by chemical reduction of Fe3+ ions using NaBH4, with sizes ranging between 80 and 200 nm and showing a high stability against oxidation. Their crystallization was investigated by differential scanning calorimetry (DSC), X-ray diffraction (XRD), and in situ heating transmission electron microscopy (TEM). The latter technique was performed by the combined use of electron diffraction of a selected sample area, and bright and dark field TEM imaging, and allowed determining that the crystallization turns the starting amorphous particles into polycrystalline α-Fe ones. Also, under the high vacuum of the TEM column, the crystallization temperature of the particles shifted to 550 °C from the 465 °C, previously observed by DSC and XRD under 105 Pa of Ar. This indicates the pivotal role of the external pressure in influencing the starting point of phase transition. Conversely, upon both the DSC/XRD pressure and the TEM vacuum conditions, the mean size of the crystal domains increases as a consequence of further thermal increase, even if with some pressure-related differences.

Graphical Abstract

1. Introduction

Amorphous metals, also often called metal glasses, have been known of for several decades [1], mainly as alloys. In bulk form, they have deserved growing interest over time for their peculiar properties, such as hard or very soft magnetic behavior, high electric resistivity, high resistance to corrosion, and enhanced mechanical properties with respect to their crystalline counterparts [2,3,4,5,6]. All of these properties come from the internal structural disorder of metal glasses. The most traditional method to obtain this class of materials consists of cooling a molten phase at a very high rate (105–106 °C s−1), so that the atoms do not have enough time to reach the equilibrium positions and give rise to the periodic structure typical of a crystal phase [1]. Besides, over the years other routes were developed to produce amorphous metals, such as chemical vapor deposition, reactions at the solid state, solid-state electromechanically driven amorphization, ion irradiation, and mechanical alloying [7,8,9,10,11].
Fe-based materials play a crucial role among the several soft magnets due to their possible applications in data recording media, electric motors, and magnetic sensors as a consequence of their extremely low coercivity, very high magnetization saturation, and good thermal stability [12,13]. Besides, like in the more general case mentioned above, these materials exhibit quite enhanced magnetic and mechanical properties at the amorphous state if compared to their crystalline counterparts, because grain boundaries and magnetocrystalline anisotropy are absent in this state [14,15]. In addition, a further major improvement in these physical properties is observed when the materials pass from the bulk state to the sub-micron and nano sizes [16,17]. This is also the case for pure Fe amorphous nanoparticles, which have been studied in terms of magnetic properties, synthetic routes followed, and the influences of these routes over the subsequent crystallization. Two methods emerged as the most widely used to synthesize this kind of small particle, the first based on the ultrasonic irradiation of iron pentacarbonyl and the second on the reduction of Fe3+ with NaBH4 [18,19,20,21].
In this work we report on the first in situ transmission electron microscopy (TEM) study of the crystallization of amorphous iron sub-micron and nanoparticles prepared following the synthetic method where the trivalent iron cations were reduced by using NaBH4. The crystallization was performed by heating the particles using an ultra-low drift, microelectromechanical system (MEMS)-based in situ TEM sample holder under the high vacuum conditions typical of a TEM equipped with a Schottky electron source, and using an experimental procedure similar to the one we already published for the in situ crystallization of titania nanotubes [22,23]. The results reported herein indicate that the amorphous particles, whose size ranges between 80 and 200 nm, start to crystallize at 550 °C by in situ TEM heating and give rise multi-domain nanocrystals. These findings were compared with the crystallization of the same particles performed by differential scanning calorimetry (DSC) under 105 Pa of Ar, where a much lower (465 °C) crystallization temperature was found in comparison to the thermally-driven in situ TEM experiment. The results found by DSC were further confirmed by X-ray diffraction (XRD) experiments, performed below and above 470 °C, and again under the same pressure of Ar. Furthermore, what was observed by both in situ TEM and XRD indicates that the size of the crystal domains increases as a consequence of an additional thermal rise, even if in a slightly different way, and this difference can again be ascribed to the diverse external pressure conditions. All these observed differences concerning both starting crystallization temperature and crystal domains’ growth are discussed in terms of pressure effect, since both the DSC/XRD atmosphere and the high vacuum of the TEM can be considered chemically inert conditions.

2. Materials and Methods

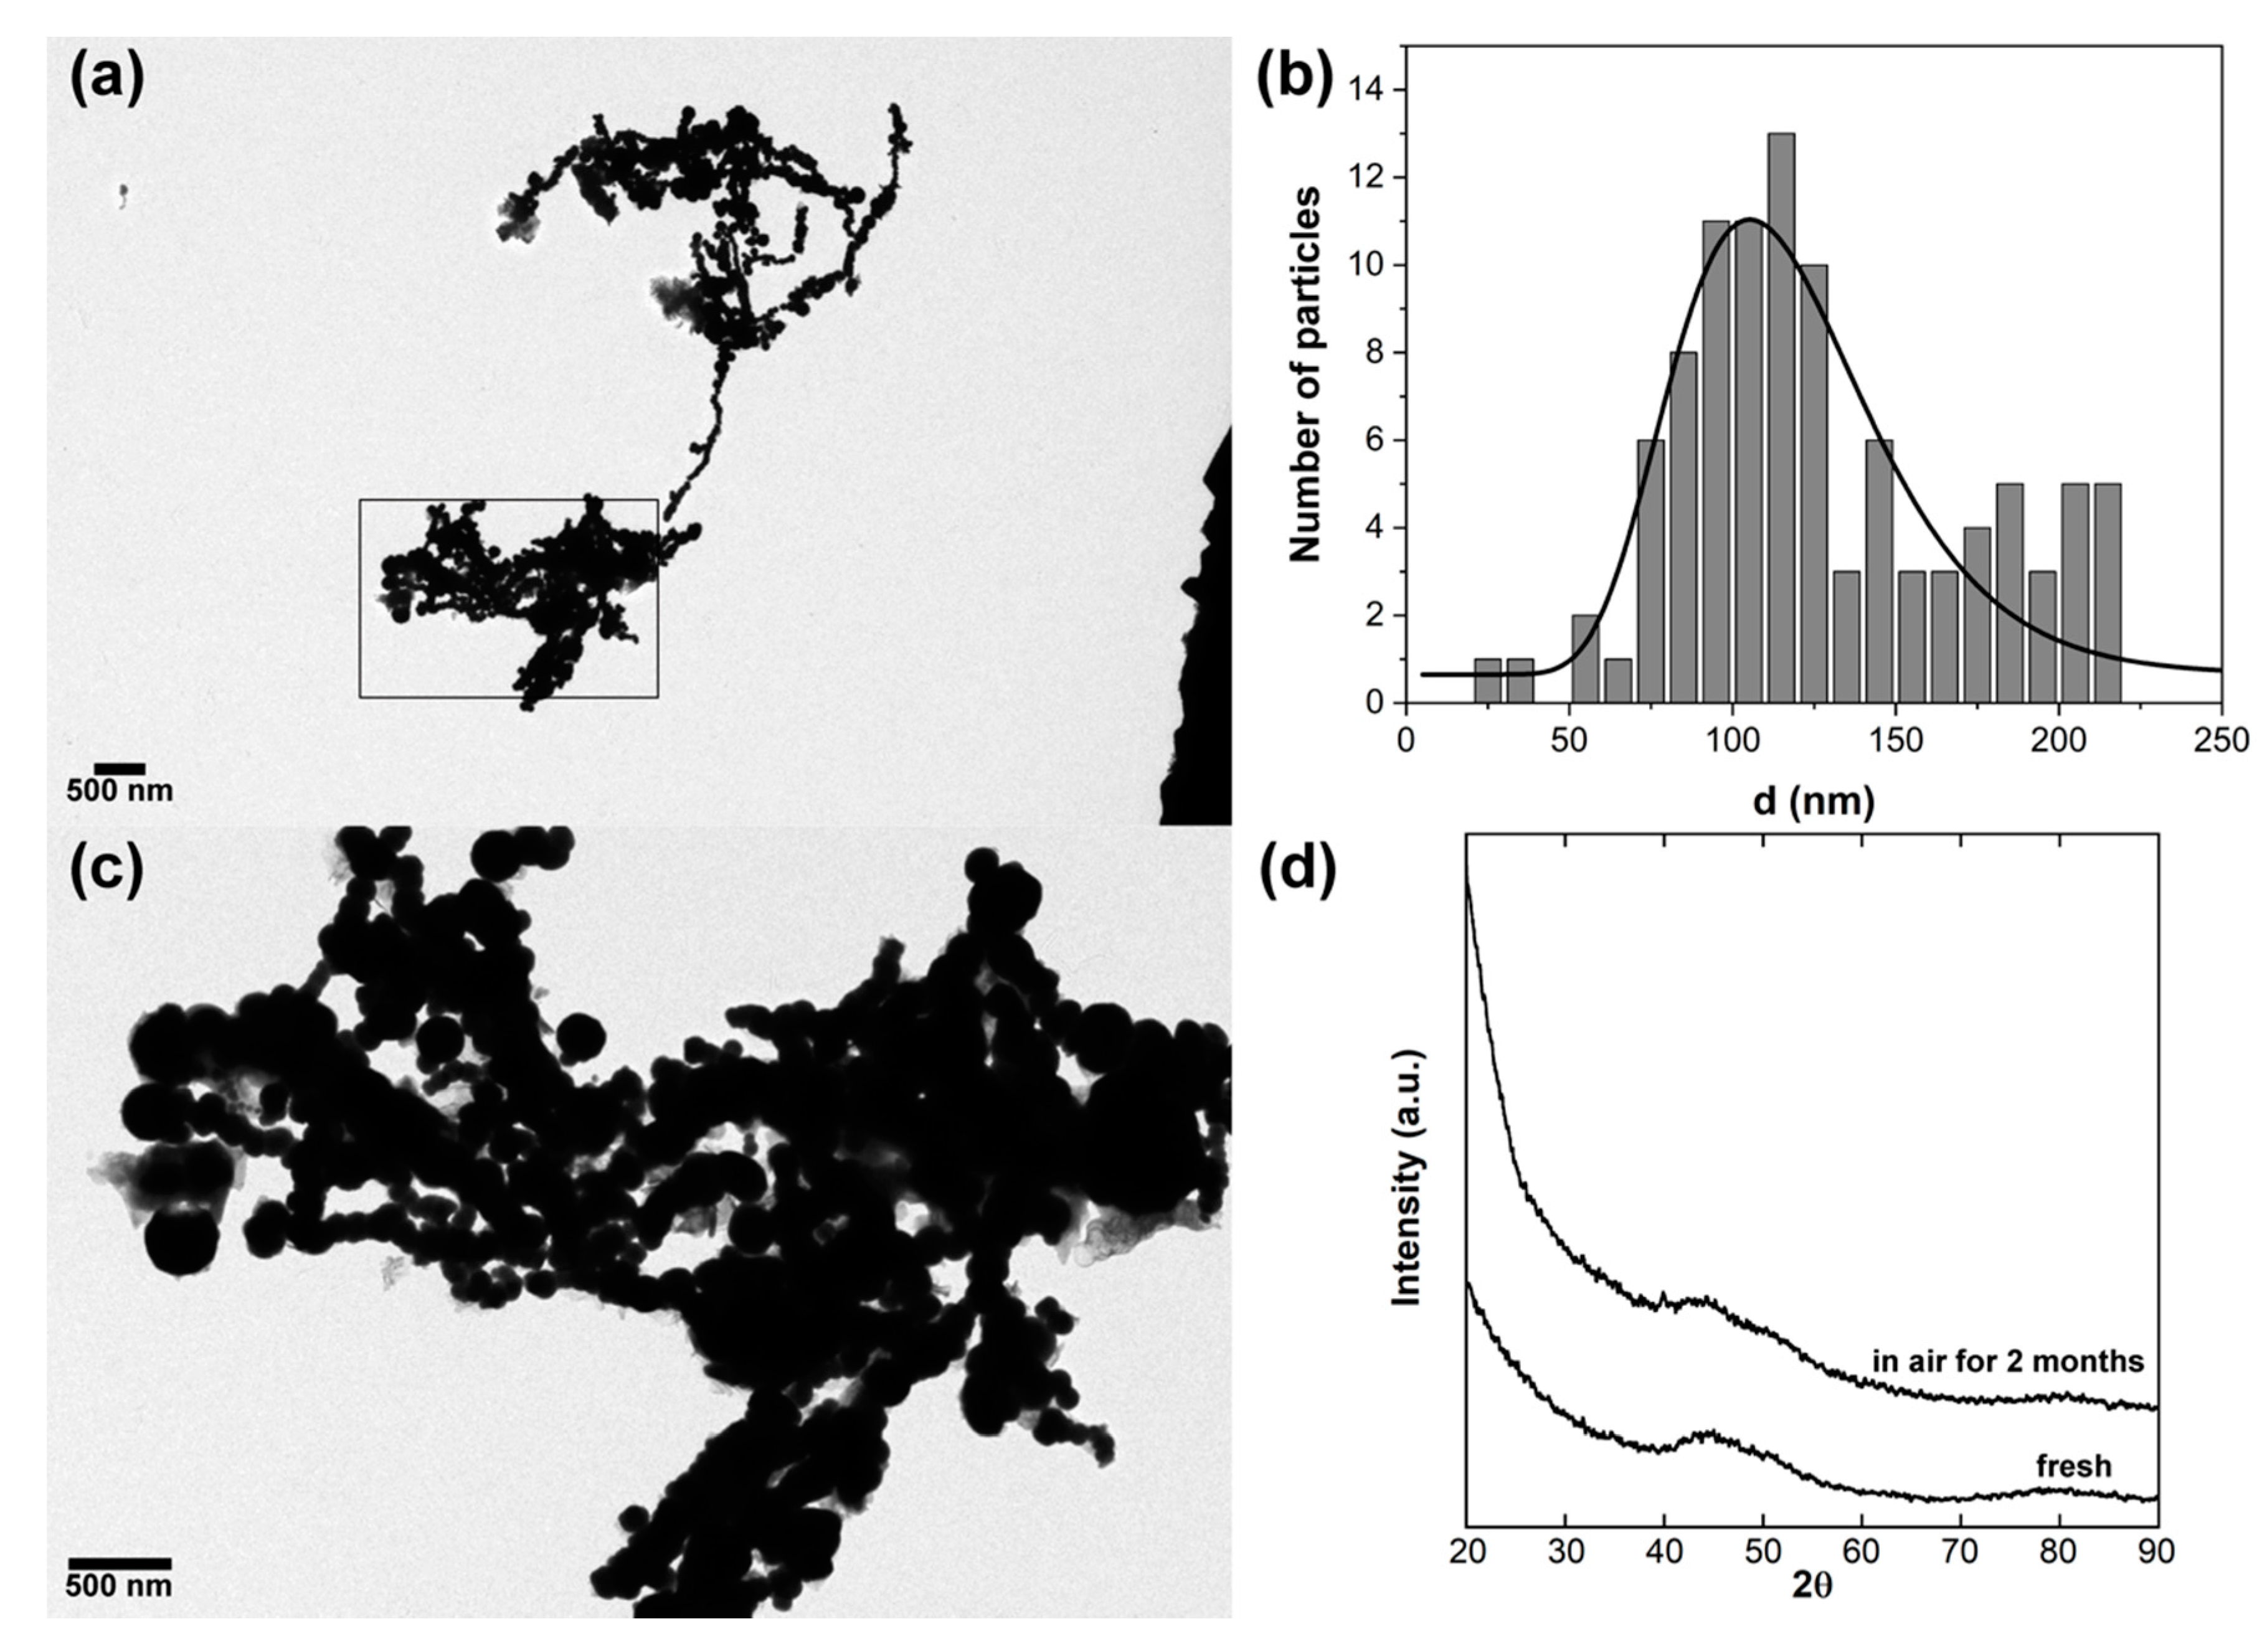
2.1. Synthesis of the Iron Amorphous Particles

In a typical synthesis, a FeCl3 ∙ 6H2O (Aldrich, St. Louis, MO, USA, 97%) water solution was heated at 80 °C under stirring for 1 h in the presence of anhydrous Na2SO4 (Fisher, Hanover Park, IL, USA) [24]. The mixture was then treated with a NaBH4 (Aldrich, St. Louis, MO, USA, 98%) water solution (Fe3+/NaBH4 molar ratio 1/4), added dropwise under N2 atmosphere, to ensure the complete reduction of Fe3+ to the metal state, with a procedure similar to that reported by Chen et al. [25]. The solid black precipitate of amorphous iron particles was magnetically separated and washed with water and acetone.

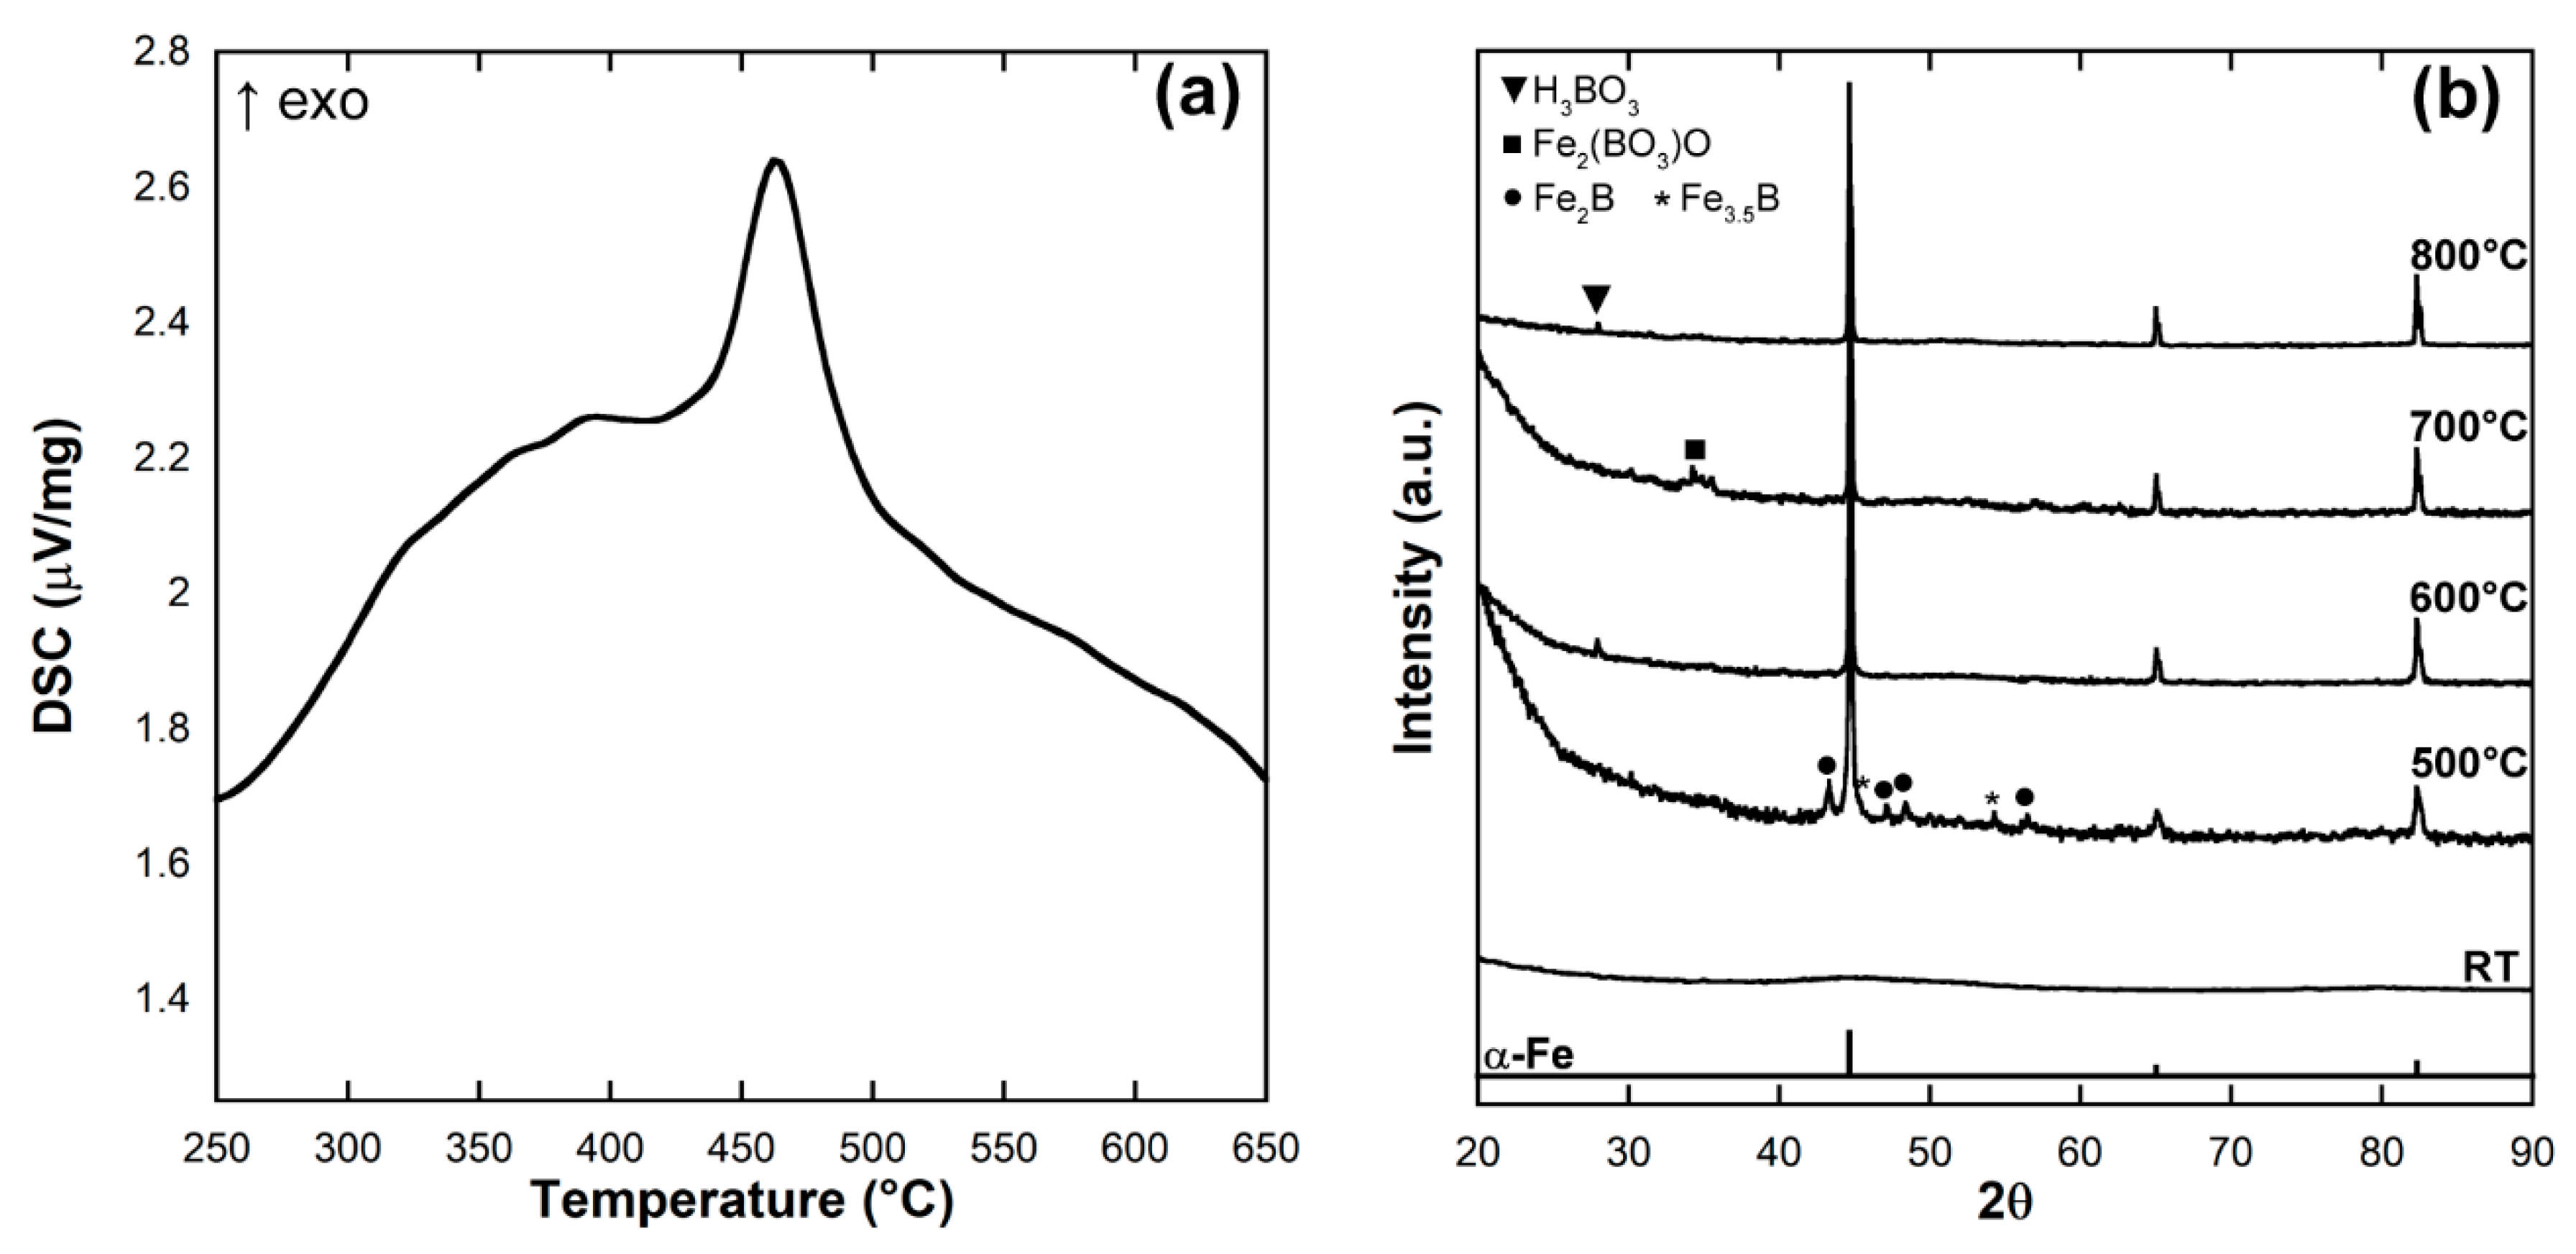
2.2. Differential Scanning Calorimetry and X-ray Diffraction

Differential scanning calorimetry (DSC) measurements were performed on a STA 449 F1 (Netzsch, Selb, Germany), from 25 °C (room temperature, RT) to 700 °C at 10 °C min−1 under 105 Pa of Ar flow. Powder X-ray diffraction (XRD) patterns were recorded on a Bruker (Billerica, MA, USA) D2 Phaser powder θ–θ diffractometer equipped with a Cu Kα (λ = 1.54 Å) source and a Lynxeye detector within the 2θ range of 15–90°, step size 0.05°, and time per step of 1 s. The average crystal size was determined by Scherrer equation, and the LaB6 standard was used to obtain the instrumental broadening [26].

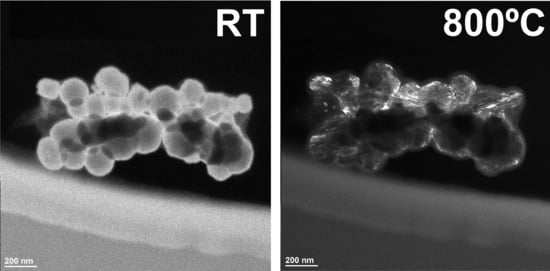
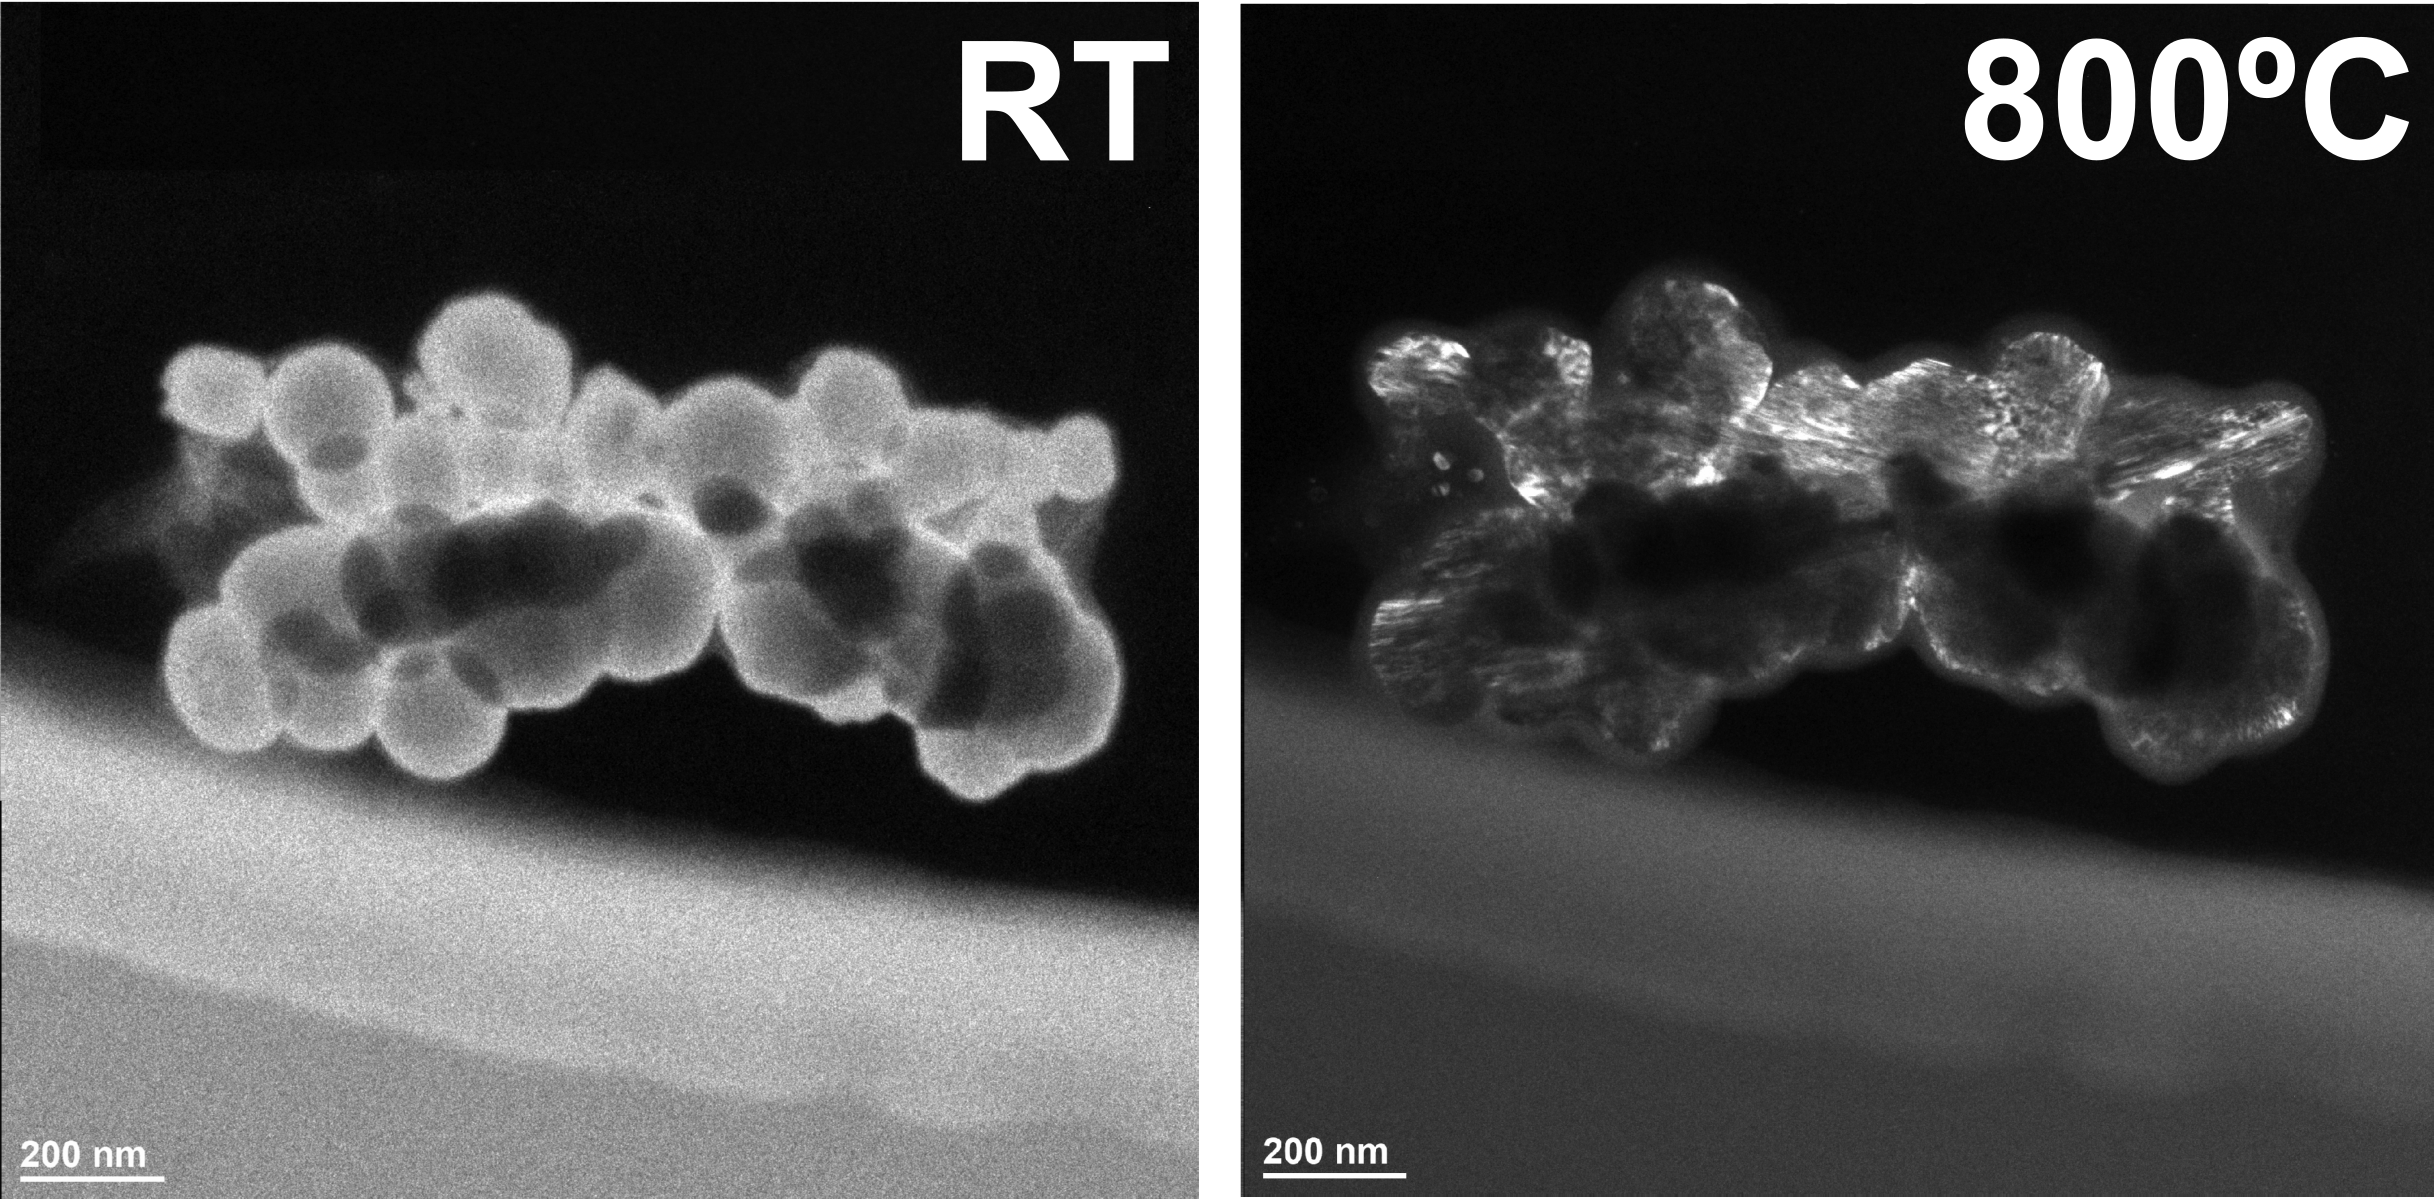
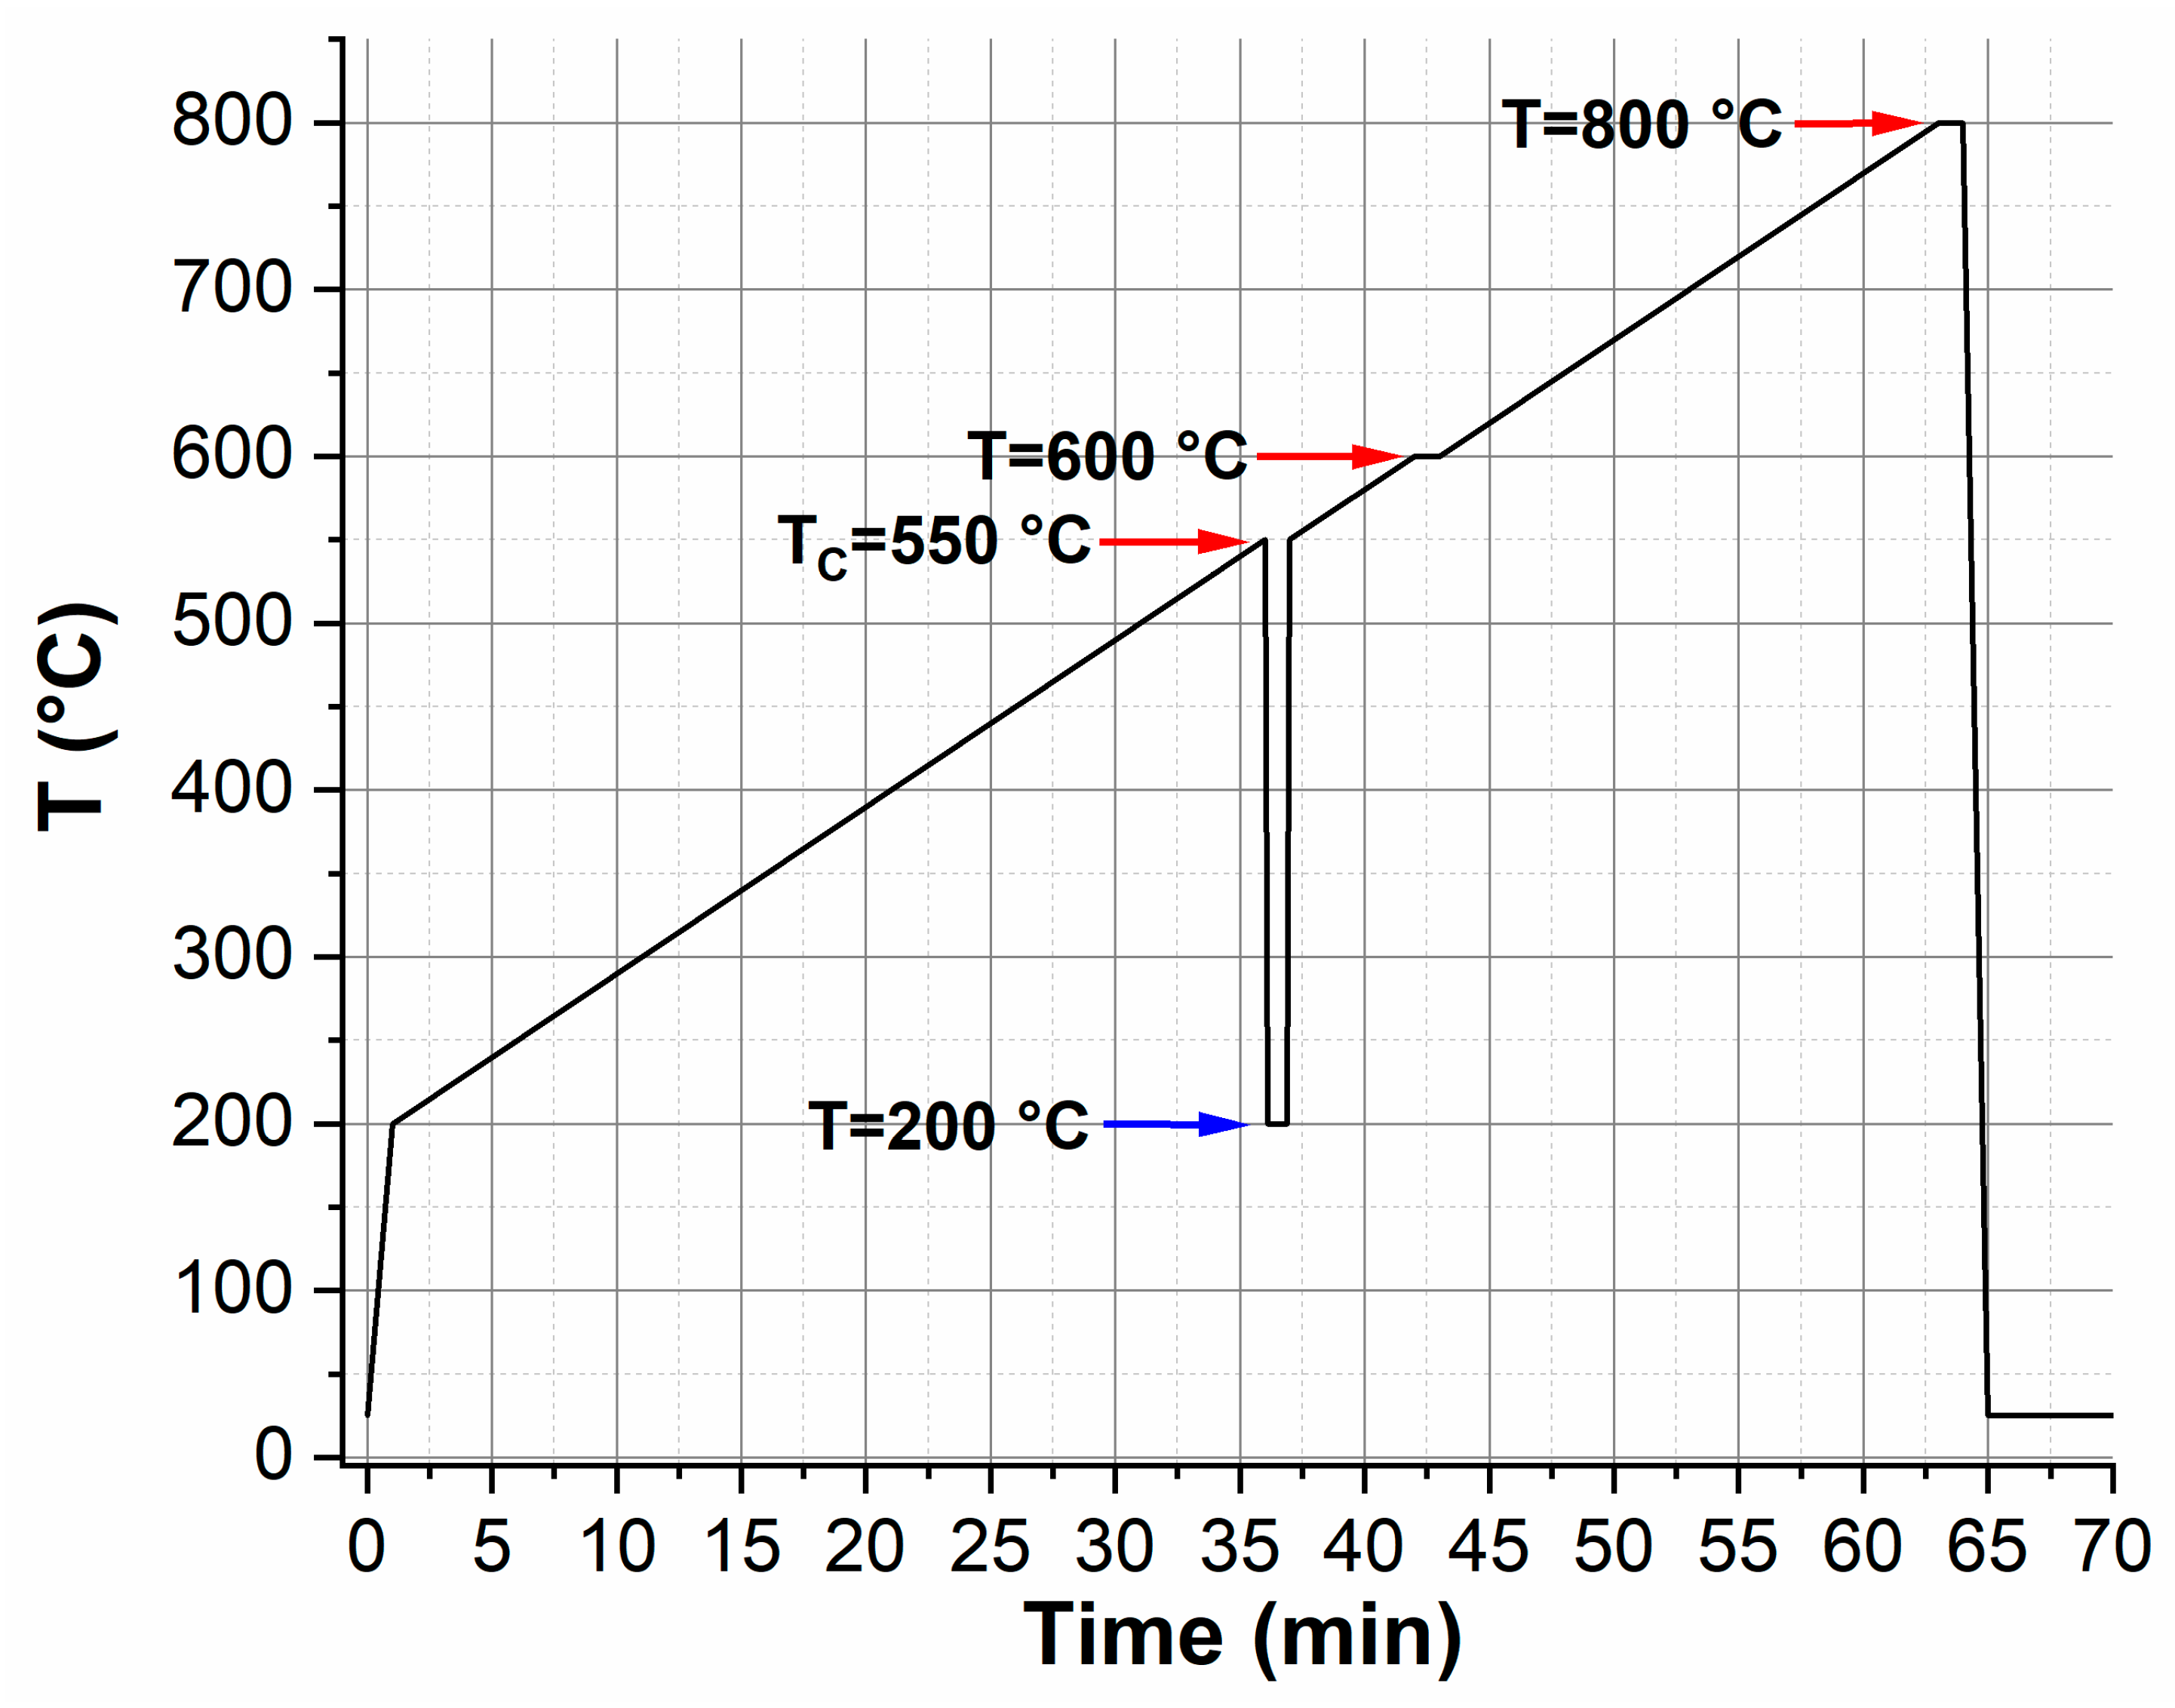
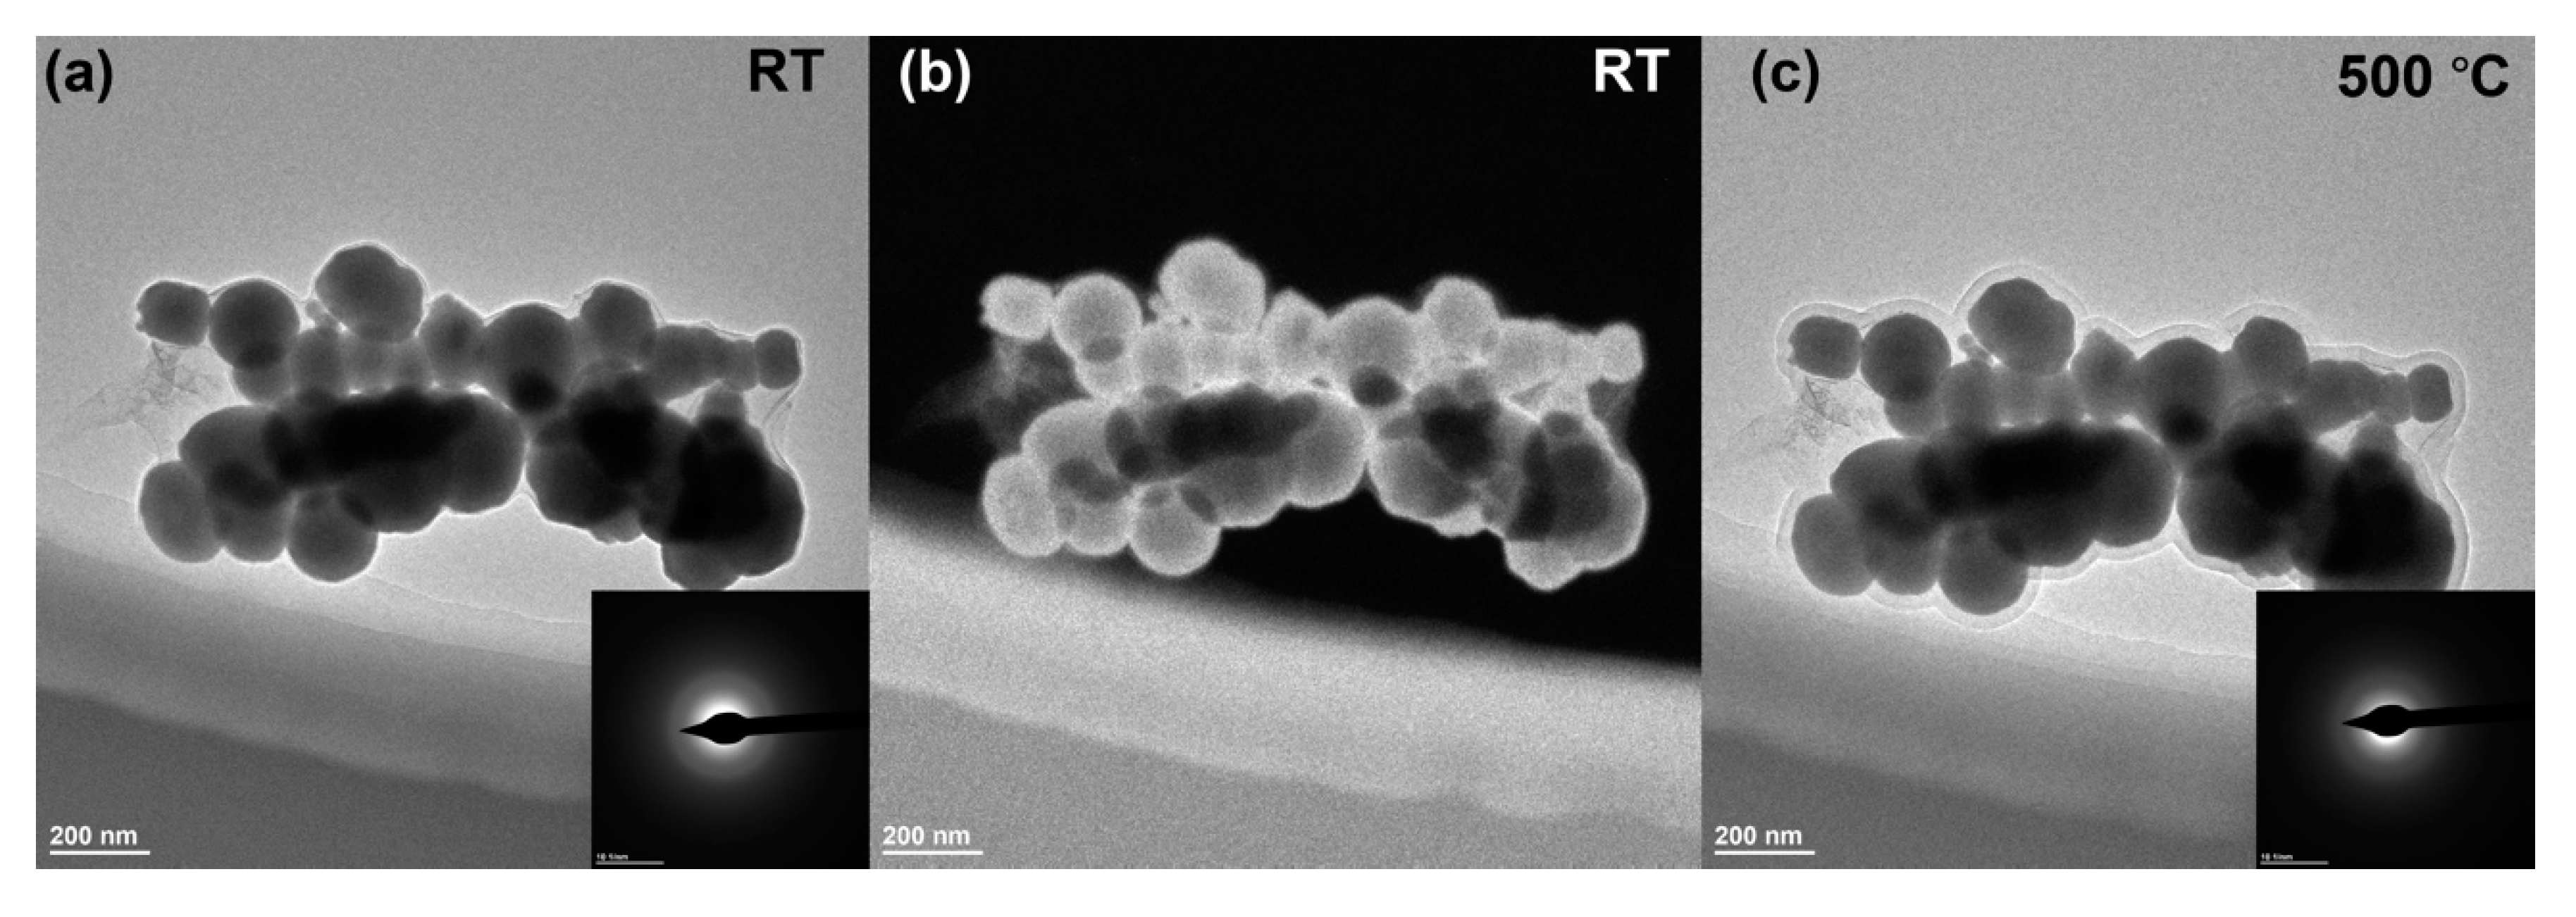
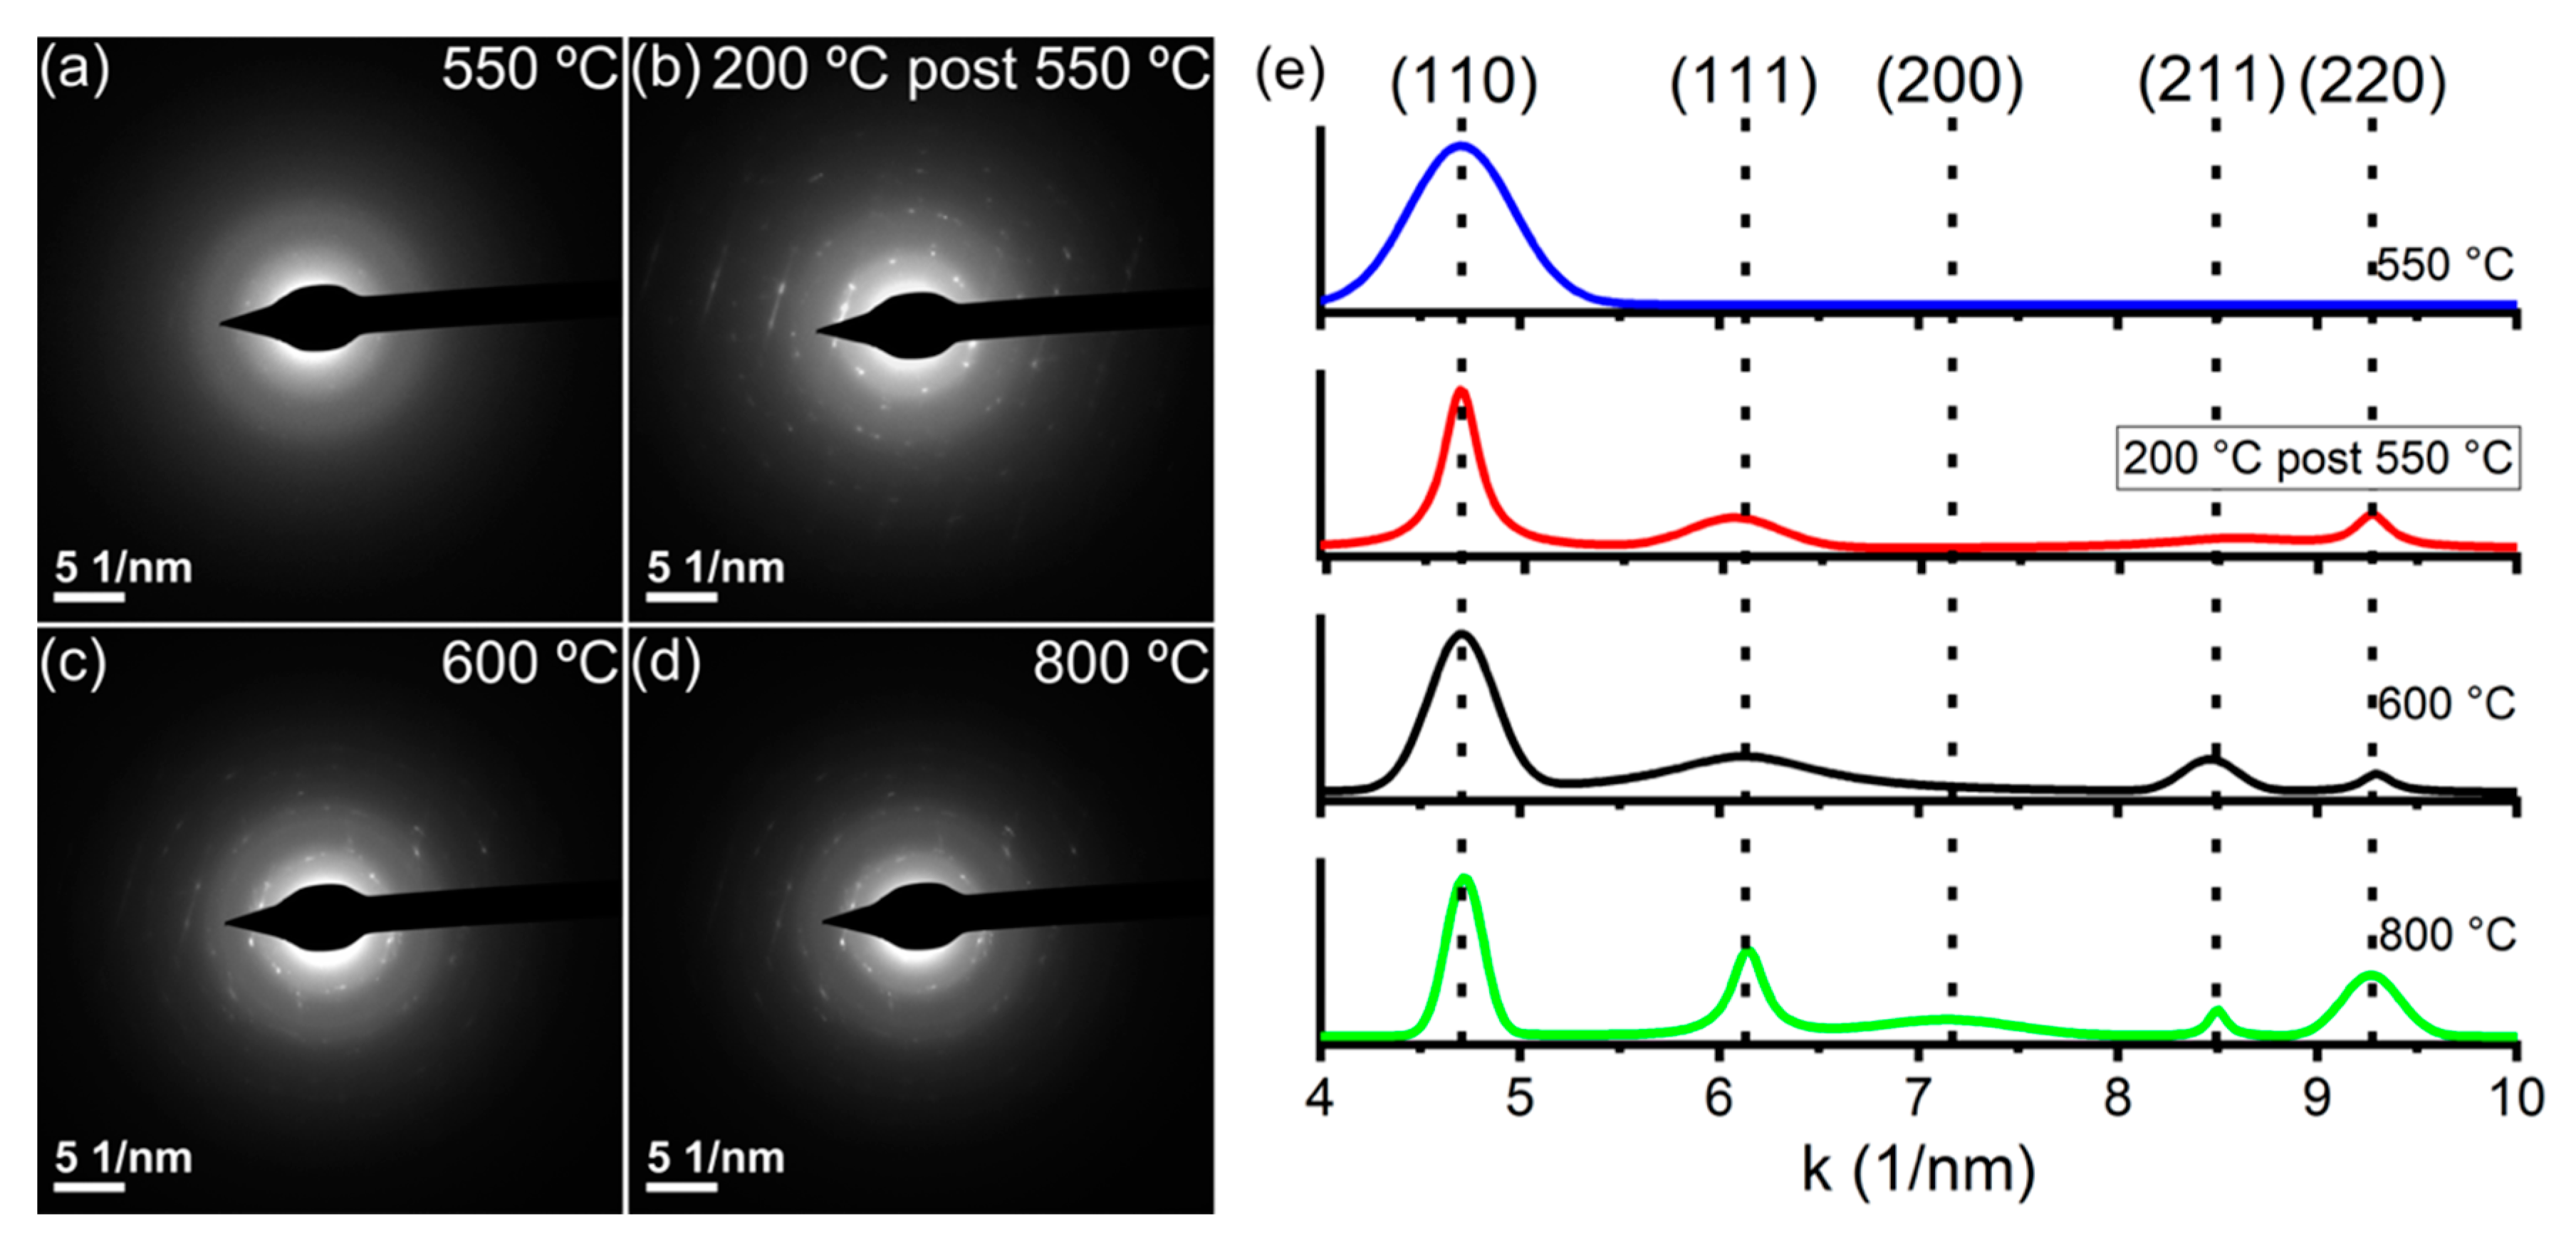
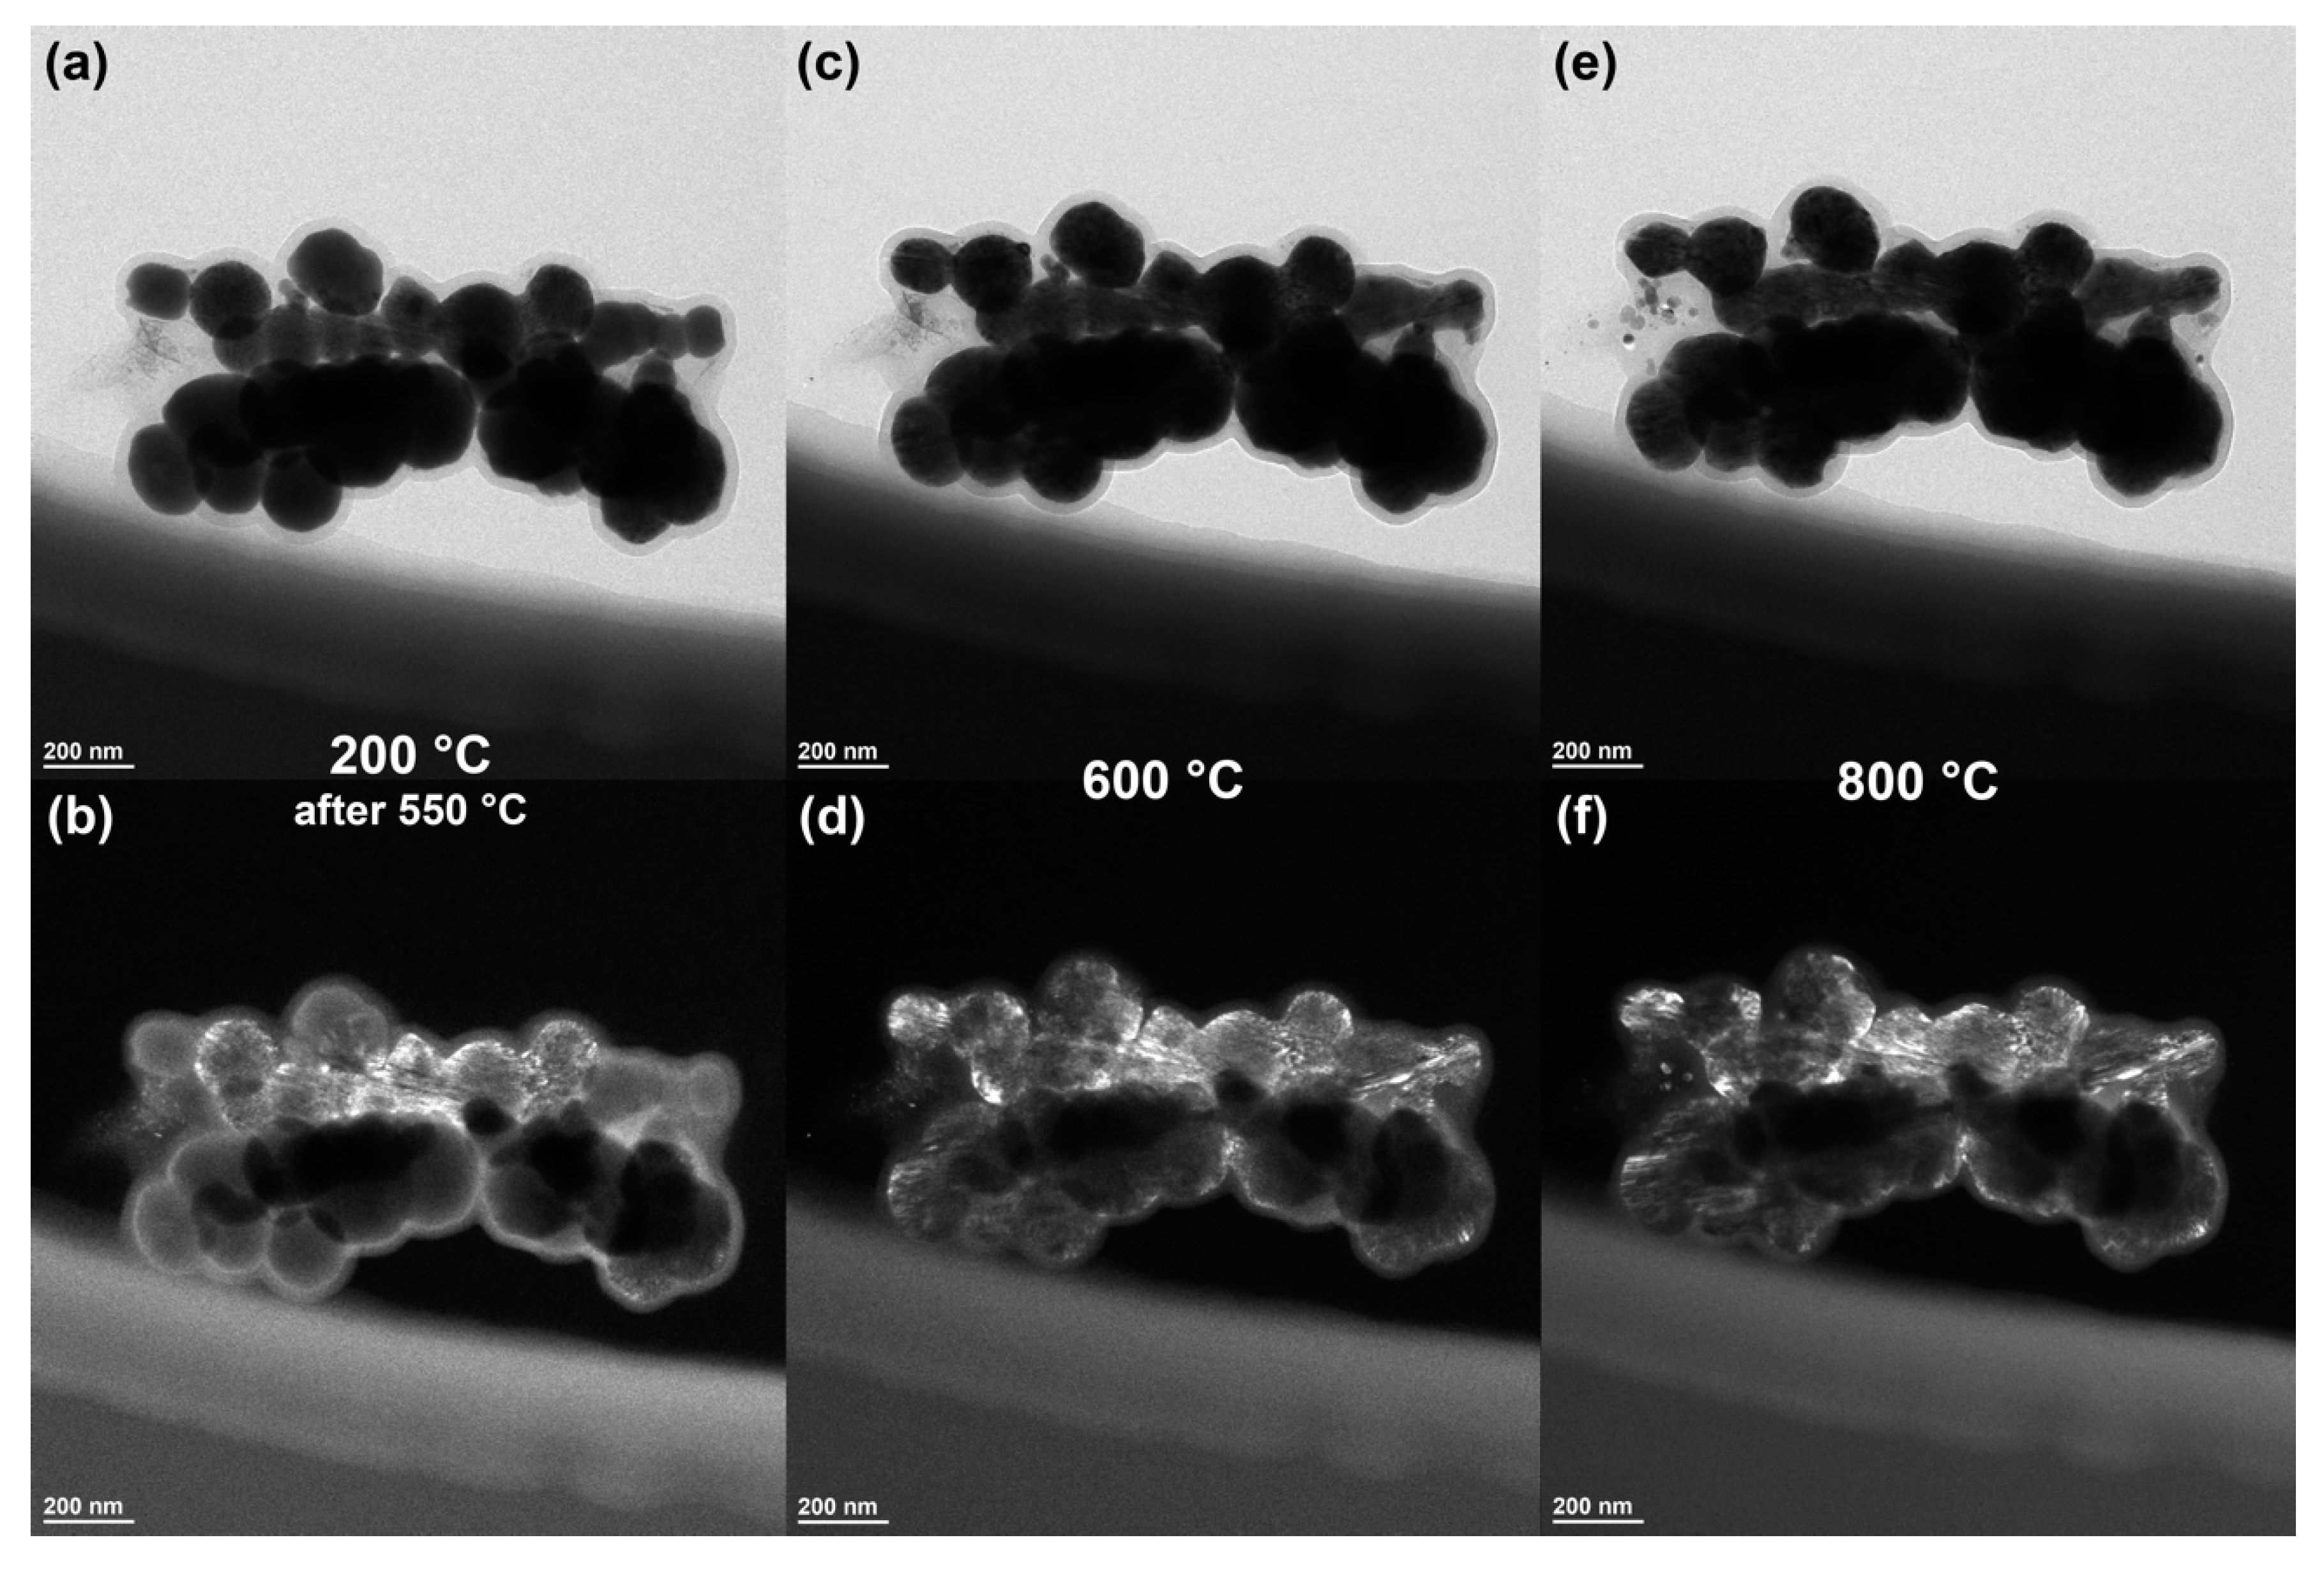
2.3. Conventional and In Situ Heating Transmission Electron Microscopy

In order to determine their shape and size distribution, the particles were drop casted after dispersion in ethanol which was then let to evaporate on a copper TEM grid covered with a thin amorphous carbon film acting as mechanical support (TedPella, Redding, CA, USA). Transmission electron microscopy (TEM) bright field (BF) imaging of the starting material was performed by using a FEI Tecnai Microscope (Eindhoven, The Netherlands) operating at an acceleration voltage of 120 kV, equipped with a thermionic LaB6 electron source, an objective twin lens and a Gatan (Pleasanton, CA, USA) Orius CCD Camera. The in situ TEM was performed by using a FEI Titan Microscope (Eindhoven, The Netherlands) operating at an acceleration voltage of 300 kV, equipped with an ultra-bright Schottky (X-FEG) electron source, a cryo-twin objective lens, and a Gatan 4k × 4k CCD Camera. The in situ TEM experiment was performed by using a MEMS (microelectromechanical system)-based ultra-low drift heating holder from DensSolution (Delft, The Netherlands), which mounts MEMS chips commercially provided by the same producer, and made by a silicon nitride film with a heating and a thermo-resistive-based spiral. Elliptical, thin, electron-transparent windows were fabricated between the two spirals and were used as regions of interest where the deposited particles could be heated and imaged. This kind of heating MEMS chip has a thermal accuracy higher than 0.1 °C; a lateral drift lower than 5 nm both after a rapid thermal increase of several hundreds of degrees and at constant temperature, the latter intended per hour of experiment; and a maximum heating temperature of 1200 °C. Before performing the in situ heating experiment, the sole sample holder (with no MEMS-based heating chip inserted) was cleaned for 15 min by a Gatan Solarus plasma cleaner, using a mix of O2 and H2 and with a power of 50 W. Then, a MEMS-based heating chip was inserted in the sample holder, and before the deposition of the sample, it was again plasma cleaned for further 2 min, with the same gas mix at a power of 20 W. The crystallization of the sample was monitored while heating the MEMS under selected area electron diffraction (SAED) geometry, after choosing and following a group of few tens of particles and imaging their electron diffraction pattern (EDP). In order to minimize the loss of focus due to the thermal bulging of the MEMS during heating, the starting temperature was chosen to be equal to 200 °C, where the z-height of the sample was adjusted keeping it in eucentric focus conditions. Then, the sample was first heated with a thermal ramp of 10 °C min−1 and the bulging-related loss of focus was counterbalanced by continuously adjusting it during all heating ramps. Once the EDP started showing diffraction spots caused by the particles’ crystallization (550 °C), the temperature was quickly lowered to 200 °C to temporarily stop the crystallization; then, a BF and the corresponding on-axis dark field (DF) images were taken, selecting an EDP area by using an objective diaphragm of 50 μm in size and switching the microscope from diffraction to imaging mode and vice versa. The temperature of the sample was quickly raised again to the starting crystallization temperature, and from there, constantly increased up to 800 °C, still with a rate of 10 °C min−1. At 600 and 800 °C, the temperature ramp was shortly paused in order to acquire an EDP, a BF, and the corresponding on-axis DF TEM image in isothermal conditions. The thermal ramp followed during the in situ TEM experiment is graphically summarized in Figure 1.

3. Results

The TEM image reported in Figure 2a shows that the as-prepared sample is almost entirely constituted of chain-like clusters of interconnected spheroidal particles with a broad size distribution, ranging from 80 to 200 nm. The distribution, generated by measuring the size of more than 100 nanoparticles, was fitted by a log-normal function (Figure 2b), which is well-known to provide good fits for most of small particles distributions [27,28], and which gave a particles log-normal mean size of 114 nm. The TEM image at higher magnification (Figure 2c) shows the spheroidal shape of the iron particles and also highlights the presence of a quite limited amount of precursor residuals (sheet structures) surrounding some among the particles. Their amorphous character is evidenced by the XRD patterns of the sample (Figure 2d), where the absence of sharp peaks together with the presence of a broad halo in the low-angle range clearly indicate that the freshly synthesized particles possess a glassy structure that is still maintained after two months of air exposure. As stated in the abstract, this indicates that the particles are stable against oxidation over a long time period.
DSC analysis under Ar was performed to study the thermal behavior of the sample. Figure 3a shows an exothermic peak centered at 465 °C, due to the crystallization of the amorphous iron particles into polycrystalline α-Fe, a phenomenon that occurs in similar fashion to what was described for analogous materials in [18,19,20,21]. The structural evolution of the sample with temperature is shown in Figure 3b, where the XRD patterns of the particles treated at different temperatures under N2 inert atmosphere are reported and compared with the one of the as-prepared sample at RT. The very sharp peaks corresponding to crystalline α-Fe Powder Diffraction File (PDF) card of Fe, numbers 6–696) in the XRD pattern of the sample treated at 500 °C confirm that the crystallization of the amorphous iron particles took place below that temperature, and is in accordance to what indicated by the DSC peak. Besides, at 500 °C few minor XRD peaks with lower intensity were observed and ascribed to the formation of iron borides similarly to those observed in [21] (PDF card of Fe2B, numbers 72–1301 and of Fe3.5B, numbers 34–1032). The appearance of iron borides allows speculating on the origin of the stability of the particles over time against their possible oxidation. Indeed, such a stability could be likely ascribed to the presence of a not negligible amorphous layer constituted mainly of boron coming from the material synthesis and covering the whole particle’s surface [20,21]. Upon heating, such a layer seems to crystallize as an alloy with some iron, quite similarly to what described by Yang et al. in [21]. Besides, upon further increase of the thermal treatment temperature, the width of all XRD peaks decreases due to the increase of the size of the α-Fe crystalline domains, as also pointed out by the Scherrer equation applied to the {100} reflection, whose estimate of the mean size of the coherently diffracting domains is reported in Table 1 [26]. It should be noted that above 600 °C this calculated mean size approaches the maximum size of the particles, until exceeding it at 800 °C (Table 1). This trend, culminating with the result obtained at 800 °C, indicates that some coalescence likely occurs among them at high temperature, finally giving rise to crystal domains with a larger size than that of the biggest starting iron particles. Moreover, in the samples treated at 600, 700, and 800 °C, the iron borides’ peaks disappear and the diffraction patterns are strongly dominated by the α-Fe peaks, suggesting that, likely, these phases are poorly stable and located on the particles surface. Finally, at 600, 700, and 800 °C, very weak peaks are also present, which might be respectively attributed to iron borate oxide and boric acid [29] (PDF card of H3BO3, numbers 30–0199 and of Fe2(BO3)O, numbers 79–2433) impurities, still possibly originating from the precursors’ surficial residues crystallizing at high temperature.
The crystallization was then monitored by an in situ TEM approach following the experimental procedure reported in Materials and Methods and whose thermal ramp is summarized in Figure 1. A group of particles to be imaged during the thermal ramp was chosen at RT. Figure 4a shows the TEM BF image of the selected group, while the inset displays the corresponding EDP obtained by selecting with a SAED diaphragm only the area containing that group. The absence of any spot in the diffraction pattern indicates that the particles are in a fully glassy state. Figure 4b shows the corresponding on-axis DF TEM image, taken as a reference for the particles in the amorphous state, and which, as expected, does not show the formation of any crystal domain. This DF image was recorded while using an objective diaphragm of 50 μm in size, placed in the zone of electron diffractogram where the most intense spots of α-Fe (corresponding to the {110} lattice set, with interplanar distance equal to 2.03 Å) could be expected. Due to both the size of the objective diaphragm and the closeness of the {110} lattice set position to the diffused ring corresponding to the amorphous halo observed in the XRD patterns, an unavoidable contribution of the electron scattered at low angles by both the particles and the silicon nitride substrate became part of the DF images in form of a uniform, slightly bright background. Then, the temperature was fast raised to 200 °C (in less than 1 min) and the sample was prepared for the temperature ramp: after checking that it was still in an amorphous state, it was placed again at the eucentric height in order to partially minimize its expected change in height caused by the MEMS bulging during the further thermal increase. Starting from that temperature, the sample was heated with a rate of 10 °C min−1 under the high vacuum conditions of the TEM column, and the MEMS bulging effect was compensated by only using the microscope focus. Figure 4c shows the BF TEM image recorded at 500 °C with the particles constituting the group still in the amorphous state, as indicated by the absence of any diffraction spot in the corresponding EDP reported in the panel’s inset. However, if compared with the image acquired at RT, a less dense, clearly visible, thick shell now surrounds the particles in the group, likely due to the thermal evolution of the surface residuals coming from the synthesis, and which could be where the iron borides form upon annealing, as detected by XRD and reported in Figure 3.
The evolution of the group of particles previously imaged in Figure 4 was further monitored upon thermal increase by looking at its EDP. As shown in Figure 5a, at 550 °C very weak spots appeared on the EDP and the temperature was immediately lowered to 200 °C to freeze the crystallization, which means that the maximum temperature reached during the thermal ramp was around 552 °C. However, once the crystallization started, it progressed very fast in the few seconds needed to lower the temperature of 350 °C and gave rise to a more advanced degree of crystallization, as denoted by the corresponding EDP evolution shown in Figure 5b and acquired at 200 °C. Figure 5e also shows the line profiles extracted by integrating the corresponding EDP on the main rings containing the α-Fe ED spots. These profiles were obtained after an integration and fitting procedure that also took into account the subtraction of the EDPs’ background. Since all EDPs contain few spots rather than full circles due to the limited number of particles included in the selected ED area, the intensity peaks resulting from the integration procedure can only be used to identify the positions of the spots in the reciprocal space, but no further quantitative information, nor intensity ratio could be extracted. That being said, it is worth noting that while the weak spots in the EDP shown in Figure 5a could be ascribed to the sole ED peak corresponding to the {110} lattice set of α-Fe, with interplanar distance equal to 2.03 Å, Figure 5b shows more intense spots. Their corresponding distances in the reciprocal space are ascribed to most of the expected reflections of α-Fe, namely, {110}, {111}, {211}, and {220}, where the {111} is present due to electron diffraction dynamical effects. This result, in combination with the absence of further peaks, confirmed the global indications provided by XRD; namely, the formation of the sole α-Fe, and the absence of other products of crystallization, such as other iron allotropes, iron oxides, and iron carbide. Since the EDP reported in Figure 5b was acquired right after the fast thermal decrease from 550 to 200 °C required to stop the iron crystallization, the presence of all the above-reported reflections means that once the crystallization of the glassy iron particles started, it took a very short time (a few seconds) for the just-nucleated crystal domains to grow in size before the temperature dropped. The same reflections indexed in the EDP acquired after the thermal decrease at 200 °C were found once again when the sample was heated to 600 °C (Figure 5c) and 800 °C (Figure 5d), with the latter even showing a very weak trace of the {200} reflection. Besides, it should be noted that the presence of different spots corresponding to the same interplanar distances (i.e., having the same distance from the center of the diffraction pattern in reciprocal space) in Figure 5b–d clearly indicates the formation of multiple α-Fe crystal domains with different spatial orientations.
Figure 6 displays both BF and the corresponding on-axis DF TEM images acquired selecting some ED spots belonging to the {100} reflection of α-Fe with an objective diaphragm of 50 μm in size. The images reported in Figure 6a,b were acquired while the sample was at 200 °C after the fast decrease from 550 °C, while Figure 6c,d report the BF/DF images recorded at a steady temperature of 600 °C, after quickly raising the temperature to 550 °C and increasing it from 550 up to 600 °C with a rate of 10 °C min−1. Finally, Figure 6e,f show the BF/DF images of the same particles at 800 °C, after a thermal increase from 600 up to 800 °C, again with the same rate of 10 °C min−1. The careful observations of both BF and DF images reported in Figure 6 allows making several considerations about the evolution of the particles upon the structural change of the iron phase. First, comparing their BF TEM images recorded at 500 °C (before the crystallization, Figure 4c) with those recorded at 550 °C makes clear that their overall shape did not change significantly after the crystallization had started, even though the DF images indicate that multiple crystal domains appeared in some smaller particles. Second, a much more marked evolution was observed going from 550 up to 600 °C in both BF and DF imaging: DF images show an apparent increase in number and size of the crystal domains, while the coalescence of the smaller particles in the upper right and central-left sides of their group could be clearly observed both in BF and DF. Concomitantly, the original chain-like shape of the group, which was still observable at 550 °C, was lost at 600 °C, and some long crystal domains became evident in the coalesced particles of the upper right side of the group. This evidence is in accordance with what was already indirectly observed by the XRD-based estimate of the particles mean size; i.e., the size of the crystal domains increases with temperature, even if this phenomenon here occurs at lower temperatures than those previously observed by XRD, and exceeds the size of the biggest original particles.
Finally, going up from 600 to 800 °C, the BF imaging of the heated particles indicates that some slight shape change occurred even in the bigger ones, while the corresponding DF imaging indicates a further but quite limited increase of the crystal domains’ size for the α-Fe, apparently less pronounced than what was observed through the XRD-based mean size estimate.

4. Discussion

In the previous chapter we described how the ex situ (by XRD, after DSC under inert pressure) and in situ (by selected area ED, BF, and DF TEM, under high vacuum conditions) crystallization of amorphous iron particles occurred. As some important differences were noticed when this phenomenon was investigated following the two above-mentioned approaches, some main points deserve to be discussed: (a) the difference in temperature corresponding to the start of the α-Fe crystallization, as measured by DSC under 105 Pa of Ar (465 °C), and under the high vacuum conditions of the TEM column (550 °C); (b) the increase in mean size of the nucleated crystal domains, which looked slower when the sample was heated and crystallized under the above-mentioned DSC/XRD pressure conditions, and faster when the crystallization was triggered upon the high vacuum ones by in situ TEM.
The starting temperature (465 °C) for the amorphous → crystal phase transition, as found by DSC and further confirmed by a posteriori XRD structural analysis, was similar to what was reported in [18,19,20,21]. Indeed, the materials were prepared and their transitions were thermally studied following routes analogous to the ones reported in the literature mentioned above. However, when the same crystallization phenomenon was monitored by in situ TEM, the external pressure decreased from the values typical of a DSC experiment (105 Pa) down to those usually expected inside a FEG-TEM microscope’s column (about 10−4 Pa). The influence of the external pressure on the crystallization of formerly amorphous materials has been previously studied, and some papers [30,31,32,33,34] showed that in amorphous alloys, an increase of the external pressure could retard the beginning of the crystallization, thereby increasing its starting temperature, which is the opposite to what we report here. This occurrence is normally ascribed to the pressure effect on the atomic diffusion during the crystallization. Indeed, the pressure should unavoidably limit the atomic diffusion, thereby retarding the beginning of crystallization. However, further reports (see, for instance, [34]) showed that the atomic diffusion cannot be always invoked as the dominant mechanism in the crystallization of an amorphous material, and finally, it was also shown that in some cases the pressure increase could bring a reduction of crystallization temperature [35], as occurred in our case. In more detail, the crystallization of an amorphous solid is usually regarded as a two steps process; namely, crystal domain nucleation and subsequent growth. Thus, when some crystal nuclei are formed in the surrounding amorphous matrix, a crystal-to-amorphous interface is also developed simultaneously. If, like in our case, a decrease in the external pressure gives rise to a marked increase in the crystallization temperature, it is evident that this hindrance could not be caused by atomic motion, which should be favored by a pressure reduction. Then, the origin of what occurred has to be searched in the thermodynamics ruling, the formation of the initial crystal nuclei, and their subsequent growth. Thus, from a thermodynamic point of view, the free energy variation related to the formation of a spherical, crystal nucleus in a surrounding amorphous matrix is given by the following equation [35]:
Δ G ( T , P ) = 1 6 π d 3 ( Δ G ν + E ) + π d 2 γ + P Δ V ,
where d is the crystal nucleus’ diameter, Δ G ν the free energy variation for forming the unit volume of crystal phase, E the elastic energy due to the change in volume related to the amorphous → crystal transformation, γ the energy associated to the crystalline/amorphous interface formation, and Δ V the actual volume variation when a crystal nucleus is created from the amorphous state. The latter term is the only one related to the applied pressure P during the phase transformation. In other words, Δ G ( T , P ) represents the energy barrier to overcome by heating the sample for the crystal nucleation to take place. In fact, at the beginning of nucleation, the first two terms of Equation (1) are positive, while the third one could be either positive or negative depending on the fact that the crystallization of a given mass of amorphous material into a crystal nucleus determines an increase or decrease in volume. Even though measuring such a volume change was not directly possible for our sample, from the experimentally observed increase in crystallization temperature with a pressure diminution, it is a strong indication that this change had to be negative. Indeed, the negative contribution to the free energy change given by the negative Δ V is modulated by the p value that multiplies it: the higher the pressure value, the higher the modulus of the negative term, and, consequently, the lower the overall Δ G ( T , P ) term that must be thermally overcome to start the formation of crystal nuclei. Since the difference in pressure between the TEM vacuum conditions and the ambient pressure where the DSC experiment was performed was about nine orders of magnitude, this likely small negative change in volume could give rise to a dramatic lowering of the free energy required for the formation of small crystal nuclei, and, as a consequence, of the temperature needed to start the crystallization. Once these small nuclei were formed, the atomic motion promotes their growth. On the other hand, in this case the pressure is expected to play an opposite role, since it reduces the atomic motion, and consequently, the thermally induced growth of the crystal nuclei. This is in good agreement with what we observed by comparing the growth of crystal domains after a thermal increase at 105 Pa (in the DSC/XRD experiments) and at around 10−4 Pa (in the TEM column). Indeed, we noticed that for the most part, the crystal domains’ growth observed in the TEM occurred in the interval between 550 and 600 °C; further heating up to 800 °C seems to have a rather limited effect in promoting an additional growth of the domains. Conversely, when the thermal increase was promoted at ambient pressure during the DSC experiment, the XRD-based mean size analysis reported in Table 1 clearly indicates that the higher pressure retarded the growth of crystal domains, which proceeded continuously while the temperature increased. With regard to this, the difference observed between the thermally-increasing size of the crystal domains, as indirectly measured by XRD and directly by DF TEM imaging, must also be noted. In fact, the maximum size reached by the α-Fe crystal domains, as determined by XRD, looks much higher than the one reached during the in situ heating experiment. However, differently from what occurs in an XRD experiment, the TEM requires a thin sample (i.e., its thickness must be sufficiently low to permit the passage of electrons through the volume) to provide any kind of imaging (BF, DF, and EDP). In the present case the scattering due to atomic number is basically constant, as the sample is constituted by only iron, but the maximum size of the iron particles is close to 200 nm. This means that the electron beam might be required to pass through objects several hundreds of nanometers thick in case of superposition or thermally-driven coalescence of iron particles. Multiple scattering and absorption become increasingly likely for these thickness values, thereby hindering the analytical capability of TEM. That is apparent when looking at the largest particles shown in Figure 4 and Figure 6, where no crystal domain can be detected. On the other hand, thickness limitations do not affect the XRD, which can successfully account for bigger particles during size measurement. Finally, similarly to what reported in our previous work [22] and in [36,37], an electron beam contribution to the crystallization cannot be neglected a priori, since in principle it could further promote the fast growth of crystal domains once their nucleation kicks off. Indeed, the electron beam energy is well-known to promote atomic displacements by knock-on effect; i.e., a further support to the atomic motion needed for the crystal domains’ growth. However, since the contribution of this effect is mainly ascribed to crystallization processes triggered by atomic motion, which does not seem to be the present case, it will be meaningful investigating the actual consequence of an electron beam energy change on the crystallization phenomenon we explained in the present work.
Thus, the results described here represent a first step in the study of the crystallization mechanism of amorphous iron particles. Additional experiments will have to be performed to confirm and further clarify the outcomes shown here. Thus, extra in situ-gas heating TEM studies of the particles crystallization under diverse pressure conditions of inert gases, should provide more reliable information on the volume change reported in Equation (1), which is supposed to act as main factor in controlling the increase of the starting temperature of crystallization observed in the presence of a pressure diminution. As well, changing the electron beam energy, while keeping fixed the in situ pressure conditions of the heating experiment, should allow one to determine its possible influence on the overall development of α-Fe crystals’ domains.

5. Conclusions

To the best of our knowledge, this is the first work devoted to the study of amorphous iron particles’ crystallization under diverse pressure conditions and by using both a DSC/XRD-based and an in situ TEM approach. We reported here that the pressure played an essential role in determining both the starting crystallization temperature and the following growth of multiple crystal domains of α-Fe in the original amorphous iron particles. In particular, the most relevant result here described lies in the apparent and marked increase of kick-off temperature of crystal nucleation as a consequence of a very pronounced reduction of the pressure. However, once the small crystal domains’ nucleation occurred, the pressure seemed to act as a hindering factor for the growth of the crystal domains by limiting the atomic motion. Finally, the exact chemical nature of the shell surrounding the particles and protecting them from oxidation, which according to literature could likely be a boron-based surficial layer, deserves future further study by dedicated, spatially resolved compositional techniques. Furthermore, the actual role played by the electron beam in both nucleation and growth of the α-Fe crystal domains will be studied in-depth by means of further, appropriate in situ TEM experiments.

Author Contributions

All in situ electron microscopy investigations were performed by A.F. and A.C. D.L. synthesized the nanomaterials, and performed both conventional TEM imaging, and DSC and XRD measurements. A.F. conceptualized the work and wrote the original draft of the paper, which was further edited and finalized together with D.L. and A.C. All authors have read and agreed to the published version of the manuscript.

Funding

This research was supported by KAUST Baseline funding to Andrea Falqui.

Conflicts of Interest

The authors declare no conflict of interest.

References

  1. Klement, W.; Willens, R.H.; Duwez, P.O.L. Non-crystalline structure in solidified gold-silicon alloys. Nature 1960, 187, 869–870. [Google Scholar] [CrossRef]
  2. Inoue, A.; Zhang, T.; Zhang, W.; Takeuchi, A. Bulk Nd-Fe-Al amorphous alloys with hard magnetic properties. Mater. Trans. JIM 1996, 37, 99–108. [Google Scholar] [CrossRef] [Green Version]
  3. Tiberto, P.; Baricco, M.; Olivetti, E.; Piccin, R. Magnetic properties of bulk metallic glasses. Adv. Eng. Mater. 2007, 7, 468–474. [Google Scholar] [CrossRef]
  4. Buschow, K.H.J.; Beekmans, N.M. Thermal stability and electronic properties of amorphous Zr-Co and Zr-Ni alloys. Phys. Rev. B 1979, 19, 3843. [Google Scholar] [CrossRef]
  5. Qin, C.L.; Zhang, W.; Asami, K.; Kimura, H.; Wang, X.M.; Inoue, A. A novel Cu-based BMG composite with high corrosion resistance and excellent mechanical properties. Acta Mater. 2006, 54, 3713–3719. [Google Scholar] [CrossRef]
  6. Peker, A.; Johnson, W.L. A highly processable metallic glass-Zr41.2Ti13.8Cu12.5Ni10.0Be22.5. Appl. Phys. Lett. 1993, 63, 2342–2344. [Google Scholar] [CrossRef] [Green Version]
  7. Shin, J.; Waheed, A.; Agapiou, K.; Winkenwerder, W.A.; Kim, H.-W.; Jones, R.A.; Hwang, G.S.; Ekerdt, J.G. Growth of ultrathin films of amorphous ruthenium−phosphorus alloys using a single source CVD precursor. J. Am. Chem. Soc. 2006, 128, 16510–16511. [Google Scholar] [CrossRef]
  8. Rehn, L.E.; Okamoto, P.R.; Pearson, J.; Bhadra, R.; Grimsditch, M. Solid-state amorphization of Zr3Al: Evidence of an elastic instability and first-order phase transformation. Phys. Rev. Lett. 1987, 59, 2987–2990. [Google Scholar] [CrossRef] [Green Version]
  9. Limthongkul, P.; Jang, Y.-I.; Dudney, N.J.; Chiang, Y.-M. Electrochemically-driven solid-state amorphization in lithium-silicon alloys and implications for lithium storage. Acta Mater. 2003, 51, 1103–1113. [Google Scholar] [CrossRef]
  10. Grant, W.A. Amorphous metals and ion implantation. J. Vac. Sci. Technol. 1978, 15, 1644–1649. [Google Scholar] [CrossRef]
  11. Suryanarayana, C. Mechanical alloying and milling. Progr. Mater. Sci. 2001, 46, 1–184. [Google Scholar] [CrossRef]
  12. Jiles, D.C. Recent advances and future directions in magnetic materials. Acta Mater. 2003, 51, 5907–5939. [Google Scholar] [CrossRef]
  13. Huber, D.L. Synthesis, properties, and application of iron nanoparticles. Small 2005, 1, 482–501. [Google Scholar] [CrossRef] [PubMed]
  14. Zhang, J.H.; Chang, C.T.; Wang, A.; Shen, B.L. Development of quaternary Fe-based bulk metallic glasses with high saturation magnetization above 1.6 T. J. Non Cryst. Solids 2012, 358, 1443–1446. [Google Scholar] [CrossRef]
  15. Kong, F.L.; Chang, C.T.; Inoue, A.; Shalaan, E.; Al-Marzouki, F. Fe-based amorphous soft magnetic alloys with high saturation magnetization and good bending ductility. J. Alloy. Compd. 2014, 615, 163–166. [Google Scholar] [CrossRef]
  16. Mchenry, M.E.; Laughlin, D.E. Nano-scale materials development for future magnetic applications. Acta Mater. 2000, 48, 223–238. [Google Scholar] [CrossRef]
  17. Fang, J.X.; Vainio, U.; Puff, W.; Würschum, R.; Wang, X.L.; Wang, D.; Ghafari, M.; Jiang, F.; Sun, J.; Hahn, H.; et al. Atomic structure and structural stability of Sc75Fe25 nanoglasses. Nano Lett. 2012, 12, 458–463. [Google Scholar] [CrossRef]
  18. Grinstaff, M.W.; Cichowlas, A.A.; Choe, S.-B.; Suslick, K.S. Effect of cavitation on amorphous metal synthesis. Ultrasonics 1992, 30, 168–172. [Google Scholar] [CrossRef]
  19. Grinstaff, M.W.; Salamon, M.B.; Suslick, K.S. Magnetic properties of amorphous iron. Phys. Rev. B 1993, 48, 269–273. [Google Scholar] [CrossRef]
  20. Yang, B.; Yang, X.Y.; Li, X.P.; Cao, Y.; Yu, R.H. Surface modification and enhanced performances of chemically synthesized nanosized amorphous Fe particles. J. Supercond. Nov. Magn. 2015, 28, 2177–2182. [Google Scholar] [CrossRef]
  21. Yang, X.Y.; Yang, B.; Li, X.P.; Cao, Y.; Yu, R.H. Structural-controlled chemical synthesis of nanosized amorphous Fe particles and their improved performances. J. Alloy. Compd. 2015, 651, 551–556. [Google Scholar] [CrossRef]
  22. Casu, A.; Lamberti, A.; Stassi, S.; Falqui, A. Crystallization of TiO2 nanotubes by in situ heating TEM. Nanomaterials 2018, 8, 40. [Google Scholar] [CrossRef] [PubMed] [Green Version]
  23. Stassi, S.; Lamberti, A.; Roppolo, I.; Casu, A.; Bianco, S.; Scaiola, D.; Falqui, A.; Pirri, C.F.; Ricciardi, C. Evolution of nanomechanical properties and crystallinity of individual titanium dioxide nanotube resonators. Nanotechnology 2017, 29, 085702. [Google Scholar] [CrossRef] [PubMed] [Green Version]
  24. Wu, C.; Yin, P.; Zhu, X.; OuYang, C.O.; Xie, Y. Synthesis of hematite (α-Fe2O3) nanorods: Diameter-size and shape effects on their applications in magnetism, lithium ion battery, and gas sensors. J. Phys. Chem. B 2006, 110, 17806–17812. [Google Scholar] [CrossRef]
  25. Chen, M.; Tang, B.; Nikles, D.E. Preparation of iron nanoparticles by reduction of acicular β-FeOOH particles. IEEE Trans. Magn. 1998, 34, 1141–1143. [Google Scholar] [CrossRef]
  26. Jagodzinski, H. HP Klug und LE Alexander: X-ray Diffraction Procedures for Polycrystalline and Amorphous Materials, 2. Auflage. John Wiley & Sons, New York-Sydney-Toronto 1974, 966 Seiten, Preis:£ 18.55. Ber. Bunsenges. Phys. Chem. 1975, 79, 553. [Google Scholar]
  27. Granqvist, C.G.; Buhrman, R.A. Ultrafine metal particles. J. Appl. Phys. 1976, 47, 2200–2219. [Google Scholar] [CrossRef]
  28. Blanco-Mantecón, M.; O’Grady, K. Grain size and blocking distributions in fine particle iron oxide nanoparticles. J. Magn. Magn. Mater. 1999, 203, 50–53. [Google Scholar] [CrossRef]
  29. Zhang, X.F.; Dong, X.L.; Huang, H.; Lv, B.; Lei, J.P.; Ma, S.; Liu, W.; Zhang, Z.D. Synthesis, structure and magnetic properties of B2O3/H3BO3-coated Fe nanocapsules. Mat. Sci. Eng. B 2007, 143, 76–80. [Google Scholar] [CrossRef]
  30. Wang, W.K.; Iwasaki, H.; Fukamichi, K. Effect of high pressure on the crystallization of an amorphous Fe83B17 alloy. J. Mater. Sci. 1980, 15, 2701–2708. [Google Scholar] [CrossRef]
  31. Imura, T.; Suwa, M.; Fujii, K. Effects of ultrahigh pressure on the crystallization temperature of Ni80P20 amorphous alloys. Mater. Sci. Eng. 1988, 97, 247–251. [Google Scholar] [CrossRef]
  32. Cedergren, M.; Bäckström, G. Crystallization temperature of amorphous Fe80B20 under pressure. J. Non-Cryst. Solids. 1978, 30, 69–76. [Google Scholar] [CrossRef]
  33. Wang, W.K.; Iwasaki, H.; Suryanarayana, C.; Masumoto, T.; Toyota, N.; Fukase, T.; Kogiku, F. Crystallization characteristics of an amorphous Nb81Si19 alloy under high pressure and formation of the A15 phase. J. Mater. Sci. 1982, 17, 1523–1532. [Google Scholar] [CrossRef]
  34. Ye, F.; Lu, K. Pressure effect on polymorphous crystallization kinetics in amorphous selenium. Acta Mater. 1998, 46, 5965–5971. [Google Scholar] [CrossRef] [Green Version]
  35. Ye, F.; Lu, K. Pressure effect on crystallization kinetics of an Al-La-Ni amorphous alloy. Acta Mater. 1999, 47, 2449–2454. [Google Scholar] [CrossRef]
  36. Zhang, T.; Song, Z.; Sun, M.; Liu, B.; Feng, S.; Chen, B. Investigation of electron beam induced phase change in Si2Sb2Te5 material. Appl. Phys. A 2008, 90, 451–455. [Google Scholar] [CrossRef]
  37. Kooi, B.J.; Groot, W.M.G.; De Hosson, J.T.M. In situ transmission electron microscopy study of the crystallization of Ge2Sb2Te5. J. Appl. Phys. 2004, 95, 451–455. [Google Scholar] [CrossRef] [Green Version]
Figure 1. Thermal ramp followed during the in situ heating TEM experiment. Both starting crystallization temperature (TC), and the ensuing temperatures where electron diffraction pattern (EDP), bright field (BF), and the corresponding dark field (DF) were acquired, are indicated by arrows. More details are given in the results section.
Crystals 10 00041 g001
Figure 2. Amorphous iron particles: (a) overall BF TEM images; (b) the corresponding size distribution, fitted with a log-normal function; (c) magnified BF TEM image of the zone surrounded by a rectangle in panel (a); (d) powder XRD patterns of the same sample, acquired both just after the sample synthesis (fresh sample, lower pattern) and after two months in air.
Crystals 10 00041 g002
Figure 3. (a) DSC measurement of the as-prepared amorphous iron particles and (b) their XRD patterns together with the same sample after thermal treatment at 500, 600, 700, and 800 °C, respectively.
Crystals 10 00041 g003
Figure 4. Group of amorphous iron particles after deposition on the heating MEMS-based sample holder: (a) BF TEM image of the particle group at RT, with the corresponding EDP (inset); (b) DF TEM reference image recorded at RT of the same amorphous particles imaged in (a); the EDP zone selected to form the DF image is centered around the expected position of the most intense ED peak of α-Fe, corresponding to the {110} lattice set, with interplanar distance equal to 2.03 Å; (c) BF TEM image of the particle group at 500 °C, with the corresponding EDP (inset).
Crystals 10 00041 g004
Figure 5. Selected area EDP of the same group of amorphous iron particles imaged in Figure 4: (a) EDP recorded right after the first trace of crystallization appeared, at 550 °C; (b) EDP recorded at 200 °C, a few seconds after the crystallization observed in panel (a) had started; (c) EDP recorded at a steady temperature of 600 °C, after quickly raising the temperature from 200 to 550 °C, and from 550 up to 600 °C with a rate of 10 °C min−1; (d) EDP recorded at a steady temperature of 800 °C, after a thermal increase from 600 up to 800 °C with a rate of 10 °C min−1; (e) line profiles extracted by the integration of the EDP of panels (ad) performed on the main rings containing the α-Fe ED spots. Reflections of α-Fe corresponding to the peaks are indicated by dashed lines for better clarity.
Crystals 10 00041 g005
Figure 6. BF and DF TEM images of the same group of amorphous iron particles imaged in Figure 4, acquired: (a,b) at 200 °C after a quick decrease from 550 °C; (c,d) at a steady temperature of 600 °C, after quickly raising the temperature to 550 °C, and from 550 up to 600 °C with a rate of 10 °C min−1; (e,f) at a steady temperature of 800 °C, after a thermal increase from 600 up to 800 °C with the same rate of 10 °C min−1.
Crystals 10 00041 g006
Table 1. Evolution of the mean α-Fe crystal domain size, as determined by applying the Scherrer equation [26] to the {100} peak of α-Fe.
Sample Temperature<d>XRD (nm)
500 °C55 ± 1
600 °C110 ± 4
700 °C 180 ± 14
800 °C320 ± 22

