De novo Phasing Xenons Observed in the Frog Ependymin-Related Protein

School of Systems Biomedical Science, Soongsil University, Seoul 06978, Korea
Crystals 2020, 10(1), 32; https://doi.org/10.3390/cryst10010032
Submission received: 16 December 2019
/
Revised: 5 January 2020
/
Accepted: 8 January 2020
/
Published: 10 January 2020
(This article belongs to the Section Biomolecular Crystals)
Abstract
:Pressurizing Xe or Kr noble gas into the protein crystal for de novo phasing has been one method of choice when the introduction of other heavy-atom compounds fails. One reason is because, unlike other heavy-atom compounds, their immobilized sites are mostly hydrophobic cavities. Previously, the structure of frog ependymin-related protein (EPDR) has been determined using a single wavelength anomalous diffraction (SAD) on a Xe-pressurized crystal. Since no report on the four Xe binding sites has been made, these sites are analyzed in this study. Of the four Xe atoms, three are found along the hydrophobic interfaces created by the two crystallographic symmetry mates of EPDR. One final Xe atom occupies a Ca2+-binding site of the native protein entirely stabilized by the polar atoms of the surrounding EDPR residues. We believe that this atypical Xe location is very unique and merits further study.
1. Introduction
Pressurizing noble gas elements of Xe and Kr has been one method during de novo phasing in order to introduce a heavy-atom into the protein crystal. The sites of Xe or Kr are unique compared to other heavy-atom compounds in that both atoms occupy hydrophobic cavities via weak-energy van der Waals forces [1]. The Kr has some merit over Xe because the Kr K-edge (14.3 keV, 0.87 Å) is easily accessible on most synchrotron beamlines, enabling one to perform a MAD experiment on a single crystal [2]. Although the Xe K-edge (34.6 keV, 0.36 Å) is generally not accessible in many synchrotron beamlines, experiments using ultra-high energy X-ray targeting Xe for MAD experiments have been performed [3]. Moreover, using a softer L1-absorption edge of Xe and optimizing the f″ value at ~2.0 Å as a single-wavelength approach has been proven successful [4,5].
Recently, two groups including ours have reported the crystal structures of the ependymin-related protein 1 (EPDR1) of human, mouse and frog [6,7]. Ependymin was first discovered in the brain extracellular fluid (ECF) of teleost fish [8], but the orthologous EPDRs are known to exist broadly from protozoa to humans [9]. Although fish ependymin does function during the long-term memory and neuronal regeneration, the role of EPDR in other organisms still remains unknown. While the fish ependymin is secreted into ECF, the EPDRs with a mannose 6-phosphate (M6P) modification in human beings and rodents are found within the lysosome of various tissues [10,11]. The monomeric EPDR1 is made up of two stacking anti-parallel β-sheets with the curvature in one of the layers resulting in creating a deep ~6,000 Å3 hydrophobic pocket [6,7]. This monomeric subunit further associates into a dimer. The EPDR1-fold is very similar to the folds of the bacterial VioE and LolA/LolB which use the similar hydrophobic pocket for their respective function as a hydrophobic substrate binding enzyme and a lipoprotein carrier [12,13,14].
In the human EPDR1 structure, an extended PEG molecule likely from the crystallization condition was observed in this hydrophobic pocket [6]. EPDR1 was also suggested to bind to fatty acids presumably via this pocket [7]. Another interesting feature of EPDR1 was a binding site for a metal which was modeled as a bound Ca2+ [7].
In the previous structural work of frog, mouse and human EPDR1 [7], a single wavelength anomalous diffraction (SAD) was performed on a Xe-pressurized crystal of frog EPDR1 during the phase determination step. Since no analysis of the Xe-bound sites has been performed, we analyze the four bound Xe atoms and their surrounding environment in the frog EPDR1 structure in this study.
2. Materials and Methods
The detailed plasmid cloning of frog (Xenopus tropicalis) EPDR1 (residues 38–220) in pAcGP67A, its protein expression in the Spodoptera frugiperda (SF9) insect cell-line, and further purification steps, have been reported elsewhere [7,15]. In addition, the crystallization, X-ray data collection and structure determination steps of frog EPDR1 have been reported [7]. Briefly for phase determination, a single crystal of frog EPDR1 was pressurized with 1 MPa Xe gas and equilibrated for 5 min at room temperature. A 2.9 Å resolution single wavelength anomalous diffraction (SAD) data at λ = 1.54 Å was collected on this Xe-derivatized crystal at the beamline 7A of a Pohang Light Source (Pohang, Korea), and the data was processed and scaled using HKL2000 [16] (Table 1). The anomalously scaled data were analyzed in PHENIX [17], and the Xe sites were located for the initial de novo experimental phasing. The density-modified map from PHENIX generated a reasonable model. This PHENIX-generated model was used on a higher 2.0 Å resolution diffraction data collected on a native Xe-free frog EPDR1 crystal, and the final refined structure of the 2.0 Å Xe-free frog EPDR1 (PDB code 6JL9) was obtained and reported [7].
In this study, the structure of this 2.0 Å Xe-free frog EPDR1 (PDB code 6JL9) was used as an initial model to refine the 2.9 Å resolution data of the Xe-derivatized crystal. Manual model inspection and corrections into the structure were performed using COOT [18], where four Xe atoms were concluded to be found in the structure. Final refinement on the Xe-containing frog EPDR1 structure was performed using REFMAC5 [19] with no data cutoff. The structure was analyzed in COOT and PyMol (Schrödinger, New York City, NY, USA), and structural figures rendered on PyMol. Occupancies for Xe atoms were determined by changing the occupancy values during refinement until no negative Fo-Fc electron density map contoured at 3 σ appeared any more in COOT.
3. Results and Discussion
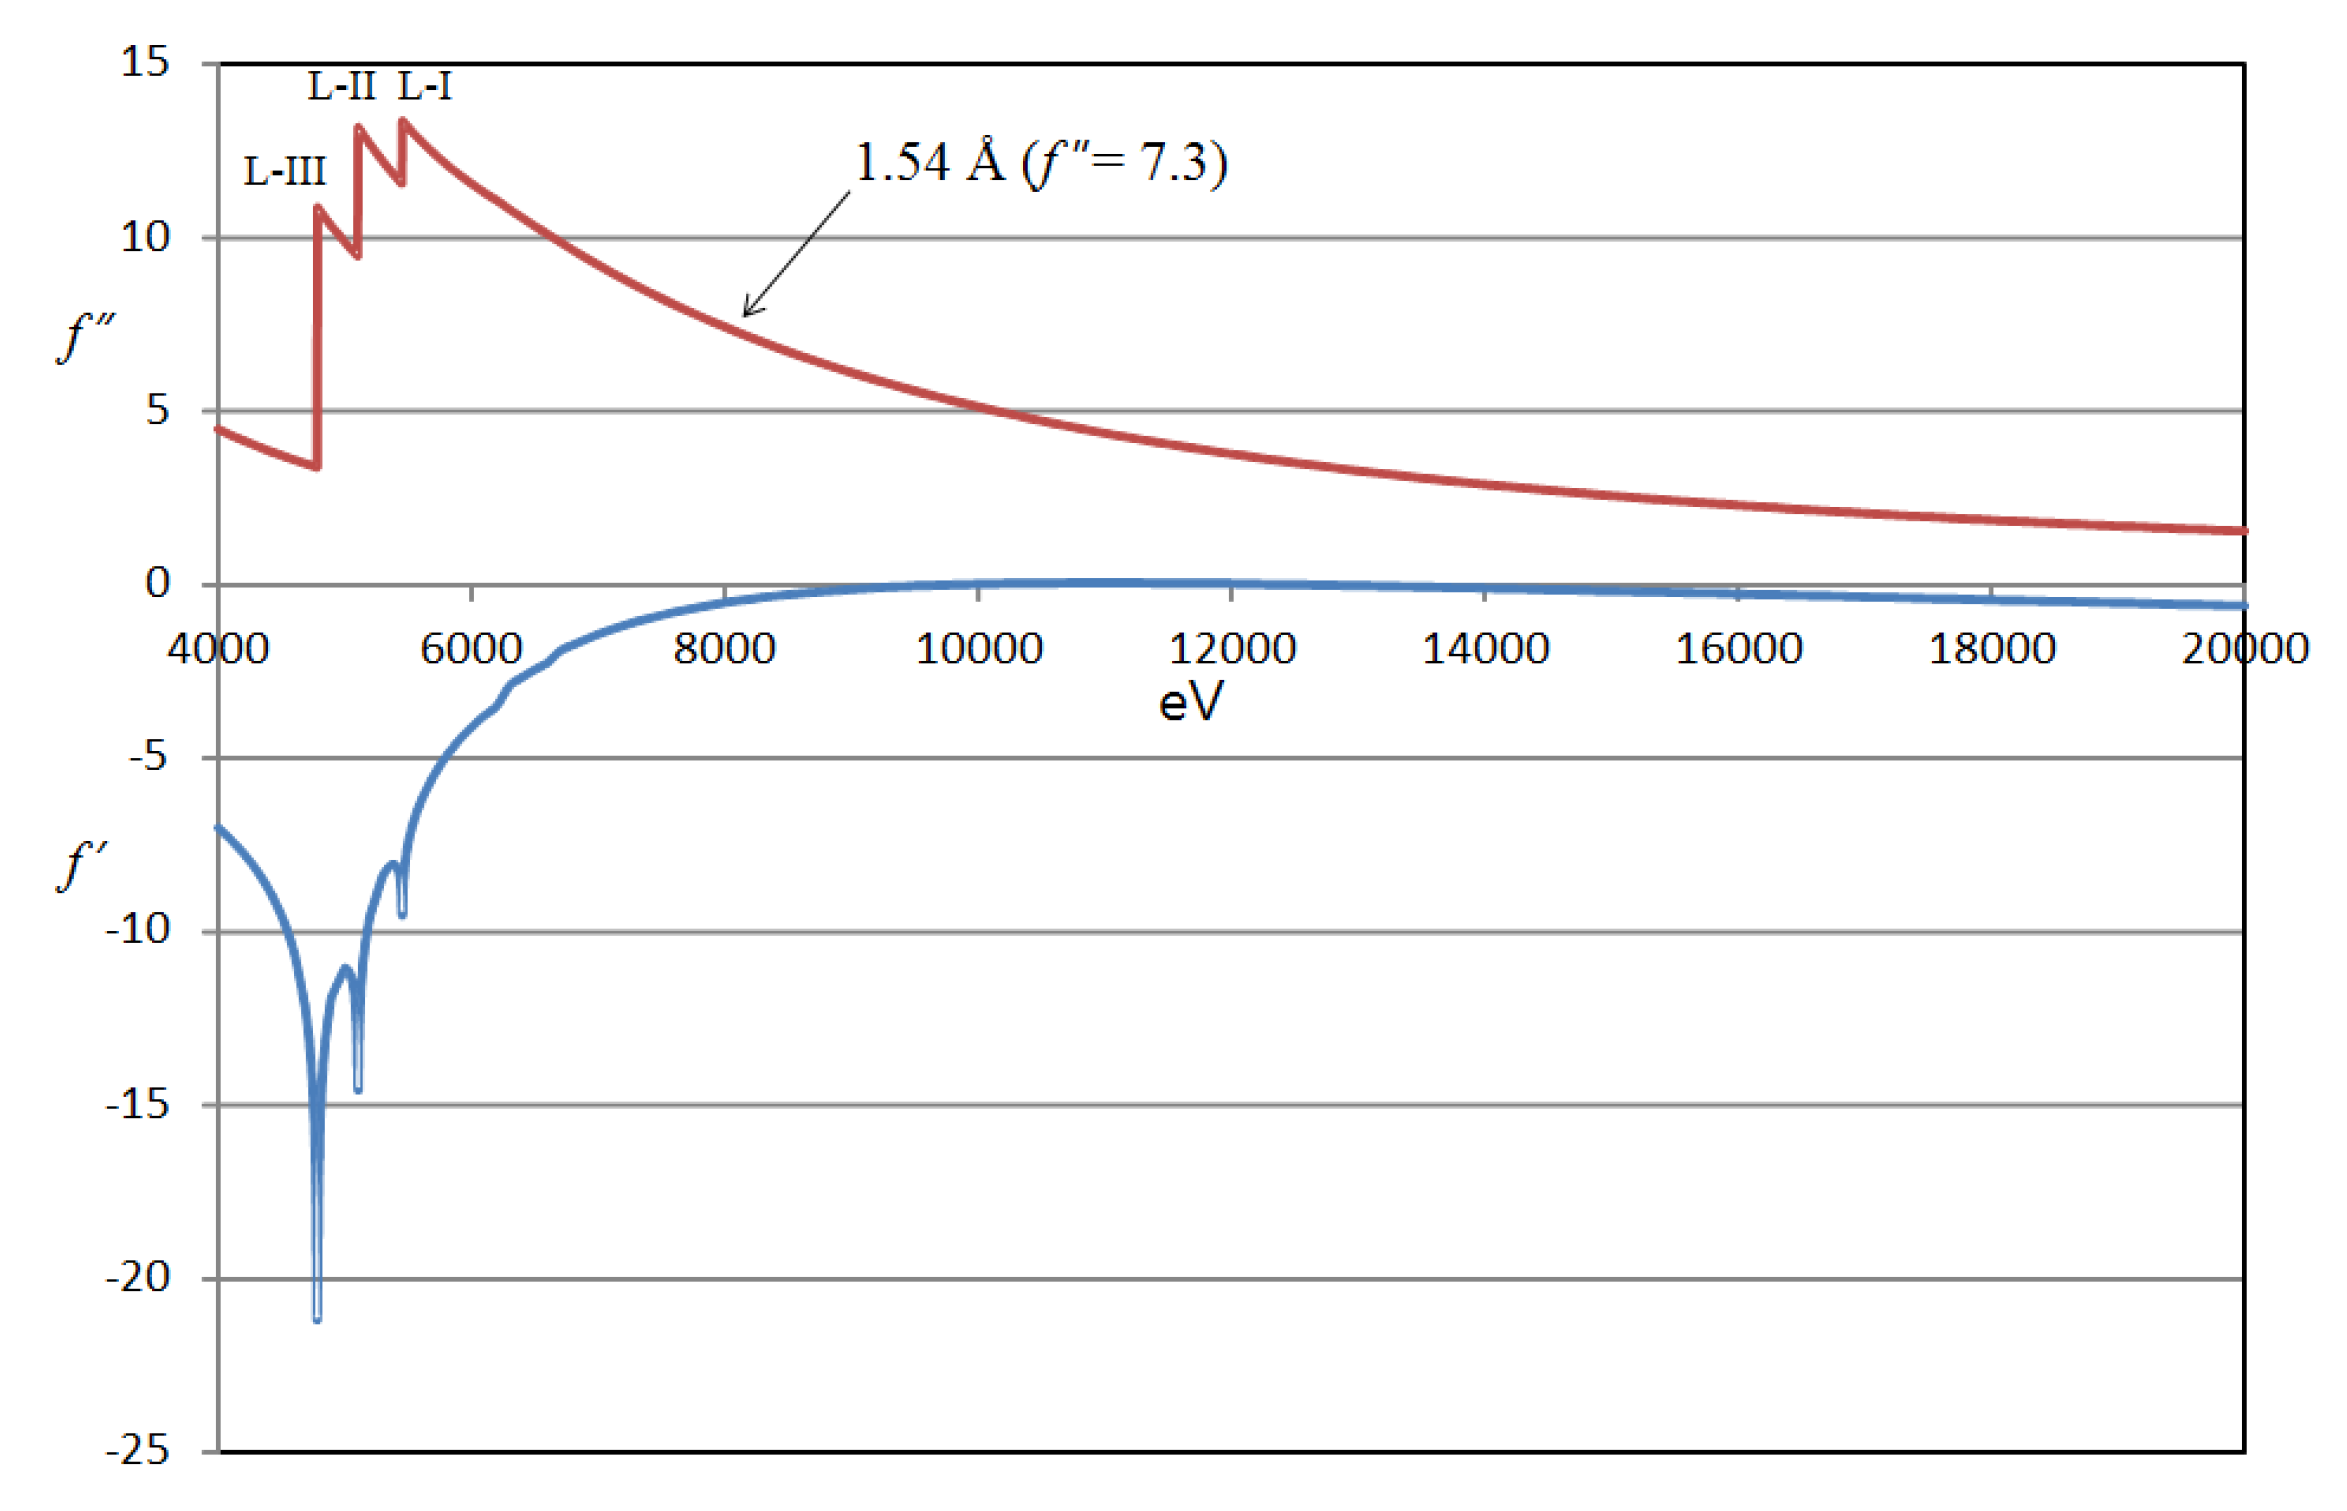
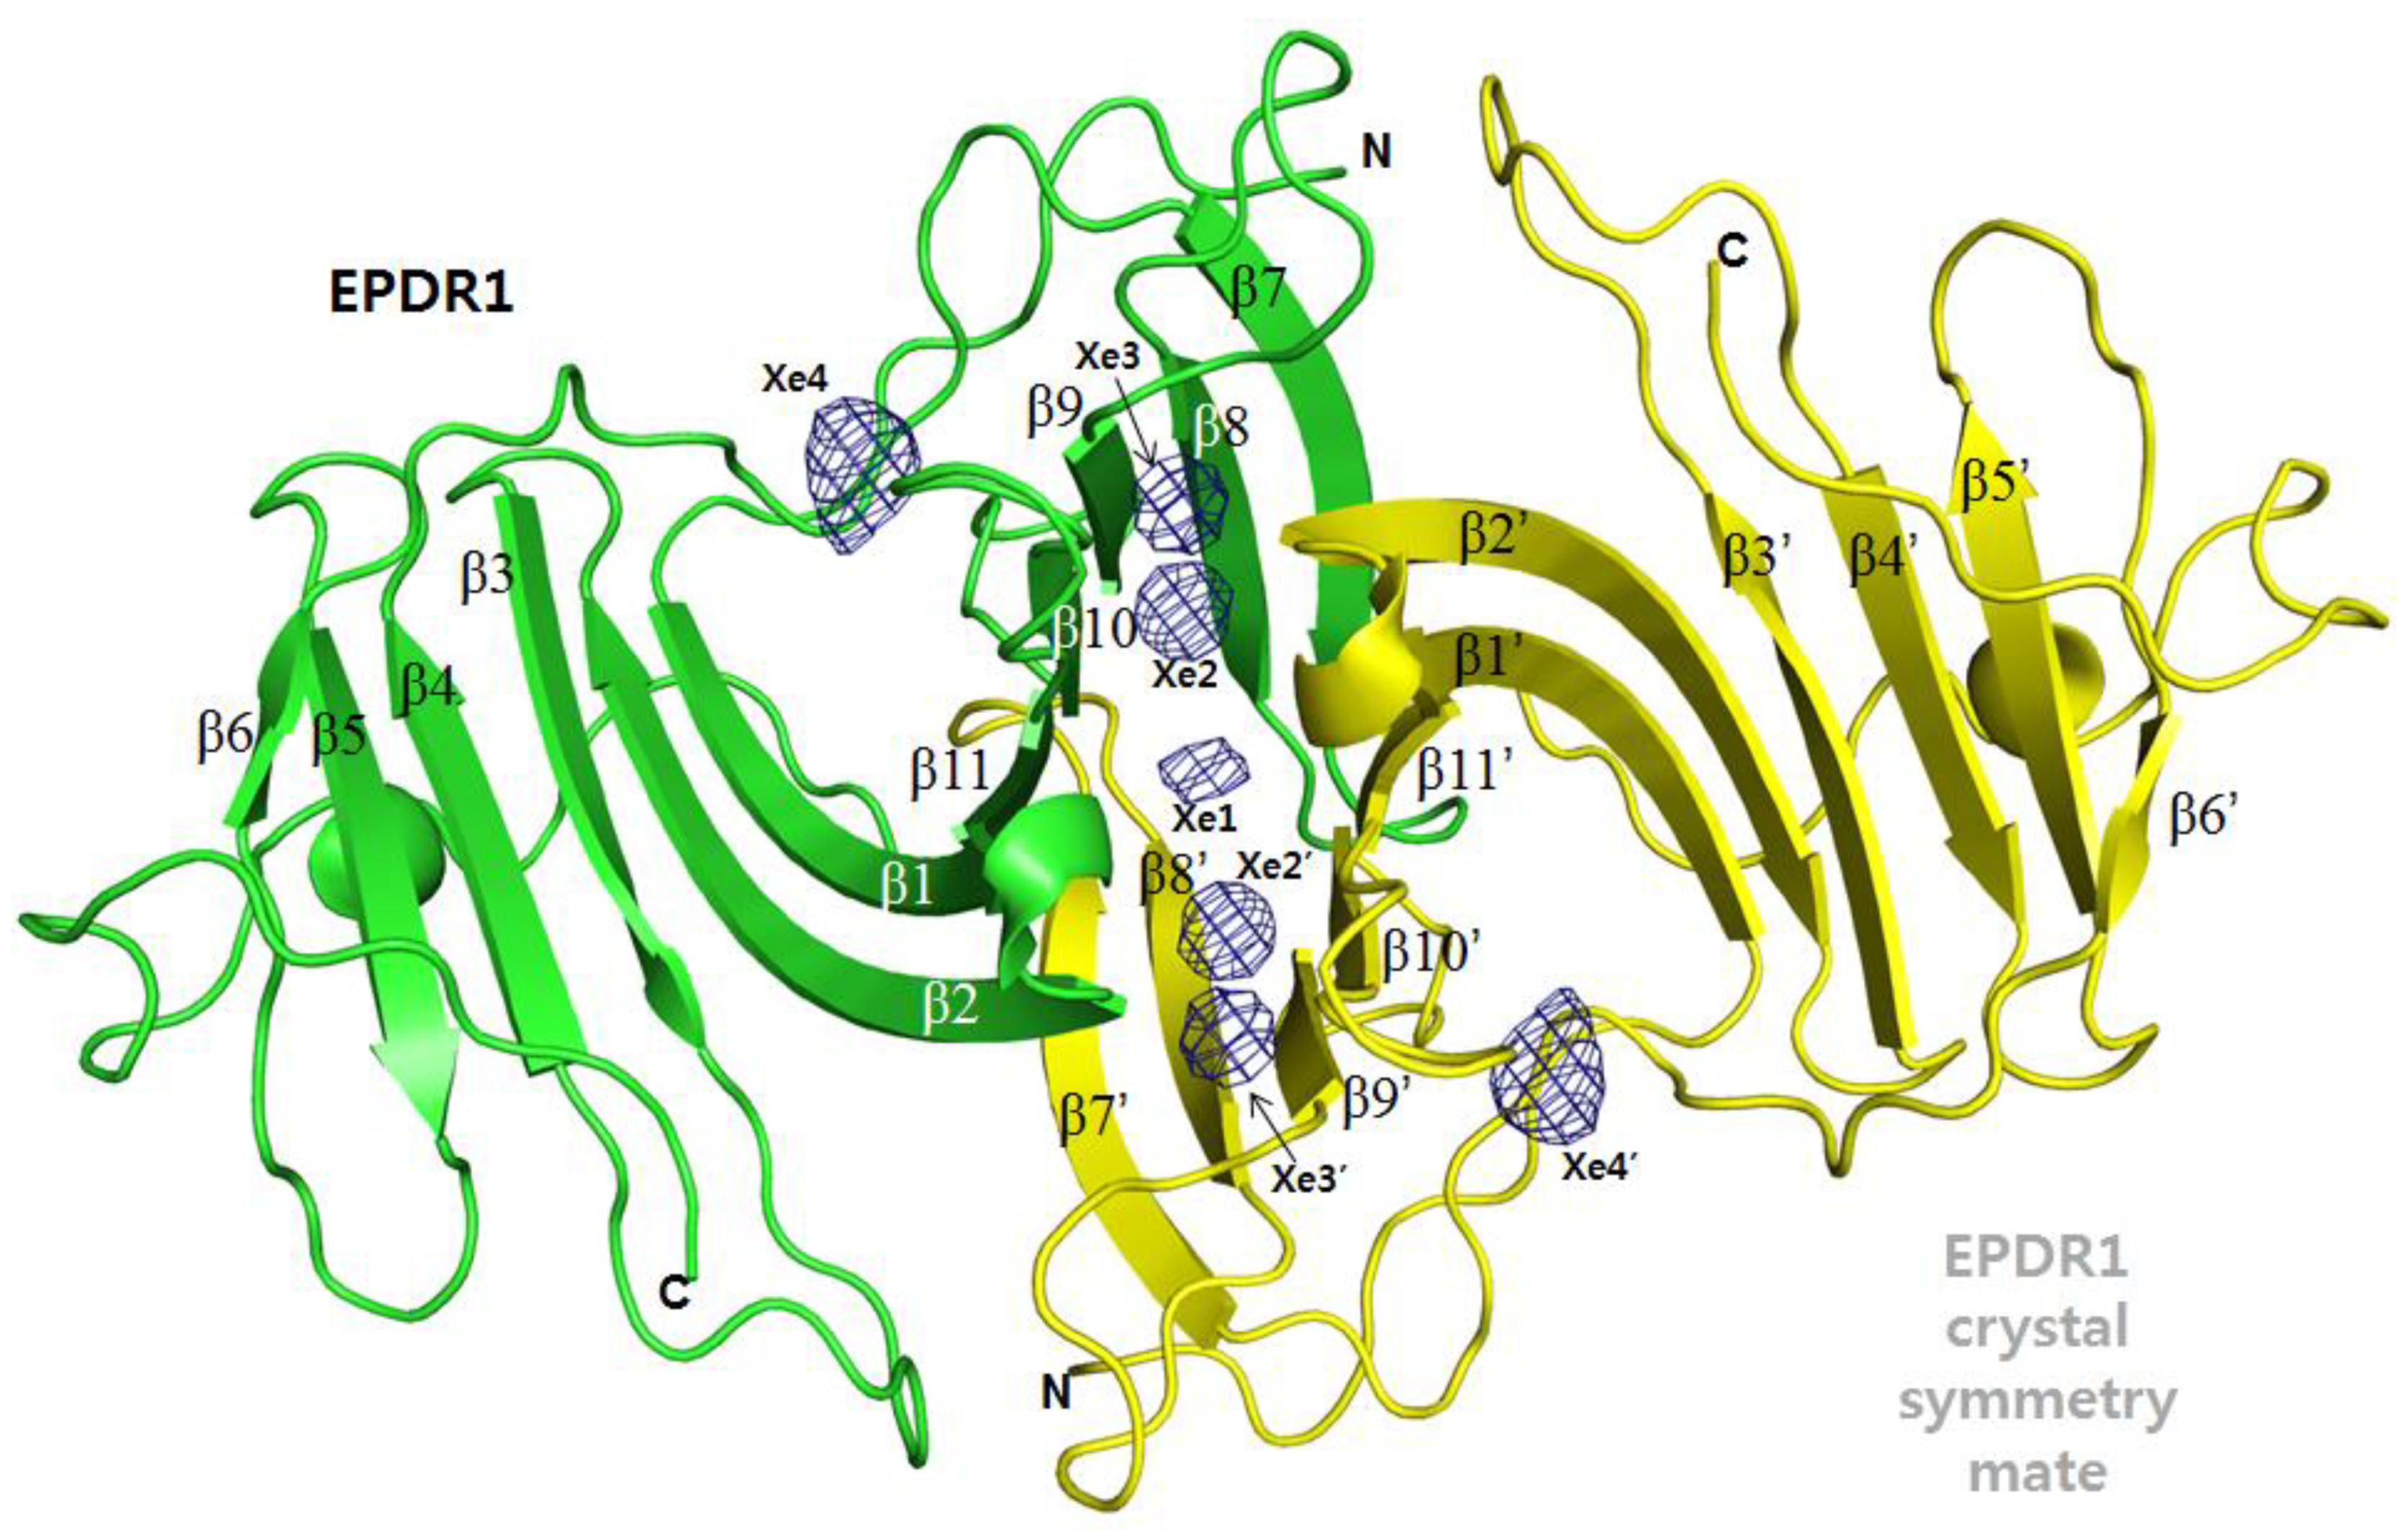
The frog EPDR1 structure was determined by direct de novo phasing via a SAD experiment utilizing the L1-absorption edge of Xe on a Xe-derivatized crystal. Although f’’ (= 7.3 e−) at the used X-ray wavelength (λ = 1.54 Å) was only half the maximum at the Xe L1-absorption edge (Figure 1), the anomalously scaled data had enough signals necessary for phasing [7]. The crystal asymmetric unit (AU) contained one EPDR1 molecule that associated into a dimer via the crystallographic symmetry mate. The monomeric subunit which forms the dimeric EPDR1 is composed of two stacking β-sheets of 11 β-strands arranged in an anti-parallel fashion (Figure 2). Four Xe atoms were found in the crystal AU of the frog EPDR1.
Of the four Xe atoms, three (Figure 2, Xe1–3) were found along the interface created between the two crystallographic symmetry mates; also, one Xe atom (Figure 2, Xe4) was found in the Ca2+-binding site of the native EPDR1. Except for the case of Xe3, the other Xe atoms are disordered as judged from the refined B-factors (Xe1, 86 Å2; Xe2, 97 Å2; Xe3, 31 Å2; Xe4, 129 Å2). It is also interesting to note that we do not see any electron densities for Xe in the aforementioned ~6,000 Å3 deep hydrophobic pocket within the monomeric EPDR1. However, there is a possibility that the seeming lack of Xe may just be from the non-ordered Xe atoms occupying the space, which would average out to null in crystallography.
3.1. Xe1–3 in the Dimeric Interface
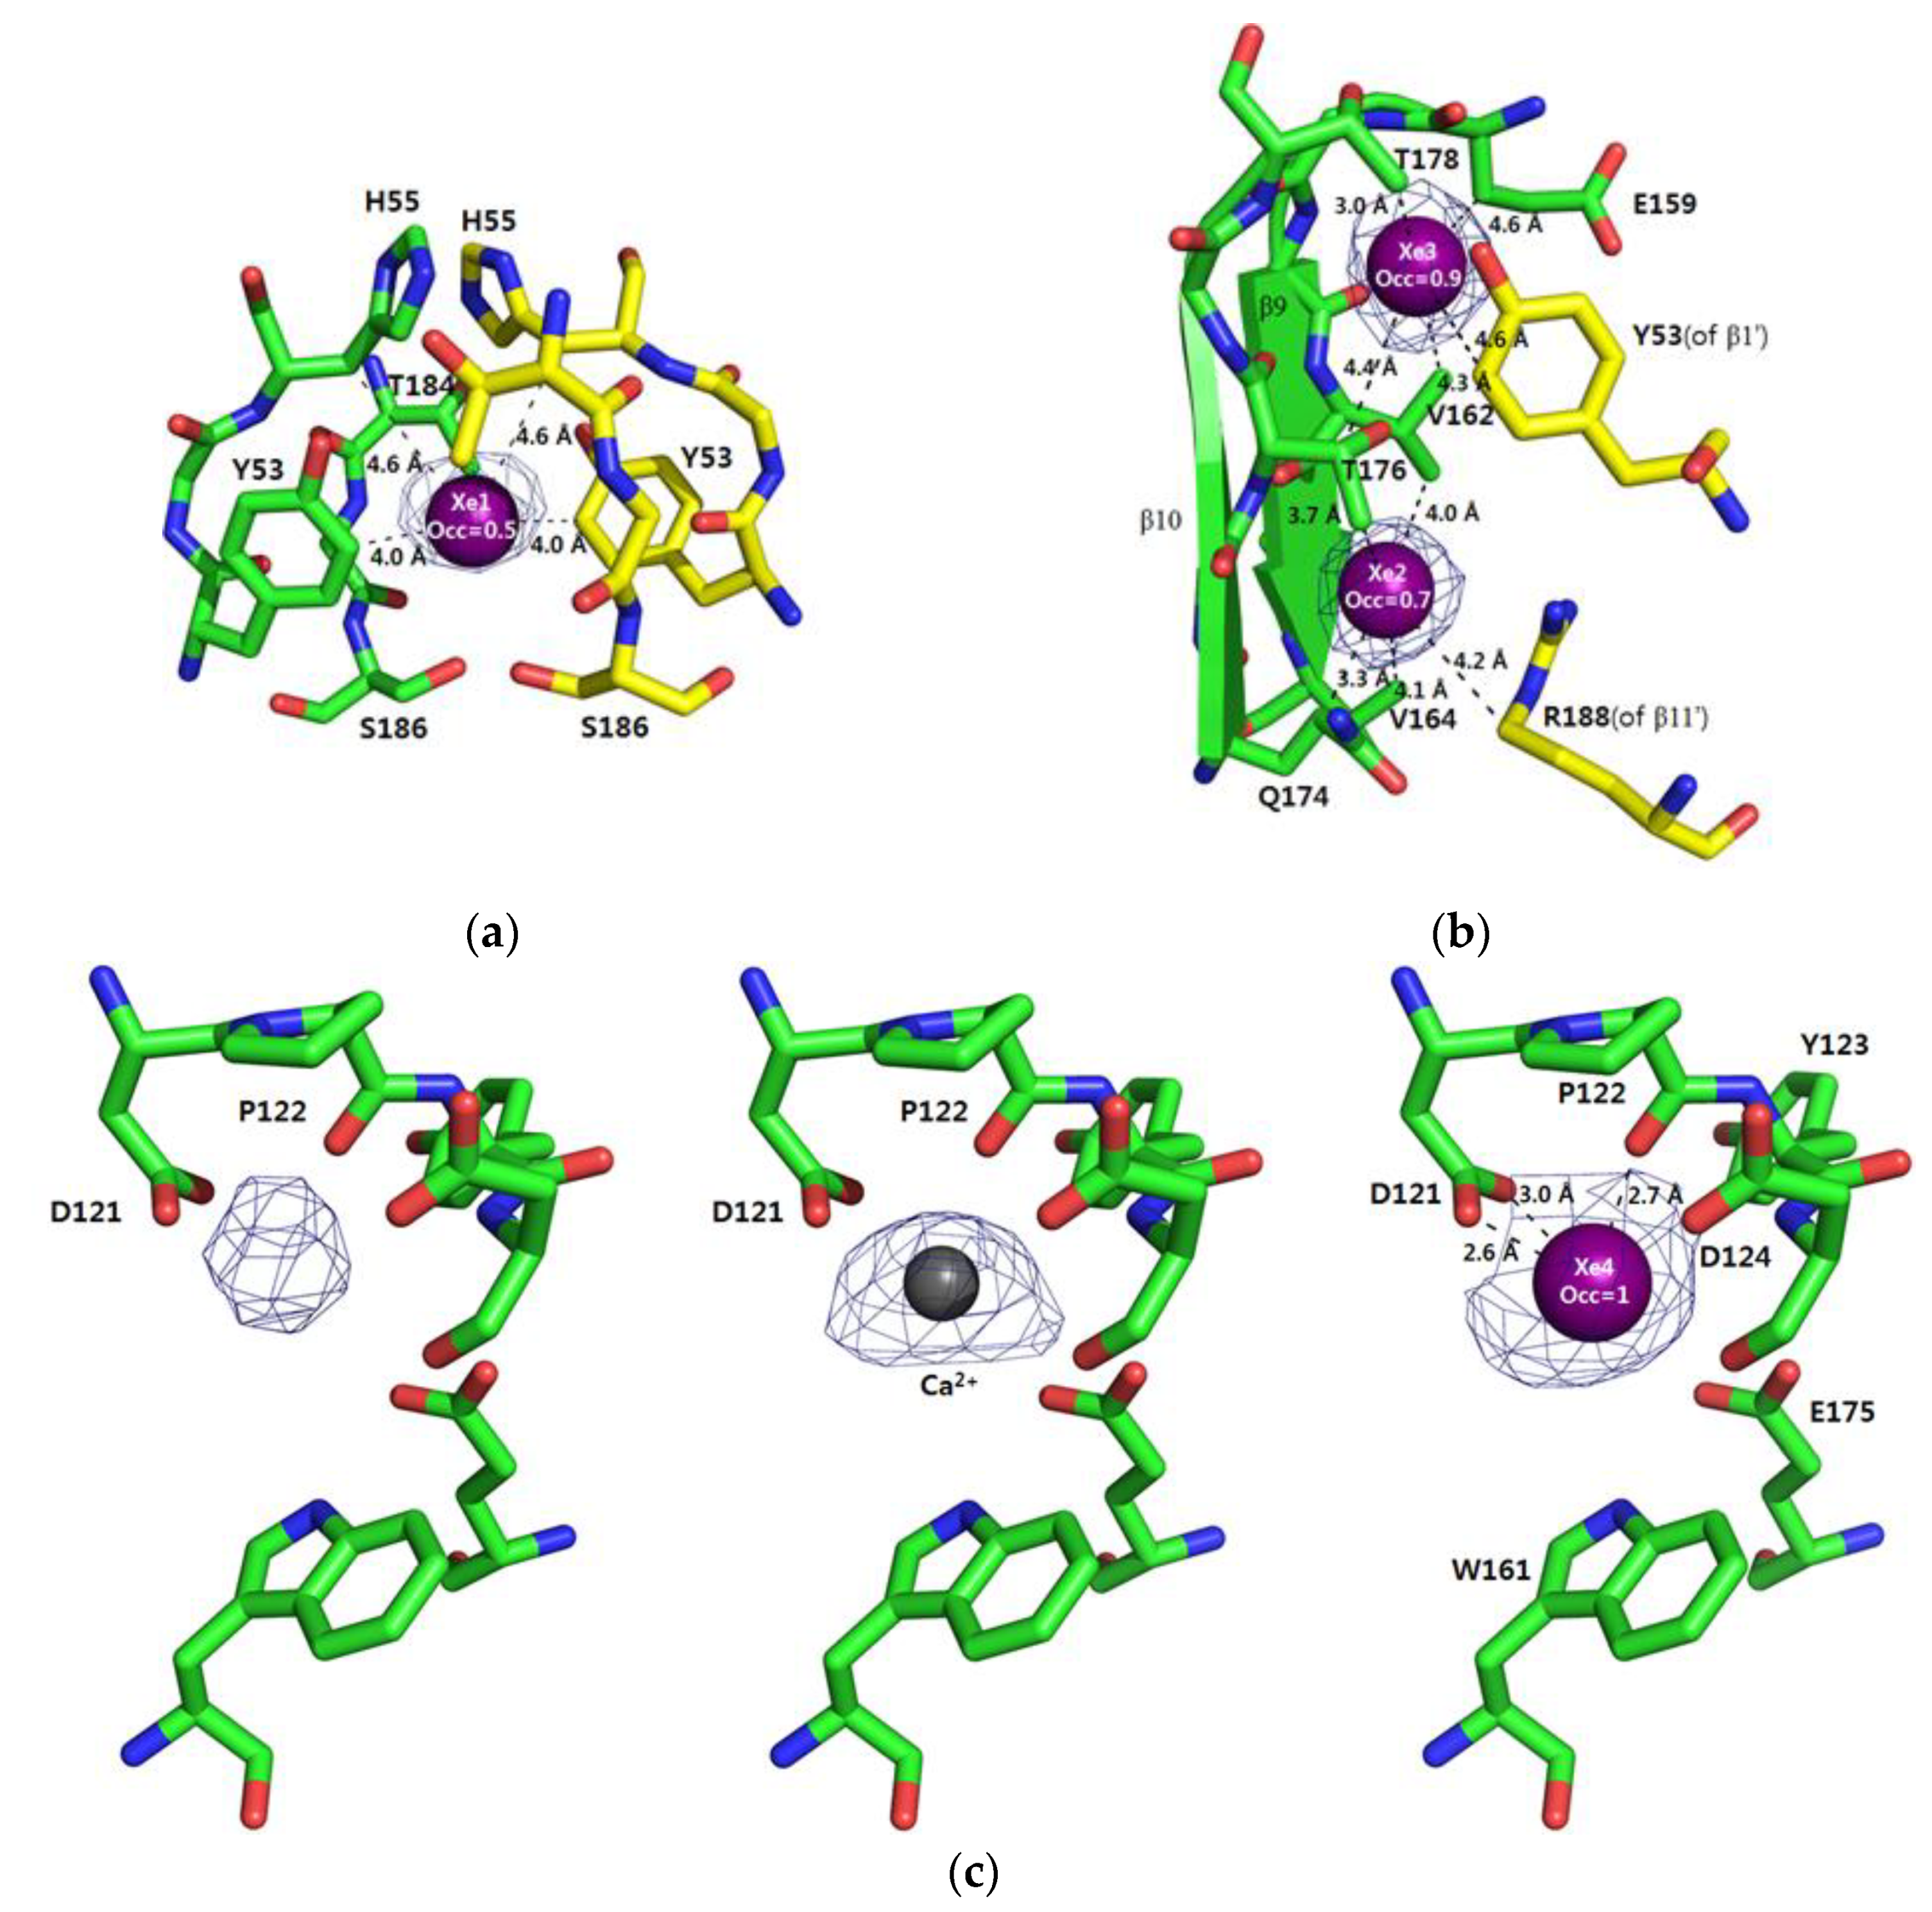
Of the four Xe atoms, Xe1 is located on the two-fold symmetry axis which relates the crystallographic symmetry mates, and hence the Xe-interacting residues of EPDR1 are identical on both monomeric subunits (Figure 3a). The Xe1 sits inside the hydrophobic pocket formed by carbon atoms in the residues of β1 (Y53), the loop following β1 (H55) and the loop prior to β11 (T184). Because the refined B-factor of Xe1 is 86 Å2, Xe1 is quite disordered and the real occupancy may be lower than the estimated occupancy of 0.5.
The Xe2 and Xe3 are located in the dimeric interface also created between the crystallographic symmetry mates (Figure 3b). For Xe2, carbon atoms in the residues of β9 (V162 and V164), β10 (Q174) and β11 (R188) are used to stabilize the Xe atom. As in the case of Xe1, the refined B-factor of Xe2 (97 Å2) is quite high, suggesting it to be disordered and lowly occupied. On the other hand, Xe3 seems to exist well-ordered (B-factor of 31 Å2) compared to the other Xe atoms. For Xe3, carbon atoms in the residues of β9 (V162), β1 (Y53) and the loop residues of T178 and E159 are within van der Waals contact with the Xe atom. These locations of Xe1, Xe2 and Xe3, which are all settled inside the hydrophobic pockets, are the generally expected positions of Xe atoms.
3.2. Xe4 in the Ca2+-Binding Site
In the frog EPDR1 without Xe-pressurization (native EPDR1), a strong electron density likely for a metal was observed near Asp121 [7]. We have previously modeled this density as Ca2+, which likely originates from the 0.2 M calcium acetate present in the crystal reservoir. Residues stabilizing the bound Ca2+ existed in the long 14-residue loop – D121 and P122 – connecting β6 and β7 of EPDR1.
Other than the oxygens of the side chains coordinating to Ca2+, four water molecules stabilized by nearby residues were also observed around Ca2+ [7]. In the Xe-pressurized EPDR1 crystal, a strong electron density in the map calculated using anomalous experimental phases was also observed at this Ca2+-binding site of the native EPDR1 (Figure 3c left). However, when modeled as Ca2+, a strong positive Fo-Fc electron density still appeared in a map contoured at 5.0 σ, suggesting that there existed an atom with more electrons than Ca2+ at this site (Figure 3c middle). Hence, the atom was modeled as Xe4 (Figure 3c right). Interestingly, the side chain of Asp121 and the main chain C = O of P122, which mediated interactions with Ca2+ in the native EPDR1, are still in close distances to the Xe4. This is contrary to the most known belief that xenon atom binds to a hydrophobic cavity. It is also noteworthy that the Xe4 site is at the periphery of the protein, and is solvent-accessible. Although the 2.9 Å structure of Xe-pressurized EPDR1 limits the observation of any water molecules, the four Ca2+-coordinating water molecules likely would be displaced by the large xenon. The refined B-factor of Xe4 (129 Å2) is very high, suggesting Xe4 to be quite disordered. Hence, the real Xe4 occupancy may be lower than the estimated occupancy of 1.0.
Similar examples of Xe atom binding to polar atoms were previously observed in several serine proteases such as elastase, subtilisin, collagenase and cutinase [1]. In all these cases, Xe atoms were found close to the Oγ of the active serine in the catalytic Ser-His-Asp triad with distances of 3.3–4.0 Å. However, a notable difference in the cases of serine proteases compared to Xe4 was that all Xe atoms were also observed around hydrophobic atoms as well. There are currently 137 structural coordinates in the PDB containing at least one Xe atom, and when all the contacts of the Xe atoms in these coordinates were manually analyzed, we found that there existed several Xe atoms that were closely distanced (2.9–3.1 Å) to the oxygen or nitrogen atoms of polar residues. However, we found no case of a Xe atom similar to Xe4, which is surrounded by multiple polar atoms such as in the case of this metal binding site. One plausible explanation of the Xe4 location can be that it is also enclosed by the hydrophobic side chains of P122, Y123, and W161 (Figure 3c right). Although the B-factor of Xe4 suggests its disorder and hence weak stabilization, it remains to be seen how a Xe atom can be stabilized in such state using computational MD simulations.
As we have modeled the electron density at this site as Ca2+ supplied from the crystallization reservoir in the previous study of native EPDR1, the exact identity of the occupying atom in the protein’s physiologic state along with its functional role remains unclear [7]. As seen in this study, it can be concluded that the site may be capable of accommodating atoms as large as xenon, and that it may not even be specific for a certain metal. In any case, the role of this Ca2+/Xe-binding site in relation to the yet unknown function of EPDR1 remains to be further studied.
Funding
This research was supported by the Basic Science Program through the National Research Foundation of Korea (NRF) funded by the Ministry of Science, ICT & Future Planning (2019R1F1A1059170). Experiments at Pohang Light Source (PLS) were supported in part by MEST and Pohang University of Science and Technology.
Accession Number
The atomic coordinate and structure factor of xenon containing frog EPDR1 have been deposited in the Protein Data Bank (http://wwpdb.org/) as PDB code 6L9X.
Acknowledgments
The author would like to thank the staff at PAL 7A for their support and beam time.
Conflicts of Interest
The author declares no conflict of interest.
References
- Prangé, T.; Schiltz, M.; Pernot, L.; Colloc’h, N.; Longhi, S.; Bourguet, W.; Fourme, R. Exploring hydrophobic sites in proteins with xenon or krypton. Proteins 1998, 30, 61–73. [Google Scholar] [CrossRef]
- Cohen, A.; Ellis, P.; Kresge, N.; Soltis, S.M. MAD phasing with krypton. Acta. Cryst. D 2001, 57, 233–238. [Google Scholar] [CrossRef] [PubMed] [Green Version]
- Takeda, K.; Miyatake, H.; Park, S.-Y.; Kawamoto, M.; Kamiya, N.; Mikia, K. Multi-wavelength anomalous diffraction method for I and Xe atoms using ultra-high-energy X-rays from SPring-8. J. Appl. Cryst. 2004, 37, 925–933. [Google Scholar] [CrossRef]
- Cianci, M.; Rizkallah, P.J.; Olczak, A.; Raftery, J.; Chayen, N.E.; Zagalsky, P.F.; Helliwell, J.R. Structure of lobster apocrustacyanin A1 using softer X-rays. Acta Cryst. D 2001, 57, 1219–1229. [Google Scholar] [CrossRef] [PubMed] [Green Version]
- Olczak, A.; Cianci, M.; Hao, Q.; Rizkallah, P.J.; Raftery, J.; Helliwell, J.R. S-SWAT (softer single-wavelength anomalous technique): Potential in high-throughput protein crystallography. Acta Cryst. A 2003, 59, 327–334. [Google Scholar] [CrossRef] [PubMed]
- Wei, Y.; Xiong, Z.J.; Li, J.; Zou, C.; Cairo, C.W.; Klassen, J.S.; Privé, G.G. Crystal structures of human lysosomal EPDR1 reveal homology with the superfamily of bacterial lipoprotein transporters. Commun. Biol. 2019, 2, 52. [Google Scholar] [CrossRef] [PubMed]
- Park, J.K.; Kim, K.Y.; Sim, Y.W.; Kim, Y.I.; Kim, J.K.; Lee, C.; Han, J.; Kim, C.U.; Lee, J.E.; Park, S. Structures of three ependymin-related proteins suggest their function as a hydrophobic molecule binder. IUCrJ. 2019, 6, 729–739. [Google Scholar] [CrossRef] [PubMed]
- Shashoua, V.E. Identification of specific changes in the pattern of brain protein synthesis after training. Science 1976, 193, 1264–1266. [Google Scholar] [CrossRef] [PubMed]
- McDougall, C.; Hammond, M.J.; Dailey, S.C.; Somorjai, I.M.L.; Cummins, S.F.; Degnan, B.M. The evolution of ependymin-related proteins. BMC Evol. Biol. 2018, 18, 182. [Google Scholar] [CrossRef] [PubMed]
- Sleat, D.E.; Sohar, I.; Lackland, H.; Majercak, J.; Lobel, P. Rat brain contains high levels of mannose-6-phosphorylated glycoproteins including lysosomal enzymes and palmitoyl-protein thioesterase, an enzyme implicated in infantile neuronal lipofuscinosis. J. Biol. Chem. 1996, 271, 19191–19198. [Google Scholar] [CrossRef] [PubMed] [Green Version]
- Della Valle, M.C.; Sleat, D.E.; Sohar, I.; Wen, T.; Pintar, J.E.; Jadot, M.; Lobel, P. Demonstration of lysosomal localization for the mammalian ependymin-related protein using classical approaches combined with a novel density shift method. J. Biol. Chem. 2006, 281, 35436–35445. [Google Scholar] [CrossRef] [PubMed] [Green Version]
- Hirano, S.; Asamizu, S.; Onaka, H.; Shiro, Y.; Nagano, S. Crystal structure of VioE, a key player in the construction of the molecular skeleton of violacein. J. Biol. Chem. 2008, 283, 6459–6466. [Google Scholar] [CrossRef] [PubMed] [Green Version]
- Ryan, K.S.; Balibar, C.J.; Turo, K.E.; Walsh, C.T.; Drennan, C.L. The violacein biosynthetic enzyme VioE shares a fold with lipoprotein transporter proteins. J. Biol. Chem. 2008, 283, 6467–6475. [Google Scholar] [CrossRef] [Green Version]
- Takeda, K.; Miyatake, H.; Yokota, N.; Matsuyama, S.; Tokuda, H.; Miki, K. Crystal structures of bacterial lipoprotein localization factors, LolA and LolB. EMBO J. 2003, 22, 3199–3209. [Google Scholar] [CrossRef] [Green Version]
- Park, J.K.; Sim, Y.W.; Park, S.Y. Over-expression, secondary structure characterization, and preliminary X-ray crystallographic analysis of Xenopus tropicalis ependymin. Crystals 2018, 8, 284. [Google Scholar] [CrossRef] [Green Version]
- Otwinowski, Z.; Minor, W. Processing of X-ray Diffraction Data Collected in Oscillation Mode. Methods Enzymol. 1997, 276, 307–326. [Google Scholar]
- Adams, P.D.; Afonine, P.V.; Bunkoczi, G.; Chen, V.B.; Davis, I.W.; Echols, N.; Headd, J.J.; Hung, L.-W.; Kapral, G.J.; Grosse-Kunstleve, R.W.; et al. PHENIX: A comprehensive Python-based system for macromolecular structure solution. Acta. Cryst. D Biol. Cryst. 2001, 66, 213–221. [Google Scholar] [CrossRef] [PubMed] [Green Version]
- Emsley, P.; Cowtan, K. Coot: Model-building tools for molecular graphics. Acta. Cryst. D Biol. Cryst. 2004, 60, 2126–2132. [Google Scholar] [CrossRef] [PubMed] [Green Version]
- Vagin, A.A.; Steiner, R.A.; Lebedev, A.A.; Potterton, L.; McNicholas, S.; Long, F.; Murshudov, G.N. REFMAC5 dictionary: Organisation of prior chemical knowledge and guidelines for its use. Acta. Cryst. D 2004, 60, 2284–2295. [Google Scholar] [CrossRef] [PubMed] [Green Version]
Figure 1.
Xe scattering factors as a function of X-ray energy. The f’ and f” scattering factors as a function of energy are plotted for Xe near the L-absorption edge. A wavelength of 1.54 Å was used for the single wavelength anomalous diffraction (SAD) experiment during the de novo phasing. The anomalous scattering coefficients f’ and f” as a function of incident X-ray energy was taken from the following: http://skuld.bmsc.washington.edu/scatter/AS_periodic.html.

Figure 2.
The locations of four Xe atoms. The overall locations of the four Xe atoms found in the frog EPDR1 (in the ribbon diagram) are shown on the dimeric structure formed by the crystal symmetry mate (in yellow). Except for Xe4, Xe1–3 are located in the dimeric interface. Xe1 is exactly located along the two-fold symmetry axis, hence being a special position (Xe1’ perfectly overlaps with Xe1.). The crystal symmetry locations of Xe2–4 atoms are indicted as Xe2’–4’. The OMIT Fo-Fc electron density map was contoured for the four Xe atoms at 3.6 σ.

Figure 3.
The detailed interactions of Xe atoms with EPDR1 residues. The locations of Xe1~4 (in ball) are shown with occupancies indicated. In all cases, nearby residues are shown, and close distances within the ranges of hydrogen-bonding (2.6–3.4 Å) and van der Waals (2.5–4.6 Å) interactions are indicated. The residues from the crystal symmetry mate are shown in yellow as well. (a) The location of Xe1 is shown with the 2Fo-Fc electron density map contoured at 1.0 σ. The estimated occupancy of Xe1 is 0.5 while the B-factor is 86 Å2. (b) The locations of Xe2 and Xe3 are shown with the 2Fo-Fc electron density map contoured at 1.0 σ. The estimated occupancies of Xe2 and Xe3 are 0.7 and 0.9, respectively. The refined B-factors are 97 Å2 (Xe2) and 31 Å2 (Xe3). (c) Xe4 is located at a Ca2+-binding site of native EPDR1. The electron density map calculated using the anomalous experimental phases contoured at 4.0 σ shows the electron density of an atom at the site (left). When modeled as Ca2+, strong Fo-Fc electron density appears for a map contoured at 5.0 σ (middle). Hence, the atom was modeled as a Xe atom, and the 2Fo-Fc electron density map contoured at 1.0 σ is shown (right). The estimated occupancy of Xe4 is 1.0 while the B-factor is 129 Å2.


Table 1.
Data collection and refinement statistics.
| Data Collection | |
| Diffraction source | Pohang Light Source (PLS 7A, Pohang, Korea) |
| Space group | P6522 |
| Detector | ADSC Q270 |
| Wavelength (Å) | 1.54 |
| Oscillation(°)/Frame | 1/360 |
| Cell dimensions | 61.46 Å, 61.45 Å, 233.84 Å, 90°, 90°, 120° |
| Resolution (Å) | 50−2.90 (2.95−2.90)1 |
| Rsym (%) | 9.7 (58.2) |
| Rp.i.m. (%) | 2.1 (12.5) |
| CC1/2 | (0.976) |
| I/σ(I) | 71.0 (10.5) |
| Completeness (%) | 99.9 (100.0) |
| Redundancy | 21.9 (22.5) |
| Unique reflections | 6,390 |
| Overall B factor from Wilson plot (Å2) | 63.6 |
| Refinement | |
| Resolution (Å) | 2.90 |
| NCS molecules in AU | 1 |
| Rwork/Rfree (%) | 0.219/0.308 |
| No. atoms | |
| Protein | 1,514 |
| Ligand/ion | 4 Xe |
| B-factors | |
| Protein (main/side chain) | 69.9/76.6 |
| Xe | 135.6 |
| R.m.s. deviations | |
| Bond lengths (Å) | 0.011 |
| Bond angles (°) | 1.500 |
1 Values in parentheses are for highest-resolution shell.
© 2020 by the author. Licensee MDPI, Basel, Switzerland. This article is an open access article distributed under the terms and conditions of the Creative Commons Attribution (CC BY) license (http://creativecommons.org/licenses/by/4.0/).
Share and Cite
MDPI and ACS Style
Park, S. De novo Phasing Xenons Observed in the Frog Ependymin-Related Protein. Crystals 2020, 10, 32. https://doi.org/10.3390/cryst10010032
AMA Style
Park S. De novo Phasing Xenons Observed in the Frog Ependymin-Related Protein. Crystals. 2020; 10(1):32. https://doi.org/10.3390/cryst10010032
Chicago/Turabian StylePark, SangYoun. 2020. "De novo Phasing Xenons Observed in the Frog Ependymin-Related Protein" Crystals 10, no. 1: 32. https://doi.org/10.3390/cryst10010032
Note that from the first issue of 2016, this journal uses article numbers instead of page numbers. See further details here.