Article

A Low-Cost Deep-Learning-Based System for Grading Cashew Nuts

1
Faculty of Electrical Engineering, Hanoi University of Industry, Hanoi 100000, Vietnam
2
School of Electrical & Electronic Engineering, Hanoi University of Science and Technology, Hanoi 100000, Vietnam
3
School of Information and Communications Technology, Hanoi University of Science and Technology, Hanoi 100000, Vietnam
4
Faculty of Electrical Engineering, Sao Do University, Hai Duong 170000, Vietnam
5
Institute of Innovation, Science and Sustainability, Federation University Australia, Churchill, VIC 3842, Australia
*
Author to whom correspondence should be addressed.
Computers 2024, 13(3), 71; https://doi.org/10.3390/computers13030071
Submission received: 7 February 2024 / Revised: 27 February 2024 / Accepted: 6 March 2024 / Published: 8 March 2024
(This article belongs to the Special Issue Deep Learning and Explainable Artificial Intelligence)

Abstract

:
Most of the cashew nuts in the world are produced in the developing countries. Hence, there is a need to have a low-cost system to automatically grade cashew nuts, especially in small-scale farms, to improve mechanization and automation in agriculture, helping reduce the price of the products. To address this issue, in this work we first propose a low-cost grading system for cashew nuts by using the off-the-shelf equipment. The most important but complicated part of the system is its “eye”, which is required to detect and classify the nuts into different grades. To this end, we propose to exploit advantages of both the YOLOv8 and Transformer models and combine them in one single model. More specifically, we develop a module called SC3T that can be employed to integrate into the backbone of the YOLOv8 architecture. In the SC3T module, a Transformer block is dexterously integrated into along with the C3TR module. More importantly, the classifier is not only efficient but also compact, which can be implemented in an embedded device of our developed cashew nut grading system. The proposed classifier, called the YOLOv8–Transformer model, can enable our developed grading system, through a low-cost camera, to correctly detect and accurately classify the cashew nuts into four quality grades. In our grading system, we also developed an actuation mechanism to efficiently sort the nuts according to the classification results, getting the products ready for packaging. To verify the effectiveness of the proposed classifier, we collected a dataset from our sorting system, and trained and tested the model. The obtained results demonstrate that our proposed approach outperforms all the baseline methods given the collected image data.

1. Introduction

Recently, there is a trend towards a well-balanced or diversified diet where nuts are more consumed in meals [1], though they are well served in many forms of foods. Among the nuts, cashew nuts are well recognized by their healthy properties, unique taste and flavor, and distinctive nutritional value [2]. In fact, cashew nuts contain rich vitamins, beneficial minerals, including phosphorus, copper, and magnesium, the lowest saturated fat content as compared with other nuts, and many other bioactive compounds [1]. Therefore, having cashew nuts can offer multiple health benefits such as cancer prevention, cardiovascular protection, nerve maintenance, and antioxidant activities [3].
Nevertheless, cashew nuts are still quite expensive for the majority of customers, and the high cost is mostly due to producing and processing raw products. For instance, processing raw cashew nuts comprises multiple steps, including roasting, peeling, extracting the kernel, sorting, and packaging [4], before they can be delivered and sold to customers. Some of these processing steps are currently carried out by humans, which is time-consuming and skill-demanding, and all these labor costs add up to the product price. One might be aware that on market the nuts are sold at different quality grades with different prices. High-quality cashew nuts are the most expensive. Nuts with some minor defects are sold at a lower price, and some cashew nuts with major defects are not even accepted by customers. Having said that, during processing of the raw products, sorting nuts into different quality grades is paramount. The quality of cashew nuts is mostly sorted by humans through eye inspection and manual handpicking, which requires that workers must be skillful to be able to classify the nuts based on their size, shape, texture, and color. Apparently, the manual sorting is time-consuming and labor-intensive, which negatively affects the productivity of the cashew nut production and ultimately increases the product price. On the other hand, while every single year the world grows and produces million tons of cashew nuts [3], which requires a huge amount of workforce to participate in the processing, labor shortage in agriculture is getting worse [5]. All these challenges pose a research problem to exploit advanced technologies to automate the procedure of processing raw cashew nuts. At first, one can see that sorting cashew nuts into different quality grades can be performed automatically. In other words, to automate the sorting, an automatic machine, via its “eye”, should be able to detect and classify the nuts into correct quality grades. Technologically, the detection and classification ability of a machine can be built by the use of computer vision. Automating the grading process can eventually reduce the price of the cashew nut products as it can significantly cut labor costs. In equivalent words, automatically grading cashew nut quality can address the problem of labor shortage in agriculture that the world is facing now, which also provides a sustainable food production and processing.
In practice, computer vision has been widely utilized in precision agriculture [6,7,8], including in sorting, detecting defects, controlling quality, and classifying fruits [9,10,11,12,13,14,15], vegetables [16,17,18], nuts [19,20,21,22], and other food products [23,24]. For instance, Jhawar et al. [15] presented an approach employing the nearest linear regression pattern recognition for assessing the ripeness of oranges, utilizing a single-color image of the fruit. An automated tomato-sorting system using computer vision techniques was proposed by Arakeri and Lakshmana [9], including both software and hardware components. The system captures images and moves them to the corresponding bins after being sorted without human intervention. A nondestructive technique was proposed by Ramos et al. [22], utilizing the linear estimation for counting fruits, identifying overlap between fruits and classifying harvestable coffee cherries. An artificial neural network classifier for classifying ripe and unripe mangoes, implemented by Yossy et al. [10], reports an accuracy of 94%. Additionally, some reports on classifying quality of vegetables using computer vision methods can be found in [18,25].
Recently, there are several computer-vision-based studies relating to identifying, recognizing, and classifying cashew nuts. For instance, in a earlier work [26], Thakkar et al. examined multiple machine learning algorithms in recognizing the cashew nut quality. It was proposed to employ only the color of the nuts as an input to feed into multiple models including multilayer perceptron, naive Bayes, K-nearest neighbor, decision tree, and support vector machine. The trained models were then able to classify the nut quality with an accuracy ranging from 76% to 86%. The proposed method is quite simple as it utilizes only one feature for the training, but the accuracy is not high. Cervantes-Jilaja et al. [19] introduced a computer vision approach for identifying and detecting visual imperfections in cashew nuts by utilizing external attributes like shape, color, size, and texture. By employing the available dataset [27], Shyna and George, in their work [28], proposed to exploit both the support vector machine and backpropagation neural network techniques to classify the nuts. Before the classification step, they utilized the Weiner and Lucy filters in the wavelet transformation as the preprocessing stage. They also proposed to employ multiple features, including color, texture, shape, and size, as inputs of the classifier. Though the obtained results showed that the proposed method can be useful, it may not be able to identify the broken nuts. In a similar manner, the works [27,29] also exploited the neural network paradigms and the multiple features in the dataset to build the cashew nut classifiers. In addition to the machine learning techniques, these works analyzed the impact of image processing on the classification results. However, the proposed approaches were limited by the nut-splitting phenomena, which due to environmental influence, where a nut is naturally separated in two halves along its longitudinal axis. Deep learning is another aspect that the researchers have also paid attention to in terms of exploiting it for identifying and classifying quality of cashew nuts. For example, in the work [20], Shivaranjani et al. presented a deep learning model called CashNet-15 with the use of the deep convolutional neural networks to classify the cashew nuts into classes of intact, whole, split, broken, or in pieces.
Nonetheless, to the best of our knowledge, none of the computer-vision-based classifiers has been implemented in a sorting machine to automatically classify cashew nuts into different quality grades, particularly when the nuts are on a running conveyor. To be implemented in an embedded system, a classification model needs to be compact. On the other hand, detecting and classifying cashew nuts in images captured by a low-cost camera is also very challenging due to the low quality of the images. In the literature, there is evidence that the You Look Only Once (YOLO) model [30,31,32,33,34,35] has been implemented in an embedded system for object detection [36,37]. In recent years, the YOLO model for object detection has garnered significant attention from the research community, with continuous improvements such as YOLOv1, YOLOv2, YOLOv3, YOLOv4, YOLOv5, YOLOv7 [30,31,32,33,34], and, most recently, YOLOv8 [35]. YOLOv8 is a state-of-the-art, cutting-edge, and highly efficient model that can be run on various hardware configurations, from CPUs to GPUs [38]. However, when compared with the two-stage object detection models like R-CNN [39], although the YOLO model is advantageous in speed, its accuracy is significantly lower than the RCNN models. Therefore, improving the accuracy of the YOLO model without significantly increasing its computational complexity, while still being able to be implemented in an embedded system, is a fundamental but challenging research problem.
In the deep learning community, Transformer [40] is also a phenomenon that dominates in the natural language processing domain and, most recently, in the large language models. By using the attention mechanism [41], the Transformer models can learn complex dependencies among input sequences. The mechanism also works well with image data to connect nearby features, which allows the model to better acquire and relate spatial information in a broad neighborhood, minimizing confusion of categories in complicated and large scenes. Keeping and associating spatial information are paramount for object detection; the Transformer models have potential for improving accuracy in object recognition [42].
In our work, in order to build an efficient but compact classifier that can be implemented in an embedded device of our developed cashew nut sorting system, we propose to take advantage of both the YOLOv8 and Transformer models and combine them in one single model. More specifically, we develop a module called SC3T that can be employed to integrate into the backbone of the YOLOv8 architecture. In the SC3T module, a Transformer block is dexterously integrated along with the spatial pyramid pooling and C3TR models. The proposed classifier, called the YOLOv8–Transformer model, can enable our developed grading system through a low-cost camera to correctly detect and accurately classify the cashew nuts into four quality grades. In our grading system, we also develop an actuation mechanism to efficiently sort the nuts according to the classification results, getting the products ready for packaging. To verify the effectiveness of the proposed classifier, we collect a dataset from our grading system, and train and test the model. The obtained results demonstrate that our proposed approach outperforms all the baseline methods given the collected image data.
The remaining of the paper is arranged as follows. In Section 2, a low-cost system for grading cashew nuts is delineated. We then discuss how we collected the data for building a classification model for the grading system. This section also presents thew structure of the proposed YOLOv8–Transformer classifier. Section 3 starts by discussing some metrics that can be utilized to evaluate the performance of the proposed classification approach. The experimental results are then analyzed and discussed in the same section before the conclusions are drawn in Section 4.

2. Materials and Methods

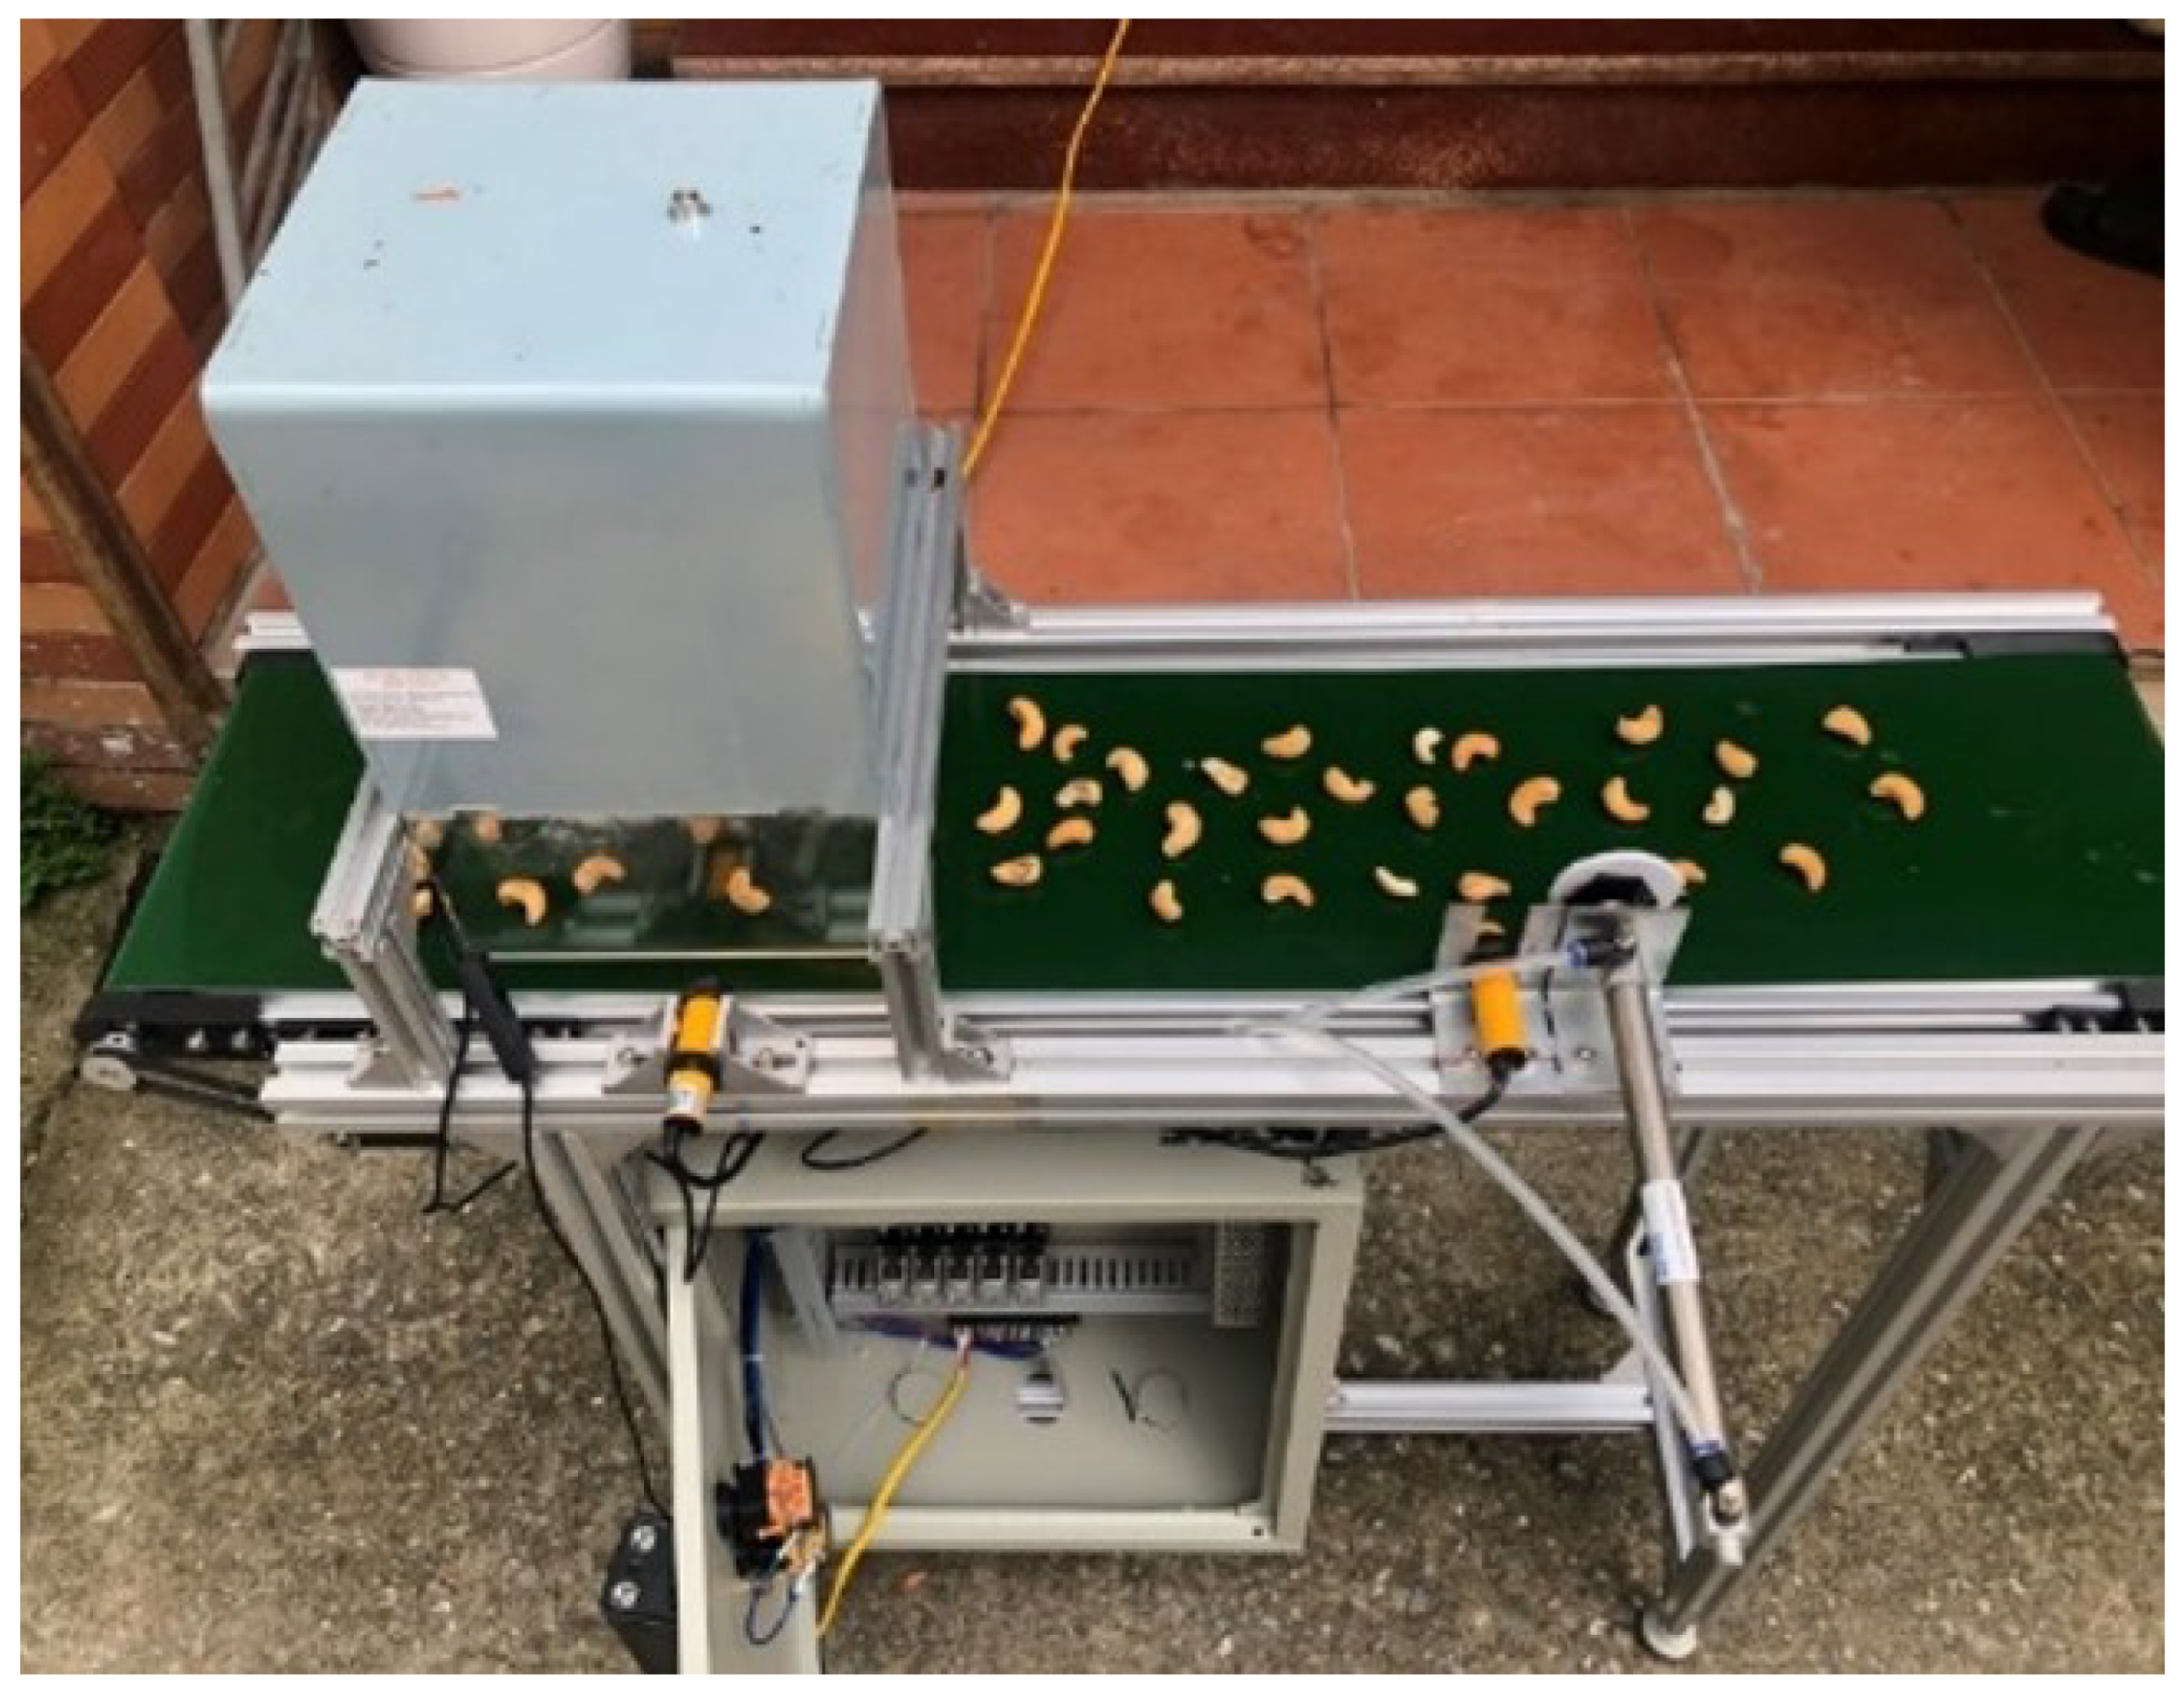
2.1. A System for Grading Cashew Nuts

In this section, we present descriptions of a low-cost system for grading cashew nuts. Practically, it is proposed to exploit the off-the-shelf equipment to develop the hardware and firmware of the system. For the software of the system, particularly an algorithm to detect and classify the nuts into different grades, we propose to employ a low-cost camera and deep learning techniques. More details of the detection and classification algorithm will be discussed in the sections following.

2.1.1. A Framework

In order to develop a low-cost grading system to be used in a real-world application of automatically recognizing noncompliant cashew nuts and removing them from the production, we propose a framework of the system with the key components. The block diagram of the framework of our proposed grading system can be seen in Figure 1. It can be clearly seen that our cashew nut grading system comprises seven main components. The cashew nuts are first conveyed on a conveyor (1). On a bridge built across the conveyor, a camera system (4) is installed in a chamber (2) to capture images of all the nuts passing underneath. In this system, we implemented a low-cost camera Logitech C922 1080p, which features a glass lens with autofocus. In order to maintain consistent quality of and avoid any noise caused by unknown external light conditions on the image data, it was proposed to embed an artificial light supply (3) whenever the data are taken. The captured images are then fed into our proposed classifier (5), being discussed in the sections following, which is installed on an on-board computer. The classification results as the outputs of the classifier can be displayed on a screen for the monitoring purpose (6) and sent to a central control unit that is also on the computer.
A snapshot of the developed system for grading cashew nuts is depicted in Figure 2. Vietnam is a leading country in the world in terms of producing cashew nuts [3], and there is a high demand for the grading system as Vietnam has about 200,000 farmer households producing cashew nuts [43,44]. The grading system can be utilized for automating a part of the production chain, especially in small-scale farms, packaging the products for exporting to the world.

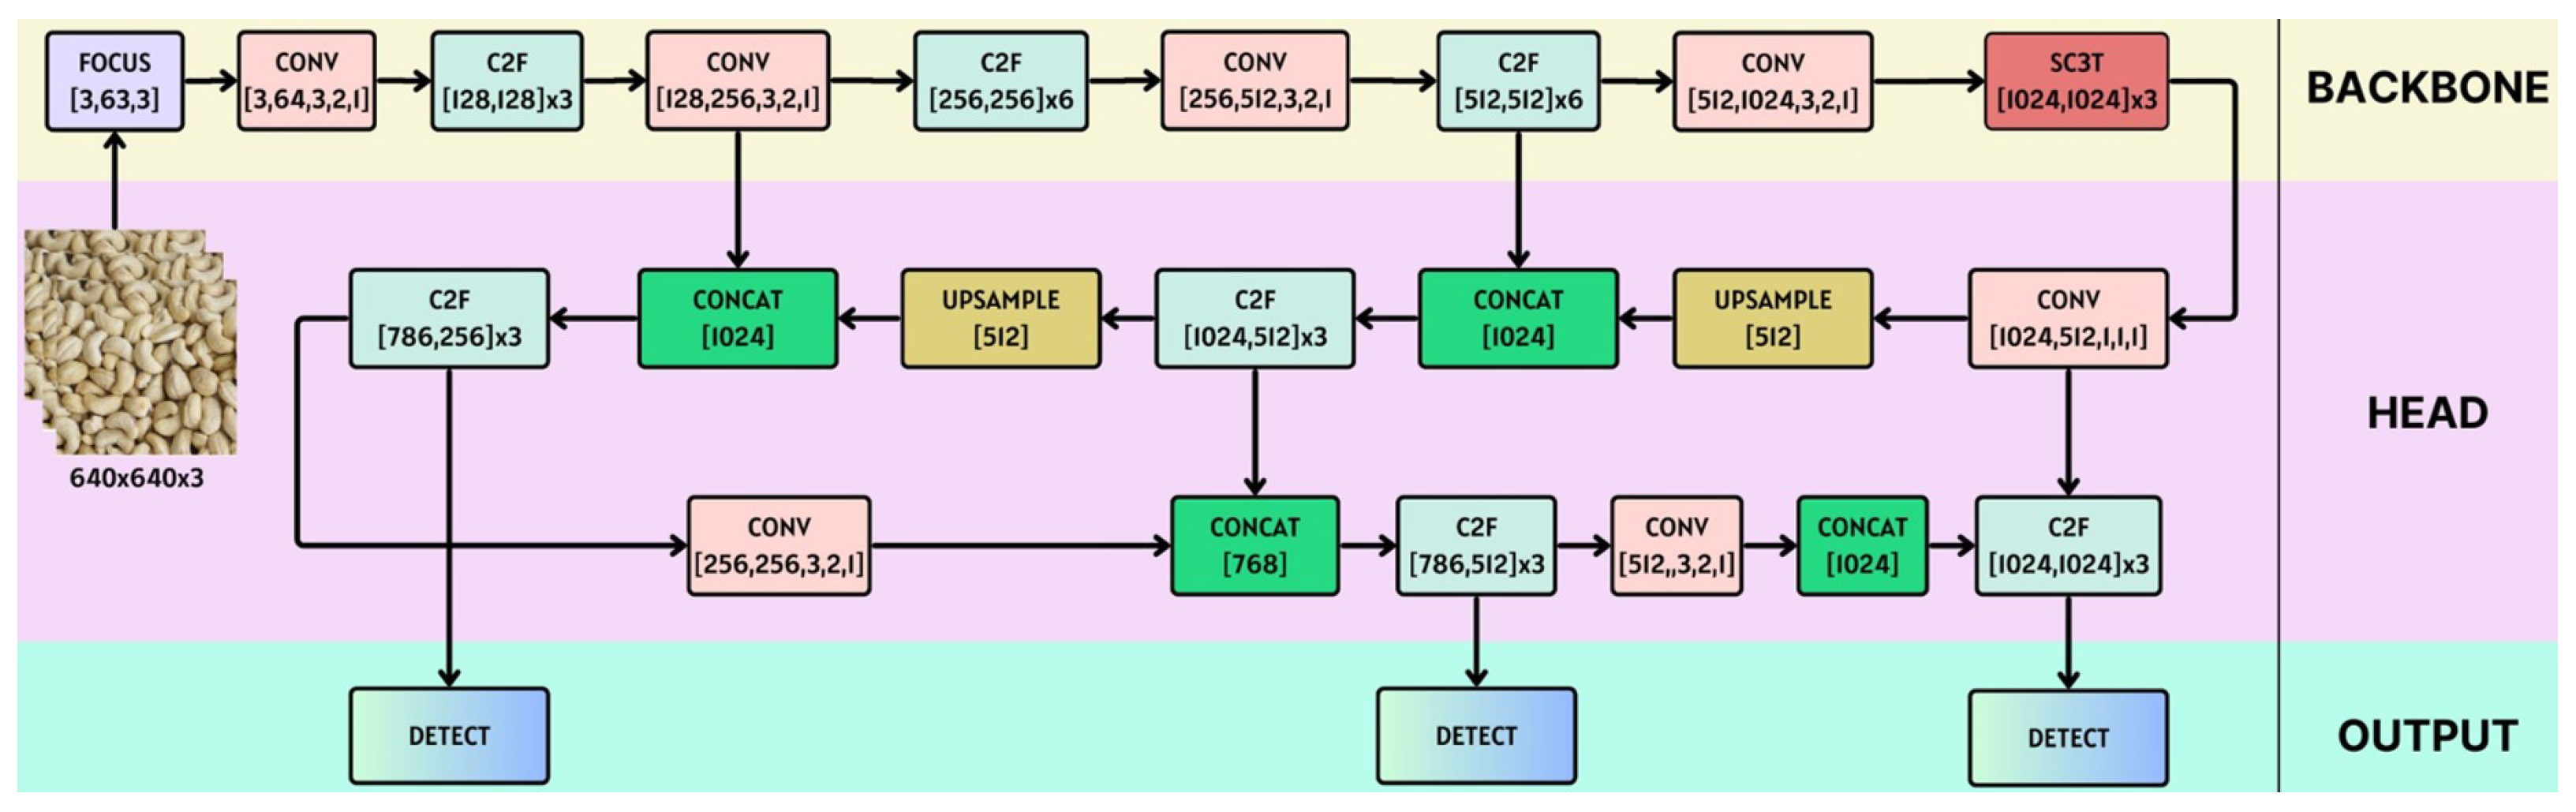
2.1.2. Classification Model

The cashew nuts are conveyed by a conveyor. When they are passing underneath the camera chamber, a photo of the nuts is taken. Assuming that there is a black-box classification algorithm, which can classify a nut in the photo into a specified grade, the classified nut is then sorted by an actuator. The classification algorithm is the most complicated part of the grading system. Therefore, we will discuss it in detail in the sections following.

2.1.3. Grading Actuation

While the conveyor keeps running to convey the nuts, the classification model predicts what grade the nut captured in the photo belongs to. The classification model is well trained in advance. At the time the system is grading the nuts, the model only performs the predictions. In other words, the classification algorithm can be trained offline using the historical data. As training a deep learning model is time-consuming, training a classification model online may not work in this application. Since the trained classification model only performs the predictions, depending on computing resources, its inference time can be in milliseconds per image. This speed is fast enough so that by the time the nut hits a position of the actuator, it will be sorted to a properly specified grade.
In fact, the conveyor and nut positions are well monitored by the position sensors such as an encoder. Given the time stamp of when a photo of the nuts is captured, by using the velocity of the conveyor from an encoder sensor, the computer can work out when the classified nut hits the position next to the grading actuator. In the system, we propose to utilize a linear pneumatic actuator, as the grading actuator as can be seen in Figure 1 and Figure 3. In practice, due to drift in the conveyor, the calculation of the classified nut position on the conveyor from the computer may not be 100 percent accurate. Hence, to further confirm appearance of the classified nut next to the grading actuator position, we propose to exploit a proximity sensor to reaffirm this, as demonstrated in Figure 3. Once the classified nut hits the position next to the grading actuator, it will be pushed off the conveyor by the linear pneumatic actuator to a container next to the side of the conveyor. At one particular time, the grading actuator can only sort one type of the nut grades. For instance, if a nut is classified as grade 1, it will be pushed off the conveyor to a container placed next to a side of the conveyor. If not, it will keep running on the conveyor and fall in a general container placed at the end of the conveyor. In the case that there are multiple grades of cashew nuts, the nuts can be run on the conveyor multiple times, and each time, one grade of the nuts can be sorted. Alternatively, the conveyor can be extended longer, where multiple grading actuators can be installed at different positions to sort the nuts into different grades.
To control the linear pneumatic actuator, it is connected to a flow control valve, and the valve is directly controlled by a programmable logic controller (PLC). The prediction of the nut grade from the classification algorithm and the calculation of the nut position on the conveyor are sent to the PLC. The signals from the proximity sensor are also sent to the PLC. All the information is fused in the PLC to decide when to push the piston of the actuator out to sort the graded nut. In this work, we propose to employ a PLC from Siemens, the model of PLC S7-1200 CPU 1211C DC/DC/DC. The control unit is illustrated in Figure 4.

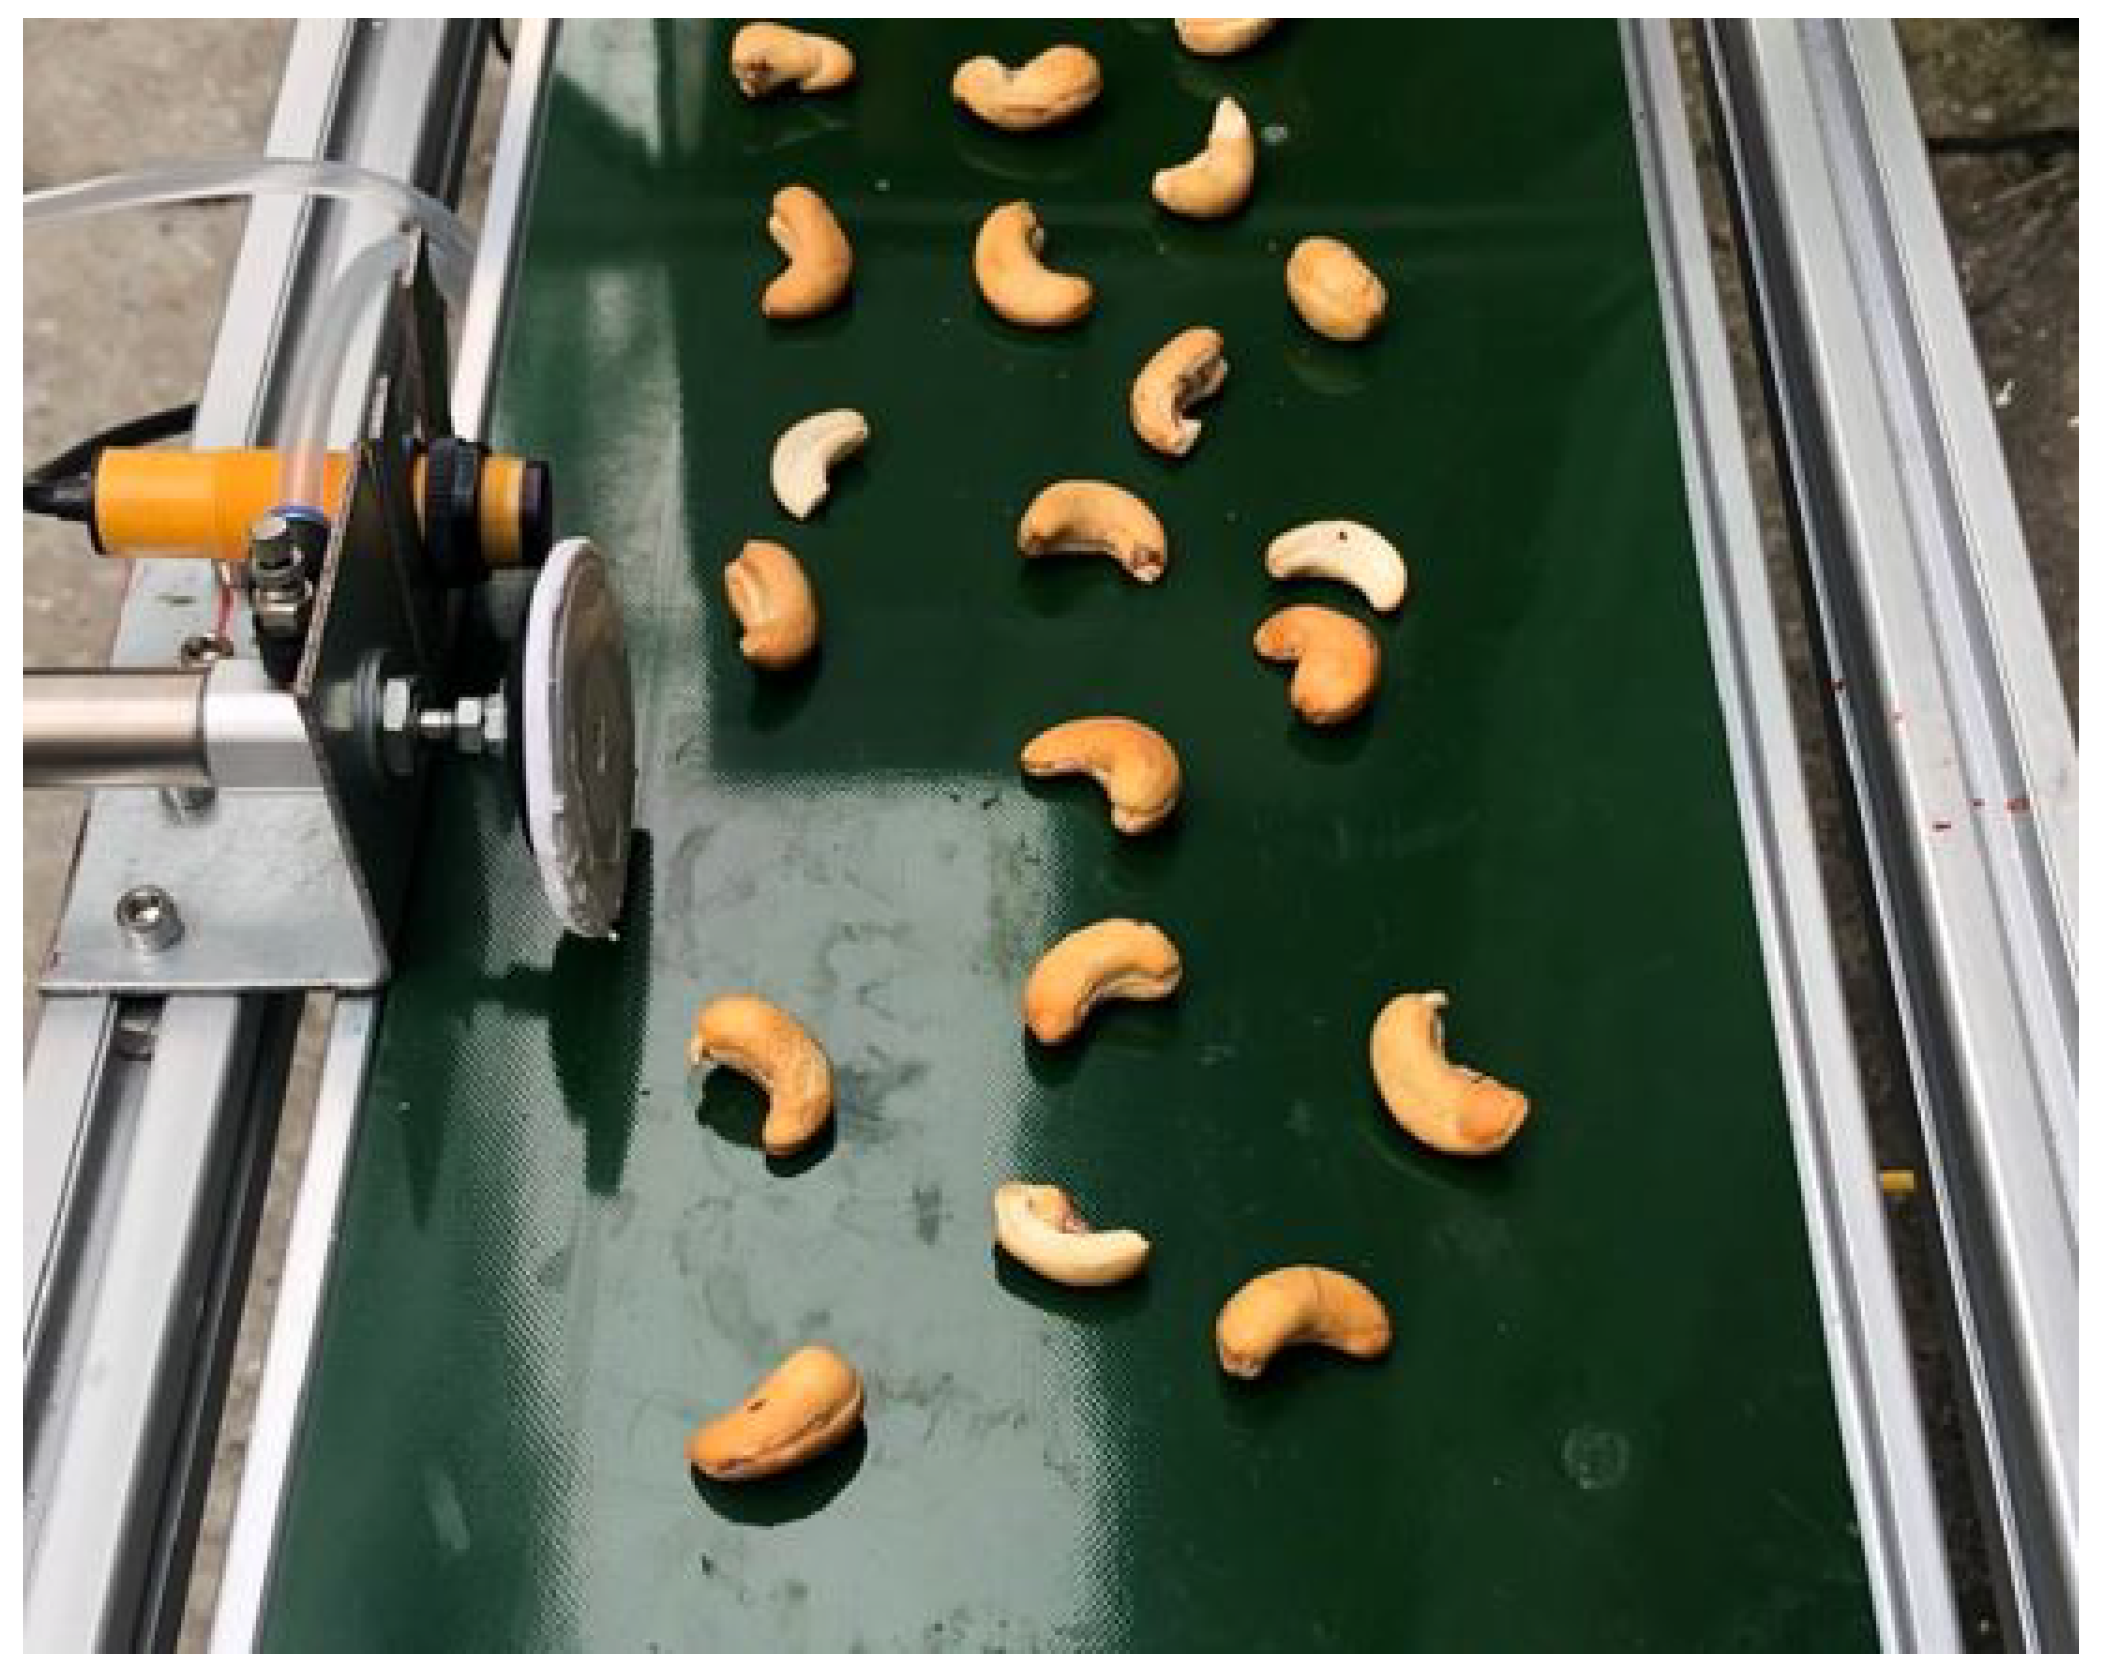
2.2. Data Collection for Building an Efficient Classification Model

Before discussing a deep learning method for effectively recognizing quality of cashew nuts, in this section, we present how the image data were gathered for building the classification model. By using the developed grading system, as shown in Figure 2, we collected 6000 images of different nuts from around 9 kg of products that were harvested in the middle region of Vietnam in 2023. Some of our collected dataset are illustrated in Figure 5. In our data collection experiments, the camera was set to automatic mode, where the camera settings such as white balance, exposure time, etc., were automatically adjusted. The focus adjustment was also made automatically. From our observations in the cashew nut production, particularly in Vietnam, it can be seen that there are four typical grades of the cashew nut products that need to be classified for the different purposes, and we define these grades as follows.
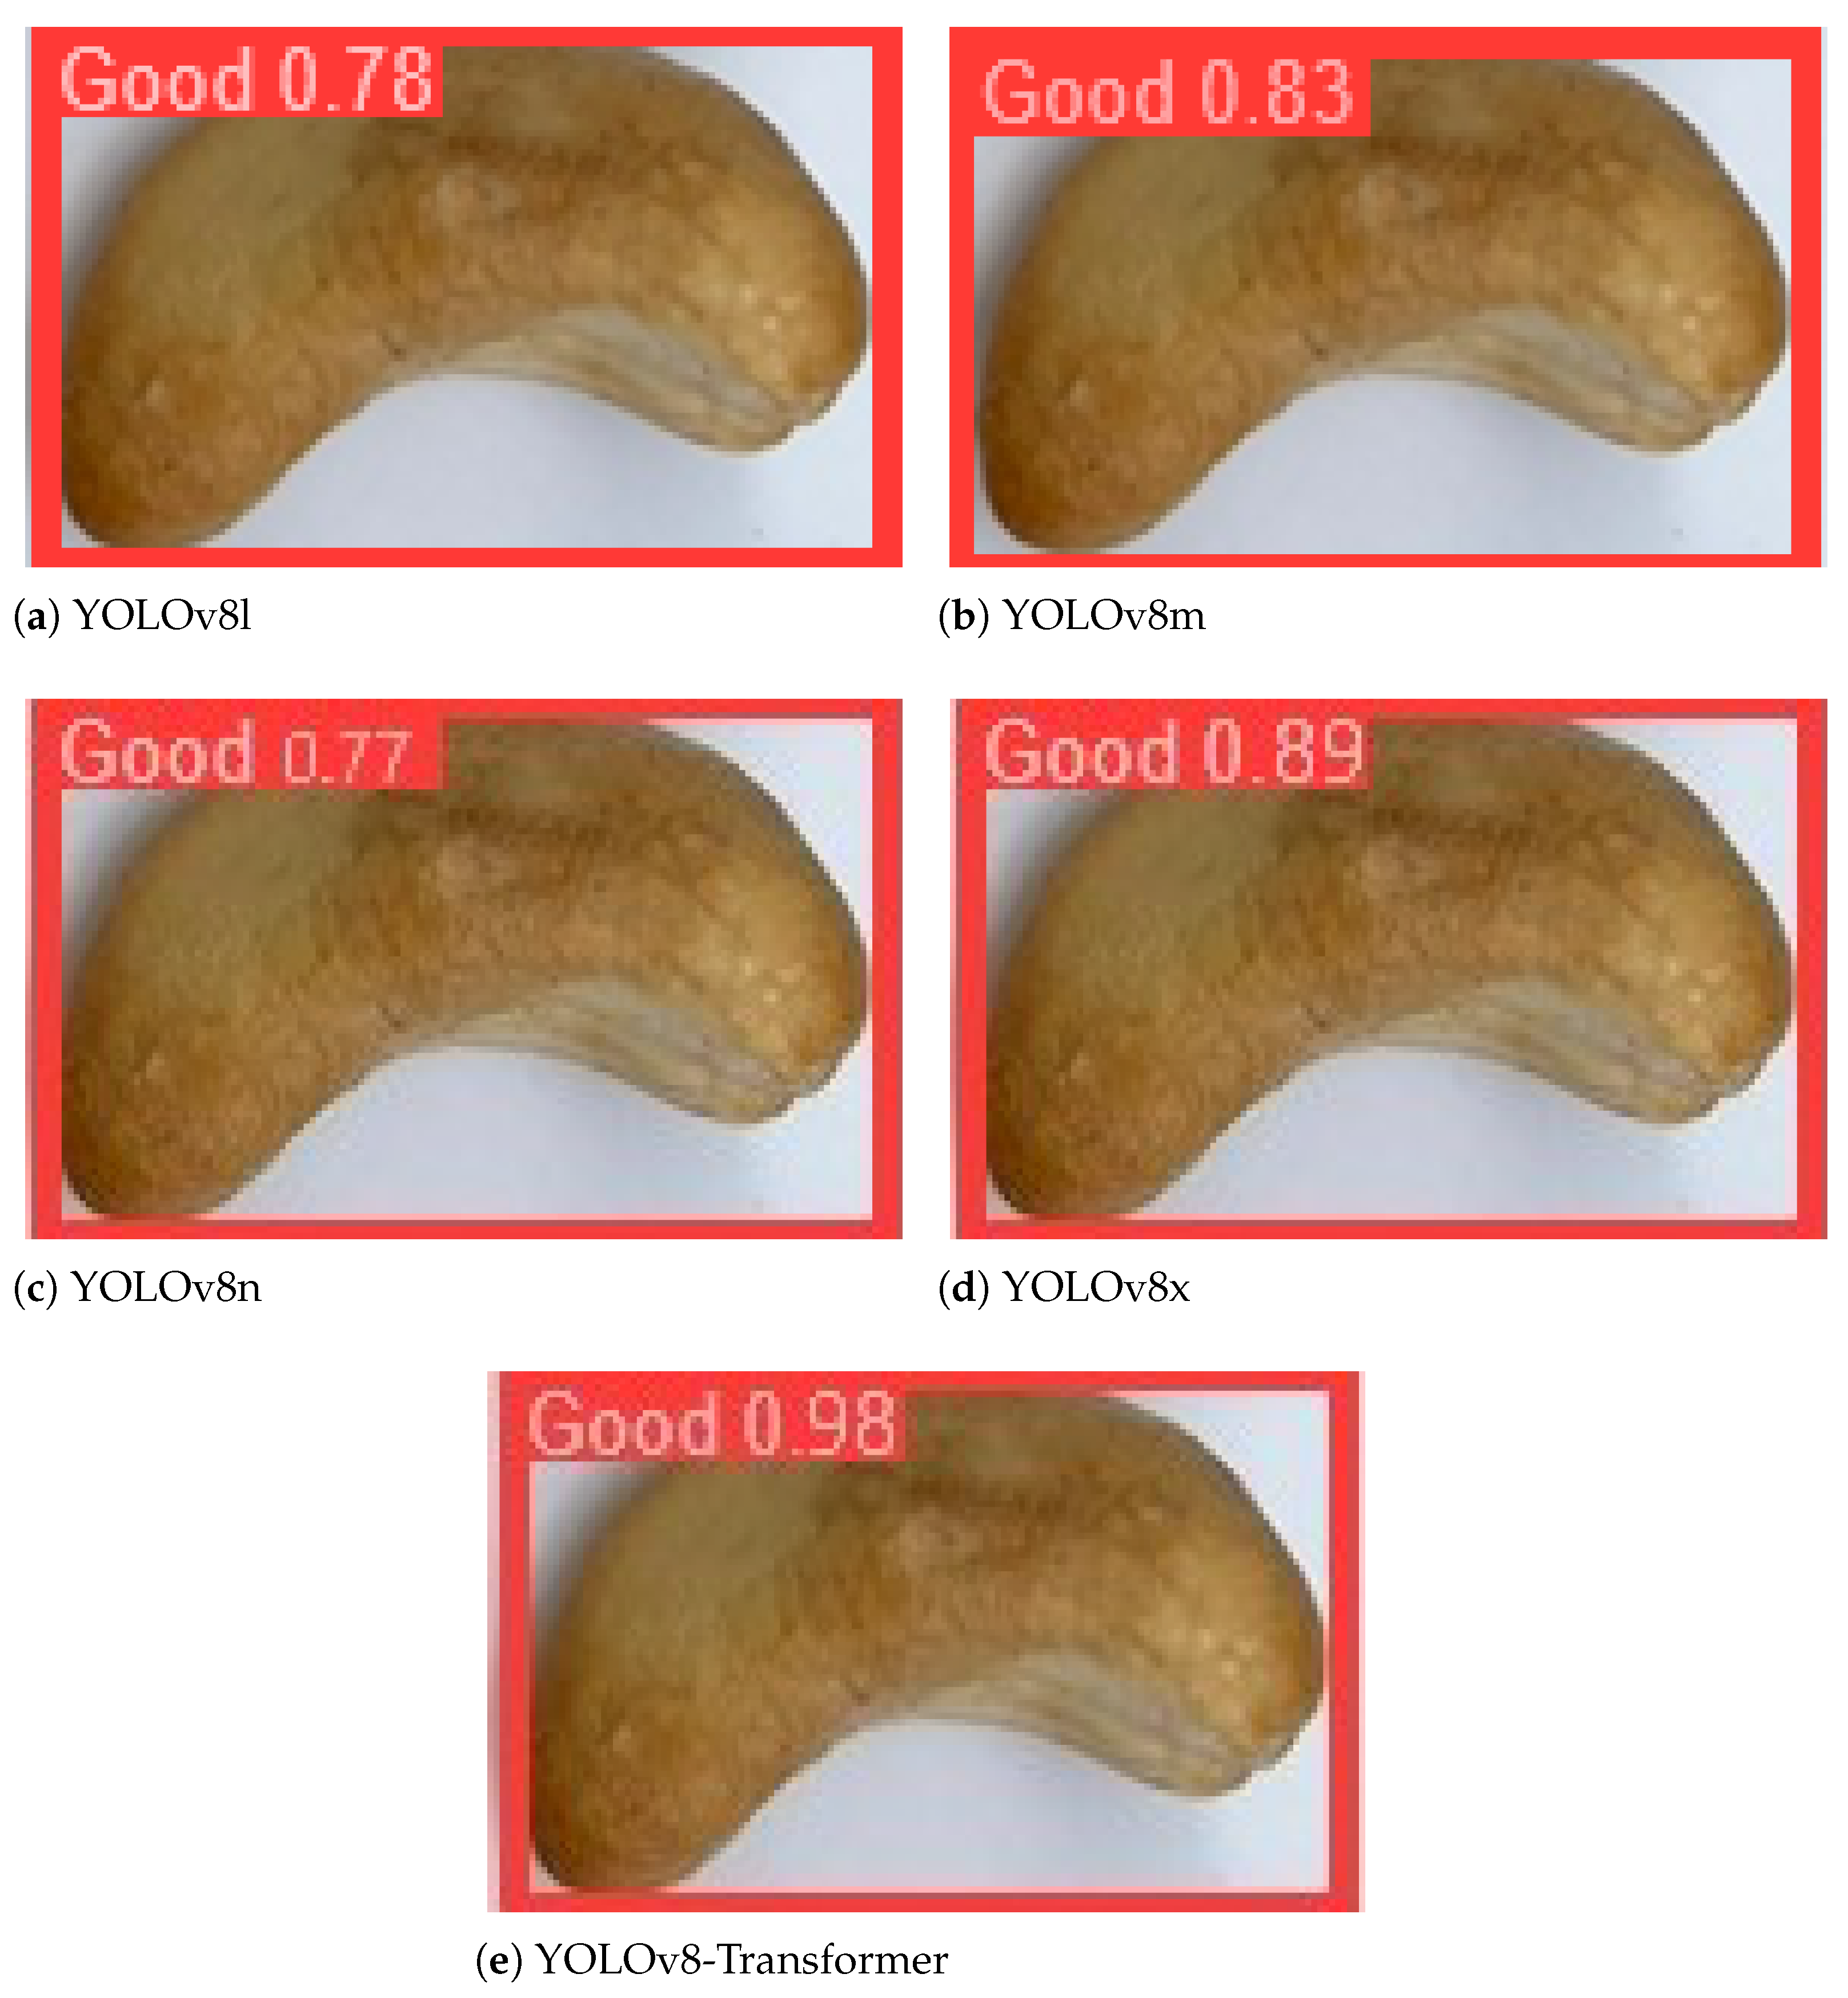
  • The “good” grade includes the products that are white/light ivory in color, not cracked or broken, and fully peeled, as shown in Figure 5a.
  • The “error 1” grade includes the products that are partly cracked or broken at the edges, as illustrated in Figure 5b.
  • The “error 2” grade includes the products that are not fully peeled, as depicted in Figure 5c.
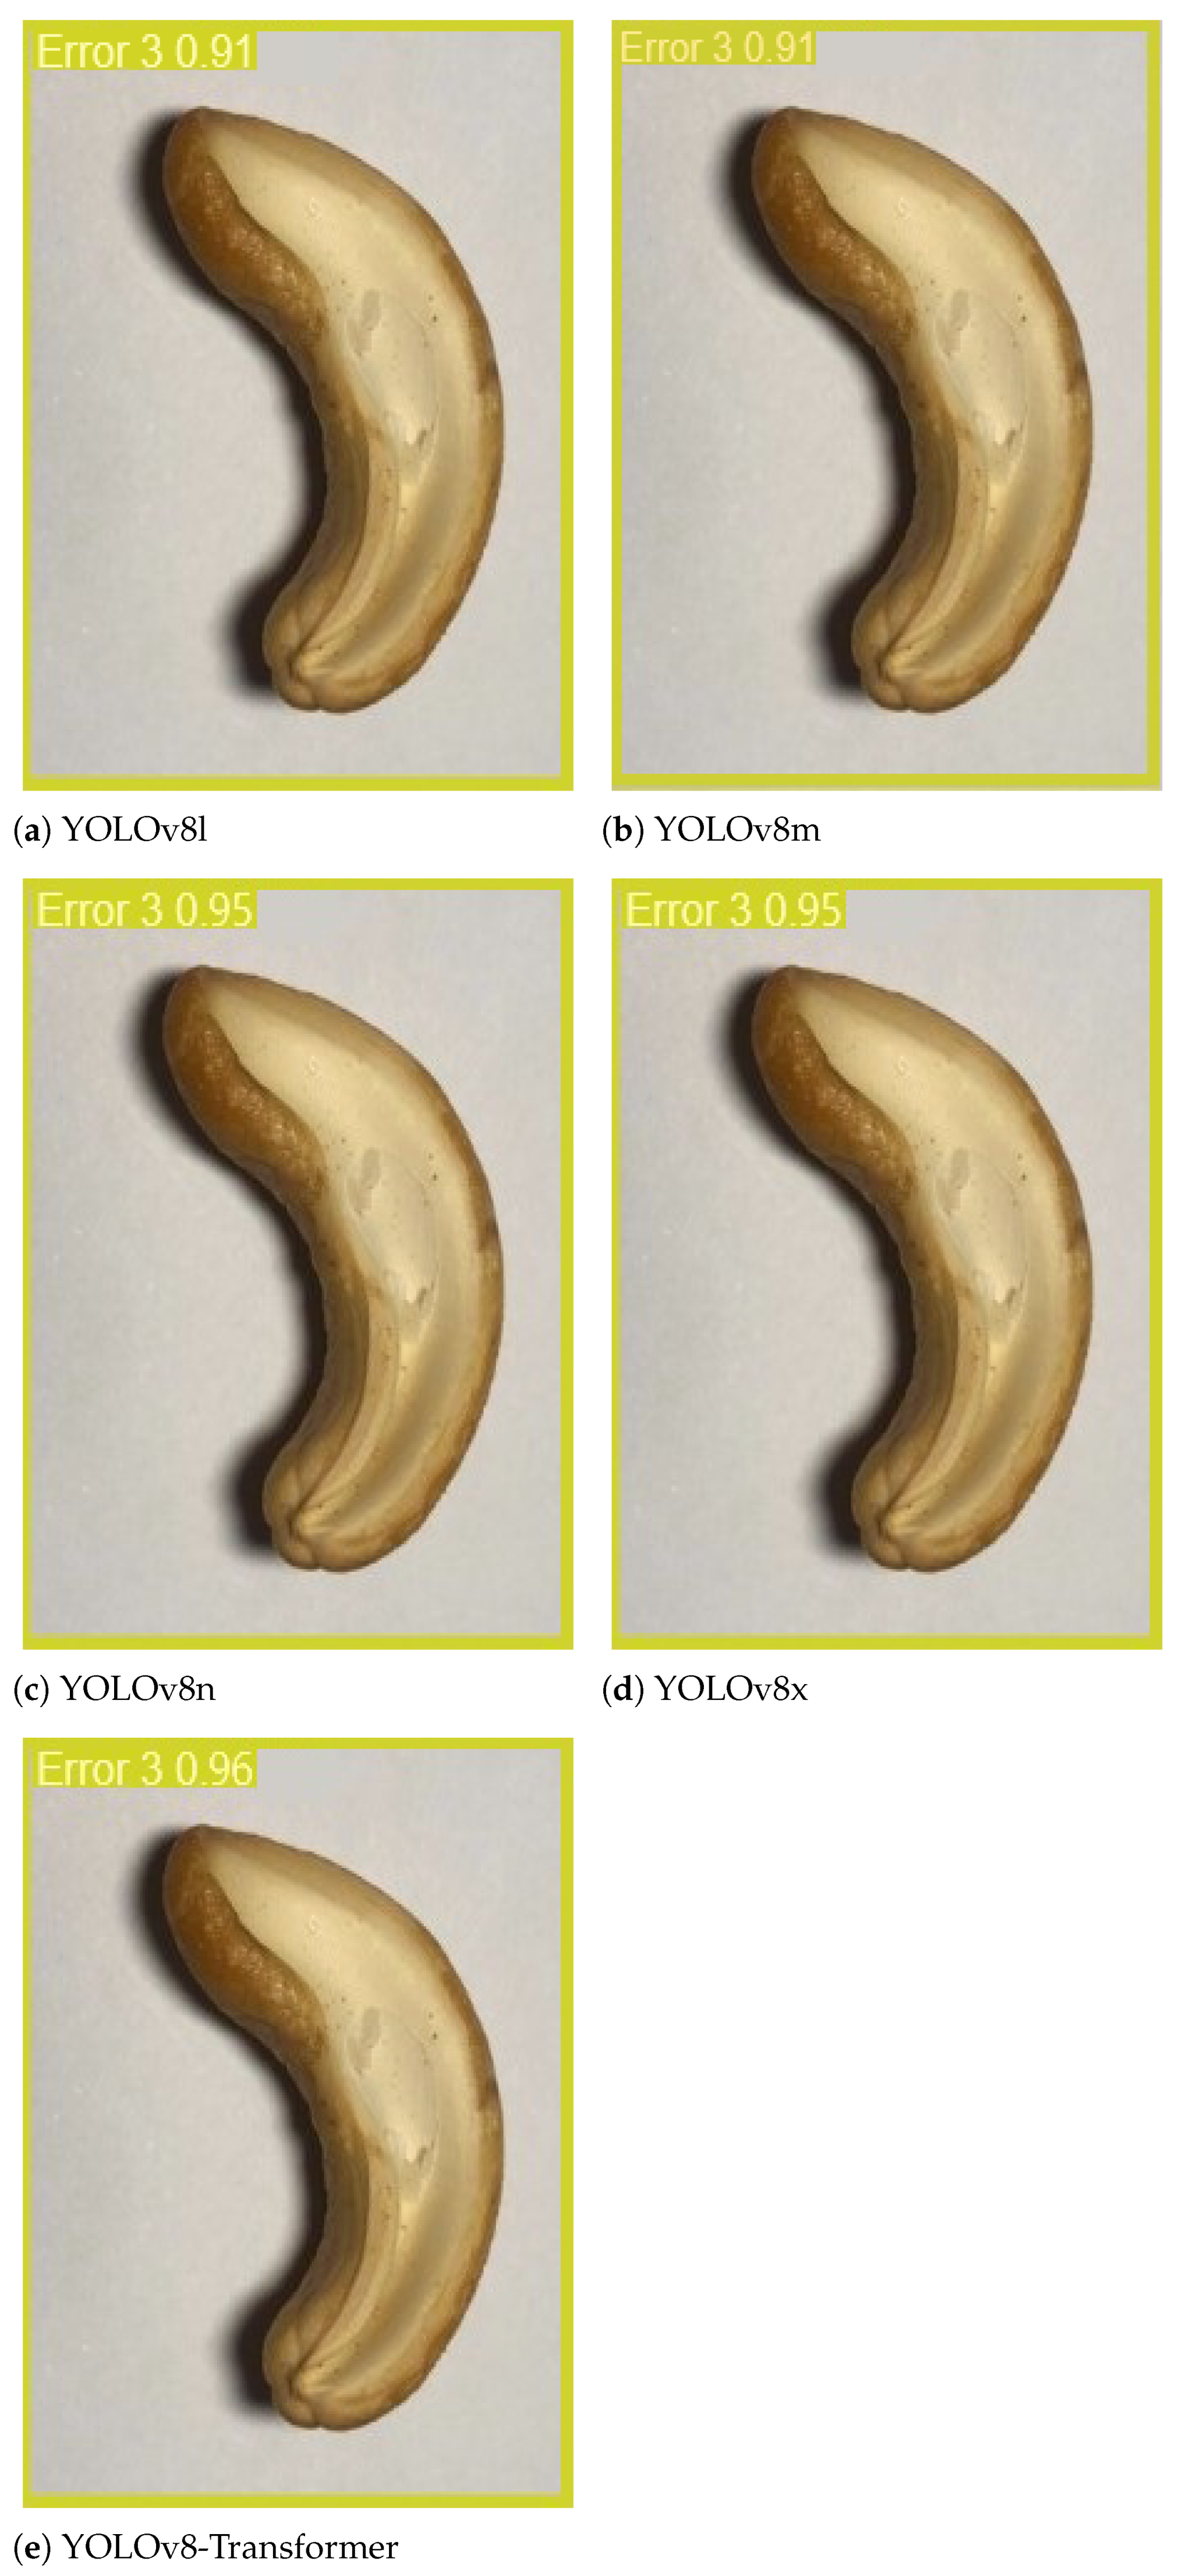
  • The “error 3” grade includes the products that are almost half cracked or broken, as demonstrated in Figure 5d.
The cashew nut products that are in pieces smaller than the above grades are not considered in this work. For each aforementioned cashew nut grade, we gathered 1500 images for evaluating the proposed classifier in this work.
The good grade can be sold to customers at the best price while the error 1 grade is also able to be sold, but at a lower price. The error 2 grade needs to be returned to the producer for further peeling; and the error 3 grade can be used in another food industry.
Sorting a cashew nut into one of the above grades is quite an easy job for a normal worker. However, it can also be a daunting and time-consuming job when faced with a significantly large quantity. More importantly, using more workers in the production makes the products more expensive when being delivered to customers, reducing competitiveness of the product in the world market. This presents a need to have an automatic sorting system, as we developed in Figure 2. One of the most important components in the sorting system is the classifier that can autonomously classify any cashew nut passing on the conveyor into one of the four grades, given its image captured by a camera. Therefore, by taking advantage of both the YOLOv8 and Transformer architectures in the deep learning domain, we propose an efficient detection and classification approach for this purpose, which is discussed in detail in the following section.

2.3. An Efficient YOLOv8- and Transformer-Based Classification

In the deep learning community, while the Transformer architecture introduced in 2017 is well known in a wide variety of artificial intelligent applications, particularly in large language models, YOLOv8 was just released in 2023. However, since YOLOv8 is built based on the success of the previous versions in the YOLO family, it is still a cutting-edge model with a lot of newly updated features and improvements to increase its performance in a flexible manner. Though each architecture is highly efficient in many applications, it has received attention for combining the backbones of these two models for producing more precise and efficient results in object detection applications. For instance, in our previous work [45], given this combination, we successfully developed an algorithm to efficiently detect humans in images captured by unmanned aerial vehicles, even at high altitude. Thus, in this work, we further extend the scheme for applications in precision agriculture, specifically recognizing the quality of cashew nuts given their image data.
YOLOv8 is highly efficient as it has been updated with a new loss function, a new anchor-free detection head, and a new backbone network [38]. In fact, in its backbone network, YOLOv8 now possesses a new module, called C2f, rather than the concentrated-comprehensive convolution (C3) module in its predecessors. The C2f module structure can be seen in Figure 6, which includes a CBS (Conv + BatchNorm + SiLU) block. The CBS block is formed by a combination of three components, including convolutional (CONV) layers, batch normalization layers, and an SiLU activation function, and plays a pivotal role in feature extraction, especially in image data. The C2f module also exploits a set of the bottleneck blocks, as demonstrated in Figure 7. Utilizing the bottleneck block in the structure can effectively reduce the computational loads as well as training time since it can soften challenges caused by explosion or disappearance of the gradient in the deep networks, thereby improving the learning capacity of the model. As compared with the C3 module, by exploiting the premise proposed by the efficient layer aggregation network (ELAN) [46], the C2f structure makes the model more trainable. In other words, the ELAN architecture was proposed for optimizing an effective model where the shortest and longest gradient paths are controlled. Both the optimizing and controlling schemes then enable an even deeper network to be efficiently trained. Therefore, the C2f module can easily deal with a range of receptive fields through learning multiscale features, multilevel-nested convolution, and feature vector diversion [47].
Now, in order to implement YOLOv8 into the sorting system, as shown in Figure 1, and particularly enhance its speed and accuracy in recognizing objects in that compact system, we propose a new structure, called the SC3T module. Fundamentally, we developed the SC3T module by exploiting the spatial pyramid pooling (SPP) [32] and C3TR [48] paradigms. In other words, we propose to feed the output of the SPP block into the C3TR module to form our SC3T architecture. The structure of our proposed SC3T module is depicted in Figure 8.
In practice, the SPP module aims to address challenges caused by different sizes of input images and be eventually able to handle features of those different-sized images. In real-world applications, objects with different sizes are popular in the dataset, and it can be particularly useful if a classifier is able to recognize and detect them for classification purposes. By pooling the input feature maps in multiscale representation, the SPP block enables the classifier to extract features at different levels of abstraction. More specifically, in this work, the SPP block is executed by using kernels with a consistent stride (stride = 1) but diverse sizes (5 × 5, 9 × 9, and 13 × 13). The extracted features are then combined through the channel concatenation. By taking advantage of the Transformer, the C3TR module was proposed to be embedded into the YOLO family [49]. The C3TR module incorporates a Transformer block, as illustrated in Figure 9, at the three outputs of the detection network, coupled with a weighted concatenation. The conventional Transformer layer is employed to gather the global information from the final block of the backbone. By utilizing the path-embedding operation, the C3TR module splits an input image into the image blocks with a certain size. The split image blocks are then combined and transferred to the Transformer encoder [50] for extracting features. The Transformer encoder comprises a multihead self-attention (MSA) mechanism, updating and concatenating query, key, and value vectors that contain the global feature information from different subspaces for the linear projection. The self-attention mechanism has been proven to be effective in capturing contextual information and minimizing global information loss. Ultimately, the features undergo processing through a multilayer perceptron (MLP) to enhance the expression of the self-attention mechanism.
In our whole architecture for efficiently classifying quality of cashew nuts, we propose to integrate the SC3T module into the final layer of the backbone network, as can be seen in Figure 10. On the other hand, to increase performance of the feature extraction during the downsampling, we also propose to implement the focus module in the initial layer of the whole model (Figure 10). As demonstrated in Figure 11, the focus module conducts slice operations on the input images, which allows the spatial information to be transferred to the channel dimension for faster inference without penalty in prediction accuracy.
Overall, taking advantage of both the YOLOv8 and Transformer structures to build a YOLOv8–Transformer architecture for efficiently classifying quality of cashew nuts, the proposed model brings multiple benefits to the applications. First, it can be implemented in a compact device of the sorting system with high accuracy in the classification results. Second, the model can effectively deal with challenges in extracting features of the input images with different sizes. Third, the proposed structure can well handle issues regarding explosion or disappearance in the gradient, and, fourth, the number of the parameters in the proposed model are reduced, which also reduces computational loads and is suitable for embedded systems.
The proposed algorithm is also presented in algebraic steps in Appendix A.

3. Results and Discussions

3.1. Metrics for Performance Evaluation in Classification

In order to verify effectiveness of the proposed approach, we propose to exploit the common metrics that are widely used in evaluating performance of an machine learning model in object recognition and classification. The experimental metrics include precision, recall, average precision (AP), and mean average precision (mAP). Moreover, we also report values of the loss functions and metrics along the training iterations.
First, precision is considered as the accuracy of the positive predictions. That is, it is defined as the ratio of the number of true positive samples predicted correctly by the model to the total number of positively predicted samples. Precision can be mathematically calculated as follows:
p r e c i s i o n = T P T P + F P ,
where T P is the number of true positives while F P is the number of false positives. Recall presents the ability of the learning model in terms of predicting all instances among all existing targets. It is computed by
r e c a l l = T P T P + F N ,
where F N is the number of false negatives.
From the definitions of both the precision and recall, it can be seen that the higher the precision, the lower the recall. Therefore, it is often convenient to combine these metrics in a single quantity called F 1 -score, which is considered as the harmonic mean of both precision and recall. The F 1 -score can be calculated by
F 1 = 2 × p r e c i s i o n × r e c a l l p r e c i s i o n + r e c a l l .
In evaluation of a classifier, F 1 -score is only high when both precision and recall are high.
Both the precision and recall metrics can also be pictorially presented together through the precision–recall curve. To quantify how good or bad the curve is, another metric, called average precision (AP), can be computed by
A P = 0 1 P ( R ) d R ,
where P ( R ) is the precision–recall curve, and the calculation is integration of the curve when the recall is ranging from 0 to 1. In other words, AP is the total area under the curve. If the recall value increases, a good model can maintain a high precision.
In reality, each application may have multiple classes. In that case, we can compute the AP for each class and then average all the AP values to another quantity called mean AP (mAP). mAP is the average precision across all the predicted classes and can be specified as follows:
m A P = 1 N i = 1 N A P i ,
where N is the number of classes.
In terms of recognizing an object in image data, apart from classifying the object to a correct class, the model should also be able to accurately predict the location of the object on images. In that case, the intersection over union (IoU) criterion can be utilized along with the mAP to measure performance of the model. For instance, if the IoU is set to a threshold of 0.5, the corresponding mAP can be presented as mAP@0.5 (or mAP50). When the mAP is calculated with different IoU thresholds such as 0.5, 0.55, …, 0.95, the overall metric should be an average of all these mAPs, and the metric should be noted as mAP@0.5:0.95 (or mAP50-95).
All these metrics will be employed to evaluate our approach in this work; the higher the calculated metrics values are, the better the model performs. The real values of the metrics obtained by the experiments are discussed in the following section.

3.2. Results and Discussion

To demonstrate the effectiveness of the proposed approach, as discussed in Section 2.3, we conducted the experiments given the dataset collected by our sorting system, as presented in Section 2.2. Out of the collected dataset (6000 images), we randomly selected 270 samples (images) for the testing while the remaining (5730 images) were utilized in the training of the proposed model. In this section, we present the obtained results for the evaluation metrics introduced in Section 3.1.
For reproducibility of the proposed approach in Section 2.3, it is expected that the proposed YOLOv8–Transformer model is trained and tested in the data that are collected by the same image acquisition system, e.g., camera. In other words, when an end-user wants to apply the proposed approach in a grading system, they should first collect image data by the camera mounted in that grading system to train the YOLOv8–Transformer model. Once the model has been trained, they upload it to the grading system to conduct grading cashew nuts given their images captured by the same camera in the system.
An image acquisition system can have different settings. However, if the camera settings are set to automatic mode, the proposed method is more practical since it is easy for end-users. On the other hand, all characteristics of the image acquisition system are also captured in the images, which can be learned by the model. That is, we exploit the learning ability of the model to learn not only information in the images but also properties of the camera, being included in one package called the trained model. The trained model can then perform very well in the testing as long as the testing images are captured by the same camera in the training.
This section also reports the results of the model obtained along the training iterations. For the comparison purposes, we implemented four other baseline methods, including YOLOv8l, YOLOv8m, YOLOv8n, and YOLOv8x [38]. As we propose an approach based on both the YOLOv8 and Transformer structures, we call our classifier the YOLOv8–Transformer model. In other words, the results obtained by five models will be discussed, and it is expected that our YOLOv8–Transformer model will outperform the baseline ones. All the experiments were conducted on the Google Colab, programmed through Python with the Ultralytics package. All the parameters of the models were computed through the training step. The training was optimized by the use of the Ultralytics library. All five models were also tested on that platform.
First, we summarize the training indicators over epochs obtained by our YOLOv8—Transformer model in Figure 12. There is a set of three loss functions used in this work, including the bounding box regression loss (mean square error), the classification loss (cross entropy), and the distribution focal loss. While the bounding box regression loss is computed based on the complete intersection over union (CIOU), the distribution focal loss function is exploited to improve the prediction of the bounding box locations of objects, especially when their boundaries are unclear or difficult to predict. Each set of the loss functions was computed in both the training and validation stages at all the training iterations. The results are demonstrated in the first six subfigures in the left of Figure 12. It can be seen that, as expected, the values of the loss functions were reducing over the training time. More importantly, the loss values in both the training and validation stages for each function are quite similar, from which it can be understood that the model was well trained.
On the other hand, we also gathered four best (B) performance metrics during the training time, including precision, recall, mAP50, and mAP50-95, and depict them in four subfigures in the right of Figure 12. In contrast to the loss functions, these metrics were increasing over the training time and approaching one at the end of the training.
Now, we discuss the performance results in terms of the precision–recall metric obtained by five models, respectively, as shown in Figure 13. As there are four quality grades of cashew nuts we consider in this work, there are four prediction classes, including “good”, “error 1”, “error 2”, and “error 3”. In each subfigure of Figure 13, there are five precision–recall curves: four curves for four classes (“good” in blue–gray color, “error 1” in orange, “error 2” in green, and “error 3” in red), and one curve for all the classes (in bold blue). It can be seen that in all the models presented in this work, the precision and recall values are quite high, given the collected cashew nut dataset. However, if looked at closely, the precision–recall curves obtained by our proposed YOLOv8–Transformer model tightly align with the top and right boundaries of the precision–recall area, which qualitatively demonstrates that our approach outperforms four baseline methods.
We also quantified the precision and recall metrics and tabulate them in Table 1. F 1 -score is also included in the table as a harmonic mean between the precision and recall. The numerical results in the table clearly indicate outperformance of our YOLOv8–Transformer method as compared with four popular models.
We then computed the AP values for each class of the cashew nut quality grade using five models. Given the AP results, we calculated an mAP value for each model. All these precision results are summarized in Table 2. It can be clearly seen that our proposed approach could provide the best precision in the prediction results of every single class. More interestingly, the mAP results also indicate that our YOLOv8–Transformer model, on average, could predict the cashew nuts via their images to the correct quality grades with an accuracy of 98.4%. This result is the most accurate prediction among those obtained by all the models implemented in our collected dataset.
The proposed model is expected to be able to detect a cashew nut with a correctly predicted bounding box and classify it to a correct quality grade class. To demonstrate that our approach can perform well in all these tasks in one attempt with high accuracy, we present some examples of the detection and classification results for four quality grades in Figure 14, Figure 15, Figure 16 and Figure 17, respectively. For the comparison purposes, we also summarized the corresponding results obtained by the other models and report them alongside our model results in each figure. And in the prediction results, each image of the cashew nut has a label with the predicted quality grade class and a probability that the method is certain about its prediction.
Figure 14, Figure 15, Figure 16 and Figure 17 show that in all these examples, our proposed model was able to accurately detect the nuts in the images and correctly predict their locations through the bounding boxes. More importantly, the model could efficiently classify the detected nuts in the correct quality grade classes. The certainties of the predictions obtained by our approach are very high, about 90%, 97%, 98%, and 96% in four cases, which are all higher than those of the baseline models.
Last, but not least, we conducted testing our training model on 270 random images that were not included in the training step. In fact, we wanted to test generalization of the trained model in the new data. That is, it is expected, when implemented in the sorting system, that the trained model should be able to effectively classify the cashew nuts through a stream of new images to the correct quality grades. The testing results, as compared with four other models, are tabulated in Table 3. The confusion matrix obtained by our proposed model is also depicted in Figure 18. It can be seen that our proposed method was able to detect and accurately classify the nuts in 262 out of 270 into the correct quality grades, with an overall error of 2.96%. The incorrect prediction rate is much lower than those obtained by four baseline techniques. Some incorrect classifications might be caused by the low-quality images captured by our low-cost camera; in future work, we will improve the model further to deal with those issues.

4. Conclusions

Advanced technologies are being more and more widely employed in precision agriculture, aiming to deal with labor shortages as well as reduce price of agricultural products. To further improve advancements in agriculture, we proposed a low-cost system for grading cashew nuts by the use of the off-the-shelf equipment. The challenging part of the grading system is determining how to correctly classify the nuts into different grades, given resource constraints in the hardware. To address the challenges when implementing the detection and classification task in a cashew nut grading system, in this paper, we also presented an efficient and compact classifier by exploiting advantages of both the YOLOv8 and Transformer architectures. In other words, a new module, called SC3T, was introduced with an integration of the Transformer block, which was then embedded in the backbone of the YOLOv8 structure. The proposed YOLOv8–Transformer model was evaluated by employing the data captured by a low-cost camera in our developed cashew nut sorting system. The obtained results are highly accurate, which demonstrates the high performance of our approach as compared with the baseline methods in all the key performance criteria, including F1-score, precision, recall, AP, and mAP.
In future works, we plan to conduct more experiments and evaluation to validate the robustness of the proposed approach across different environmental conditions and variations in cashew nut characteristics. Moreover, more data will be collected to retrain the model to avoid any overfitting, if any. On the other hand, we will also extend and verify the proposed model in grading other types of nuts, including peanuts, walnuts, hazelnuts, almonds, etc., to validate its broader applicability in the food industry.

Author Contributions

Conceptualization, V.-N.P., Q.-H.D.B., Q.-M.N. and L.N.; methodology, V.-N.P., Q.-H.D.B. and L.N.; software, Q.-H.D.B.; validation, V.-N.P. and Q.-M.N.; formal analysis, D.-A.T.L. and D.D.V.; investigation, D.-A.T.L., Q.-M.N. and L.N.; resources, D.-A.T.L. and D.D.V.; data curation, D.-A.T.L. and D.D.V.; writing—original draft preparation, V.-N.P. and Q.-H.D.B.; writing—review and editing, L.N.; visualization, Q.-M.N.; funding acquisition, D.D.V. All authors have read and agreed to the published version of the manuscript.

Funding

This research received no external funding.

Data Availability Statement

The raw data supporting the conclusions of this article will be made available by the authors on request.

Conflicts of Interest

The authors declare no conflicts of interest.

Abbreviations

The following abbreviations are used in this manuscript:
YOLOYou Only Look Once
RGBRed, green, blue
CBSConv + BatchNorm + SiLU
CPUCentral processing unit
GPUGraphics processing unit
TNTrue positive
FNFalse negative
APAverage precision
mAPMean average precision
ELANEfficient layer aggregation network
CIoUComplete intersection over union
SPPSpatial pyramid pooling

Appendix A. Steps in the Proposed Algorithm

  • Building Model Step
    (a)
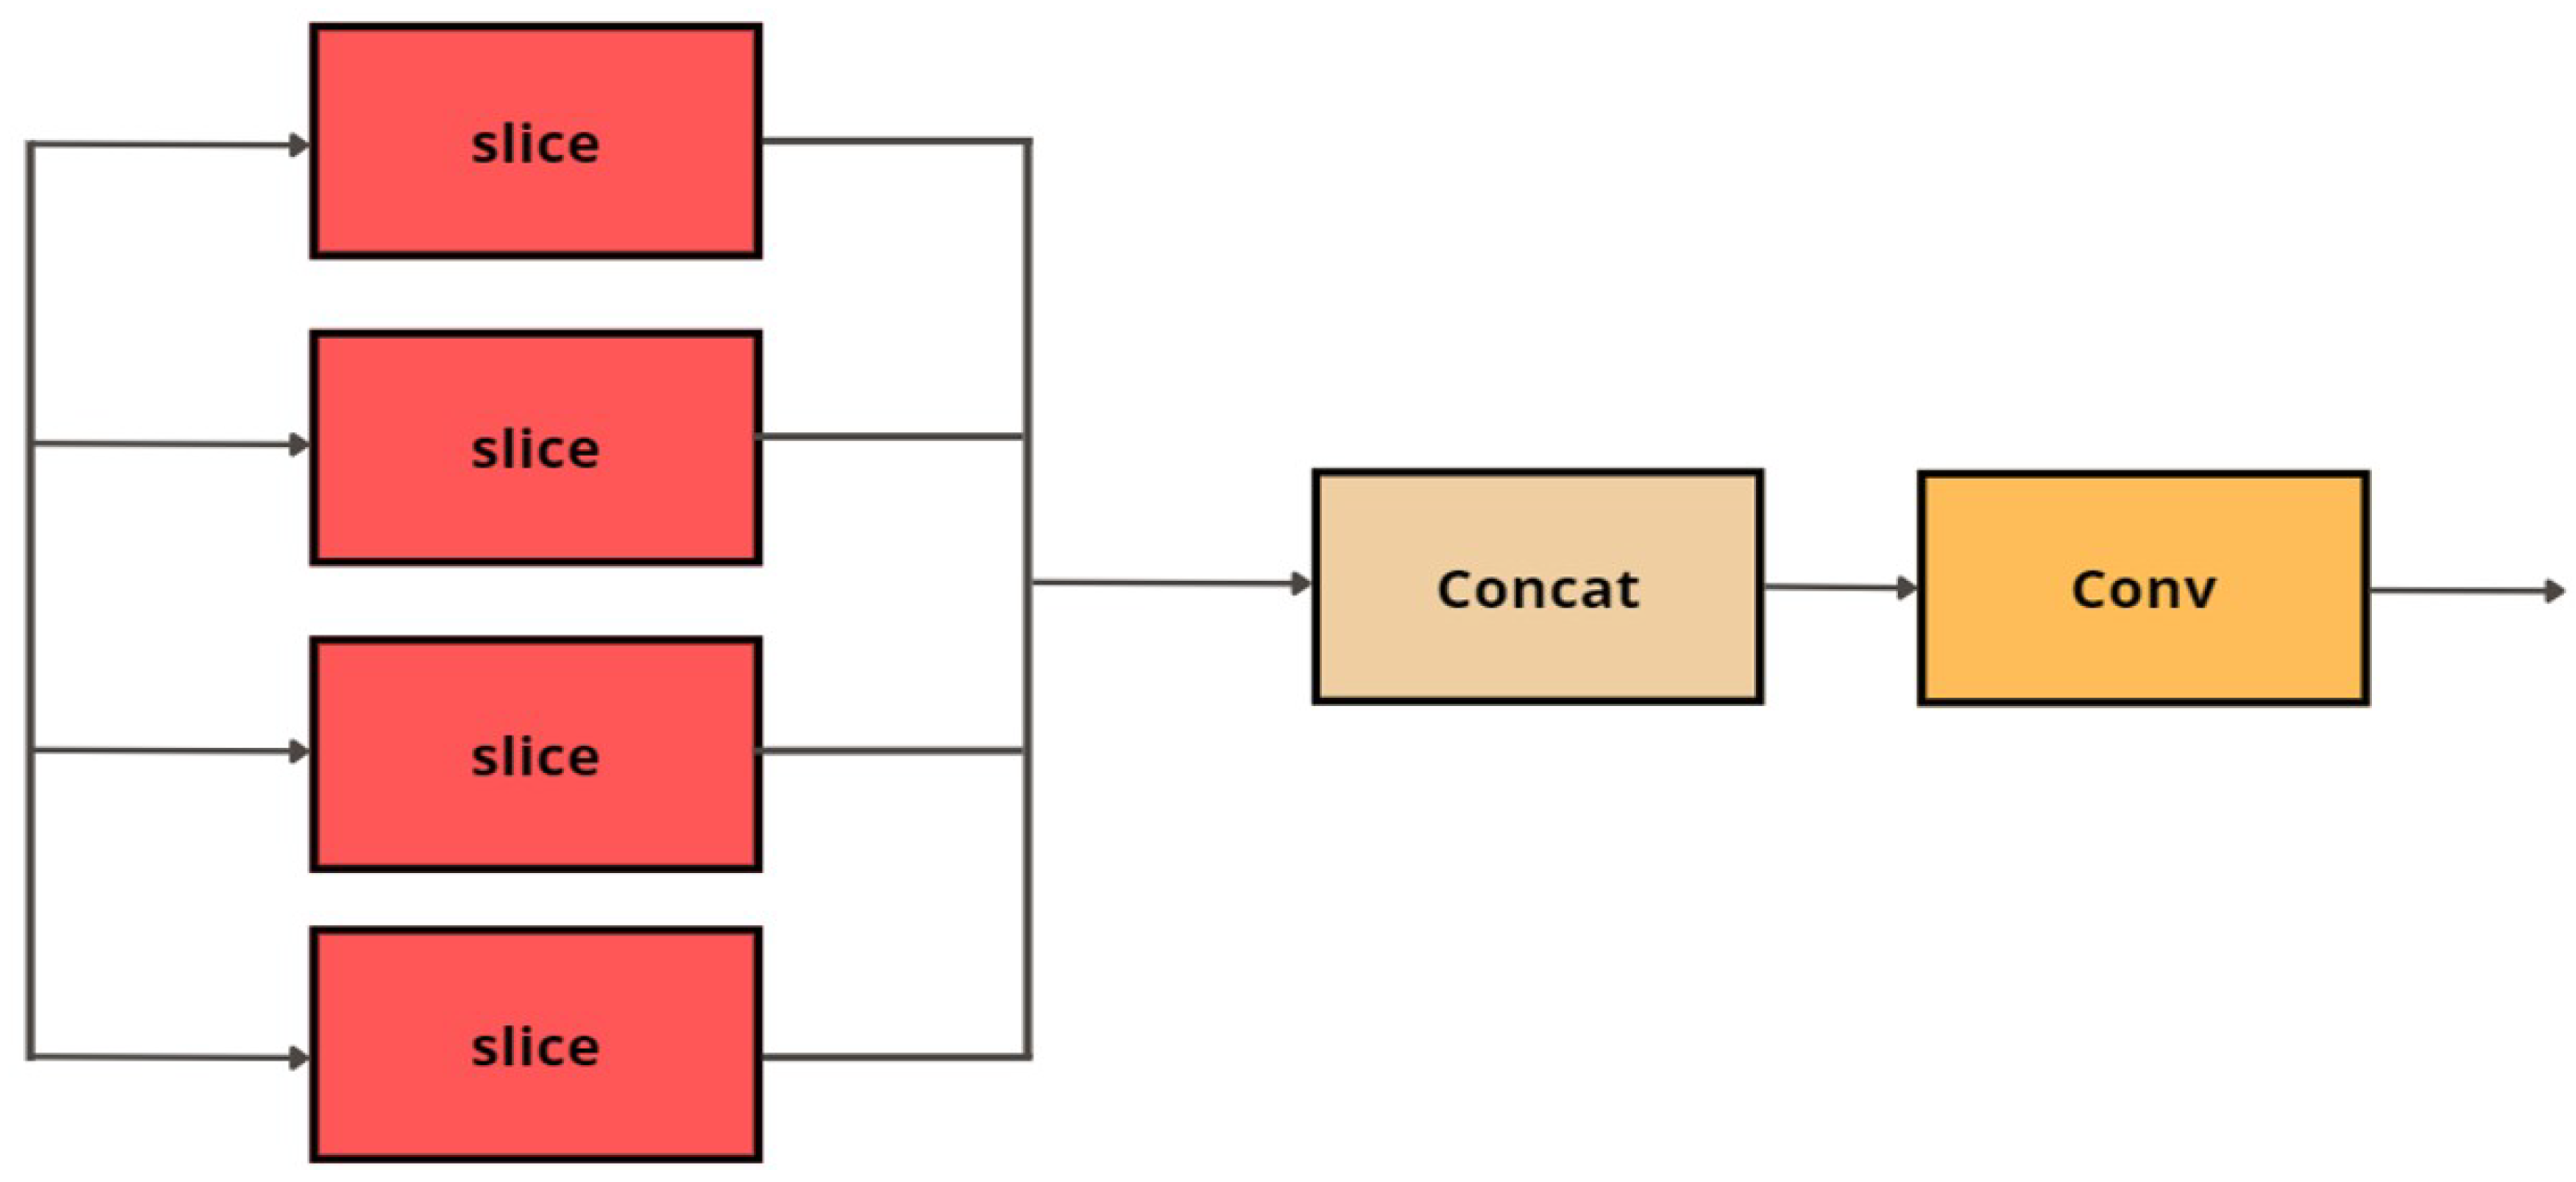
    Construct the SC3T module as presented in Figure 8.
    i.  
    Set the spatial pyramid pooling (SPP) block as an input of SC3T.
    ii. 
    Set all stride for kernels in the SPP block to 1.
    iii.
    Set the kernels of the SPP block to different sizes of 5 × 5, 9 × 9, and 13 × 13. The setup allows the proposed algorithm to accept any image with different sizes as input.
    iv. 
    Connect output of the SPP block to the C3TR block. The Transformer is used to update and concatenate query, key and value vectors to form the global feature information from different subspace for linear projection.
    (b)
    Implement the SC3T module into the the final layer of the backbone network of YOLOv8 as illustrated in Figure 10.
  • Training Model Step
    (a)
    Prepare cashew nut image data. Images can be captured by a low-cost camera sensor, which is normally employed in a low-cost agricultural system.
    • Label each image with a cashew nut grade.
    (b)
    Implement the model in a training platform such as Python.
    (c)
    Train the model given the dataset on a powerful computer to speed up the training step.
  • Implementation Step
    (a)
    Download the trained model.
    (b)
    Implement the trained model on an onboard computer in the cashew nut grading machine.
    (c)
    Input any cashew nut image captured by the camera sensor in the cashew nut grading machine into the trained model for prediction.

References

  1. Gonçalves, B.; Pinto, T.; Aires, A.; Morais, M.C.; Bacelar, E.; Anjos, R.; Ferreira-Cardoso, J.; Oliveira, I.; Vilela, A.; Cosme, F. Composition of nuts and their potential health benefits—An overview. Foods 2023, 12, 942. [Google Scholar] [CrossRef] [PubMed]
  2. Alasalvar, C.; Salvadó, J.S.; Ros, E. Bioactives and health benefits of nuts and dried fruits. Food Chem. 2020, 314, 126192. [Google Scholar] [CrossRef] [PubMed]
  3. Oliveira, N.N.; Mothé, C.G.; Mothé, M.G.; de Oliveira, L.G. Cashew nut and cashew apple: A scientific and technological monitoring worldwide review. J. Food Sci. Technol. 2020, 57, 12–21. [Google Scholar] [CrossRef] [PubMed]
  4. Berry, A.; Sargent, S. Cashew apple and nut (Anacardium occidentale L.). In Postharvest Biology and Technology of Tropical and Subtropical Fruits; Yahia, E.M., Ed.; Woodhead Publishing Series in Food Science, Technology and Nutrition; Woodhead Publishing: Cambridge, UK, 2011; pp. 414–423e. [Google Scholar] [CrossRef]
  5. Charlton, D.; Kostandini, G. Can technology compensate for a labor shortage? Effects of 287 (g) immigration policies on the US dairy industry. Am. J. Agric. Econ. 2021, 103, 70–89. [Google Scholar] [CrossRef]
  6. Nguyen, D.K.; Nguyen, L.; Le, D.V. A Low-Cost Efficient System for Monitoring Microalgae Density using Gaussian Process. IEEE Trans. Instrum. Meas. 2021, 70, 7504308. [Google Scholar] [CrossRef]
  7. Nguyen, D.K.; Nguyen, H.Q.; Dang, H.T.T.; Nguyen, V.Q.; Nguyen, L. A low-cost system for monitoring pH, dissolved oxygen and algal density in continuous culture of microalgae. HardwareX 2022, 12, e00353. [Google Scholar] [CrossRef]
  8. Nguyen, L.; Nguyen, D.K.; Nghiem, T.X.; Nguyen, T. Least square and Gaussian process for image based microalgal density estimation. Comput. Electron. Agric. 2022, 193, 106678. [Google Scholar] [CrossRef]
  9. Arakeri, M.; Lakshmana. Computer Vision Based Fruit Grading System for Quality Evaluation of Tomato in Agriculture industry. Procedia Comput. Sci. 2016, 79, 426–433. [Google Scholar] [CrossRef]
  10. Yossy, E.H.; Pranata, J.; Wijaya, T.; Hermawan, H.; Budiharto, W. Mango Fruit Sortation System using Neural Network and Computer Vision. Procedia Comput. Sci. 2017, 116, 596–603. [Google Scholar] [CrossRef]
  11. Tian, Y.; Yang, G.; Wang, Z.; Wang, H.; Li, E.; Liang, Z. Apple detection during different growth stages in orchards using the improved YOLO-V3 model. Comput. Electron. Agric. 2019, 157, 417–426. [Google Scholar] [CrossRef]
  12. Yan, B.; Fan, P.; Lei, X.; Liu, Z.; Yang, F. A Real-Time Apple Targets Detection Method for Picking Robot Based on Improved YOLOv5. Remote Sens. 2021, 13, 1619. [Google Scholar] [CrossRef]
  13. Behera, S.K.; Rath, A.K.; Mahapatra, A.; Sethy, P.K. Identification, classification & grading of fruits using machine learning & computer intelligence: A review. J. Ambient. Intell. Humaniz. Comput. 2020. [Google Scholar] [CrossRef]
  14. Liu, G.; Nouaze, J.C.; Touko Mbouembe, P.L.; Kim, J.H. YOLO-Tomato: A Robust Algorithm for Tomato Detection Based on YOLOv3. Sensors 2020, 20, 2145. [Google Scholar] [CrossRef] [PubMed]
  15. Jhawar, J. Orange Sorting by Applying Pattern Recognition on Colour Image. Procedia Comput. Sci. 2016, 78, 691–697. [Google Scholar] [CrossRef]
  16. Jin, X.; Sun, Y.; Che, J.; Bagavathiannan, M.; Yu, J.; Chen, Y. A novel deep learning-based method for detection of weeds in vegetables. Pest Manag. Sci. 2022, 78, 1861–1869. [Google Scholar] [CrossRef] [PubMed]
  17. Asif, M.K.R.; Rahman, M.A.; Hena, M.H. CNN based Disease Detection Approach on Potato Leaves. In Proceedings of the 2020 3rd International Conference on Intelligent Sustainable Systems (ICISS), Thoothukudi, India, 3–5 December 2020; pp. 428–432. [Google Scholar] [CrossRef]
  18. Bhargava, A.; Bansal, A. Fruits and vegetables quality evaluation using computer vision: A review. J. King Saud Univ. Comput. Inf. Sci. 2021, 33, 243–257. [Google Scholar] [CrossRef]
  19. Cervantes-Jilaja, C.; Bernedo-Flores, L.; Morales-Muñoz, E.; Patiño-Escarcina, R.E.; Barrios-Aranibar, D.; Ripas-Mamani, R.; Valera, H.H.A. Optimal Selection and Identification of Defects in Chestnuts Processing, through Computer Vision, Taking Advantage of its Inherent Characteristics. In Proceedings of the 2019 24th IEEE International Conference on Emerging Technologies and Factory Automation (ETFA), Zaragoza, Spain, 10–13 September 2019; pp. 513–520. [Google Scholar] [CrossRef]
  20. Sivaranjani, A.; Senthilrani, S.; Ashokumar, B.; Murugan, A.S. CashNet-15:An Optimized Cashew Nut Grading Using Deep CNN and Data Augmentation. In Proceedings of the 2019 IEEE International Conference on System, Computation, Automation and Networking (ICSCAN), Pondicherry, India, 29–30 March 2019; pp. 1–5. [Google Scholar] [CrossRef]
  21. Parvathi, S.; Tamil Selvi, S. Detection of maturity stages of coconuts in complex background using Faster R-CNN model. Biosyst. Eng. 2021, 202, 119–132. [Google Scholar] [CrossRef]
  22. Ramos, P.; Prieto, F.; Montoya, E.; Oliveros, C. Automatic fruit count on coffee branches using computer vision. Comput. Electron. Agric. 2017, 137, 9–22. [Google Scholar] [CrossRef]
  23. Ganganagowder, N.V.; Kamath, P. Intelligent classification models for food products basis on morphological, colour and texture features. Acta Agronó. 2017, 66, 486–494. [Google Scholar] [CrossRef]
  24. Islam, K.T.; Wijewickrema, S.; Pervez, M.; O’Leary, S. An Exploration of Deep Transfer Learning for Food Image Classification. In Proceedings of the 2018 Digital Image Computing: Techniques and Applications (DICTA), Canberra, Australia, 10–13 December 2018; pp. 1–5. [Google Scholar] [CrossRef]
  25. Hameed, K.; Chai, D.; Rassau, A. A comprehensive review of fruit and vegetable classification techniques. Image Vis. Comput. 2018, 80, 24–44. [Google Scholar] [CrossRef]
  26. Thakkar, M.; Bhatt, M.; Bhensdadia, C.K. Performance Evaluation of Classification Techniques for Computer Vision based Cashew Grading System. Int. J. Comput. Appl. 2011, 18, 9–12. [Google Scholar] [CrossRef]
  27. Aran, M.O.; Nath, A.G.; Shyna, A. Automated cashew kernel grading using machine vision. In Proceedings of the 2016 International Conference on Next Generation Intelligent Systems (ICNGIS), Kottayam, India, 1–3 September 2016; pp. 1–5. [Google Scholar] [CrossRef]
  28. Shyna, A.; George, R.M. Machine vision based real time cashew grading and sorting system using SVM and back propagation neural network. In Proceedings of the 2017 International Conference on Circuit, Power and Computing Technologies (ICCPCT), Kollam, India, 20–21 April 2017; pp. 1–5. [Google Scholar] [CrossRef]
  29. Narendra, V.G.; Hareesh, K.S. Cashew kernels classification using colour features. Int. J. Mach. Intell. 2011, 3, 52–57. [Google Scholar] [CrossRef]
  30. Bochkovskiy, A.; Wang, C.Y.; Liao, H.Y.M. YOLOv4: Optimal Speed and Accuracy of Object Detection. arXiv 2020, arXiv:2004.10934. [Google Scholar]
  31. Redmon, J.; Divvala, S.; Girshick, R.; Farhadi, A. You Only Look Once: Unified, Real-Time Object Detection. In Proceedings of the IEEE Conference on Computer Vision and Pattern Recognition (CVPR), Las Vegas, NV, USA, 27–30 June 2016. [Google Scholar]
  32. Redmon, J.; Farhadi, A. YOLOv3: An Incremental Improvement. arXiv 2018, arXiv:1804.02767. [Google Scholar]
  33. Redmon, J.; Farhadi, A. YOLO9000: Better, Faster, Stronger. In Proceedings of the IEEE Conference on Computer Vision and Pattern Recognition (CVPR), Honolulu, HI, USA, 21–26 July 2017. [Google Scholar]
  34. Wang, C.Y.; Bochkovskiy, A.; Liao, H.Y.M. YOLOv7: Trainable Bag-of-Freebies Sets New State-of-the-Art for Real-Time Object Detectors. In Proceedings of the IEEE/CVF Conference on Computer Vision and Pattern Recognition (CVPR), Vancouver, BC, Canada, 17–24 June 2023; pp. 7464–7475. [Google Scholar]
  35. Diao, Z.; Guo, P.; Zhang, B.; Zhang, D.; Yan, J.; He, Z.; Zhao, S.; Zhao, C.; Zhang, J. Navigation line extraction algorithm for corn spraying robot based on improved YOLOv8s network. Comput. Electron. Agric. 2023, 212, 108049. [Google Scholar] [CrossRef]
  36. Wu, W.K.; Chen, C.Y.; Lee, J.S. Embedded YOLO: Faster and lighter object detection. In Proceedings of the 2021 International Conference on Multimedia Retrieval, Taipei Taiwan, 21–24 August 2021; pp. 560–565. [Google Scholar]
  37. Madasamy, K.; Shanmuganathan, V.; Kandasamy, V.; Lee, M.Y.; Thangadurai, M. OSDDY: Embedded system-based object surveillance detection system with small drone using deep YOLO. EURASIP J. Image Video Process. 2021, 2021, 19. [Google Scholar] [CrossRef]
  38. Jocher, G.; Chaurasia, A.; Qiu, J. YOLO by Ultralytics. 2023. Available online: https://github.com/ultralytics/ultralytics (accessed on 1 November 2023).
  39. Song, P.; Li, P.; Dai, L.; Wang, T.; Chen, Z. Boosting R-CNN: Reweighting R-CNN samples by RPN’s error for underwater object detection. Neurocomputing 2023, 530, 150–164. [Google Scholar] [CrossRef]
  40. Vaswani, A.; Shazeer, N.; Parmar, N.; Uszkoreit, J.; Jones, L.; Gomez, A.N.; Kaiser, Ł.; Polosukhin, I. Attention is all you need. Adv. Neural Inf. Process. Syst. 2017, 30, 1–11. [Google Scholar]
  41. Devlin, J.; Chang, M.W.; Lee, K.; Toutanova, K. Bert: Pre-training of deep bidirectional transformers for language understanding. arXiv 2018, arXiv:1810.04805. [Google Scholar]
  42. Dai, M.; Hu, J.; Zhuang, J.; Zheng, E. A transformer-based feature segmentation and region alignment method for UAV-view geo-localization. IEEE Trans. Circuits Syst. Video Technol. 2021, 32, 4376–4389. [Google Scholar] [CrossRef]
  43. Vietnam Cashew Nut Processing Industry. Available online: https://www.shellingmachine.com/application/Vietnam-cashew-nut-processing-industry.html (accessed on 20 February 2024).
  44. Cashew Nuts Supply Chains in Vietnam: A Case Study in Dak Nong and Binh Phuoc Provinces, Vietnam. Available online: https://agro.gov.vn/images/2007/04/Cashew_nut_Vietnam.En_(Full_document).pdf (accessed on 20 February 2024).
  45. Do, M.T.; Ha, M.H.; Nguyen, D.C.; Thai, K.; Ba, Q.H.D. Human Detection Based Yolo Backbones-Transformer in UAVs. In Proceedings of the 2023 International Conference on System Science and Engineering (ICSSE), Ho Chi Minh, Vietnam, 27–28 July 2023; pp. 576–580. [Google Scholar] [CrossRef]
  46. Wang, C.Y.; Liao, H.Y.M.; Yeh, I.H. Designing network design strategies through gradient path analysis. arXiv 2022, arXiv:2211.04800. [Google Scholar]
  47. Zhang, Z. Drone-YOLO: An Efficient Neural Network Method for Target Detection in Drone Images. Drones 2023, 7, 526. [Google Scholar] [CrossRef]
  48. Tan, X.; He, X. Improved Asian food object detection algorithm based on YOLOv5. E3S Web Conf. 2022, 360, 01068. [Google Scholar] [CrossRef]
  49. Zhang, Z.; Lu, X.; Cao, G.; Yang, Y.; Jiao, L.; Liu, F. ViT-YOLO:Transformer-Based YOLO for Object Detection. In Proceedings of the 2021 IEEE/CVF International Conference on Computer Vision Workshops (ICCVW), Montreal, BC, Canada, 11–17 October 2021; pp. 2799–2808. [Google Scholar] [CrossRef]
  50. Wang, W.; Chen, W.; Qiu, Q.; Chen, L.; Wu, B.; Lin, B.; He, X.; Liu, W. Crossformer++: A versatile vision transformer hinging on cross-scale attention. arXiv 2023, arXiv:2303.06908. [Google Scholar] [CrossRef]
Figure 1. The block diagram of the framework of the developed system for grading cashew nuts.
Computers 13 00071 g001
Figure 2. A snapshot of the developed system for grading cashew nuts.
Computers 13 00071 g002
Figure 3. The linear pneumatic actuator to sort the graded nuts on a conveyor.
Computers 13 00071 g003
Figure 4. The control unit of the developed system for grading cashew nuts.
Computers 13 00071 g004
Figure 5. Some examples of the collected dataset. (a) An image of cashew nuts with “good” grade; (b) An image of cashew nuts with “error 1” grade; (c) An image of cashew nuts with “error 2” grade; (d) An image of cashew nuts with “error 3” grade.
Computers 13 00071 g005
Figure 6. The C2f module.
Computers 13 00071 g006
Figure 7. The bottleneck block.
Computers 13 00071 g007
Figure 8. The SC3T module.
Computers 13 00071 g008
Figure 9. The Transformer block.
Computers 13 00071 g009
Figure 10. The proposed architecture for a deep learning model of efficiently classifying quality of cashew nuts given their images.
Computers 13 00071 g010
Figure 11. The focus module.
Computers 13 00071 g011
Figure 12. The training indicators over epochs obtained by our YOLOv8–Transformer model.
Computers 13 00071 g012
Figure 13. The precision–recall curves obtained by five models, respectively. Each subfigure has four curves for four classes “good” in blue–gray color, “error 1” in orange, “error 2” in green, and “error 3” in red, and one curve for all the classes (in bold blue).
Computers 13 00071 g013
Figure 14. Examples of the detection and classification results obtained by five models for the “good” grade products.
Computers 13 00071 g014
Figure 15. Examples of the detection and classification results obtained by five models for the “error 1” grade products.
Computers 13 00071 g015
Figure 16. Examples of the detection and classification results obtained by five models for the “error 2” grade products.
Computers 13 00071 g016
Figure 17. Examples of the detection and classification results obtained by five models for the “error 3” grade products.
Computers 13 00071 g017
Figure 18. The confusion matrix obtained by our proposed model.
Computers 13 00071 g018
Table 1. The results of the performance metrics including F 1 -score, precision, and recall, obtained by five models in the testing dataset. The best results are in bold.
ModelParameterF1-ScorePrecisionRecall
YOLOv8l43.7M0.9020.9080.897
YOLOv8m25.9M0.8940.8670.923
YOLOv8n3.2M0.9440.9480.940
YOLOv8x68.2M0.9200.9190.921
YOLOv8–Transformer20.5M0.9600.9600.960
Table 2. The AP results of four classes and the mAP value, obtained by five models. The best results are in bold.
ModelAP (Good)AP (Error 1)AP (Error 2)AP (Error 3)mAP
YOLOv8l0.9690.9630.9570.9720.965
YOLOv8m0.9790.9660.9590.9670.968
YOLOv8n0.9900.9720.9740.9790.979
YOLOv8x0.9720.9570.9450.9640.960
YOLOv8–Transformer0.9920.9760.9800.9860.984
Table 3. The comparison results of the testing error of the five models. The best results are in bold.
ModelNumber of Incorrect Predictions% of Incorrect Predictions
YOLOv8l165.92
YOLOv8m197.03
YOLOv8n103.70
YOLOv8x134.81
YOLOv8–Transformer82.96
Disclaimer/Publisher’s Note: The statements, opinions and data contained in all publications are solely those of the individual author(s) and contributor(s) and not of MDPI and/or the editor(s). MDPI and/or the editor(s) disclaim responsibility for any injury to people or property resulting from any ideas, methods, instructions or products referred to in the content.

