Article

User-Centered Pipeline for Synthetic Augmentation of Anomaly Detection Datasets †

by
Alexander Rosbak-Mortensen
,
Marco Jansen
,
Morten Muhlig
,
Mikkel Bjørndahl Kristensen Tøt
and
Ivan Nikolov
*
Department of Architecture, Design and Media Technology, Faculty of Science, Aalborg University, Rendsburggade 14, DK-9000 Aalborg, Denmark
*
Author to whom correspondence should be addressed.
This paper is an extended version of our paper published in Computer Graphics & Visual Computing 2023, Wales, UK, 14–15 September 2023.
Computers 2024, 13(3), 70; https://doi.org/10.3390/computers13030070
Submission received: 12 January 2024 / Revised: 30 January 2024 / Accepted: 4 March 2024 / Published: 8 March 2024
(This article belongs to the Special Issue Selected Papers from Computer Graphics & Visual Computing (CGVC 2023))

Abstract

:
Automatic anomaly detection plays a critical role in surveillance systems but requires datasets comprising large amounts of annotated data to train and evaluate models. Gathering and annotating these data is a labor-intensive task that can become costly. A way to circumvent this is to use synthetic data to augment anomalies directly into existing datasets. This far more diverse scenario can be created and come directly with annotations. This however also poses new issues for the computer-vision engineer and researcher end users, who are not readily familiar with 3D modeling, game development, or computer graphics methodologies and must rely on external specialists to use or tweak such pipelines. In this paper, we extend our previous work of an application that synthesizes dataset variations using 3D models and augments anomalies on real backgrounds using the Unity Engine. We developed a high-usability user interface for our application through a series of RITE experiments and evaluated the final product with the help of deep-learning specialists who provided positive feedback regarding its usability, accessibility, and user experience. Finally, we tested if the proposed solution can be used in the context of traffic surveillance by augmenting the train data from the challenging Street Scene dataset. We found that by using our synthetic data, we could achieve higher detection accuracy. We also propose the next steps to expand the proposed solution for better usability and render accuracy through the use of segmentation pre-processing.

1. Introduction

In a surveillance context, abnormal activities, also called “anomalies”, are activities that are out of the ordinary. We can roughly divide anomalies into two large categories based on whether they are affected by context or not. Some anomalies are scene-dependent, i.e., what might be considered an anomaly in one scene might be considered normal in another. For example on a normal street, pedestrians crossing outside of a crosswalk or walking on the street might be considered an anomaly of a type of jaywalking. On another street that is designated as a walking street, this behavior can be normal. In some streets, depending on the markings, a U-turn can be considered either normal or an anomaly [1,2]. On the other hand, anomalies can also be scene-independent—thus always seen as an abnormality independent of the context. Examples of such anomalies can be brawling or fighting on the street or a pedestrian falling or getting hit by a car [3,4].
Within surveillance systems, anomaly detection is a large area of interest, as manual observation and analysis of real-time videos have several documented shortcomings. There is an imbalance between the number of camera systems and the available human monitors [5], and the task of following video feeds and detecting potential concerning events is a laborious task, which requires maximum accuracy, with the time between detecting an event and response being vital for positive outcomes [6]. Finally, human monitors can only focus their attention on a limited area from the observed surveillance footage, which has the potential for missing events [7], as suspicious activity is much less common than normal occurrences. Automatic systems can also filter away normal occurrences and only provide alerts for abnormal detected behavior. This is especially beneficial for large-scale surveillance systems in places such as public monitoring in parks, harbors, streets, or intersections. Especially in traffic scenarios, anomaly detection is prevalent for monitoring traffic flow and congestion, accidents, and law violations [8,9,10].
Anomaly detection is implemented through the use of autoencoder deep learning models, which learn the representation of normal data from a training dataset. They are normally built as an encoder/decoder architecture, which tries to reconstruct a given input. When presented with a combination of normal and abnormal data, the reconstruction error of the anomalies spikes, which can be used as an indicator of their presence and classification of the data. This has the advantage of the autoencoders not needing to know about all the potential anomalies and thus being trained only on diverse normal data. This cuts down on data labeling [2,11,12].
One downside of using autoencoders is the need for large amounts of varied normal and abnormal data. Even though several datasets exist online for surveillance purposes focusing on pedestrian and traffic scenarios [13,14,15,16], the presented normal and abnormal situations can be insufficient to train sufficiently robust models. The other problem with using such predefined datasets is that researchers are constrained to only the presented scenarios, which are captured, in most cases, in very short amounts of time. Due to this, attempts have been made to generate and use synthetic data to either augment the real-world one or directly substitute it in the training and testing of autoencoders. This synthetic data can be generated through the use of ready-built game worlds such as GTA [17,18] or full-city simulations [19]. Otherwise, they can be created through the augmentation of already existing real-world images with synthetic elements [20,21,22]. While most synthetic data augmentation relies on time-consuming processes, with weeks being spent on frame rendering in some cases [21,23], others, such as the works on responsive anomaly generation [20] and fall synthesis [24], are using real-time rendering game engines to speed up and streamline the process. Even these applications have the downside of still relying on domain-specific knowledge of game developers and 3D artists to set up the environments and generate scenario variations.
This is why in this paper, we extend and streamline the anomaly generation and augmentation process proposed by Nikolov [20] through the development of a user-centered interface specialized in high usability through Rapid Iterative Testing and Evaluation (RITE), which simplifies the process of generating synthetic data without relying on external companies or extensive knowledge about 3D animation. The building blocks of the interface are given in Figure 1. We additionally extend the approach from the purely pedestrian anomaly detection context to anomaly detection in traffic surveillance by introducing the easy selection of streets, bike lanes, and walkways with synthetic cars, pedestrians, and cyclists being generated on them. In addition to adapting the RITE of the developed features, we presented the final prototype to deep learning specialists in the field of surveillance anomaly detection and reported their positive reactions to the proposed system. Finally, to demonstrate the validity of the produced synthetic data, we created additional augmented training data from the challenging Street Scene [2] and trained the MNAD anomaly detection model [25] on a combination of real and synthetic data. We report that this results in better overall accuracy. This paper’s main contributions can be summarized as follows:
  • Extending the approach for augmenting datasets with synthetic elements [20] with a customizable solution with a visual user interface specialized in high usability;
  • Refocusing the solution to an anomaly detection in traffic surveillance context where synthetic pedestrians, cars, and cyclists can be augmented into the scene;
  • Training the MNAD anomaly detection model on a combination of real and synthetic data and demonstrating that it produces better results on the complex Street Scene dataset

2. Background Research

2.1. Anomaly Datasets

Current state-of-the-art research on anomaly detection commonly uses existing datasets to train and evaluate their models [5,25,26]. Common datasets include UCSD Ped2 [27], CUHK Avenue [14], and ShanghaiTech [15]. This is done because creating a new dataset from scratch is a time-consuming task and because using the same datasets allows for easier comparisons between similar research and testing new models against the same anomalies. An issue that arises periodically with existing datasets is that new models become too efficient at detecting anomalies, which makes datasets “solved” and diminishes their usefulness. Therefore, newer challenging datasets are also often used. These include Street Scene [2], UHTCD [28], ADOC [29], and LTD [16]. Even with these datasets, the problem persists that the normal and anomalous data are still constrained to what was captured at the specific times and for novel scenarios, requiring a new dataset or extension of the old one. In addition, not all of the readily available datasets contain object- and pixel-level annotations, as many of them focus mostly on frame-level annotations, which limits their usefulness.

2.2. Synthetic Datasets

One way to combat the lack of scenario variations and the diminishing usefulness of real-life surveillance datasets is to create synthetic ones. The generation of synthetic data can be implemented into two main approaches. One is the creation of a full image or video sequence from scratch using either deep learning models or digital twin environments. The second is augmenting existing real-life images and videos with synthetic foreground and background elements representing specific scenarios.
Generating fully synthetic images can be completed through the use of generative adversarial networks (GANs) or diffusion networks [30,31,32] or through the use of digital twins created to mimic real-world environments [33,34]. One problem with these fully synthetic images and video sequences is that deep learning models trained on them can be susceptible to distribution gaps between the real and synthetic data. This in turn can lower the performance of models and might require additional postprocessing to match the synthetic data to the real one [35]. Augmenting real images and videos with synthetic elements, on the other hand, bridges the gap much better between real and generated data, as only certain elements of the images are synthesized. Especially for surveillance purposes, such augmentations have been shown to produce good results for pedestrian anomalies [21], falling in water detection [24], camera tampering [22], and subtle anomalies such as dropping objects and animals in the frame, as seen in the work that the current paper is an extension of [20].

3. Proposed Application
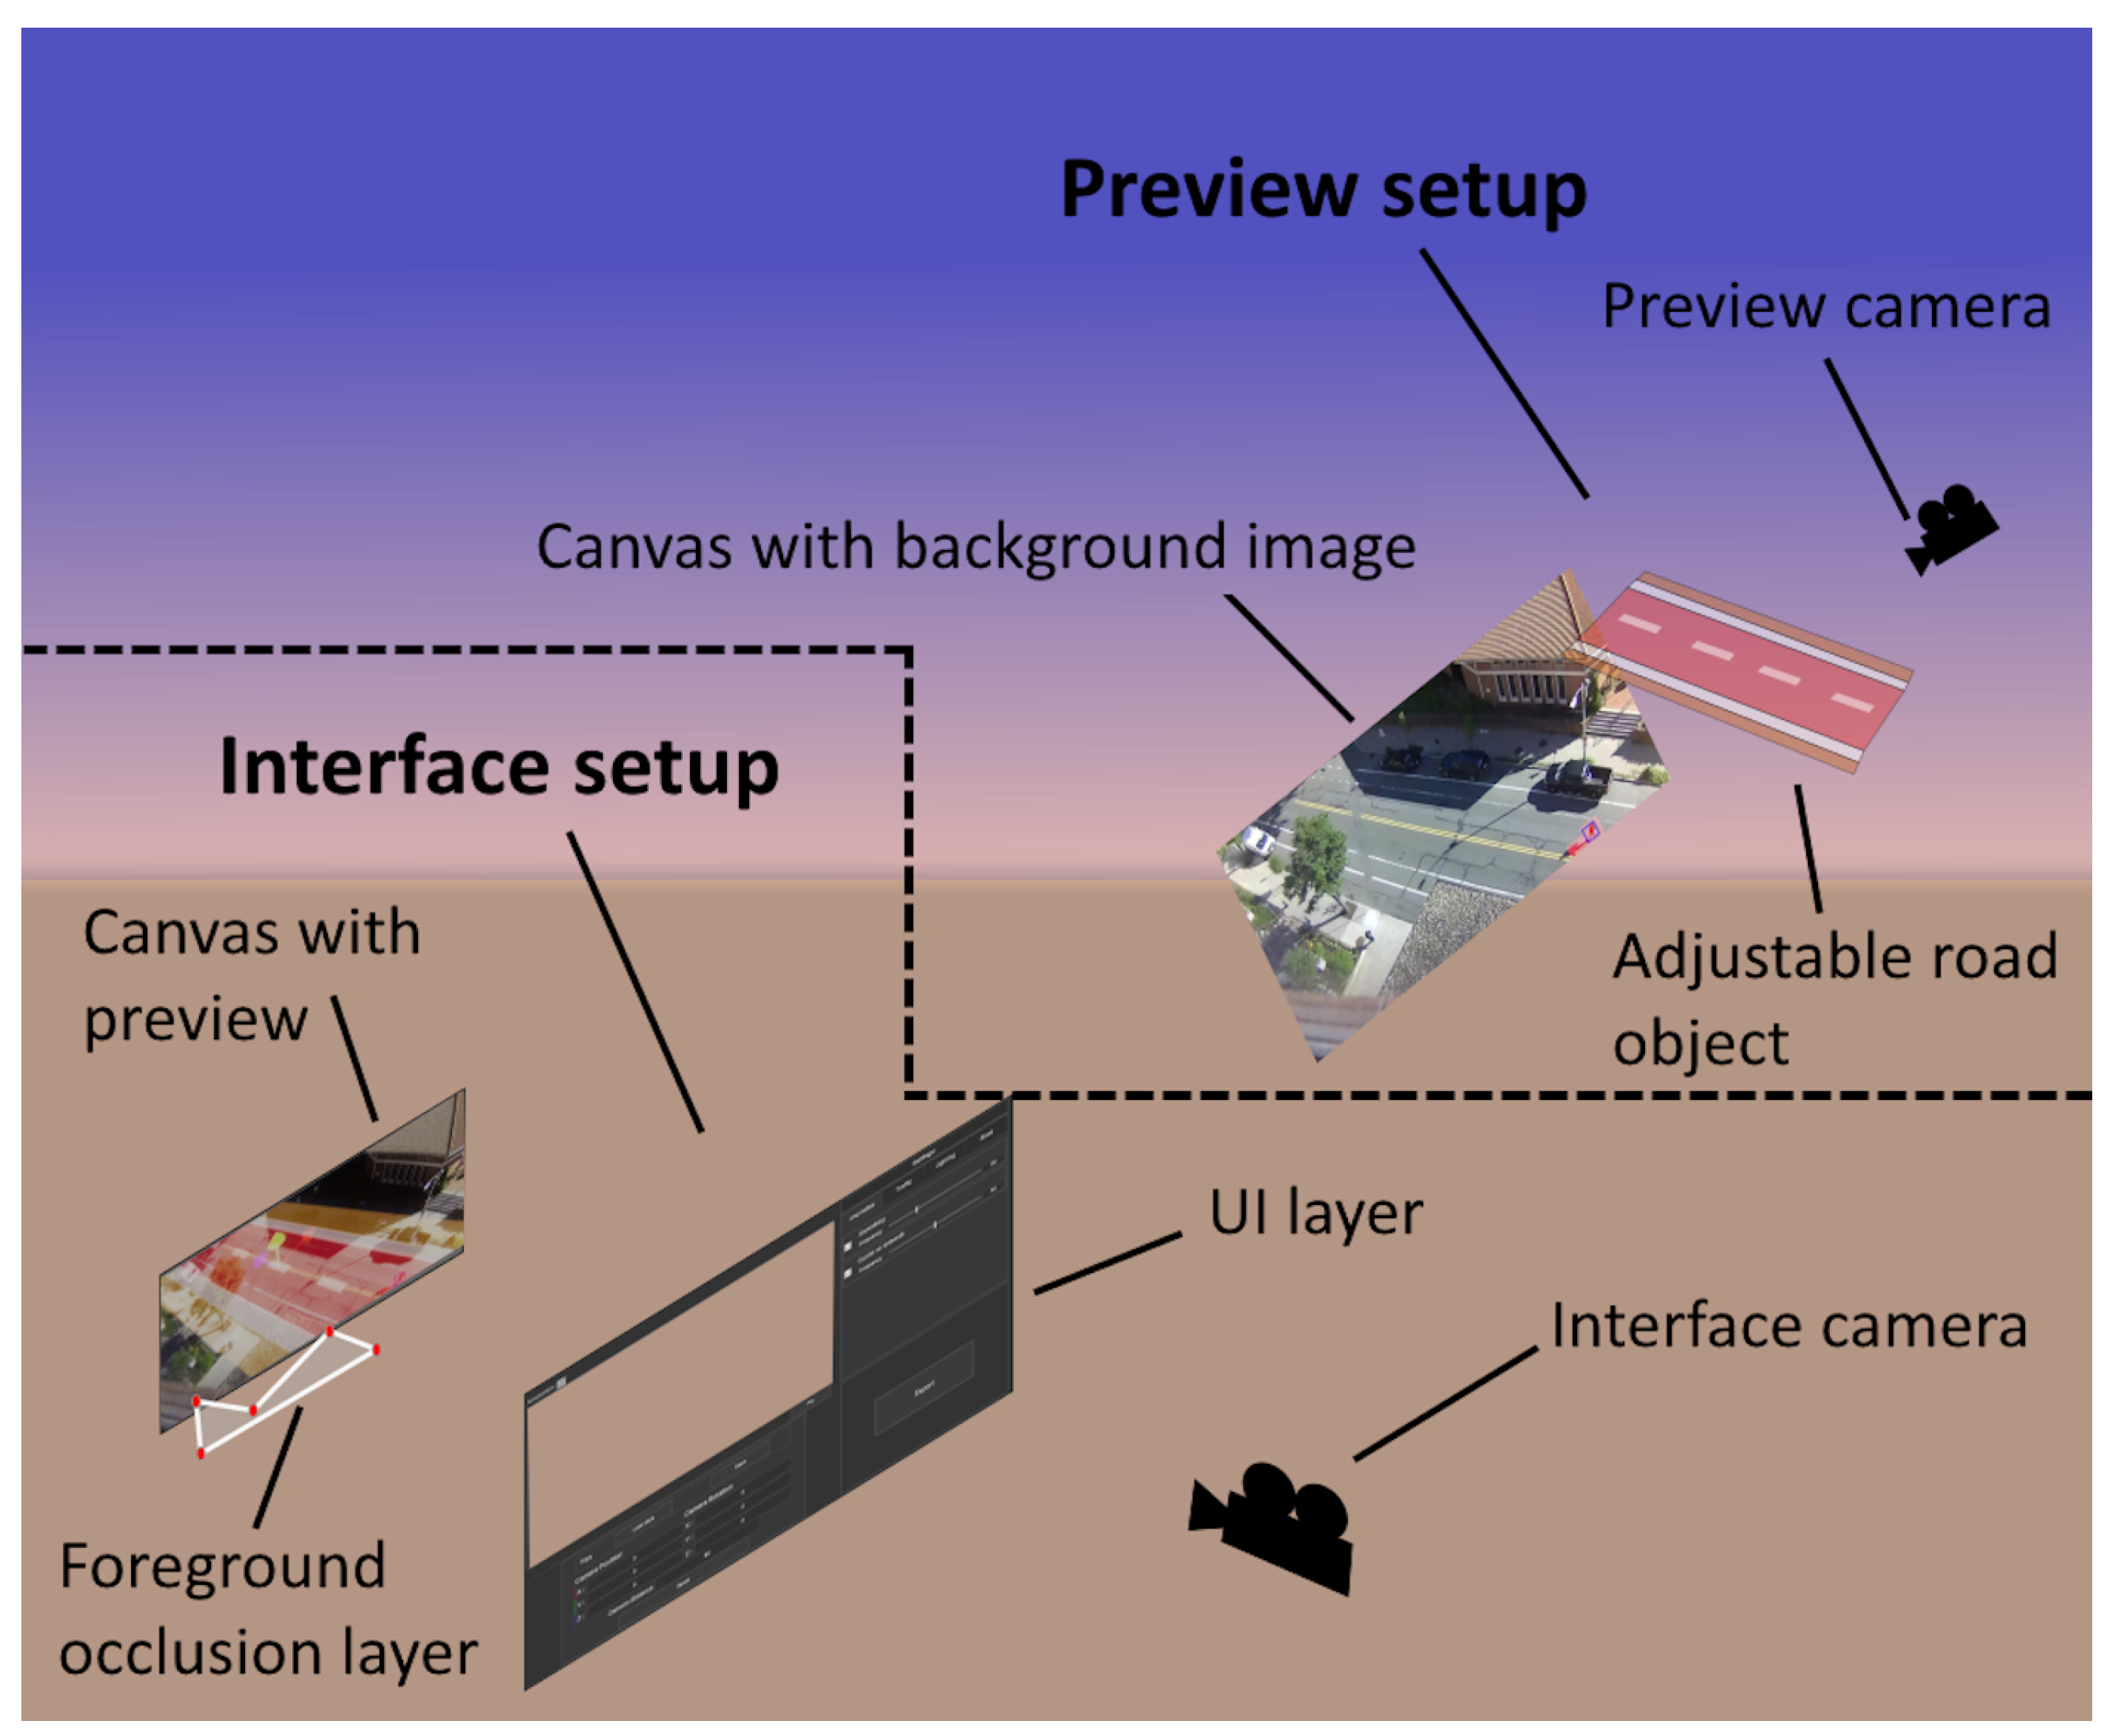
3.1. Overview

In this paper, we propose an application for synthetic dataset generation based on a user-centered design perspective, which can be seen in Figure 2, with the two main parts for interface interactions and synthetic data augmentation on top of the real images. Heuristics proposed by Desurvire et al. [36] were used to ensure high usability for the application, which maximizes the effectiveness, efficiency, and satisfaction by lowering interruptions or challenges in using the program [37].
To extend the work done in the reactive synthetic data augmentation paper [20], we focus on the traffic-anomaly detection context. This context is much more challenging [2,15], as it focuses on traffic flow, pedestrians, and other participants in traffic such as cyclists and bikers. We built the application in Unity, and as a basis, used the Street Scene dataset [2]. We also used the open-source camera matching application fSpy [38] for semiautomatic camera calibration from a single image. This software was successfully used for augmenting surveillance images [20] and digital reconstructions [39]. The main parts of the developed application, as presented in Figure 1, are the user interface (Section 3.2), the synthetic object placement (Section 3.3), the occlusion of synthetic objects by real background elements (Section 3.4), the automatic annotation of normal and abnormal images (Section 3.5), and the improved blending of the real and synthetic parts of the image through lighting and shadows (Section 3.6). We will discuss each of these elements in the next subsections. As each of the elements is in a prototype stage, we will discuss the required changes to the prototype in the Future Work Section 6.

3.2. User Interface Development

The proposed application’s main goal is to make synthetic data generation more straightforward for nonspecialist users. Because of this, the goal of the design of the interface was to keep the layout simple while still giving the user the freedom to make the simulation fit their footage. This can be a challenge, as giving the user more freedom will inherently lead to a need for more input fields [40,41]. From the design of interfaces for games [36], a set of heuristics can be used as a basis for building the program UI. The main design patterns used as a basis for the interface are that controls need to be consistent and use standard industry conventions, they are spread out and mapped naturally, and the controls are basic enough to not need a manual and be useable for both novice and experienced users. As the main user group is researchers working with deep learning and computer vision, it is believed that these users are used to interfaces closer to those of annotation software solutions such as LabelMe 5.4.1 [42], CVAT 2.11 [43], LabelImg [44], Supervisely 6.73 [45], and VoTT [46], among others. Similarly, to these applications, the visualization screen is given the largest screen space while the different menus for camera transformation, anomaly generation, traffic, lighting, exporting, etc. are set up as tabs, so less space is used, and unneeded information is hidden. In the final iteration, the UI is separated into four main groups shown in Figure 3:
  • The visualization screen used for manually tweaking the position of the camera, road, bike lanes, and sidewalks (A);
  • The Unity camera positioning group where fSpy can be started and an initial camera position can be loaded and later tweaked if needed (B);
  • The synthetic objects group which contains the tabs for adding anomalies; synthetic traffic in the form of cars, pedestrians, and cyclists; changing of light color, direction, and intensity; and finally manual separation of the input image space into streets, bicycle lanes, and sidewalks (C);
  • The export tab contains options for setting up the length of the augmented video sequence, generating multiple videos one after the other, adding or removing anomalies depending on the training or testing data being generated, and an option if video files or image sequences should be saved (D).

3.3. Synthetic Object Placement

The synthetic object placement is separated into three main parts: the placement of the virtual Unity camera in a correct 3D location to mimic the position of the real camera that captured the dataset images; the placement of the 3D ground plane and its separation into roads, bike lanes, and sidewalks; and finally the initialization and movement of the synthetic 3D objects of cars, pedestrians, and cyclists.
Most surveillance datasets do not come with information about the intrinsic and extrinsic parameters of the camera capturing the images, and videos and most of the datasets include stationary location [16]. Because of this, we chose to use the same approach presented by Nikolov [20] in utilizing fSpy to semiautomatically estimate the camera’s 3D position. The difference between the approach presented by Nikolov and the proposed implementation is that we integrated the fSpy output camera transformation directly in Unity. This enables users to additionally manually tweak the camera position using the camera position and rotation menus to better approximate the real one. The ground plane is also placed initially through fSpy and can be moved closer to or further away from the camera using the camera distance menu option shown in Figure 3.
Once the camera and ground plane are positioned, the plane can be separated into three zones: roads, bicycle lanes, and sidewalks. These can be selected or removed based on the user’s needs and type of dataset. Their position compared to each other is heuristically selected as such that the bicycle lanes are on each side of the road and the sidewalks are on each side of the lanes. If one of the zones is removed, the positions of the others are adjusted accordingly so that they are next to each other. These zones are visualized with semitransparent planes with different colors. The width of each zone can be scaled. The user can then manually select and scale the zones until they overlap with the real scene. The zones are shown in Figure 4a, and the menu for changing them is shown in Figure 4b. In the proposed prototype, the zones cannot be rotated, and their length is manually set so that it goes beyond what the camera sees.
Finally, once the three zones have been set up, the synthetic objects can be spawned in the correct place depending on if they should represent an anomaly or a normal-behaving object. For data augmentation, we selected three types of 3D objects to spawn. The first type is cars, which are spawned on the road zone. Four car models were selected to represent cars of different sizes and shapes: a sports car, a mini car, a larger sedan car, and an SUV. The second type of object is cyclists, which are spawned on the bicycle lanes. Two models of cyclists were implemented. The third type is pedestrians, which are spawned on the sidewalk. For pedestrians, three human models were implemented—two male and one female. Here, we need to mention that these models were selected for testing purposes of the prototype, and application in Unity was implemented in such a way that additional 3D models can be added for each of these categories of objects. Each synthetic object is implemented with a base animation—cars moving, cyclists riding, and pedestrians walking. The number of objects present in the scene can also be changed to make it more or less populated and complex. Examples of the used 3D models and the traffic menu can be seen in Figure 5.
For generating anomalies, we selected two of the anomalies presented in Street Scene [2]—jaywalkers and cyclists not riding in the cyclist lane. We chose these two because they use represent normal-behaving objects that change to anomalies when placed in different parts of the captured scene. Additional anomalies such as illegal car U-turns, illegal parking, or even collisions can be easily added to the application. The position and the movement direction of normal and anomaly objects are randomized. Constraints are given to the movement of each of the three types of synthetic objects. The cars are always driving parallel to the road, and their direction is set so they drive in the correct traffic direction. Cyclists also always ride parallel on the road and bicycle paths. Their direction can be in the correct or inverse traffic direction. Driving in the wrong traffic direction is set as an extension of the cyclist anomaly. Finally, the pedestrians can move parallel on the walkway, or when jaywalking, they can cross the road and bike lane at different angles. Examples of augmented normal and abnormal scenes are given in Figure 6.

3.4. Occlusion between Foreground and Background Elements

One of the main problems discussed in the work by Nikolov [20] is the occlusion between the real background elements such as trees, lamp posts, buildings, etc., and the synthetic augmented objects. If the occlusion is not correctly handled, it will result in data that do not represent the real interactions between foreground and background elements and the widening of the distribution gap between real and synthetic data, resulting in the worse performance of the trained models.
To manage the occlusions, the same idea as presented by Nikolov is used in this paper: users can manually select parts of the background image that need to occlude the synthetic objects by drawing polygons with their mouse. A mesh with a transparent material is generated from each closed polygon. A shader is written that makes the mesh transparent to the background image but hides the synthetic objects behind it. As an update to the proposed solution, a specific menu button is created to start the occluder-generation process, which can be selected at any time by the user. The user can also easily add and remove points from the polygon by clicking on them. A representation of the polygon is shown with gray points, which turn red once the polygon has been closed and the mesh is generated. A visualization of the unfinished and finished polygonal selection is given in Figure 7a, while examples of occlusion of synthetic objects by the polygons are given in Figure 7b.

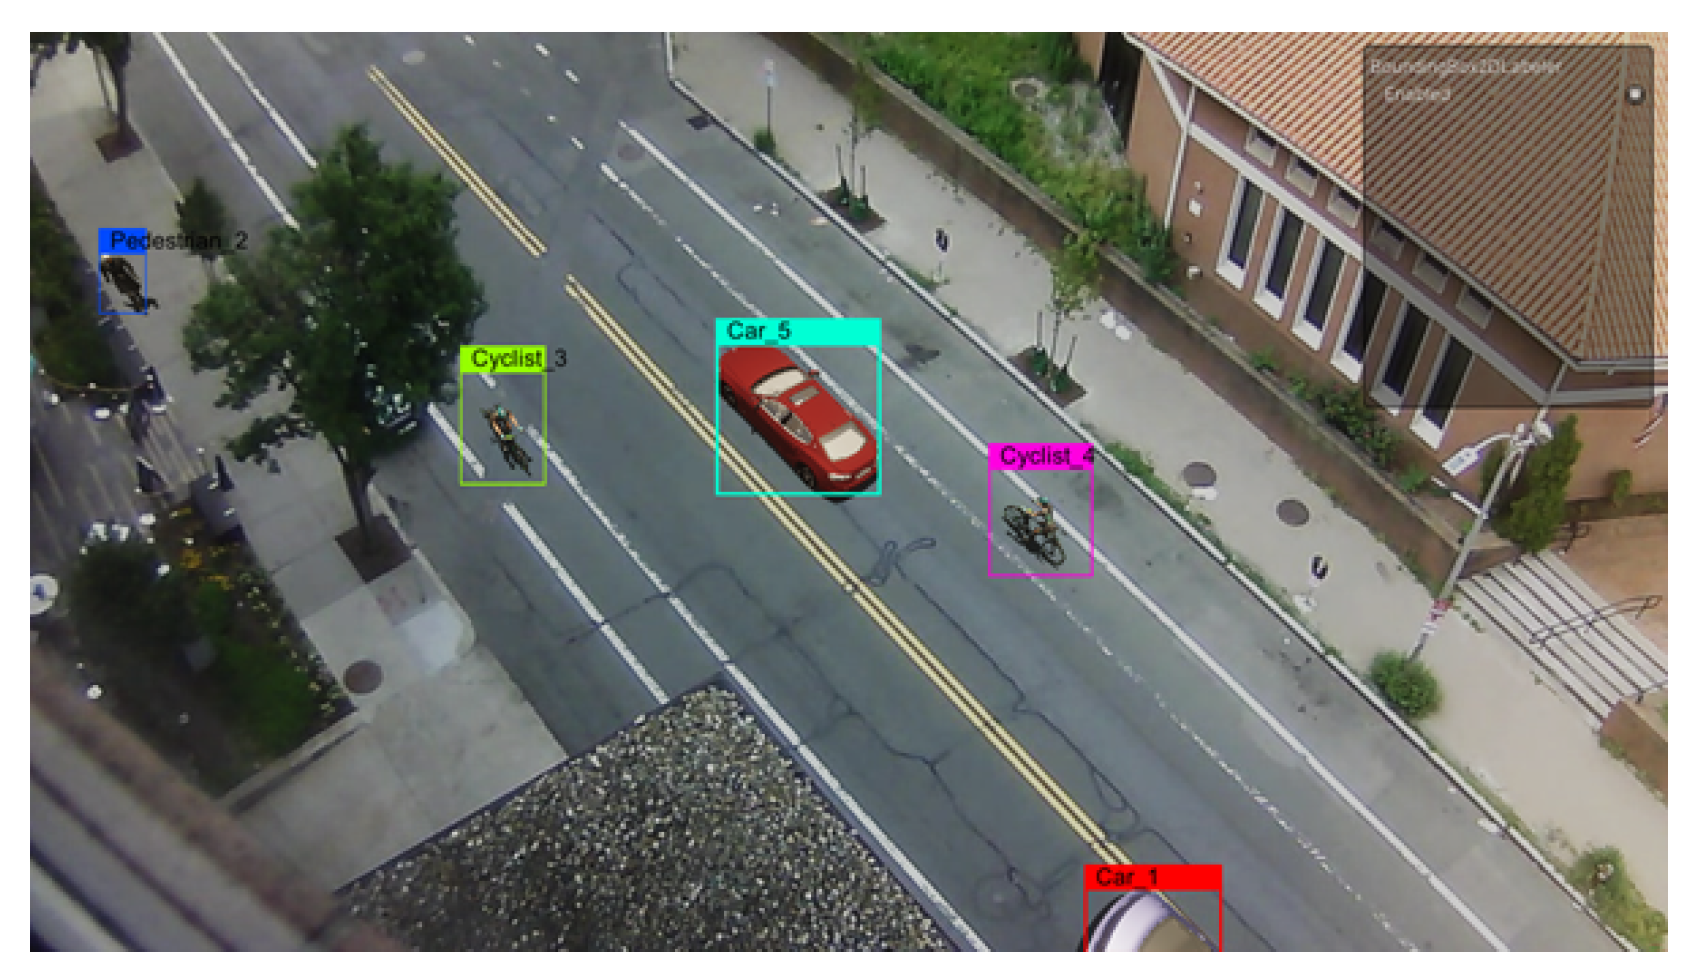
3.5. Synthetic Data Annotation

For object-level annotation, we use Unity’s Perception package [47], as it provides a straightforward way to generate a wide array of annotations. We generated a bounding box representation for each of the three types of synthetic objects for both normal or and data, together with additional annotations for the two types of anomalies. For image-level annotation, each generated image is tagged as an anomaly or not via generation of a CSV file of 0 s and 1 s for each captured frame. This results in a file containing as many rows as the frames in the current sequence, where each row is set to a 0 if there is no anomaly and to 1 if there is an anomaly present. This method is widely used for anomaly detection models such as MNAD [25], LNTRA [48], LGN-Net [49], MPN [50], and others. Examples of object-level annotations are given in Figure 8.

3.6. Lighting and Shadows

In the work presented by Nikolov [20], the used lighting was selected heuristically by matching the direction of the shadows present on the scene. The chosen dataset was also grayscale, which limited the need to select the correct shadow and light colors. To extend this in the proposed application, we allow the possibility for users to easily change the shadow orientation and the time of day by utilizing the HDRP rendering pipeline in Unity and the dynamic skybox connected to it. The color of the light can be tweaked as can the colors of the shadows cast from the synthetic objects. To receive the shadows from the synthetic objects, the transparent plane representing the roads is given a shader which makes the shadows cast on it opaque. The menu for changing the lighting and shadows can be seen in Figure 9a.
Finally, to make the augmented objects better match the real ones and the background, they need to receive shadows from background objects, such as buildings. We accomplish this by giving the possibility for primitive objects such as cubes to be positioned and scaled outside of the camera view by users until their shadows match up with the shadows cast from the real buildings. An example of a primitive cube positioned in such a place can be seen in Figure 9b, where the synthetic car acquires shadows that match up with the real ones on the road.

4. Experiments

As part of this study, we conducted three experiments: a RITE used for interactive development of the proposed application and building on top of the work proposed by Nikolov [20]; an interview with computer-vision experts working with surveillance anomaly detection for traffic scenarios; and a test of the generated data itself, where we created new normal synthetic data and used them to augment the data used for training the MNAD [25] anomaly-detection model.

4.1. RITE Experimental Procedure

Rapid Iterative Testing and Evaluation (RITE) was used to test for usability issues in the application, which helped ensure a high final usability. RITE measures effectiveness, efficiency, and satisfaction through user feedback [51]. RITE is performed with a smaller sample size, often 3–5 participants per iteration, but the sample size can be as low as 1 participant. The sample size of each iteration can vary between iterations, depending on the amount and severity of the issues or bugs found. According to research on sample size for traditional usability testing, 4–5 participants will uncover 80% of the problems that have a high likelihood of being detected [52]. RITE thus does not aim to evaluate the product’s visual fidelity but rather the usability of the workflow, the ease of use of the UI, and the success of participants working through tasks with the software. For our RITE experiment, each iteration consisted of one to three participants. They performed 10 tasks that guided them through the core loop of the application. The test was concluded after a group of five participants could no longer find issues or bugs that were not considered edge cases. The tasks were designed to represent different types of workflows using an application that mixed different parts of the menus such as starting the application, importing a video, changing the camera, changing the road, adding synthetic objects, changing the lighting, and exporting the augmented footage. An example workflow used in the RITE experiment is given in Figure 10.

4.2. Expert Interviews

In addition to the RITE, interviews with experts in the field of computer vision were conducted. This was an open interview where they were given tasks similar to the ones given in the RITE experiment while giving feedback in a think-aloud interview. The feedback from the experts was used to shape the application and make it more suitable for computer-vision and deep-learning users.

4.3. Anomaly Detection Model Test

To test the suitability of the generated synthetic data for use in training anomaly-detection models, we chose the Memory-Guided Normality for Anomaly Detection (MNAD) model. The predictive variant of the model was selected, and the resolution of the images fed to the model was set to 256 × 256 . The compactness and separation losses were set to 0.1 , with a batch size of 6 and a learning rate of 0.0002 . The model was trained for 60 epochs. For evaluating the model, we used the area under the curve (AUC) scores, which were used to determine the classification effectiveness of the model, together with the F1-score, precision, and recall.
To test the effectiveness of the data produced by our proposed solution, we chose to compare the MNAD model trained only on real data against a combination of real and synthetic data. To see the effect of the amount of synthetic data on the model’s performance, we created two subsets of the real training data: a large subset comprising 5668 frames captured from the sequences contained in the Street Scene dataset L r e a l and a small subset comprising only 600 frames S r e a l . The frames from both datasets were taken from full video sequences. We created two additional datasets—the large mixed dataset called L m i x e d and the small mixed dataset called S r e a l —by combining these two subsets with a dataset of 5607 synthetic frames created using our proposed system. The dataset contains a random selection of cyclists, cars, and pedestrians in normal scenarios. For testing, we used the testing dataset provided by the Street Scene dataset.

5. Results

5.1. RITE Experiment and Expert Interviews

The RITE was conducted in five iterations. The final feedback only included niche matters and personal preferences. As these were not considered to be vital for the design, it was decided to end the testing there. Figure 11 shows the number of errors and failures each participant encountered during the five iterations. It needs to be specified that because of the way RITE iterations are completed, with different participants, the found errors are different each time. Each participant was also given an efficiency questionnaire asking to give a score of how easy each of the tasks was to accomplish on a five-point Likert scale with options of extremely difficult, difficult, neither easy nor difficult, easy, and extremely easy.
The error types found in each of the iterations are given below:
  • First iteration —four errors were encountered by participants—two when annotating the background elements used for occlusion, one when using fSpy through the application, and one when adjusting the road position;
  • Second iteration—one error was encountered by the participant, again connected to adjusting the road, when using the menu to set offsets;
  • Third iteration—one error was encountered by the participant when annotating the occlusion elements, as it was not known if the occlusion area was created or another button needed to be pressed;
  • Forth iteration—one error was encountered again in the annotation of the occlusion elements, in the size of the selected region, where the participant thought the region was smaller than it was.
  • Fifth iteration—the users had three errors related to exporting functionality, and the personal preferences of the users were to have more feedback when creating the occlusion areas.
The biggest problems encountered by participants and the ones that needed to be worked most on were the positioning of the 3D camera and the selection of occluding background elements. These two interactions were the ones causing the most errors through the testing, but through the RITE iterations, the perceived difficulty decreased. This can be seen when looking at the sum efficiency score from all tasks for each of the participants in Figure 12, where the participants in the fifth iteration gave better overall scores. It needs to be mentioned that through the RITE iterations, no user completely failed to finish a task.
The experts liked the implementation, felt it had potential, and gave suggestions to changes to the application. The main suggestions implemented were a larger variation of 3D objects and additional categories, together with export options that would export video or image footage. Changes to the synthetic object speed were also implemented. The way the annotations were exported was also changed based on the expert feedback. The requirements that can be considered for future work are the following:
  • Menu system for selecting behavior animations for the different synthetic objects;
  • The ability to change the ordering of the pedestrian walkways and the bike lanes so that users can utilize the application with different types of road configurations;
  • A preview window showing an animation of the anomaly before it has been augmented into images;
  • Easier changes to the lighting via the ability to separate it into times of the day or by selecting a specific time.

5.2. Anomaly-Detection Results

The results from the evaluation of the MNAD model trained on the four different datasets can be seen in Table 1. We can see that in all cases, the results show that the anomalies connected to the Street Scene dataset are very difficult to detect. This can be attributed to the fact that many of the anomalies present in the dataset are normal objects, classified as anomalous because of their spatial position—jaywalkers, bikes outside the bike lane, cars outside of their lane, loitering pedestrians, car U-turns, and not unseen behaviors such as crashes, falls, etc. Even with these lower AUC results, we can see that the introduction of additional synthetic data to the training process results in better performance of the model. This is specifically apparent with the smaller real dataset augmented with synthetic data. One thing to mention here is that the introduction of synthetic data lowered the correctly detected normal data in the training set. This was most probably caused by the fact that even with all the considerations, the synthetic data augmentations that are produced are not photo-realistic, meaning that while the model does gain more representation of what normal data can look like, it also receives a style of data that is not present in the testing set. The increase in the F1 scores is a result of increased recall, not increased precision. This highlights the fact that the introduction of synthetic data did not have a large effect on a model’s ability to be correct when guessing that a frame had an anomaly in it but rather that the anomaly frames were more likely to be identified as anomaly frames by the model. This can be seen as a pro or a con depending on what the desired use case of the model is.

6. Future Work

The inconclusive anomaly-detection results show that the next step in testing the produced synthetic data would be to use a model that is more suited for location-based anomalies, such as the one used in the explainable video anomaly research [53]. This way the robustness of the trained model can be evaluated as can the influence of the quality of the synthetic data on the model behavior. Combining this with the comparison between the detection of real and synthetic anomalies can give more insight into the possible use cases for the proposed application.
One of the main problems users encountered in RITE was the selection of parts of the background as occluders for the synthetic objects. Users found the process confusing and slow, and even with the updates introduced through the RITE iterations, more work needs to be done. One way to mitigate this problem completely is to automate the process by introducing a segmentation step using the Segment Everything (SAM) [54] model for mask generation and scene segmentation. This way, a user can just use a single click or drag a bounding box around the required object and obtain a closer-fitting segmentation that can be used to generate an occlusion area. An example of such a workflow can be seen in Figure 13.
The current method of manually setting the light and shadow direction can be cumbersome, and we would like to automate it as much as possible by using directional-aware spatial context features [55] or even combining an instance segmentation with paired shadow detection, so certain shadows can be ignored [56].
In expanding the system, we would like to focus on implementing the feedback from the experts, as well as adding an easier means to add and browse possible anomaly datasets to be augmented. Currently, users have to use a simple file browser extension in Unity to find the background images or video, which can be problematic if multiple datasets need to be processed. We would also like to combine the synthetic augmentations presented in the reactive synthetic elements research paper [20] with the ones created for this paper, giving a larger library of anomalies and normal behaviors to work with. Currently, the presented research does not have the same level of reactive synthetic elements, which would be another area to pursue, as making pedestrians wait for real cars or having synthetic cars veer off because real people or other vehicles can make the generated data closer to real life.
Finally, making the data more photo-realistic would also help with closing the gap between real and synthetic images. The use of Unity’s HDRP rendering helps with making lighting and shadows closer to a real-life visualization, but an additional possibility would be to take the approach by Acsintoae et al. [21], while an additional postprocessing step a GAN can be used on the augmented parts of images to make them better fit with the real background. We would also like to test how close to real-life images we can generate synthetic augmentations by extending the user study to focus on the perceived realism of the images. This will give us a better overview of the needed realism of the 3D models and of how correct the lighting and shadows are. We plan to extend the user testing with the recreation of real examples from the Street Scene with our synthetic pipeline. This way, users can compare the two and detect possible problems. An example of a side-by-side view of real and synthetic scenes is shown in Figure 14.

7. Conclusions

In this paper, we presented an approach for creating a user-centered application for creating synthetic augmentations of real datasets used for anomaly detection. The approach builds upon the already established work [20] for generating responsive synthetic augmentations by focusing on a new use case of traffic anomalies and adopting a stronger outlook on developing an easy-to-use application where each required step from the pipeline is separated in simple to navigate menus. Bigger importance is given to step-by-step development through the use of RITE and discussions with computer vision specialists. To test the generated data we trained an anomaly detection model and showed that even though the chosen dataset can be extremely challenging, the use of synthetic data, especially when only a small amount of real data is present can achieve better results.

Author Contributions

Conceptualization, I.N.; methodology, A.R.-M., M.J., M.M. and M.B.K.T.; software, A.R.-M., M.J., M.M. and M.B.K.T.; validation, M.J. and M.B.K.T.; formal analysis, M.M.; investigation, M.J. and M.M.; resources, M.B.K.T. and A.R.-M.; data curation, M.B.K.T.; writing—original draft preparation, A.R.-M., M.J., M.M. and M.B.K.T.; writing—review and editing, I.N.; visualization, I.N.; supervision, I.N.; project administration, I.N. All authors have read and agreed to the published version of the manuscript.

Funding

This research received no external funding.

Institutional Review Board Statement

Not applicable.

Informed Consent Statement

No research/experiments have been done on Human or Animal subjects.

Data Availability Statement

The Unity project for generating the image augmentations can be found at https://github.com/IvanNik17/User-centered-Anomaly-Augmentation. The base dataset used in the study is the Street Scene dataset by [2], which can be accessed at https://www.merl.com/research/license/StreetScene.

Conflicts of Interest

The authors declare no conflicts of interest.

Abbreviations

The following abbreviations are used in this manuscript:
RITERapid Iterative Testing and Evaluation
MNADMemory-guided Normality for Anomaly Detection
GANGenerative Adversarial Network
UIUser Interface
HDRPHigh-Definition Rendering Pipeline

References

  1. Ramachandra, B.; Jones, M.J.; Vatsavai, R.R. A survey of single-scene video anomaly detection. IEEE Trans. Pattern Anal. Mach. Intell. 2020, 44, 2293–2312. [Google Scholar] [CrossRef] [PubMed]
  2. Ramachandra, B.; Jones, M.J. Street scene: A new dataset and evaluation protocol for video anomaly detection. In Proceedings of the 2020 IEEE Winter Conference on Applications of Computer Vision, WACV 2020, Snowmass Village, CO, USA, 1–5 March 2020; pp. 2558–2567. [Google Scholar] [CrossRef]
  3. Sun, C.; Jia, Y.; Hu, Y.; Wu, Y. Scene-aware context reasoning for unsupervised abnormal event detection in videos. In Proceedings of the 28th ACM International Conference on Multimedia, Seattle, WA, USA, 12–16 October 2020; pp. 184–192. [Google Scholar]
  4. Bo Bo, N.; Slembrouck, M.; Veelaert, P.; Philips, W. Distributed Multi-class Road User Tracking in Multi-camera Network for Smart Traffic Applications. In Lecture Notes in Computer Science (Including Subseries Lecture Notes in Artificial Intelligence and Lecture Notes in Bioinformatics); Springer: Berlin/Heidelberg, Germany, 2020; Volume 12002 LNCS, pp. 517–528. [Google Scholar] [CrossRef]
  5. Sultani, W.; Chen, C.; Shah, M. Real-world anomaly detection in surveillance videos. In Proceedings of the IEEE Conference on Computer Vision and Pattern Recognition, Salt Lake City, UT, USA, 18–22 June 2018; pp. 6479–6488. [Google Scholar]
  6. Sreenu, G.; Durai, S. Intelligent video surveillance: A review through deep learning techniques for crowd analysis. J. Big Data 2019, 6, 48. [Google Scholar] [CrossRef]
  7. Robertson, N.; Reid, I.; Brady, M. Automatic human behaviour recognition and explanation for CCTV video surveillance. Secur. J. 2008, 21, 173–188. [Google Scholar] [CrossRef]
  8. Hwang, R.H.; Peng, M.C.; Huang, C.W.; Lin, P.C.; Nguyen, V.L. An unsupervised deep learning model for early network traffic anomaly detection. IEEE Access 2020, 8, 30387–30399. [Google Scholar] [CrossRef]
  9. Doshi, K.; Yilmaz, Y. An efficient approach for anomaly detection in traffic videos. In Proceedings of the IEEE/CVF Conference on Computer Vision and Pattern Recognition, Nashville, TN, USA, 20–25 June 2021; pp. 4236–4244. [Google Scholar]
  10. Aboah, A. A vision-based system for traffic anomaly detection using deep learning and decision trees. In Proceedings of the IEEE/CVF Conference on Computer Vision and Pattern Recognition, Nashville, TN, USA, 20–25 June 2021; pp. 4207–4212. [Google Scholar]
  11. Mantini, P.; Li, Z.; Shah, K.S. A Day on Campus—An Anomaly Detection Dataset for Events in a Single Camera. In Lecture Notes in Computer Science (Including Subseries Lecture Notes in Artificial Intelligence and Lecture Notes in Bioinformatics); Springer: Berlin/Heidelberg, Germany, 2021; Volume 12627 LNCS, pp. 619–635. [Google Scholar] [CrossRef]
  12. Cruz-Esquivel, E.; Guzman-Zavaleta, Z.J. An examination on autoencoder designs for anomaly detection in video surveillance. IEEE Access 2022, 10, 6208–6217. [Google Scholar] [CrossRef]
  13. Mahadevan, V.; Li, W.; Bhalodia, V.; Vasconcelos, N. Anomaly detection in crowded scenes. In Proceedings of the 2010 IEEE Computer Society Conference on Computer Vision and Pattern Recognition, San Francisco, CA, USA, 13–18 June 2010; pp. 1975–1981. [Google Scholar]
  14. Lu, C.; Shi, J.; Jia, J. Abnormal event detection at 150 fps in matlab. In Proceedings of the IEEE International Conference on Computer Vision, Sydney, Australia, 1–8 December 2013; pp. 2720–2727. [Google Scholar]
  15. Liu, W.; Luo, W.; Lian, D.; Gao, S. Future frame prediction for anomaly detection—A new baseline. In Proceedings of the IEEE Conference on Computer Vision and Pattern Recognition, Salt Lake City, UT, USA, 18–22 June 2018; pp. 6536–6545. [Google Scholar]
  16. Nikolov, I.A.; Philipsen, M.P.; Liu, J.; Dueholm, J.V.; Johansen, A.S.; Nasrollahi, K.; Moeslund, T.B. Seasons in drift: A long-term thermal imaging dataset for studying concept drift. In Proceedings of the Thirty-Fifth Conference on Neural Information Processing Systems, Online, 6–14 December 2021. [Google Scholar]
  17. Martinez, M.; Sitawarin, C.; Finch, K.; Meincke, L.; Yablonski, A.; Kornhauser, A. Beyond Grand Theft Auto V for Training, Testing and Enhancing Deep Learning in Self Driving Cars. arXiv 2017, arXiv:1712.01397. [Google Scholar]
  18. Johnson-Roberson, M.; Barto, C.; Mehta, R.; Sridhar, S.N.; Rosaen, K.; Vasudevan, R. Driving in the Matrix: Can Virtual Worlds Replace Human-Generated Annotations for Real World Tasks? arXiv 2017, arXiv:1610.01983. [Google Scholar]
  19. Ros, G.; Sellart, L.; Materzynska, J.; Vazquez, D.; Lopez, A.M. The synthia dataset: A large collection of synthetic images for semantic segmentation of urban scenes. In Proceedings of the IEEE Conference on Computer Vision and Pattern Recognition, Las Vegas, NV, USA, 27–30 June 2016; pp. 3234–3243. [Google Scholar]
  20. Nikolov, I. Augmenting Anomaly Detection Datasets with Reactive Synthetic Elements. In Proceedings of the Computer Graphics and Visual Computing (CGVC), Wales, UK, 14–15 September 2023; Vangorp, P., Hunter, D., Eds.; The Eurographics Association: Munich, Germany, 2023. [Google Scholar] [CrossRef]
  21. Acsintoae, A.; Florescu, A.; Georgescu, M.I.; Mare, T.; Sumedrea, P.; Ionescu, R.T.; Khan, F.S.; Shah, M. Ubnormal: New benchmark for supervised open-set video anomaly detection. In Proceedings of the IEEE/CVF Conference on Computer Vision and Pattern Recognition, New Orleans, LA, USA, 18–24 June 2022; pp. 20143–20153. [Google Scholar] [CrossRef]
  22. Mantini, P.; Shah, S.K. Camera tampering detection using generative reference model and deep learned features. In Proceedings of the VISIGRAPP 2019—14th International Joint Conference on Computer Vision, Imaging and Computer Graphics Theory and Applications, Prague, Czech Republic, 25 February 2019; Volume 5, pp. 85–95. [Google Scholar] [CrossRef]
  23. Flaborea, A.; D’Amely, G.; D’Arrigo, S.; Sterpa, M.A.; Sampieri, A.; Galasso, F. Contracting Skeletal Kinematic Embeddings for Anomaly Detection. empharXiv 2023, arXiv:2301.09489. [Google Scholar]
  24. Madan, N.; Siemon, M.S.N.; Gjerde, M.K.; Petersson, B.S.; Grotuzas, A.; Esbensen, M.A.; Nikolov, I.A.; Philipsen, M.P.; Nasrollahi, K.; Moeslund, T.B. ThermalSynth: A Novel Approach for Generating Synthetic Thermal Human Scenarios. In Proceedings of the IEEE/CVF Winter Conference on Applications of Computer Vision, Waikoloa, HI, USA, 3–7 January 2023; pp. 130–139. [Google Scholar]
  25. Park, H.; Noh, J.; Ham, B. Learning memory-guided normality for anomaly detection. In Proceedings of the IEEE/CVF Conference on Computer Vision and Pattern Recognition, Seattle, WA, USA, 14–19 June 2020; pp. 14372–14381. [Google Scholar]
  26. Chebiyyam, M.; Reddy, R.D.; Dogra, D.P.; Bhaskar, H.; Mihaylova, L. Motion anomaly detection and trajectory analysis in visual surveillance. Multimed. Tools Appl. 2018, 77, 16223–16248. [Google Scholar] [CrossRef]
  27. Li, W.; Mahadevan, V.; Vasconcelos, N. Anomaly Detection and Localization in Crowded Scenes. IEEE Trans. Pattern Anal. Mach. Intell. 2014, 36, 18–32. [Google Scholar] [CrossRef] [PubMed]
  28. Mantini, P.; Shah, S.K. UHCTD: A Comprehensive Dataset for Camera Tampering Detection. In Proceedings of the 2019 16th IEEE International Conference on Advanced Video and Signal Based Surveillance (AVSS), Taipei, Taiwan, 18–21 September 2019; pp. 1–8. [Google Scholar] [CrossRef]
  29. Pranav, M.; Zhenggang, L. A day on campus-an anomaly detection dataset for events in a single camera. In Proceedings of the Asian Conference on Computer Vision, Kyoto, Japan, 30 November–4 December 2020. [Google Scholar]
  30. Islam, J.; Zhang, Y. GAN-based synthetic brain PET image generation. Brain Inform. 2020, 7, 3. [Google Scholar] [CrossRef] [PubMed]
  31. Abduljawad, M.; Alsalmani, A. Towards Creating Exotic Remote Sensing Datasets using Image Generating AI. In Proceedings of the 2022 International Conference on Electrical and Computing Technologies and Applications (ICECTA), Ras Al Khaimah, United Arab Emirates, 23–25 November 2022; pp. 84–88. [Google Scholar]
  32. Borji, A. Generated faces in the wild: Quantitative comparison of stable diffusion, midjourney and dall-e 2. arXiv 2022, arXiv:2210.00586. [Google Scholar]
  33. Wang, Q.; Gao, J.; Lin, W.; Yuan, Y. Learning from synthetic data for crowd counting in the wild. In Proceedings of the IEEE/CVF Conference on Computer Vision and Pattern Recognition, Long Beach, CA, USA, 15–20 June 2019; pp. 8198–8207. [Google Scholar]
  34. Aranjuelo Ansa, N.; García Castaño, J.; Unzueta Irurtia, L.; García Torres, S.; Elordi Hidalgo, U.; Otaegui Madurga, O. Building synthetic simulated environments for configuring and training multi-camera systems for surveillance applications. In Proceedings of the 16th International Conference on Computer Vision Theory and Applications, Virtual Event, 8–10 February 2021. [Google Scholar]
  35. He, R.; Sun, S.; Yu, X.; Xue, C.; Zhang, W.; Torr, P.; Bai, S.; Qi, X. Is synthetic data from generative models ready for image recognition? arXiv 2022, arXiv:2210.07574. [Google Scholar]
  36. Desurvire, H.; Wiberg, C. Game Usability Heuristics (PLAY) for Evaluating and Designing Better Games: The Next Iteration. In Proceedings of the Online Communities and Social Computing: Third International Conference, OCSC 2009, Held as Part of HCI International 2009, San Diego, CA, USA, 19–24 July 2009; Springer: Berlin/Heidelberg, Germany, 2009; pp. 557–566. [Google Scholar] [CrossRef]
  37. Laitinen, S. Better Games through Usability Evaluation and Testing. Gamasutra. 2005. Available online: https://www.gamedeveloper.com/production/better-games-through-usability-evaluation-and-testing (accessed on 30 January 2024).
  38. Gantelius, P. fSpy. 2018. Available online: https://fspy.io/ (accessed on 30 January 2024).
  39. Hamill, C. The Atlas of Lost Rooms: Digitally Reconstructing Dark Heritage Sites in Ireland. In Proceedings of the Emerging Technologies and the Digital Transformation of Museums and Heritage Sites: First International Conference, RISE IMET 2021, Nicosia, Cyprus, 2–4 June 2021; Springer: Berlin/Heidelberg, Germany, 2021; pp. 199–216. [Google Scholar]
  40. Chao, G. Human-Computer Interaction: Process and Principles of Human-Computer Interface Design. In Proceedings of the 2009 International Conference on Computer and Automation Engineering, Bangkok, Thailand, 8–10 March 2009; pp. 230–233. [Google Scholar] [CrossRef]
  41. Dudley, J.J.; Kristensson, P.O. A Review of User Interface Design for Interactive Machine Learning. ACM Trans. Interact. Intell. Syst. 2018, 8, 1–37. [Google Scholar] [CrossRef]
  42. Wada, K. labelme: Image Polygonal Annotation with Python. 2018. Available online: https://github.com/wkentaro/labelme (accessed on 30 January 2024).
  43. Sekachev, B.; Manovich, N.; Zhiltsov, M.; Zhavoronkov, A.; Kalinin, D.; Hoff, B.; Osmanov, T.; Kruchinin, D.; Zankevich, A.; Dmitriy, S.; et al. Opencv/cvat: V1.1.0. 2020. Available online: https://zenodo.org/records/4009388 (accessed on 30 January 2024).
  44. Tzutalin. LabelImg. Free Software: MIT License. 2015. Available online: https://github.com/HumanSignal/labelImg (accessed on 5 March 2024).
  45. Supervisely. 2017. Available online: https://supervisely.com/ (accessed on 30 January 2024).
  46. VOTT Visual Object Tagging Tool. 2020. Available online: https://github.com/microsoft/VoTT (accessed on 30 January 2024).
  47. Unity Perception. 2020. Available online: https://github.com/Unity-Technologies/com.unity.perception (accessed on 8 January 2024).
  48. Astrid, M.; Zaheer, M.Z.; Lee, J.Y.; Lee, S.I. Learning not to reconstruct anomalies. arXiv 2021, arXiv:2110.09742. [Google Scholar]
  49. Zhao, M.; Liu, Y.; Liu, J.; Li, D.; Zeng, X. LGN-Net: Local-Global Normality Network for Video Anomaly Detection. arXiv 2022, arXiv:2211.07454. [Google Scholar]
  50. Lv, H.; Chen, C.; Cui, Z.; Xu, C.; Li, Y.; Yang, J. Learning normal dynamics in videos with meta prototype network. In Proceedings of the IEEE/CVF Conference on Computer Vision and Pattern Recognition, Nashville, TN, USA, 20–25 June 2021; pp. 15425–15434. [Google Scholar]
  51. Medlock, M.C.; Wixon, D.; McGee, M.; Welsh, D. The rapid iterative test and evaluation method: Better products in less time. In Cost-Justifying Usability; Elsevier: Amsterdam, The Netherlands, 2005; pp. 489–517. [Google Scholar]
  52. Medlock, M.C.; Wixon, D.; Terrano, M.; Romero, R.; Fulton, B. Using the RITE method to improve products: A definition and a case study. Usability Prof. Assoc. 2002, 51, 1963813932–1562338474. [Google Scholar]
  53. Singh, A.; Jones, M.J.; Learned-Miller, E.G. EVAL: Explainable Video Anomaly Localization. In Proceedings of the IEEE/CVF Conference on Computer Vision and Pattern Recognition, Vancouver, BC, Canada, 17–24 June 2023; pp. 18717–18726. [Google Scholar]
  54. Kirillov, A.; Mintun, E.; Ravi, N.; Mao, H.; Rolland, C.; Gustafson, L.; Xiao, T.; Whitehead, S.; Berg, A.C.; Lo, W.Y.; et al. Segment Anything. arXiv 2023, arXiv:2304.02643. [Google Scholar]
  55. Hu, X.; Zhu, L.; Fu, C.W.; Qin, J.; Heng, P.A. Direction-aware spatial context features for shadow detection. In Proceedings of the IEEE Conference on Computer Vision and Pattern Recognition, Salt Lake City, UT, USA, 18–23 June 2018; pp. 7454–7462. [Google Scholar]
  56. Wang, T.; Hu, X.; Wang, Q.; Heng, P.A.; Fu, C.W. Instance shadow detection. In Proceedings of the IEEE/CVF Conference on Computer Vision and Pattern Recognition, Seattle, WA, USA, 13–19 June 2020; pp. 1880–1889. [Google Scholar]
Figure 1. Overview of the pipeline built into the proposed application for synthetic augmentation of anomaly detection datasets through the use of the Unity game engine. The main aspects of the proposed solution are the user-centered menu system consisting of selecting occlusion parts (A), loading images (B), calculating the 3D position of the camera (C), selecting roads (D), adjusting the lighting and shadows of the scene (E), and spawning 3D objects for normal and abnormal scenarios (F), exporting the synthesized content (G). The blue and red squares represent normal and abnormal objects, while the multicolored squares represent the different classes like cars, bicycles, and pedestrians.
Computers 13 00070 g001
Figure 2. Overview of the synthetic data generation application with the two main parts: the interface setup that contains all the menus the user can interact with and the preview setup which contains the visualized real background images with the road, sidewalk, and bike path limits and the synthetic objects.
Computers 13 00070 g002
Figure 3. Overview of the synthetic data generation application with the visualization and annotation screens shown (A) with the camera positioning panel noted with (B), the settings panel shown with (C), and the export settings shown as (D).
Computers 13 00070 g003
Figure 4. Visualization of the menus and representation of positioning the 3D road on top of a real image (a). From the menus (b), the width and length of the road can be set, together with the addition of a bike lanes, sidewalks, and their widths.
Computers 13 00070 g004
Figure 5. Examples of the models used for augmenting the real dataset images—a pedestrian walking, a cyclist, and a car (a)— together with the traffic menu for setting the number of objects spawned from each time and their initial offsets (b).
Computers 13 00070 g005
Figure 6. Example images from Street Scene augmented with synthetic cars, pedestrians, and cyclists. In (a), the 3D models shown with the blue bounding box demonstrate normal behavior, while in (b,c), the models with the red bounding box are anomalies—jaywalking and cyclists driving on the walkway.
Computers 13 00070 g006
Figure 7. Manual creation of occlusion shapes to hide the synthetic models behind parts of the background such as trees and buildings, together with examples of the occluded 3D models. As seen by the car model, the quality of the occlusion depends on how well the occluder shape matches the background. The selected occlusion part of the image is shown with white lines and the selected points as red circles. (a) Manual occluder generation. (b) Examples of occlusions.
Computers 13 00070 g007
Figure 8. Object- level bounding-box annotations generated by Unity’s Perception package.
Computers 13 00070 g008
Figure 9. The created lighting menu for changing the direction of light, simulating different times of day, and for changing the color of shadows, together with an example of using primitive cubes outside of the camera view to give correct shadowing on the synthetic models. In the figure, the red and brown cars are synthetic, while the white car is real. (a) Lighting menu, (b) Approximate shadows on model.
Computers 13 00070 g009
Figure 10. One of the performed sequences of tasks as part of the RITE experiment, which ensured that the user experience would be as smooth as possible.
Computers 13 00070 g010
Figure 11. A diagram that shows the number of errors and failures encountered during each of the iterations. The horizontal axis shows the number assigned to each participant, and the vertical axis shows the number of failures and errors.
Computers 13 00070 g011
Figure 12. The average efficiency score calculated from the questionnaire given to each participant in the RITE. The score is the sum of the selected responses where extremely difficult is 1 and extremely easy is 5. The maximum possible score is 50 from 10 tasks.
Computers 13 00070 g012
Figure 13. Future work improvement to the selection of background objects as occluders on a Street Scene image (a) using the Segment Everything model (b) with manual selection of an object with blue outline (c) and the resultant occlusion of a synthetic car shown in a red box (d).
Computers 13 00070 g013
Figure 14. An example of comparison pairs for user testing for detecting problems with rendering, lighting, shadows, 3D model shading, and detail levels. (a) Real Image, (b) Synthetic Augmentation, (c) Real Image, (d) Synthetic Augmentation.
Computers 13 00070 g014
Table 1. Results from training the MNAD model on the four datasets: the large real image subset L r e a l , the small real image subset S s m a l l , and their augmented versions of mixed real and synthetic data L m i x e d and S m i x e d . We report the AUC, precision, recall, and F1-score.
DatasetAUCPrecisionRecallF1-Score
L r e a l 0.5060.3100.8020.448
L m i x e d 0.5110.3110.8500.459
S r e a l 0.4770.3100.8200.450
S m i x e d 0.5240.3150.8600.452
Disclaimer/Publisher’s Note: The statements, opinions and data contained in all publications are solely those of the individual author(s) and contributor(s) and not of MDPI and/or the editor(s). MDPI and/or the editor(s) disclaim responsibility for any injury to people or property resulting from any ideas, methods, instructions or products referred to in the content.

