Article

Attitudes towards Digital Educational Technologies Scale for University Students: Development and Validation

by
Irina A. Novikova
1,*,
Polina A. Bychkova
1,
Dmitriy A. Shlyakhta
1 and
Alexey L. Novikov
2
1
Psychology and Pedagogy Department, Peoples’ Friendship University of Russia named after Patrice Lumumba (RUDN University), 117198 Moscow, Russia
2
General and Russian Linguistics Department, Peoples’ Friendship University of Russia named after Patrice Lumumba (RUDN University), 117198 Moscow, Russia
*
Author to whom correspondence should be addressed.
Computers 2023, 12(9), 176; https://doi.org/10.3390/computers12090176
Submission received: 31 July 2023 / Revised: 31 August 2023 / Accepted: 3 September 2023 / Published: 5 September 2023

Abstract

:
Numerous studies of the digitalization of higher education show that university students’ attitudes toward digital educational technologies (DETs) are one of the important psychological factors that can hinder or facilitate the optimal implementation of digital technologies in education. International researchers have developed many tools for diagnosing the attitudes of university students toward various aspects of the digitalization of education; however, until recently, similar scales in Russian have not been developed, which determined the purpose of this present research. The proposed version of the Attitudes towards DETs Scale for University Students (ATDETS-US) includes the cognitive, emotional, and behavioral subscales corresponding components of the attitude according to the ACB Model. The validation sample included 317 (160 females and 157 males) bachelor and master students from different Russian universities. Psychometric testing using Cronbach’s Alpha and McDonald’s Omega coefficients, hierarchical factor analysis, and CFA confirm the high internal consistency, reliability of the ATDETS-US and its subscales, and the good fit of the model. ATDETS-US will be used for obtaining reliable data on the attitudes towards DETs in university students, which should be taken into account when designing programs for their psychological support in the educational process and developing their digital competence.

1. Introduction

The processes of digitalization of all aspects of modern public life, which is traditionally considered the most important trend of the 21st century, deeply connected to the so-called fourth industrial revolution [1,2], have accelerated explosively due to the COVID-19 pandemic. The digitalization of higher education (HE) began long before the pandemic but had different pace and specifics in different countries and regions of the world [3,4]. The emergence of the transition to remote education, which occurred almost simultaneously all over the world in 2020, forced all participants in the educational process to use digital technologies and gain real experience in their application [5,6]. In this regard, even the concept of “Emergency Remote Education” has appeared, reflecting the specifics of the current situation in HE and its consequences [6].
Based on the bibliometric analysis of scientific literature, S.K.M. Brika et al. [7] identified nine most important sub-fields of e-learning research in HE in light of COVID-19:
(1)
Motivation and students’ attitudes to e-learning systems in HE (technology acceptance model);
(2)
Comparison between blended learning and virtual learning;
(3)
Online assessment versus formative assessment of students in HE;
(4)
Stress, anxiety, and mental health of college students in COVID-19;
(5)
Surgical education strategies to develop students’ skills;
(6)
Quality and performance of HE strategies of e-learning in COVID-19;
(7)
Challenges of medical education and distance learning during COVID-19;
(8)
Changing HE curricula using technology;
(9)
Using artificial intelligence, machine learning, and deep learning to transform the e-learning Industry.
Numerous international and Russian studies conducted after the pandemic outbreak show that university students most often attribute such advantages of digital educational technologies (DETs) to saving time, comfort, and the opportunity to study in any part of the world, while the DETs’ disadvantages are technical problems, difficulties with motivation and self-organization, lack of contact with teachers and “live” communication [8,9,10,11,12,13]. At the same time, many of these studies state that the digitalization problems faced by education are often associated not only with technical problems but also with the subjective attitudes to DETs in university teachers and students [11,12,14,15,16,17,18,19,20,21,22,23,24]. It is no coincidence that the study of students’ attitudes to e-learning is one of the most important trends in the HE digitalization research in light of COVID-19, as shown in the already mentioned article by S.K.M. Brika et al. [7].
It should be noted that there are many definitions of the concept of “Digital Technologies”, which are used not only in HE research but also in the study of digital transformation in society as a whole. For example, G. Vial, based on an analysis of more than a dozen definitions of digital transformation, proposed to consider it as a process that aims to improve an entity by triggering significant changes to its properties through combinations of information, computing, communication, and connectivity technologies, i.e., digital technologies [25]. G. Vial also notes that, in turn, most of the analyzed definitions of digital technologies fit with the popular SMACIT acronym [26], referring to technologies related to social, mobile, analytics, cloud, and the Internet of Things—IoT, and some definitions also include platforms, the Internet, software and blockchain as an important category [25].
Both in our previous publications [27,28,29,30,31] and in this article, we use the narrower concept “Digital Educational Technologies” (DETs), which includes: (1) digital (electronic) educational materials (e-books, e-tutorials, multimedia presentations, achievement tests, quizzes, etc.); (2) digital educational resources (electronic databases, e-library systems, search systems, etc.); (3) digital educational systems (LMS, Moodle, etc.); (4) digital platforms used for training (ZOOM, MS Teams, etc.); and (5) artificial intelligence and digital (virtual) educational environment. Therefore, DETs include all elements of the education system that use not ‘traditional’, but digital tools, methods, and systems [27,28,29,30,31]. In our opinion, the concept DETs is more specific than “Digital Technologies” or ICT, as it emphasizes the use of digital technologies specifically for educational purposes, but at the same time, this term implies the use of digital technology in different types of education, such as distance education, e-education, blended learning, emergency remote education, and, etc.
The attitudes of university students toward DETs, as one of the most important psychological factors for their effective implementation in the educational process, has long been in the focus of researchers. Accordingly, in international psychology, many tools have been developed for diagnosing students’ attitudes, perceptions, and assessments of digital technologies in education, as well as their ability, readiness, preparedness, and acceptance of various forms of distance and online education [6,32,33,34,35,36,37,38,39,40,41]. For example, one commonly used and popular technique is the Online Readiness Scale (ORLS) by M.-L. Hung et al. [37], included five dimensions: (1) self-directed learning, (2) motivation for learning, (3) computer/Internet self-efficacy, (4) learner control, and (5) online communication self-efficacy [37]. Another well-known tool is the Media and Technology Usage and Attitudes Scale (MTUAS) by L.D. Rosen et al., which consists of 4 based subscales: positive attitudes, negative attitudes, technological anxiety/dependence, and attitudes towards task-switching, and 11 usage subscales representing smartphone usage, general social media usage, Internet searching, e-mailing, media sharing, text messaging, video gaming, online friendships, Facebook friendships, phone calls, and watching television [40]. During the COVID-19 pandemic, K. Tzafilkou et al. [6] developed the Remote Learning Attitude Scale (RLAS) specifically to measure students’ attitude towards emergency remote education (ERE). The RLAS includes five dimensions: (1) online attending lectures, (2) online communicating with professors, (3) online collaborating with peers, (4) online finding, accessing, and studying educational material, and (5) online assignments and homework.
One of the most common and reasonable social psychological approaches to the study of attitudes is the Tripartite Model of Attitudes, according to which the attitude includes affective, cognitive, and behavioral (ACB) components [42]. From this model, the affective component refers to the feelings and emotions that make an individual react and allow them to decide what attitude to take towards the current situation; the cognitive component is based on the beliefs and values that a person possesses, which makes reference to what they have learned in their life experience; and behavioral component is focused on the behavior and intention that an individual has who is faced with a certain situation and must act [43]. A close understanding of the attitude structure is also assumed in the Theory of Planned Behavior (TPB) by I. Ajzen and M. Fishbein [44], which considers that the cognitive and affective components of attitudes partly determine behavioral intention, which is the immediate motivational factor for behavior [45].
The ACB model has been repeatedly used to study students’ and teachers’ attitudes towards digital technologies in education [45,46,47,48,49,50]. For example, X.G. Ordóñez and S.J. Romero proposed the Scale of Attitudes Towards ICT (SATICT) in Spanish based on the ACB model and accordingly consisting of three subscales (affective, cognitive, and behavioral). The results obtained on a sample of 1080 students at the Open University of Madrid provide high support for the proposed factor structure with significant loadings and adequate model fit; however, the results also showed that factor structure could not be considered invariant across groups [48]. Further, a study by F.D. Guillén-Gámez et al. using SATICT on students from two Universities of Madrid showed that male and distance learning students show more favorable attitudes in the affective dimension, while full-time students show more favorable scores in cognitive and behavioral attitudes [47]. J. Svenningsson et al. [51] adapted to a Swedish context the Pupils’ Attitudes Toward Technology short questionnaire (PATT-SQ-SE) based on TPB. The PATT-SQ-SE included six categories: (1) Career—respondents’ career aspirations in technology; (2) Gender—perceived gender patterns in technology; (3) Importance—consequences and importance of technology; (4) Interest—interest in technology education; (5) Difficulties—perceived difficulties in the technology subject; (6) Boredom—perceived boredom with technology. The results obtained from a sample of 141 students in school years 6–8 (aged 12–14) in Sweden showed a mostly moderate effect on the attitudes, depending on the respondent’s gender. An exception was the Gender category, which changed from a small effect to a large effect depending on how the statements were presented [51].
In Russian psychology, until recently, little research has been done on the attitudes of university students towards DETs [52]. After the start of the pandemic, such studies became popular, but most often, they were based on sociological surveys and did not use special psychodiagnostic tools [8,15,21].
In 2021, M.G. Sorokova et al. [53] developed a scale for assessing the university digital educational environment in Russian (AUDEE Scale). The AUDEE scale includes six indicators: satisfaction with the educational process, satisfaction with communicative interaction, stress tension, the need for support, dishonest strategies in knowledge control, and environment accessibility. However, this scale, like the earlier Digital Competence Index (DCI) by G.U. Soldatova and E.I. Rasskazova [54], is not aimed at diagnosing attitudes as subjectively experienced sensations or opinions.
In 2019, shortly before the start of the pandemic, we developed and psychometric tested The University Students’ Attitudes towards DETs Questionnaire. This questionnaire includes 21 questions and four indicators: (a) General involvement in the use of DETs; (b) Involvement in the digital space; (c) The use of digital technologies in education; (d) Digital competence [27,28,29,30,31]. Using this tool, we conducted a study on the personality traits and academic motivation as predictors of attitudes toward DETs among university students in different fields of study [27,28,31], as well as a series of studies of the changes in university students’ attitudes toward DETs before and at different stages of the pandemic [29,30]. However, at present, we are aware of the need to improve the tool for diagnosing attitudes toward DETs among university students and teachers, taking into account the experience of digitalization of HE gained during the pandemic.
Thus, at present, in international psychology, there are a large number of tools for diagnosing university students’ attitudes towards DETs, developed on the basis of various theoretical models [6,32,33,34,35,36,37,38,39,40,41,45,46,47,48,49,50,51], including the well-known Tripartite Model of Attitudes [45,46,47,48,49,50]. The advantage of this model is the ability to compare the severity of the three components of the attitude and identify their consistency or mismatch in each individual for use in further practical correctional work. However, in Russian psychology, there is a lack of such psychodiagnostic scales, which, from a methodological point of view, makes it difficult to compare the data of international and Russian studies of university students’ attitudes towards DETs and from a practical point of view, it does not allow obtaining valid data on university students’ attitudes to DETs for use in applied research. These gaps determined the main purpose of the present research: to develop and validate a scale to measure university students’ attitudes towards DETs using the ACB model.

2. Materials and Methods

2.1. Design and Stages of the Research

The development and validation of the Attitudes towards DETs Scale for University Students (ATDETS-US) included several stages.
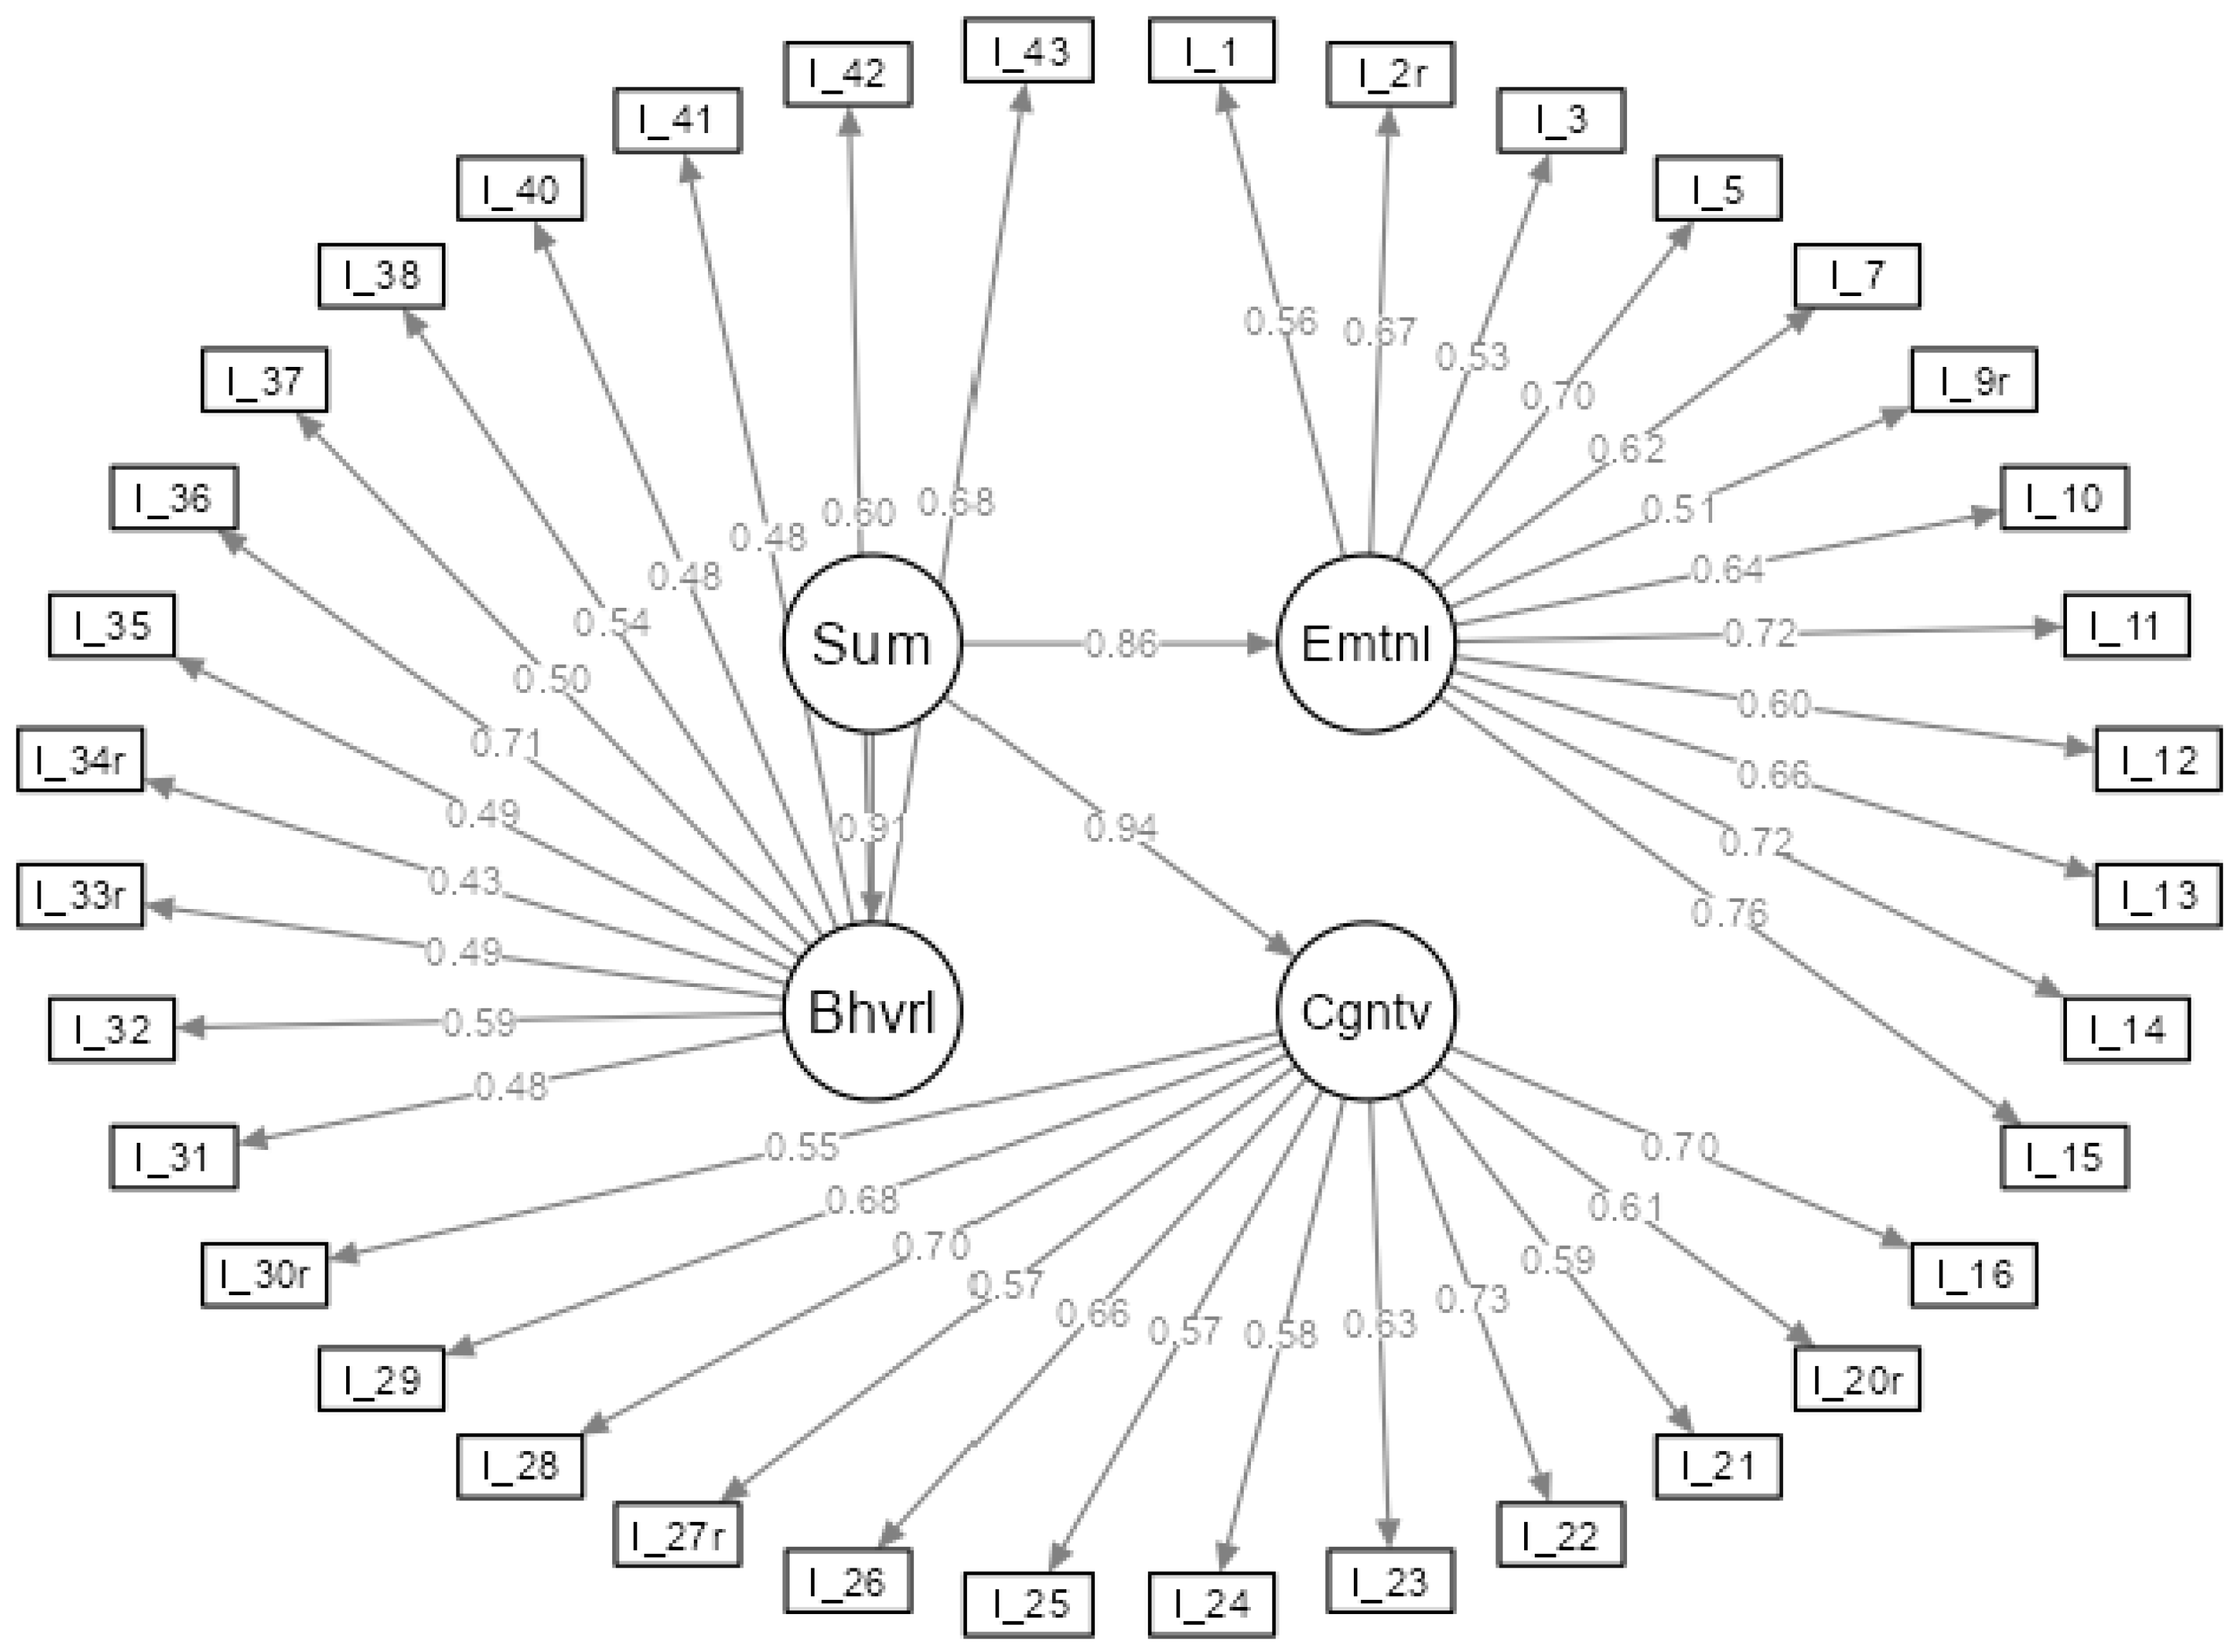
  • Development of the initial text of the ATDETS-US. When formulating the items of the scale, we primarily relied on the ACB Model of Attitude and similar scales developed by international researchers [45,46,47,48,49,50], so the questionnaire contains three subscales: emotional, cognitive, and behavioral. However, when formulating the items of each subscale, we tried to reflect various aspects of the use of digital technologies and devices in education, for example, in lectures, seminars, when searching for literature, doing homework, etc. A similar approach is also used in research [6,40], including our earlier studies [27,28,29,30,31].
  • Preliminary check of the ATDETS-US initial version for clarity and internal consistency. The scale was proposed to the pilot sample of university students, along with several additional multiple choice and open-ended survey questions regarding general opinions towards DETs and assessment of the item’s clarity.
  • Main psychometric check of the ATDETS-US on the validation sample. Using statistical methods, the initial version of the scale was checked for internal consistency and reliability, as a result of which the reduced version of the ATDETS-US was developed. This version, in turn, was tested for internal consistency, reliability, and compliance with the theoretical model (ACB Model of Attitude).
  • Criterion validity check and standardization of the ATDETS-US final version. Using a comparative analysis on the “extreme” groups, the criterion validity of the ATDETS-US final version was checked, and its standardization was carried out on the validation sample.
The research was conducted in April 2022–May 2023 via Google Forms (https://forms.gle/BxQnZfcqrCm28w1v9 (accessed on 30 July 2023)) in Russian. The study was conducted in accordance with the APA Ethical Standards and the Code of Ethics of the RPS (Russian Psychological Society), and the protocol was approved by the Ethics Committee of RUDN University (# 050422–0-121).

2.2. Participants

A total of 680 students (520 females and 160 males) from Russian universities took part in the research at its different stages, of which 598 (87.9%) are students from Russia and 82 (12.1%) are students from other countries, aged 16 to 37 years (Mage = 20.06 ± 2.83).
The pilot sample for a preliminary check of the ATDETS-US initial version included 96 (63 females and 33 males) university students, of which 70 (72.9%) students of RUDN University and 26 (27.1%) students at other Russian universities, aged 18 to 31 years (Mage = 21.22 ± 2.54 years).
The validation sample balanced in the female-to-male ratio included 317 students at Russian universities (Mage = 20.44 ± 2.97 years): 160 females (Mage = 20.26 ± 3.01 years) and 157 males (20.62 ± 2.92 years). Table 1 shows more detailed socio-demographic characteristics of the validation sample.
All the students participated in the study during classes in psychological disciplines as one of the additional tasks, for which they received additional points. They were duly informed that participation would be free and voluntary.

2.3. Technique

The initial full version of the ATDETS-US includes 45 items (direct and reverse) and three subscales corresponding to the cognitive, emotional, and behavioral components of the attitude according to the ACB model:
  • Emotional Subscale (ES) includes 15 items (13 direct and 2 reverse) aimed at determining the emotions and feelings of students in relation to digital technologies in HE;
  • Cognitive Subscale (CS) includes 15 items (11 direct and 4 reverse) aimed at determining the perceptions and knowledge of students regarding the possibilities of digital technologies in higher education HE;
  • Behavioral Subscale (BS) includes 15 items (11 direct and 4 reverse) aimed at assessing how students master digital devices and technologies in the process of studying at a university.
For each scale, corresponding to each other, items were formulated that describe one of the aspects of the DETs’ use. For example: “I am pleased with the opportunity to attend online lectures in the academic disciplines of my field of study” (ES); “I am well aware of the pros and cons of online lectures in the academic disciplines of my field of study” (CS); “It is difficult for me to absorb the material at online lectures in the academic disciplines of my field of study” (BS).
The items are rated on a 5-point Likert scale (from 1 = strongly disagree to 5 = strongly agree).
In addition to the ATDETS-US, the Google Form included several survey questions grouped into two blocks:
  • Socio-demographic block of 9 survey questions (gender, age, country, university, faculty, field of study, degree, year of study, form of education, etc.);
  • Additional block of 10 multiple choice and open-ended survey questions regarding general opinions towards DETs (in this study, only answers to two of these questions were used; see further in Section 3.4).
The initial full version of the ATDETS-US and additional survey questions in Russian are presented in the Supplementary Materials.

2.4. Data Analysis

The descriptive statistics methods, Shapiro–Wilk test, coefficients Cronbach’s α, and McDonald’s ω [55,56,57], and hierarchical factor analysis [58] were used for assessing the internal consistency, reliability, and factor structure of the proposed scale and its subscales. To verify the model, confirmatory factor analysis (CFA) with the WLSM estimator (weighted least squares method) was used [59]. The Student’s t-test for two independent samples was used to test external validity.
Statistical processing was carried out in Jamovi, version 2.3.21 [60,61,62]. Cronbach’s Alpha was calculated using the alpha function from R-package psych by W.Revelle [60,61]. McDonald’s Omega was calculated using the compRelSEM function from the semTools 0.5–6 package [63], omega ω-type coefficients, Green and Yang’s [64] (formula 21) approach is used to transform factor-model results back to the ordinal response scale.

3. Results

3.1. Preliminary Check of the ATDETS-US Initial Version for Clarity and Internal Consistency

Checking the ATDETS-US initial version for internal consistency using Cronbach’s Alpha and MacDonald’s Omega coefficients on the pilot sample showed satisfactory results for the scale as a whole (α = 0.94; ω = 0.84) and each of the subscales: ES (α = 0.90; ω = 0.89); CS (α = 0.87; ω = 0.85); and BS (α = 0.83; ω = 0.77). Participants did not have problems understanding the scale items, so we decided to continue psychometric checking of the full ATDETS-US version without changes to the validation sample.

3.2. Pre-Validation of the ATDETS-US Full Version

Checking the internal consistency of the ATDETS-US initial full version using the Cronbach’s α and McDonald’s ω coefficient on the validation sample showed good results for the scale as a whole (α = 0.95; ω = 0.89) and each of the subscales: ES (α = 0.90; ω = 0.91); CS (α = 0.90; ω = 0.89); and BS (α = 0.83; ω = 0.79). Checking the reliability of each ATDETS-US subscale using hierarchical factor analysis revealed that all relevant items are included in the G factor of ES with loadings from 0.6 to 0.8; all relevant items are included in the G factor of CS with loadings from 0.5 to 0.7; and 14 relevant items are included in the G factor of BS with loadings from 0.3 to 0.6 (item’s loading on the G factor is less than 0.2 only for item 39r). Items 44 (loading is 0.2) and 45r (loading is 0.2) also have weak loadings on the G factor of BS.
In addition, items 39r (“I rarely use the electronic library of my university to receive textbooks and other literature in digital form”), 44 (“I constantly use electronic library systems (ELS) and databases to search for educational and scientific literature”) have the smallest inclusion (loading is less than 0.20) to the G factor of ATDETS-US in general. We believe that this may be due to the fact that, firstly, modern students more often use other sources to obtain electronic textbooks and educational literature than the university library, and, secondly, not all university libraries have the corresponding digital content. Item 45r (“I very rarely use the official website of my university”) also has a weak load (0.2) on the G factor of ATDETS-US. In our opinion, this may be due to the fact that the validation sample included students from various Russian universities whose official websites may provide different information and opportunities.
Thus, based on the psychometric check and qualitative analysis, statements 39r, 44, and 45r, as well as the corresponding statements in ES (items 4, 6, and 8) and CS (items 17, 18, and 19), were excluded from the ATDETS-US.

3.3. Validation of the ATDETS-US Final Version

The reduced version of ATDETS-US (see Appendix A), consisting of 36 items, which are included in three subscales (12 statements each), was subjected to further psychometric checking. Descriptive statistics and coefficients of Cronbach’s Alpha and McDonald’s Omega for the reduced version of the ATDETS-US as a whole and its subscales are presented in Table 2.
Table 2 shows the high internal consistency of all ATDETS-US items as items on the overall scale. The internal consistency on each of the three subscales is also fairly good, with the highest internal consistency being found for ES and relatively lower internal consistency—for the BS. Descriptive statistics indicate a high severity of mean values for subscales and for the scale as a whole (a shift to the right in the distribution of values). Full descriptive statistics and standardized loadings of all scale items are presented in Appendix A.
Next, we checked the fit of the ATDETS-US to the original three-factor theoretical model of attitude with a common second-order factor using confirmatory factor analysis (CFA). Double loadings were not included in the estimated model. The model was estimated using the WLSM (weighted least squares method) estimator, the Satorra–Bentler scaled (mean-adjusted) chi-square, and robust standard errors were used. The indicators of three-factor model compliance with data are presented in Table 3. Table 3 shows that the tested model shows acceptable consistency (less than 0.04) in terms of the RMSEA parameter and, therefore, can be interpreted [59].
The standardized parameters of the ATDETS-US factor model are presented in Figure 1.
Thus, the data of Table 2 and Table 3 and Figure 1 confirm the high internal consistency of the ATDETS-US and the good fit of the model, which gives us reason to conclude that it is internally valid.

3.4. Criterion Validity of the ATDETS-US Final Version

To assess the criterion validity of ATDETS-US, we used as “external” criteria students’ answers to additional questions regarding DETs:
  • “How do you think digital technologies affect the learning process?”: only “positive” and “negative” answers were compared, the answers “difficult to answer” and “do not affect” were not taken into account (Table 4, Figure 2).
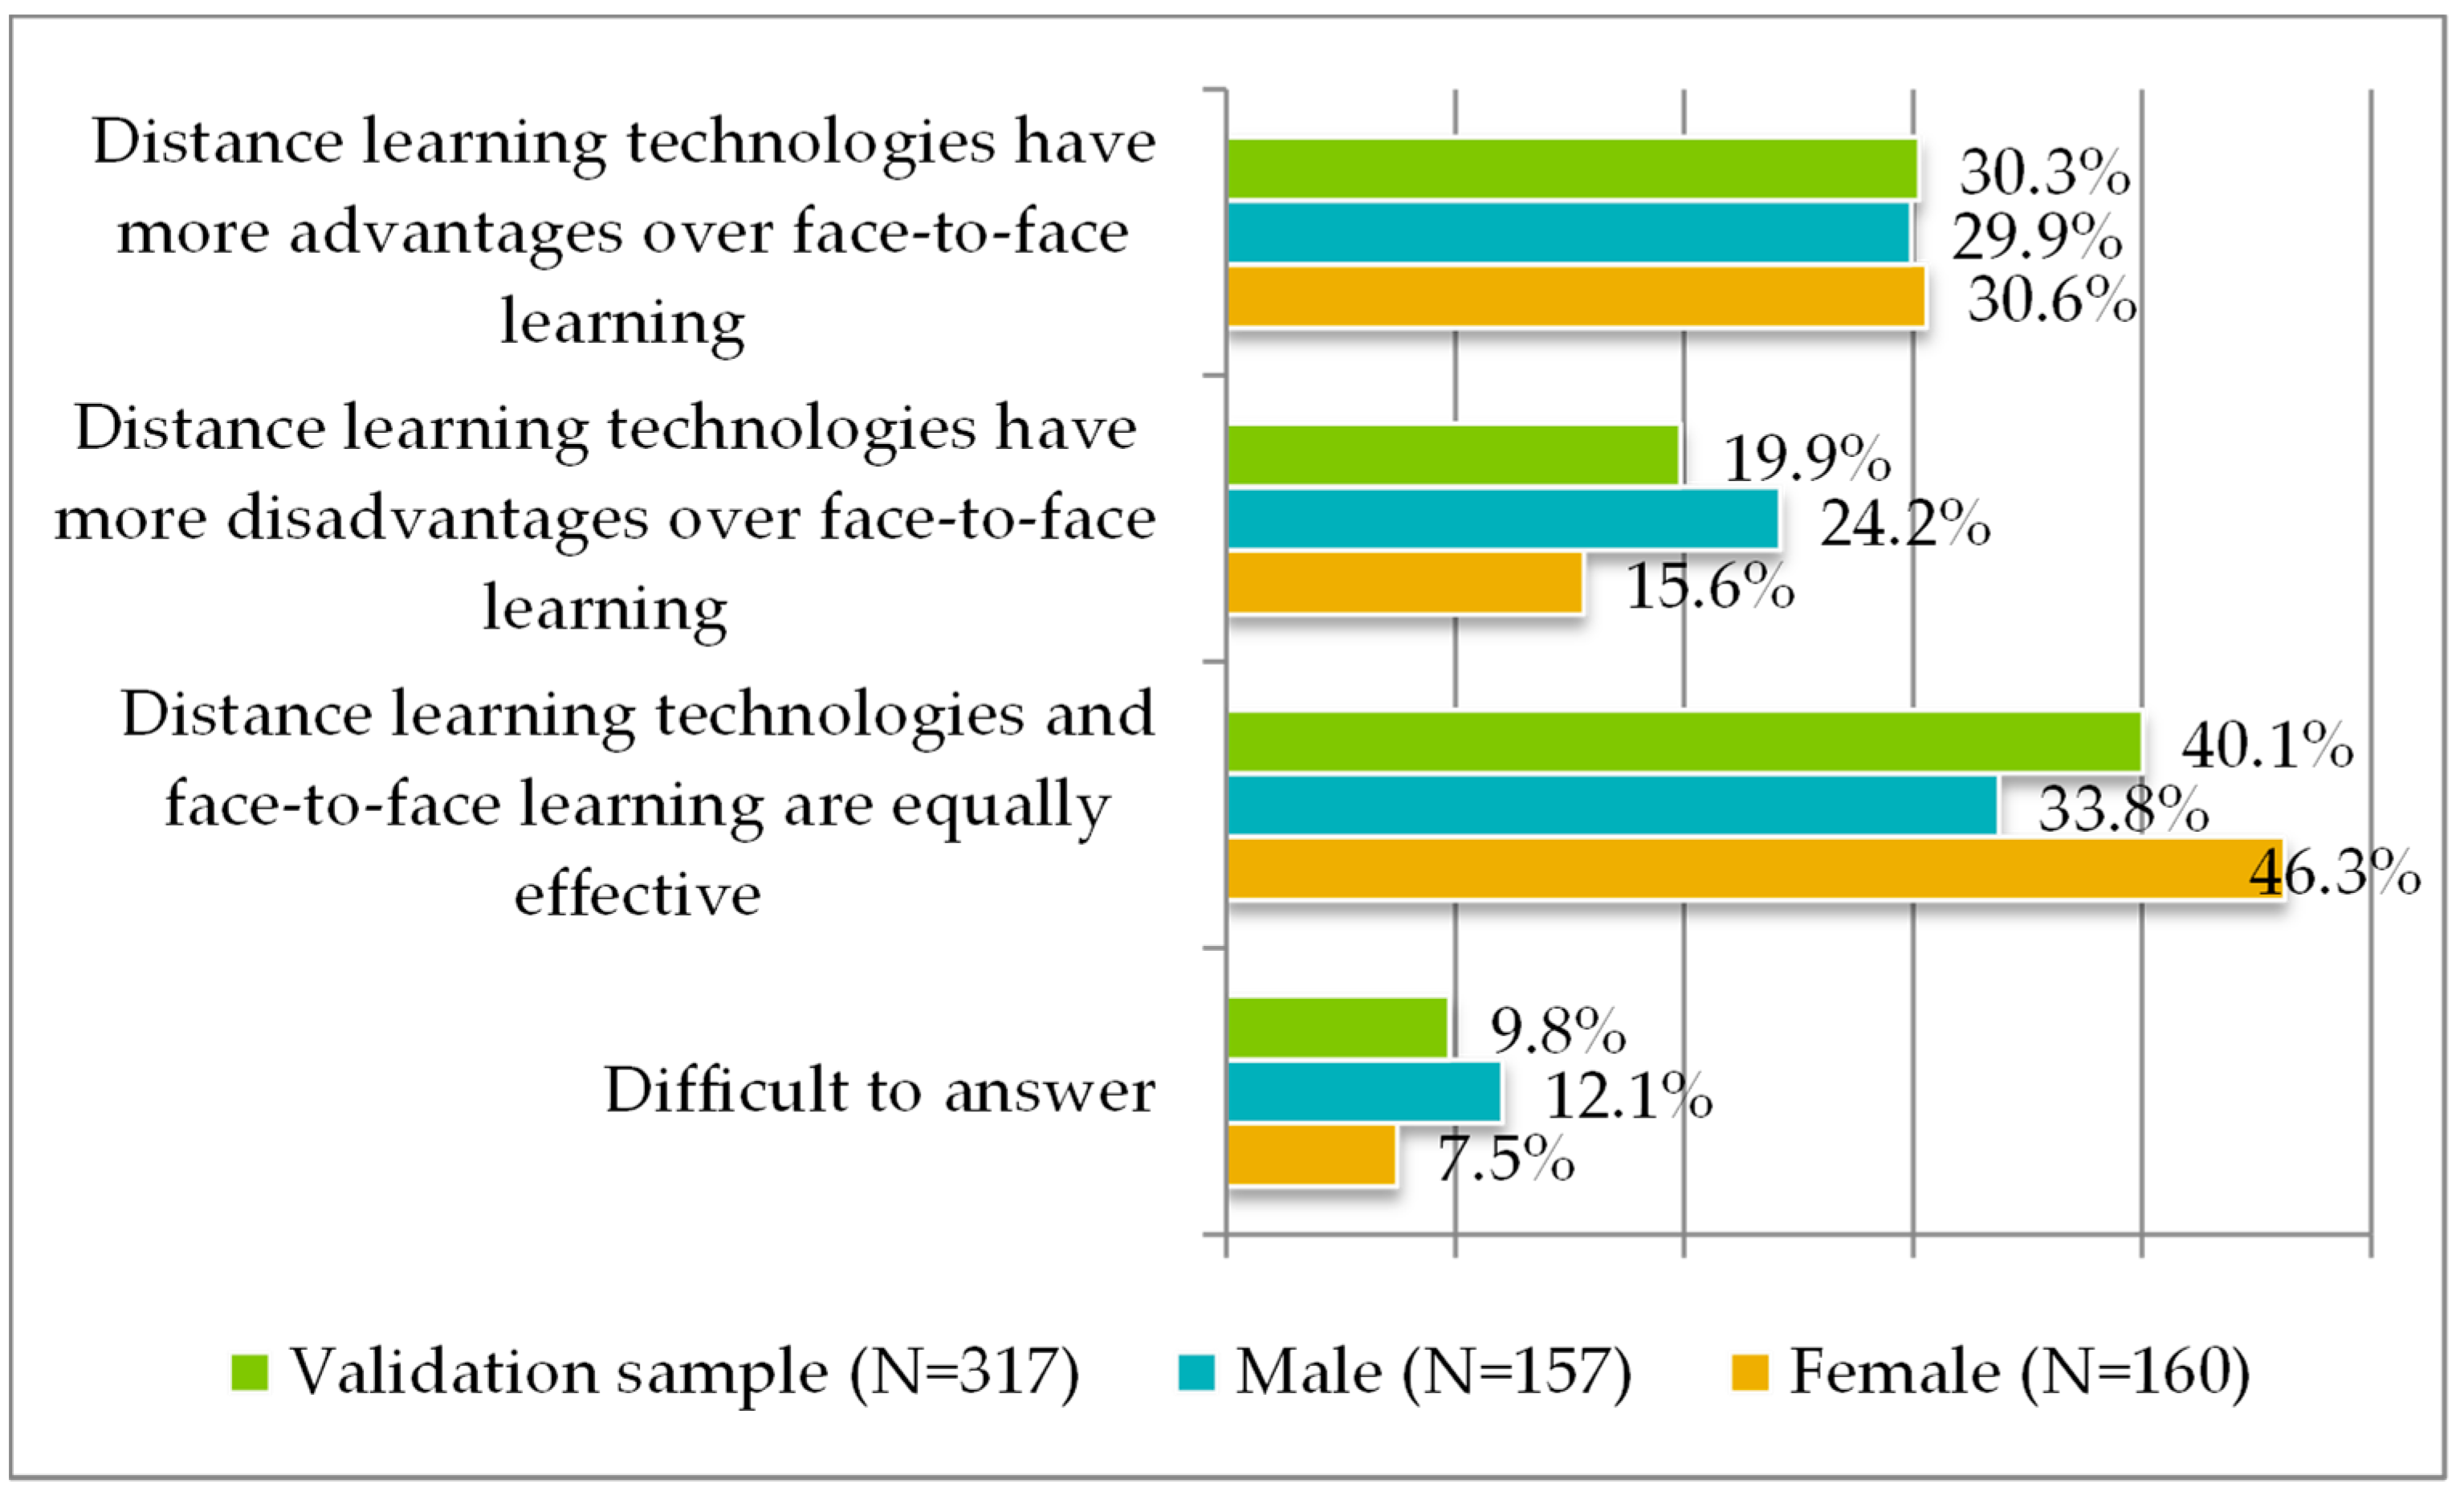
  • “Choose the statement you agree with”: only answers “Distance learning technologies have more advantages over face-to-face learning” and “Distance learning technologies have more disadvantages over face-to-face learning” were compared; the answers “Distance learning technologies and face-to-face learning are equally effective” and “Difficult to answer” were not taken into account (Table 5, Figure 3).
Table 4 shows that students who answered that digital technologies influence the learning process positively (70.3% of the validation sample) have significantly higher scores on the ATDETS-US and all its subscales than those who answered that digital technologies influence the learning process is negative (8.2% of the validation sample). It is important to note that the clear predominance of students who believe that DETs have a positive effect on the education process also indicates the criterion validity of the ATDETS-US, since the real mean on the scale (Table 2) is much higher than the theoretical average value.
Table 5 shows that students who believe that DETs have more advantages over face-to-face education have significantly higher scores on ATDETS-US and all of its subscales than those who have the opposite opinion. This fact also indicates the criterion validity of ATDETS-US.

3.5. Stanine for the ATDETS-US Final Version

Before standardizing ATDETS-US, we compared the scores on this scale and its subscales between male and female students using the Student’s t-test (Table 6).
Due to the fact that significant differences were found between male and female students in terms of ES and ATDETS-US indicators (female students’ indicators are significantly higher), further calculations were carried out separately for groups of male and female students. For standardization, the stanine scale was used because the raw data do not have a normal distribution by the Shapiro–Wilk test (the results of standardization are presented in Table 7).

4. Discussion

Numerous studies of the digitalization of HE, conducted before, during, and after the pandemic, show that university students’ attitudes toward DETs are one of the important psychological factors that can hinder or facilitate the optimal implementation of digital technologies in education [8,11,12,15,16,17,18,19,20,21,22,23,24,27,28,29,30,31]. In this regard, international researchers have developed many tools for diagnosing the attitudes of university students toward various aspects of the digitalization of education, for example, distance learning, remote learning, e-learning, online learning, online education, digital technologies or ICT in education, digital competence [6,32,33,34,35,36,37,38,39,40,41,45,46,47,48,49,50,51]. Many of these diagnostic tools have been developed based on a three-part attitude model that includes emotional, cognitive, and behavioral components (ACB Model) [45,46,47,48,49,50].
However, until recently, no psychodiagnostic scales in Russian were proposed to measure the university students’ attitudes toward DETs, which determined the purpose of the present study. When constructing the ATDETS-US, we relied on the ACB Model of attitude, and we tried to reflect in its items various aspects of the use of DETs, for example, in lectures, seminars, literature searches, homework, etc. The ATDETS-US initial version included 45 items grouped into three subscales, according to the ACB Model (ES, CS, and BS). This version had good internal consistency scores for the scale as a whole and for each of the subscales in the validation sample (317 students at Russian universities), but the hierarchical factor analysis showed insufficient inclusion of several items from BS.
The final version of the ATDETS-US after reduction has the following structure, composition, and scores:
  • Emotional Subscale (α = 0.90; ω = 0.89): 12 items (10 direct and 2 reverse) about students’ emotions and feelings in relation to DETs; raw scores can range from 12 to 60 points;
  • Cognitive Subscale (α = 0.89; ω = 0.88): 12 items (9 direct and 3 reverse) about students’ perceptions and knowledge regarding the DETs, raw scores can range from 12 to 60 points;
  • Behavioral Subscale (α = 0.83; ω = 0.82): 12 items (10 direct and 2 reverse) regarding the use of DETs by students; raw scores can range from 12 to 60 points;
  • The Total Indicator of the ATDETS-US (α = 0.95; ω = 0.86): 36 items (29 direct and 7 reverse), reflecting the general attitude of university students toward digital technologies in education; raw scores can range from 36 to 180 points.
Psychometric testing using Cronbach’s Alpha and McDonald’s Omega coefficients, hierarchical factor analysis, and CFA confirms the high internal consistency and reliability of the ATDETS-US and its subscales and the good fit of the model.
The criterion validity of the ATDETS-US was confirmed by comparing students’ scores on this scale and its subscales with their answers to direct questions: (1) whether DETs positively or negatively affect the educational process and (2) whether DETs have more or fewer advantages compared to face-to-face education. It is important to note that the clear predominance of students who believe that DETs have a positive effect on the educational process indirectly indicates their positive attitude towards DETs, which is confirmed by their high scores on the scale and, accordingly, shows its external validity.
The standardization of the ATDETS-US was carried out separately for the male and female samples since significant differences were found between them in terms of indicators of the ATDETS-US as a whole and its emotional subscale. It was found that the indicators on the ES and the ATDETS-US as a whole are higher in female students. Previous international studies have revealed conflicting data on gender differences in students’ attitudes towards DETs: according to some data, there are no differences [6], and in other studies, attitudes are more positive in female students [46] or male students [47]. Differences in the results may be related both to the characteristics of the samples and the methods used, which requires further research.
The limitations of this study are related to the fact that the validation sample includes more students from large universities in the metropolis, and it is also dominated by university students in the psychological and humanities fields of study. The additional limitation is that external validity was determined only by students’ responses to two survey questions. Accordingly, the prospects for further research are associated with expanding the validation sample by students from different Russian universities, different fields, degrees, forms, and years of study and with the use of additional methods of checking ATDETS-US external validity (for example, expert assessment by teachers and classmates). Further scientific research using the proposed scale will be related to the analysis of factors and predictors of the students’ attitudes toward DETs. For example, we propose to consider academic motivation, personality traits, psychological well-being, time perspective, and other psychological features of personality as attitudes toward DETs predictors among students of different fields, degrees, forms, years of study, etc. Of practical interest is also the identification of relationships between attitudes toward DETs and academic performance in university students. The data obtained will have practical application for the development of specific recommendations on the possible correction and harmonization of attitudes toward DETs (taking into account the severity of affective, cognitive, and behavioral components) in order to improve the academic performance and psychological well-being of students. In the future, we plan to develop a similar scale for diagnosing the attitudes toward DETs in university teachers.
Thus, despite some limitations, this study confirmed the internal and external validity of ATDETS-US and the possibility of its use for obtaining reliable data on the attitudes towards DETs in university students, which should be taken into account when designing programs for their psychological support in the educational process and developing their digital competence.

Supplementary Materials

The following supporting information can be downloaded at: https://www.mdpi.com/article/10.3390/computers12090176/s1, The initial full version of the ATDETS-US and additional survey questions in Russian is presented in the Supplementary Materials.

Author Contributions

Conceptualization, I.A.N., P.A.B., A.L.N. and D.A.S.; methodology, I.A.N., P.A.B., A.L.N. and D.A.S.; software, P.A.B. and D.A.S.; validation, I.A.N., P.A.B., A.L.N. and D.A.S.; formal analysis, I.A.N., P.A.B., A.L.N. and D.A.S.; investigation, I.A.N., P.A.B., A.L.N. and D.A.S.; resources, I.A.N., P.A.B., A.L.N. and D.A.S.; data curation, P.A.B. and D.A.S.; writing—original draft preparation, I.A.N., P.A.B., A.L.N. and D.A.S.; writing—review and editing, I.A.N., P.A.B., A.L.N. and D.A.S.; visualization, P.A.B.; supervision, I.A.N. and A.L.N.; project administration, I.A.N.; funding acquisition, I.A.N. All authors have read and agreed to the published version of the manuscript.

Funding

This publication has been supported by the RUDN University Scientific Projects Grant System, project No 050738–0-000.

Data Availability Statement

The datasets used and analyzed during the current study are available from the corresponding author upon reasonable request.

Acknowledgments

Authors would like to thank all the students involved in the study.

Conflicts of Interest

The authors declare no conflict of interest.

Appendix A

Wording, descriptive statistics, and standardized loads of all items of the ATDETS-US final version.
NoItem/SubscalesMeanSDβz-Valuep
Emotional Subscale51.138.310.8597.44<0.001
1I like that there are modern digital devices and technologies that can be used in the educational process.4.390.970.5576.51<0.001
2rI have a negative attitude towards the possibility of using digital devices and technologies in seminars, even for educational purposes.4.191.080.6687.95<0.001
3I am pleased that digital devices and technologies can be used to pass certifications and exams.4.131.060.5317.14<0.001
5I have a positive attitude towards the opportunities provided by social networks and instant messengers for discussing various issues related to education.4.370.920.7027.90<0.001
7I am glad that in social networks you can find out the news of student life.4.281.000.6167.64<0.001
9rI have a negative attitude towards the use of multimedia presentations in the educational process.4.251.070.5126.35<0.001
10I like that there is now an electronic form for submitting homework.4.321.040.6438.01<0.001
11I like that digital technologies can be applied to seminars and workshops online.4.251.040.7168.48<0.001
12I have a positive attitude to the possibility of receiving remote consultations from teachers and supervisors.4.251.010.6027.72<0.001
13I am pleased with the opportunity to attend online lectures in the academic disciplines of my field of study.4.241.050.6648.48<0.001
14I enjoy getting to know the possibilities of new digital educational technologies.4.141.050.7178.07<0.001
15I am glad that now there is an opportunity to take online courses in areas of interest to me on educational platforms and in other universities.4.330.920.7588.71<0.001
Cognitive Subscale49.277.960.9394.93<0.001
16I am familiar with the principles of using digital devices and technologies in seminars for educational purposes.4.290.890.7025.06<0.001
20rI am new to the rules for submitting homework electronically.4.111.080.6065.19<0.001
21I am aware of the schedule of remote consultations with teachers and supervisors.4.011.040.5905.26<0.001
22I have an idea about the features of new digital educational technologies.4.060.950.7285.14<0.001
23I know the main possibilities and limitations of the use of modern digital devices and technologies in the educational process.4.080.880.6354.97<0.001
24I understand that the use of digital devices and technologies in assessments and examinations has its advantages and disadvantages.4.260.940.5785.15<0.001
25I am aware of the advantages and disadvantages of discussing various educational issues and problems in social networks and instant messengers.4.150.980.5704.89<0.001
26I know well how to use social networks to find out the news of student life.4.340.900.6645.34<0.001
27rI am not familiar with the basic rules and principles of creating and using multimedia presentations in the educational process.3.841.130.5754.91<0.001
28I have an understanding of the advantages and disadvantages of using digital technologies to conduct seminars and workshops online.4.160.930.7045.34<0.001
29I have a good idea of the pros and cons of online lectures in the academic disciplines of my field of study.4.230.970.6755.43<0.001
30rI am not familiar with the possibilities of studying online courses in the disciplines that interest me on educational platforms and in other universities.3.731.170.5504.92<0.001
Behavioral Subscale46.937.760.9135.28<0.001
31I constantly use social networks in order to find out the news of student life.4.051.070.4795.50<0.001
32I have extensive experience in creating and using multimedia presentations in the educational process.3.931.060.5935.59<0.001
33rI often encounter difficulties in seminars and workshops held online.3.771.120.4855.24<0.001
34rIt is difficult for me to absorb the material in online lectures in the academic disciplines of my field of study.3.541.250.4305.06<0.001
35I have already taken or am ready to take an online course in the field of interest to me on external educational platforms or in other universities in the near future.3.671.180.4905.88<0.001
36I constantly use digital devices and technologies in the process of studying at the university.4.290.910.7155.48<0.001
37I have experience passing certifications and passing exams at a university using digital devices and technologies.4.131.160.5005.33<0.001
38I often discuss educational issues and problems on social networks and instant messengers.4.151.020.5395.54<0.001
40I prefer to submit my homework in electronic form rather than in “paper” form.3.871.170.4835.12<0.001
41I often consult with teachers and supervisor through digital technologies.3.541.150.4785.05<0.001
42I constantly master and apply new digital educational technologies.3.911.070.5955.30<0.001
43I often use digital devices and technology in seminars for educational purposes.4.070.970.6785.82<0.001
r—reverse items.

References

  1. Schwab, K. The Fourth Industrial Revolution; World Economic Forum: Geneva, Switzerland, 2016; 184p. [Google Scholar]
  2. Kaputa, V.; Loučanová, E.; Tejerina-Gaite, F.A. Digital Transformation in Higher Education Institutions as a Driver of Social Oriented Innovations. In Social Innovation in Higher Education. Innovation, Technology, and Knowledge Management; Păunescu, C., Lepik, K.-L., Spencer, N., Eds.; Springer: Cham, Switzerland, 2022; pp. 61–85. [Google Scholar] [CrossRef]
  3. Billon, M.; Lera-Lopez, F.; Marco, R. Differences in digitalization levels: A multivariate analysis studying the global digital divide. Rev. World Econ. 2010, 146, 39–73. [Google Scholar] [CrossRef]
  4. Gorbunova, T.N.; Leontiev, A.N. Research of transition processes to u-learning in education. Balt. Humanit. J. 2021, 10, 65–78. (In Russian) [Google Scholar] [CrossRef]
  5. OECD. Education Responses to COVID-19: Embracing Digital Learning and Online Collaboration. 2020. Available online: https://read.oecd.org/10.1787/d75eb0e8-en?format=pdf (accessed on 1 July 2023).
  6. Tzafilkou, K.; Perifanou, M.; Economides, A.A. Development and validation of a students’ remote learning attitude scale (RLAS) in higher education. Educ. Inf. Technol. 2021, 26, 7279–7305. [Google Scholar] [CrossRef] [PubMed]
  7. Brika, S.K.M.; Chergui, K.; Algamdi, A.; Musa, A.A.; Zouaghi, R. E-Learning Research Trends in Higher Education in Light of COVID-19: A Bibliometric Analysis. Front. Psychol. 2022, 12, 762819. [Google Scholar] [CrossRef]
  8. Aleshkovskiy, I.A.; Gasparishvili, A.T.; Krukhmaleva, O.V.; Narbut, N.P.; Savina, N.E. Russian university students about distance learning: Assessments and opportunities. Vyss. Obraz. Ross. 2020, 29, 86–100. (In Russian) [Google Scholar] [CrossRef]
  9. Bakhov, I.; Opolska, N.; Bogus, M.; Anishchenko, V.; Biryukova, Y. Emergency Distance Education in the Conditions of COVID-19 Pandemic: Experience of Ukrainian Universities. Educ. Sci. 2021, 11, 364. [Google Scholar] [CrossRef]
  10. Drozdikova-Zaripova, A.R.; Valeeva, R.A.; Latypov, N.R. The Impact of Isolation Measures during COVID-19 Pandemic on Russian Students’ Motivation for Learning. Educ. Sci. 2021, 11, 722. [Google Scholar] [CrossRef]
  11. Gonçalves, S.P.; Sousa, M.J.; Pereira, F.S. Distance Learning Perceptions from Higher Education Students—The Case of Portugal. Educ. Sci. 2020, 10, 374. [Google Scholar] [CrossRef]
  12. Li, D. The Shift to Online Classes during the COVID-19 pandemic: Benefits, Challenges, and Required Improvements from the Students’ Perspective. Electron. J. e-Learn. 2022, 20, 1–18. [Google Scholar] [CrossRef]
  13. Radu, M.-C.; Schnakovszky, C.; Herghelegiu, E.; Ciubotariu, V.-A.; Cristea, I. The Impact of the COVID-19 Pandemic on the Quality of Educational Process: A Student Survey. Int. J. Environ. Res. Public Health. 2020, 17, 7770. [Google Scholar] [CrossRef]
  14. Afroz, R.; Islam, N.; Rahman, S.; Zerin Anny, N. Students’ and teachers’ attitude towards online classes during COVID-19 pandemic: A study on three Bangladeshi government colleges. IJRBS 2021, 10, 462–476. [Google Scholar] [CrossRef]
  15. Aleshkovski, I.A.; Gasparishvili, A.T.; Krukhmaleva, O.V.; Narbut, N.P.; Savina, N.E. Russian students about learning under the COVID-19 pandemic: Resources, opportunities and assessment of the distance learning. RUDN J. Sociol. 2021, 21, 211–224. (In Russian) [Google Scholar] [CrossRef]
  16. Belinskaya, E.P.; Fedorova, N.V. Personal factors of evaluating the efficiency of distance education. Obrazovanie Lichnosti 2020, 10, 44–53. (In Russian) [Google Scholar]
  17. Bhagat, K.K.; Wu, L.Y.; Chang, C.-Y. The impact of personality on students’ perceptions towards online learning. AJET 2019, 35, 98–108. [Google Scholar] [CrossRef]
  18. Boca, G.D. Factors influencing students’ behavior and attitude towards online education during COVID-19. Sustainability 2021, 13, 7469. [Google Scholar] [CrossRef]
  19. Cabezas-González, M.; Casillas-Martín, S.; García-Valcárcel Muñoz-Repiso, A. Theoretical Models Explaining the Level of Digital Competence in Students. Computers 2023, 12, 100. [Google Scholar] [CrossRef]
  20. Ikhlas, M.; Dela Rosa, E.D. Profile and predictors of high school teachers’ attitude and self-efficacy in utilizing ICT: An investigation from Indonesia. SN Soc. Sci. 2023, 3, 71. [Google Scholar] [CrossRef]
  21. Narbut, N.P.; Aleshkovski, I.A.; Gasparishvili, A.T.; Krukhmaleva, O.V. Forced shift to distance learning as an impetus to technological changes in the Russian higher education. RUDN J. Sociol. 2020, 20, 611–621. (In Russian) [Google Scholar] [CrossRef]
  22. Rizun, M.; Strzelecki, A. Students’ Acceptance of the COVID-19 Impact on Shifting Higher Education to Distance Learning in Poland. Int. J. Environ. Res. Public Health 2020, 17, 6468. [Google Scholar] [CrossRef]
  23. Sangwan, A.; Sangwan, A.; Punia, P. Development and validation of an attitude scale towards online teaching and learning for higher education teachers. TechTrends 2020, 65, 187–195. [Google Scholar] [CrossRef]
  24. Vladova, G.; Ullrich, A.; Bender, B.; Gronau, N. Students’ Acceptance of Technology-Mediated Teaching—How It Was Influenced During the COVID-19 Pandemic in 2020: A Study from Germany. Front. Psychol. 2021, 12, 636086. [Google Scholar] [CrossRef] [PubMed]
  25. Vial, G. Understanding digital transformation: A review and a research agenda. J. Strateg. Inf. Syst. 2019, 28, 118–144. [Google Scholar] [CrossRef]
  26. Sebastian, I.M.; Ross, J.W.; Beath, C.; Mocker, M.; Moloney, K.G.; Fonstad, N.O. How Big Old Companies Navigate Digital Transformation. MISQE 2017, 16, 197–213. [Google Scholar]
  27. Bychkova, P.A. Psychological Characteristics of Students and Their Attitude to Digital Educational Technologies. Master’s Thesis, RUDN University, Moscow, Russia, 2020. (In Russian). [Google Scholar]
  28. Novikova, I.; Bychkova, P. Attitudes towards Digital Educational Technologies, Academic Motivation and Academic Achievements Among Russian University Students. In Digital Transformation and Global Society. DTGS 2021. Communications in Computer and Information Science; Alexandrov, D.A., Boukhanovsky, A.V., Chugunov, A.V., Kabanov, Y., Koltsova, O., Musabirov, I., Pashakhin, S., Eds.; Springer: Cham, Switzerland, 2022; Volume 1503, pp. 280–293. [Google Scholar] [CrossRef]
  29. Novikova, I.A.; Bychkova, P.A.; Novikov, A.L. Attitudes towards Digital Educational Technologies among Russian University Students before and during the COVID-19 Pandemic. Sustainability 2022, 14, 6203. [Google Scholar] [CrossRef]
  30. Novikova, I.A.; Bychkova, P.A.; Novikov, A.L. University students’ attitudes towards digital educational technologies before and after outbreak of COVID-19 pandemic. Tsennosti Smysly 2021, 13, 23–44. (In Russian) [Google Scholar] [CrossRef]
  31. Novikova, I.A.; Bychkova, P.A.; Novikov, A.L.; Shlyakhta, D.A. Personality Traits and Academic Motivation as Predictors of Attitudes towards Digital Educational Technologies among Russian University Students. RUDN J. Psychol. Pedagog. 2022, 19, 689–716. [Google Scholar] [CrossRef]
  32. Atkinson, J.K.; Blankenship, R. Online learning readiness of undergraduate college students: A comparison between male and female students. Int. J. Learn. High. Educ. 2009, 5, 49–56. [Google Scholar]
  33. Bernard, R.M.; Brauer, A.; Abrami, P.C.; Surkes, M. The development of a questionnaire for predicting online learning achievement. Distance Educ. 2004, 25, 31–47. [Google Scholar] [CrossRef]
  34. Chou, T.R. A scale of university students’ attitudes toward e-learning on the Moodle System. IJOPCD 2014, 4, 49–65. [Google Scholar] [CrossRef]
  35. Coates, H. Student Engagement in Campus-Based and Online Education: University Connections, 1st ed.; Routledge: London, England, 2006. [Google Scholar] [CrossRef]
  36. Edmunds, R.; Thorpe, M.; Conole, G. Student attitudes towards and use of ICT in course study, work and social activity: A technology acceptance model approach. BJET 2012, 43, 71–84. [Google Scholar] [CrossRef]
  37. Hung, M.-L.; Chou, C.; Chen, C.-H.; Own, Z.-Y. Learner readiness for online learning: Scale development and student perceptions. Comput. Educ. 2010, 55, 1080–1090. [Google Scholar] [CrossRef]
  38. Kar, D.; Saha, B.; Chandra Mondal, B. Attitude of university students towards e-learning in West Bengal. Am. J. Educ. Res. 2014, 2, 669–673. [Google Scholar] [CrossRef]
  39. Mishra, S.; Panda, S. Development and factor analysis of an instrument to measure faculty attitude towards e-learning. Asian J. Distance Educ. 2007, 5, 27–33. [Google Scholar]
  40. Rosen, L.D.; Whaling, K.; Carrier, L.M.; Cheever, N.A.; Rokkum, J. The Media and Technology Usage and Attitudes Scale: An empirical investigation. Comput. Human Behav. 2013, 29, 2501–2511. [Google Scholar] [CrossRef]
  41. Selwyn, N. Students’ attitudes toward computers: Validation of a computer attitude scale for 16–19 education. Comput. Educ. 1997, 28, 35–41. [Google Scholar] [CrossRef]
  42. APA Dictionary of Psychology, 2nd ed.; VandenBos, G.R. (Ed.) American Psychological Association: Washington, DC, USA, 2015. [Google Scholar] [CrossRef]
  43. Guillén-Gámez, F.D.; Mayorga-Fernández, M.J. Identification of variables that predict teachers’ attitudes toward ICT in higher education for teaching and research: A Study with regression. Sustainability 2020, 12, 1312. [Google Scholar] [CrossRef]
  44. Ajzen, I.; Fishbein, M. Understanding Attitudes and Predicting Social Behavior; Prentice-Hall: Englewood Cliffs, NJ, USA, 1980; 278p. [Google Scholar]
  45. Svenningsson, J.; Höst, G.; Hultén, M.; Hallström, J. Students’ attitudes toward technology: Exploring the relationship among affective, cognitive and behavioral components of the attitude construct. Int. J. Technol. Des. Educ. 2022, 32, 1531–1551. [Google Scholar] [CrossRef]
  46. García-Martínez, J.-A.; Fuentes-Abeledo, E.-J.; Rodríguez-Machado, E.-R. Attitudes towards the use of ICT in Costa Rican university students: The influence of sex, academic performance, and training in technology. Sustainability 2020, 13, 282. [Google Scholar] [CrossRef]
  47. Guillén-Gámez, F.D.; Romero Martínez, S.J.; Ordóñez Camacho, X.G. Diagnosis of the attitudes towards ICT of education students according to gender and educational modality. Apertura 2020, 12, 56–71. [Google Scholar] [CrossRef]
  48. Ordóñez, X.G.; Romero, S.J. Scale of Attitudes Towards ICT (SATICT): Factor structure and factorial invariance in distance university students. In Proceedings of the 1st International Conference on Advanced Research Methods and Analytics; Valencia, Spain, 6–7 June 2016, Domenech, J., Mas-Tur, A., Roig-Tierno, N., Vicente, M.R., Eds.; Editorial Universitat Politècnica de València: València, Spain, 2016; pp. 159–166. [Google Scholar] [CrossRef]
  49. Prokop, P.; Fančovičová, J. Students’ Attitudes toward computer use in Slovakia. EURASIA J. Math. Sci Tech. Ed. 2008, 4, 255–262. [Google Scholar] [CrossRef] [PubMed]
  50. Romero Martínez, S.J.; Ordóñez Camacho, X.G.; Guillén-Gamez, F.D.; Bravo Agapito, J. Attitudes toward technology among distance education students: Validation of an explanatory model. OLJ 2020, 24, 59–75. [Google Scholar] [CrossRef]
  51. Svenningsson, J.; Hultén, M.; Hallström, J. Understanding attitude measurement: Exploring meaning and use of the PATT short questionnaire. Int. J. Technol. Des. Educ. 2016, 28, 67–83. [Google Scholar] [CrossRef]
  52. Popova, O.I. Digitalization of education and university brand: Students’ attitude to processes. Manag. Issues 2019, 13, 245–250. [Google Scholar] [CrossRef]
  53. Sorokova, M.G.; Odintsova, M.A.; Radchikova, N.P. Scale for Assessing University Digital Educational Environment (AUDEE Scale). Psychol. Sci. Educ. 2021, 26, 52–65. [Google Scholar] [CrossRef]
  54. Soldatova, G.U.; Rasskazova, E.I. Brief and screening versions of the Digital Competence Index: Verification and application possibilities. Natl. Psychol. J. 2018, 11, 47–56. (In Russian) [Google Scholar] [CrossRef]
  55. McDonald, R.P. Test Theory: A Unified Treatment, 1st ed.; Psychology Press: New York, NY, USA, 1999. [Google Scholar] [CrossRef]
  56. Zinbarg, R.E.; Revelle, W.; Yovel, I.; Li, W. Cronbach’s α, Revelle’s β, and McDonald’s ωH: Their relations with each other and two alternative conceptualizations of reliability. Psychometrika 2005, 70, 123–133. [Google Scholar] [CrossRef]
  57. Zinbarg, R.E.; Yovel, I.; Revelle, W.; McDonald, R.P. Estimating Generalizability to a Latent Variable Common to All of a Scale’s Indicators: A Comparison of Estimators for ωh. Appl. Psychol. Meas. 2006, 30, 121–144. [Google Scholar] [CrossRef]
  58. Jensen, A.R.; Weng, L.-J. What is a good g? Intelligence 1994, 18, 231–258. [Google Scholar] [CrossRef]
  59. Brown, T.A. Confirmatory Factor Analysis for Applied Research, 2nd ed.; The Guilford Press: New York, NY, USA, 2015. [Google Scholar]
  60. R Core Team. R: A Language and Environment for Statistical Computing. Version 4.1. Available online: https://cran.r-project.org, (accessed on 1 January 2022).
  61. Revelle, W. Psych: Procedures for Psychological, Psychometric, and Personality Research (R Package). 2019. Available online: https://cran.r-project.org/package=psych (accessed on 22 March 2022).
  62. The Jamovi Project: Jamovi. (Version 2.3). Available online: https://www.jamovi.org (accessed on 16 March 2022).
  63. Jorgensen, T.D.; Pornprasertmanit, S.; Schoemann, A.M.; Rosseel, Y. semTools: Useful Tools for Structural Qquation Modeling. R Package Version 0.5-1. 2018. Available online: https://CRAN.R-project.org/package=semTools (accessed on 30 August 2023).
  64. Green, S.B.; Yang, Y. Reliability of Summed Item Scores Using Structural Equation Modeling: An Alternative to Coefficient Alpha. Psychometrika 2009, 74, 155–167. [Google Scholar] [CrossRef]
Figure 1. The standardized parameters of the scale ATDETS-US factor model (all parameters are significant at p < 0.001). Note: Emtnal—Emotional Subscale, Cgntv—Cognitive Subscale; Bhvrl—Behavioral Subscale; Sum—ATDETS-US.
Computers 12 00176 g001
Figure 2. Frequency of answer to a question: “How do you think digital technologies affect the learning process?” (in %).
Computers 12 00176 g002
Figure 3. Frequency of answer to a question: “Choose the statement you agree with:” (in %).
Computers 12 00176 g003
Table 1. Participants socio-demographic characteristics (N = 317).
N%
GenderMale15749.5
Female16050.5
Age17–2227486.4
23–293611.3
31–3572.2
CountryRussian Federation27285.8
Foreign4514.2
Field of studyPsychology and Pedagogy8727.4
Mathematics and Informatics4614.5
Economics4514.2
Philology and Linguistics3912.3
Management and Law3410.7
Engineering154.7
Agronomy and Veterinary103.2
Journalism61.9
Other Fields3511.0
DegreeBachelor’s 26884.5
Master’s288.8
Specialist216.6
Form of studyFull-time27687.1
Extramural278.5
Part-time144.4
Table 2. Descriptive statistics, Cronbach’s alpha, and MacDonald’s omega coefficients for ATDETS-US final version and its subscales.
ScalesMeans ± SDMeMinMaxSkewness ± SEKurtosis ± SECronbach’s
Alpha
MacDonald’s
Omega
Emotional Subscale51.13 ± 8.31542260−0.88 ± 0.14−0.12 ± 0.270.900.89
Cognitive Subscale49.27 ± 7.96502660−0.56 ± 0.14−0.46 ± 0.270.890.88
Behavioral Subscale46.93 ± 7.76472460−0.18 ± 0.14−0.63 ± 0.270.830.82
ATDETS-US147.33 ± 21.5915173180−0.53 ± 0.14−0.44 ± 0.270.950.86
Table 3. Indices for ATDETS-US three-factor model compliance with data.
Modelχ2dfpNNFI(TLI)CFISRMRRMSEA95% CI
Three-factor1105591<0.0011.0011.0000.0580.0380.035–0.041
Table 4. Means, standard deviations, Student’s t-test, and Cohen’s d for indicators of ATDETS-US and its subscales among students who think digital technologies positively or negatively affect the learning process.
ScalesMeans ± SDt-Testp-ValueCohen’s d
Positively Affect
(N = 223)
Negatively Affect
(N = 26)
Emotional Subscale53.62 ± 6.7343.46 ± 8.705.758<0.0011.307
Cognitive Subscale51.06 ± 7.0046.04 ± 9.322.6620.0130.609
Behavioral Subscale49.00 ± 7.1841.85 ± 6.385.337<0.0011.053
ATDETS-US153.69 ± 18.44131.35 ± 21.305.129<0.0011.122
Table 5. Means, standard deviations, Student’s t-test, and Cohen’s d for indicators of ATDETS-US and its subscales among students who believe that distance learning technologies have more advantages or disadvantages over face-to-face learning.
ScalesMeans ± SDt-Testp-ValueCohen’s d
More Advantages
(N = 96)
More Disadvantages
(N = 63)
Emotional Subscale53.10 ± 7.8747.44 ± 8.334.333<0.0010.703
Cognitive Subscale50.79 ± 7.9847.87 ± 7.732.2850.0240.371
Behavioral Subscale49.68 ± 7.2142.54 ± 6.926.201<0.0011.006
ATDETS-US153.57 ± 20.69137.86 ± 19.854.76<0.0010.772
Table 6. Means, standard deviations, Student’s t-test, and Cohen’s d for indicators of ATDETS-US and its subscales among male and female students.
ScalesMeans ± SDt-Testp-ValueCohen’s d
Male
(N = 157)
Female
(N = 160)
Emotional Subscale49.36 ± 8.6752.86 ± 7.58−3.816<0.001−0.429
Cognitive Subscale48.44 ± 8.3850.09 ± 7.46−1.8560.064−0.209
Behavioral Subscale46.39 ± 7.7547.46 ± 7.77−1.2320.219−0.138
ATDETS-US144.19 ± 22.03150.41 ± 20.76−2.5870.010−0.291
Table 7. Stanine Score for ATDETS-US and its subscales of male and female students.
ScalesGenderStanine and Levels
123456789
4% 7% 12%17% 20% 17% 12% 7% 4%
Very LowBelow AverageAverageAbove Average Very High
Emotional SubscaleMale1–3334–3637–4243–4849–5455–58586060
Female0–3637–4243–4950–5356–5657–59606060
Cognitive SubscaleMale1–3435–3637–4142–4748–5253–5656–596060
Female1–3637–4041–4546–4849–5354–57585960
Behavioral SubscaleMale1–353637–4041–4344–4950–5354–5657–5960
Female1–3637–3940–4142–4546–5051–5556–5758–5960
ATDETS-USMale3–108109–111112–126127–140141–154155–164165–171172–176177–180
Female3–109110–125126–135136–148149–159160–168169–175176–178179–180
Disclaimer/Publisher’s Note: The statements, opinions and data contained in all publications are solely those of the individual author(s) and contributor(s) and not of MDPI and/or the editor(s). MDPI and/or the editor(s) disclaim responsibility for any injury to people or property resulting from any ideas, methods, instructions or products referred to in the content.

