


You Look like You’ll Buy It! Purchase Intent Prediction Based on Facially Detected Emotions in Social Media Campaigns for Food Products

Abstract
:1. Introduction
2. Materials and Methods
2.1. Content Stimuli and Experimental Design
2.2. Participants and Procedure
2.3. Data Collection and Processing
2.4. Classification
3. Results
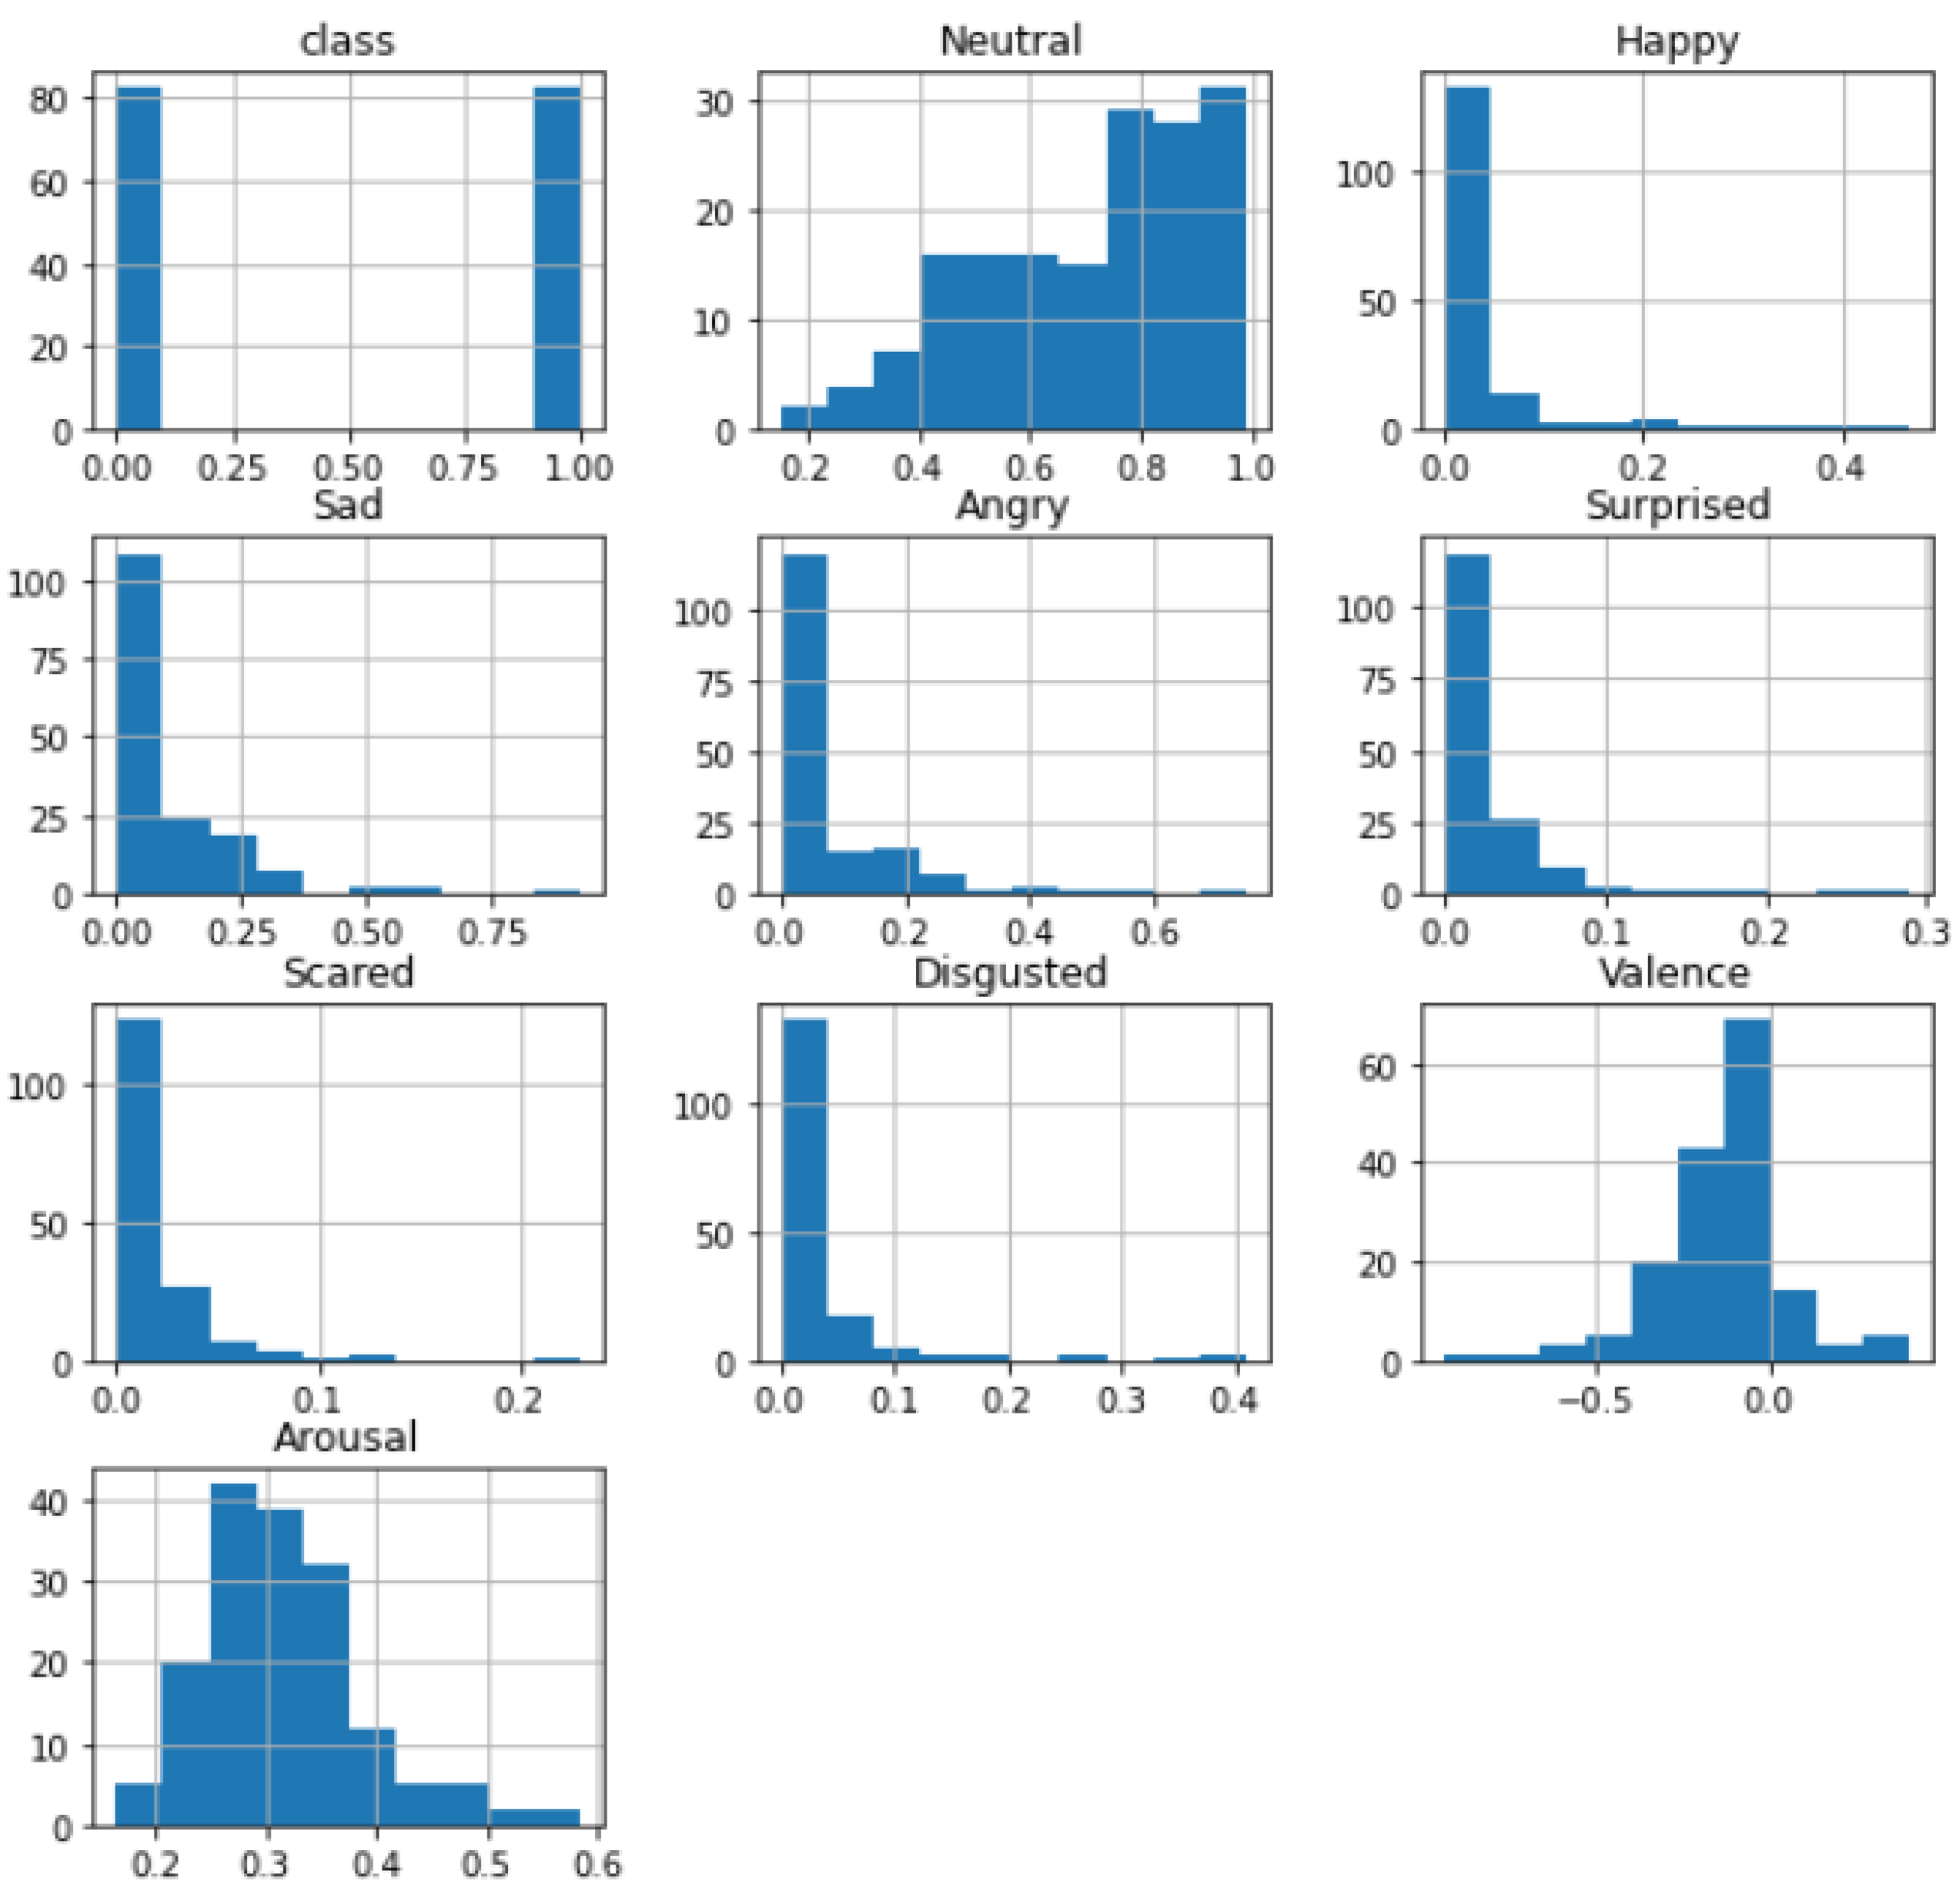
3.1. Descriptive Statistics
3.2. Classification Results
4. Discussion, Implications, and Limitations
5. Conclusions
Author Contributions
Funding
Data Availability Statement
Conflicts of Interest
References
- Martínez, A.; Schmuck, C.; Pereverzyev, S.; Pirker, C.; Haltmeier, M. A Machine Learning Framework for Customer Purchase Prediction in the Non-Contractual Setting. Eur. J. Oper. Res. 2020, 281, 588–596. [Google Scholar] [CrossRef]
- Jacobs, B.J.D.; Donkers, B.; Fok, D. Model-based purchase predictions for large assortments. Mark. Sci. 2016, 35, 389–404. [Google Scholar] [CrossRef]
- Hu, X.; Huang, Q.; Zhong, X.; Davison, R.M.; Zhao, D. The Influence of Peer Characteristics and Technical Features of a Social Shopping Website on a Consumer’s Purchase Intention. Int. J. Inf. Manag. 2016, 36, 1218–1230. [Google Scholar] [CrossRef]
- Ravaja, N.; Somervuori, O.; Salminen, M. Predicting Purchase Decision: The Role of Hemispheric Asymmetry over the Frontal Cortex. J. Neurosci. Psychol. Econ. 2013, 6, a0029949. [Google Scholar] [CrossRef]
- Venkatesh, V.; Agarwal, R. Turning Visitors into Customers: A Usability-centric Perspective on Purchase Behavior in Electronic Channels. Manag. Sci. 2006, 52, 367–382. [Google Scholar] [CrossRef]
- Sismeiro, C.; Bucklin, R.E. Modeling Purchase Behavior at an E-Commerce Web Site: A Task Completion Approach Revised June 2003 Revised November 2003. SAGE J. 2004, 41, 35985. [Google Scholar]
- Zhu, G.; Wu, Z.; Wang, Y.; Cao, S.; Cao, J. Online Purchase Decisions for Tourism E-Commerce. Electron. Commer. Res. Appl. 2019, 38, 100887. [Google Scholar] [CrossRef]
- Chaudhuri, N.; Gupta, G.; Vamsi, V.; Bose, I. On the Platform but Will They Buy? Predicting Customers’ Purchase Behavior Using Deep Learning. Decis. Support Syst. 2021, 149, 113622. [Google Scholar] [CrossRef]
- Xu, Z.; Dang, Y.; Wang, Q. Potential Buyer Identification and Purchase Likelihood Quantification by Mining User-Generated Content on Social Media. Expert Syst. Appl. 2022, 187, 115899. [Google Scholar] [CrossRef]
- Juodeikiene, G.; Zadeike, D.; Klupsaite, D.; Cernauskas, D.; Bartkiene, E.; Lele, V.; Steibliene, V.; Adomaitiene, V. Effects of Emotional Responses to Certain Foods on the Prediction of Consumer Acceptance. Food Res. Int. 2018, 112, 361–368. [Google Scholar] [CrossRef]
- Otterbring, T.; Folwarczny, M.; Gidlöf, K. Hunger Effects on Option Quality for Hedonic and Utilitarian Food Products. Food Qual. Prefer. 2023, 103, 104693. [Google Scholar] [CrossRef]
- Talen, L.; den Uyl, T.E. Complex Website Tasks Increase the Expression Anger Measured with FaceReader Online. Int. J. Hum. Comput. Interact. 2022, 38, 282–288. [Google Scholar] [CrossRef]
- Danner, L.; Haindl, S.; Joechl, M.; Duerrschmid, K. Facial Expressions and Autonomous Nervous System Responses Elicited by Tasting Different Juices. Food Res. Int. 2014, 64, 81–90. [Google Scholar] [CrossRef]
- Garcia-Burgos, D.; Zamora, M.C. Facial Affective Reactions to Bitter-Tasting Foods and Body Mass Index in Adults. Appetite 2013, 71, 178–186. [Google Scholar] [CrossRef] [PubMed]
- He, W.; Boesveldt, S.; de Graaf, C.; de Wijk, R.A. The Relation between Continuous and Discrete Emotional Responses to Food Odors with Facial Expressions and Non-Verbal Reports. Food Qual. Prefer. 2016, 48, 130–137. [Google Scholar] [CrossRef]
- Leitch, K.A.; Duncan, S.E.; Keefe, S.O.; Rudd, R.; Gallagher, D.L. Characterizing Consumer Emotional Response to Sweeteners Using an Emotion Terminology Questionnaire and Facial Expression Analysis. FRIN 2015, 76, 283–292. [Google Scholar] [CrossRef]
- Van Bommel, R.; Stieger, M.; Visalli, M.; De Wijk, R.; Jager, G. Does the Face Show What the Mind Tells? A Comparison between Dynamic Emotions Obtained from Facial Expressions and Temporal Dominance of Emotions (TDE). Food Qual. Prefer. 2020, 85, 103976. [Google Scholar] [CrossRef]
- Mena, B.; Torrico, D.D.; Hutchings, S.; Ha, M.; Ashman, H.; Warner, R.D. Understanding Consumer Liking of Beef Patties with Different Firmness among Younger and Older Adults Using FaceReaderTM and Biometrics. Meat Sci. 2023, 199, 109124. [Google Scholar] [CrossRef]
- Mahieu, B.; Visalli, M.; Schlich, P.; Thomas, A. Eating Chocolate, Smelling Perfume or Watching Video Advertisement: Does It Make Any Di Ff Erence on Emotional States Measured at Home Using Facial Expressions ? Food Qual. Prefer. 2019, 77, 102–108. [Google Scholar] [CrossRef]
- Yu, C.; Ko, C. Applying FaceReader to Recognize Consumer Emotions in Graphic Styles. Procedia CIRP 2017, 60, 104–109. [Google Scholar] [CrossRef]
- McDuff, D.; El Kaliouby, R.; Cohn, J.F.; Picard, R.W. Predicting Ad Liking and Purchase Intent: Large-Scale Analysis of Facial Responses to Ads. IEEE Trans. Affect. Comput. 2015, 6, 223–235. [Google Scholar] [CrossRef]
- McDuff, D.; El Kaliouby, R.; Senechal, T.; Demirdjian, D.; Picard, R. Automatic Measurement of Ad Preferences from Facial Responses Gathered over the Internet. Image Vis. Comput. 2014, 32, 630–640. [Google Scholar] [CrossRef]
- Pichierri, M.; Peluso, A.M.; Pino, G.; Guido, G. Health Claims’ Text Clarity, Perceived Healthiness of Extra-Virgin Olive Oil, and Arousal: An Experiment Using FaceReader. Trends Food Sci. Technol. 2021, 116, 1186–1194. [Google Scholar] [CrossRef]
- Tzafilkou, K.; Panavou, R.; Economides, A.A. Facially Expressed Emotions and Hedonic Liking on Social Media Food Marketing Campaigns: Comparing Different Types of Products and Media Posts. In Proceedings of the 2022 17th International Workshop on Semantic and Social Media Adaptation & Personalization (SMAP), Corfu, Greece, 3–4 November 2022; pp. 1–6. [Google Scholar] [CrossRef]
- Ding, Y.; Zhao, T. Emotions, Engagement, and Self-Perceived Achievement in a Small Private Online Course. J. Comput. Assist. Learn. 2019, 36, 449–457. [Google Scholar] [CrossRef]
- Tzafilkou, K.; Economides, A.A. Mobile Game-Based Learning in Distance Education: A Mixed Analysis of Learners’ Emotions and Gaming Features. In Proceedings of the Learning and Collaboration Technologies: Games and Virtual Environments for Learning: 8th International Conference, LCT 2021, Held as Part of the 23rd HCI International Conference, HCII 2021, Virtual Event, 24–29 July 2021; pp. 115–132. [Google Scholar] [CrossRef]
- Ekman, P. Are There Basic Emotions? Psychol. Rev. 1992, 99, 550–553. [Google Scholar] [CrossRef]
- Loijens, L.; Krips, O. Facereader Methodology; Noldus Information Technology: Wageningen, The Netherlands, 2013. [Google Scholar]
- Olsen, A.F.; Torresen, J. Smartphone Accelerometer Data Used for Detecting Human Emotions. In Proceedings of the 2016 3rd International Conference on Systems and Informatics (ICSAI), Shanghai, China, 19–21 November 2016; pp. 410–415. [Google Scholar]
- Piskioulis, O.; Tzafilkou, K.; Economides, A.A. Emotion Detection through Smartphone’s Accelerometer and Gyroscope Sensors. In Proceedings of the 29th ACM Conference on User Modeling, Adaptation and Personalization (UMAP ‘21). Association for Computing Machinery, New York, NY, USA, 21–25 June 2021; pp. 130–137. [Google Scholar] [CrossRef]
- Osisanwo, F.Y.; Akinsola, J.E.T.; Awodele, O.; Hinmikaiye, J.O.; Olakanmi, O.; Akinjobi, J. Supervised Machine Learning Algorithms: Classification and Comparison. Int. J. Comput. Trends Technol. 2017, 48, 128–138. [Google Scholar] [CrossRef]
- Gove, R.; Faytong, J. Machine Learning and Event-Based Software Testing: Classifiers for Identifying Infeasible GUI Event Sequences; Elsevier Inc.: Amsterdam, The Netherlands, 2012; Volume 86, ISBN 9780123965356. [Google Scholar]
- Pretorius, A.; Bierman, S.; Steel, S.J. A Meta-Analysis of Research in Random Forests for Classification. In Proceedings of the 2016 Pattern Recognition Association of South Africa and Robotics and Mechatronics International Conference (PRASA)-RobMech 2016, Stellenbosch, South Africa, 30 November–2 December 2016. [Google Scholar] [CrossRef]
- Jiang, Y.; King, J.M.; Prinyawiwatkul, W. A Review of Measurement and Relationships between Food, Eating Behavior and Emotion. Trends Food Sci. Technol. 2014, 36, 15–28. [Google Scholar] [CrossRef]
- Ekman, P. Friesen, Facial Action Coding System: A Technique for the Measurement of Facial Movement; Consulting Psychologists Press: Palo Alto, CA, USA, 1978. [Google Scholar]
- Root, A.A.; Stephens, J.A. Organization of the Central Control of Muscles of Facial Expression in Man. J. Physiol. 2003, 549, 289–298. [Google Scholar] [CrossRef]
- Yudiarso, A.; Liando, W.; Zhao, J.; Ni, R.; Zhao, Z. Validation of Facial Action Unit for Happy Emotion Detection. In Proceedings of the 3rd International Conference on Psychology in Health, Educational, Social, and Organizational Settings (ICP-HESOS 2018)—Improving Mental Health and Harmony in Global Community, Surabaya, Indonesia, 16–18 November 2018; SCITEPRESS—Science and Technology Publications, Lda.: Surabaya, Indonesia; pp. 360–363. [Google Scholar] [CrossRef]
- Wichchukit, S.; Mahony, M.O. The 9-Point Hedonic Scale and Hedonic Ranking in Food Science: Some Reappraisals and Alternatives. J. Sci. Food Agric. 2014, 95, 2167–2178. [Google Scholar] [CrossRef]
- Krumpal, I. Determinants of Social Desirability Bias in Sensitive Surveys: A Literature Review. Qual. Quant. 2013, 47, 2025–2047. [Google Scholar] [CrossRef]


| Experiment# | Stimulus Characteristics | ||
|---|---|---|---|
| Product | Media Type | Duration | |
| Product Type: Yoghurt|Stimuli Type: Video Ads | |||
| Experiment #1 | Milk Yogurt | Video (YouTube) | 15 s |
| Experiment #2 | Almond Yogurt | Video (YouTube) | 17 s |
| Product Type: Nut butters|Stimuli Type: Image Posts | |||
| Experiment #3 | Nut butters, showing only the product | Video Slideshow (Facebook and Instagram image posts) | 15 s |
| Experiment #4 | Nut butters, combined with hedonic food | Video Slideshow (Facebook and Instagram image posts) | 16 s |
| Feature | Value Range-Data Type | AUs Description * |
|---|---|---|
| Neutral | [0, 1]-154 non-null float | Inactivity of facial muscles |
| Happy | [0, 1]-154 non-null float | Cheek Raiser, Lip Corner Puller |
| Sad | [0, 1]-154 non-null float | Inner Brow Raiser, Brow Lowerer, Lip Corner Depressor |
| Angry | [0, 1]-154 non-null float | Brow Lowerer, Upper Lid Raiser, Lid Tightener, Lip Tightener |
| Scared | [0, 1]-154 non-null float | Inner Brow Raiser, Outer Brow Raiser, Brow Lowerer, Upper Lid Raiser, Lid Tightener, Lip Stretcher, Jaw Drop |
| Surprised | [0, 1]-154 non-null float | Inner Brow Raiser, Outer Brow Raiser, Upper Lid Raiser, Jaw Drop |
| Disgusted | [0, 1]-154 non-null float | Nose Wrinkler, Lip Corner Depressor, Lower Lip Depressor |
| Valence | [−1, 1]-154 non-null float | It is calculated as the intensity of “happy” minus the intensity of the negative expression with the highest intensity |
| Arousal | [0, 1]-154 non-null binary | It is based on the activation of 20 Action Units (AUs) of the Facial Action Coding System (FACS) |
| Class | 154 non-null binary | The binary class of perceived intention to buy or taste the promoted food product (“0 = Low”, “1 = High”) |
| Minimum | Maximum | Mean | Std. Error | Std. Deviation | |
|---|---|---|---|---|---|
| Input data * (FaceReader Online TM emotion values) | |||||
| Neutral | 0.1529 | 0.9888 | 0.717859 | 0.0159904 | 0.1984357 |
| Happy | 0.0000 | 0.4690 | 0.035942 | 0.0066883 | 0.0829995 |
| Sad | 0.0006 | 0.9294 | 0.103791 | 0.0107723 | 0.1336808 |
| Angry | 0.0001 | 0.7478 | 0.075247 | 0.0094886 | 0.1177505 |
| Surprised | 0.0000 | 0.2900 | 0.026289 | 0.0034500 | 0.0428128 |
| Scared | 0.0000 | 0.1363 | 0.016016 | 0.0017813 | 0.0221054 |
| Disgusted | 0.0002 | 0.4042 | 0.026873 | 0.0041572 | 0.0515900 |
| Valence | −0.9279 | 0.4029 | −0.128644 | 0.0148014 | 0.1836807 |
| Arousal | 0.1644 | 0.5854 | 0.315235 | 0.0058099 | 0.0720988 |
| Output data ** (self-reported values) | |||||
| Intention to Buy/Taste | 1.00 | 5.00 | 3.38 | 0.093 | 1.149 |
| Model | Accuracy Score | F-Score |
|---|---|---|
| Neural Network–Sequential (NN-S) | 0.90 | 0.81 |
| Neural Network-Multi-Layer Preceptor (MLP NN) | 0.91 | 0.83 |
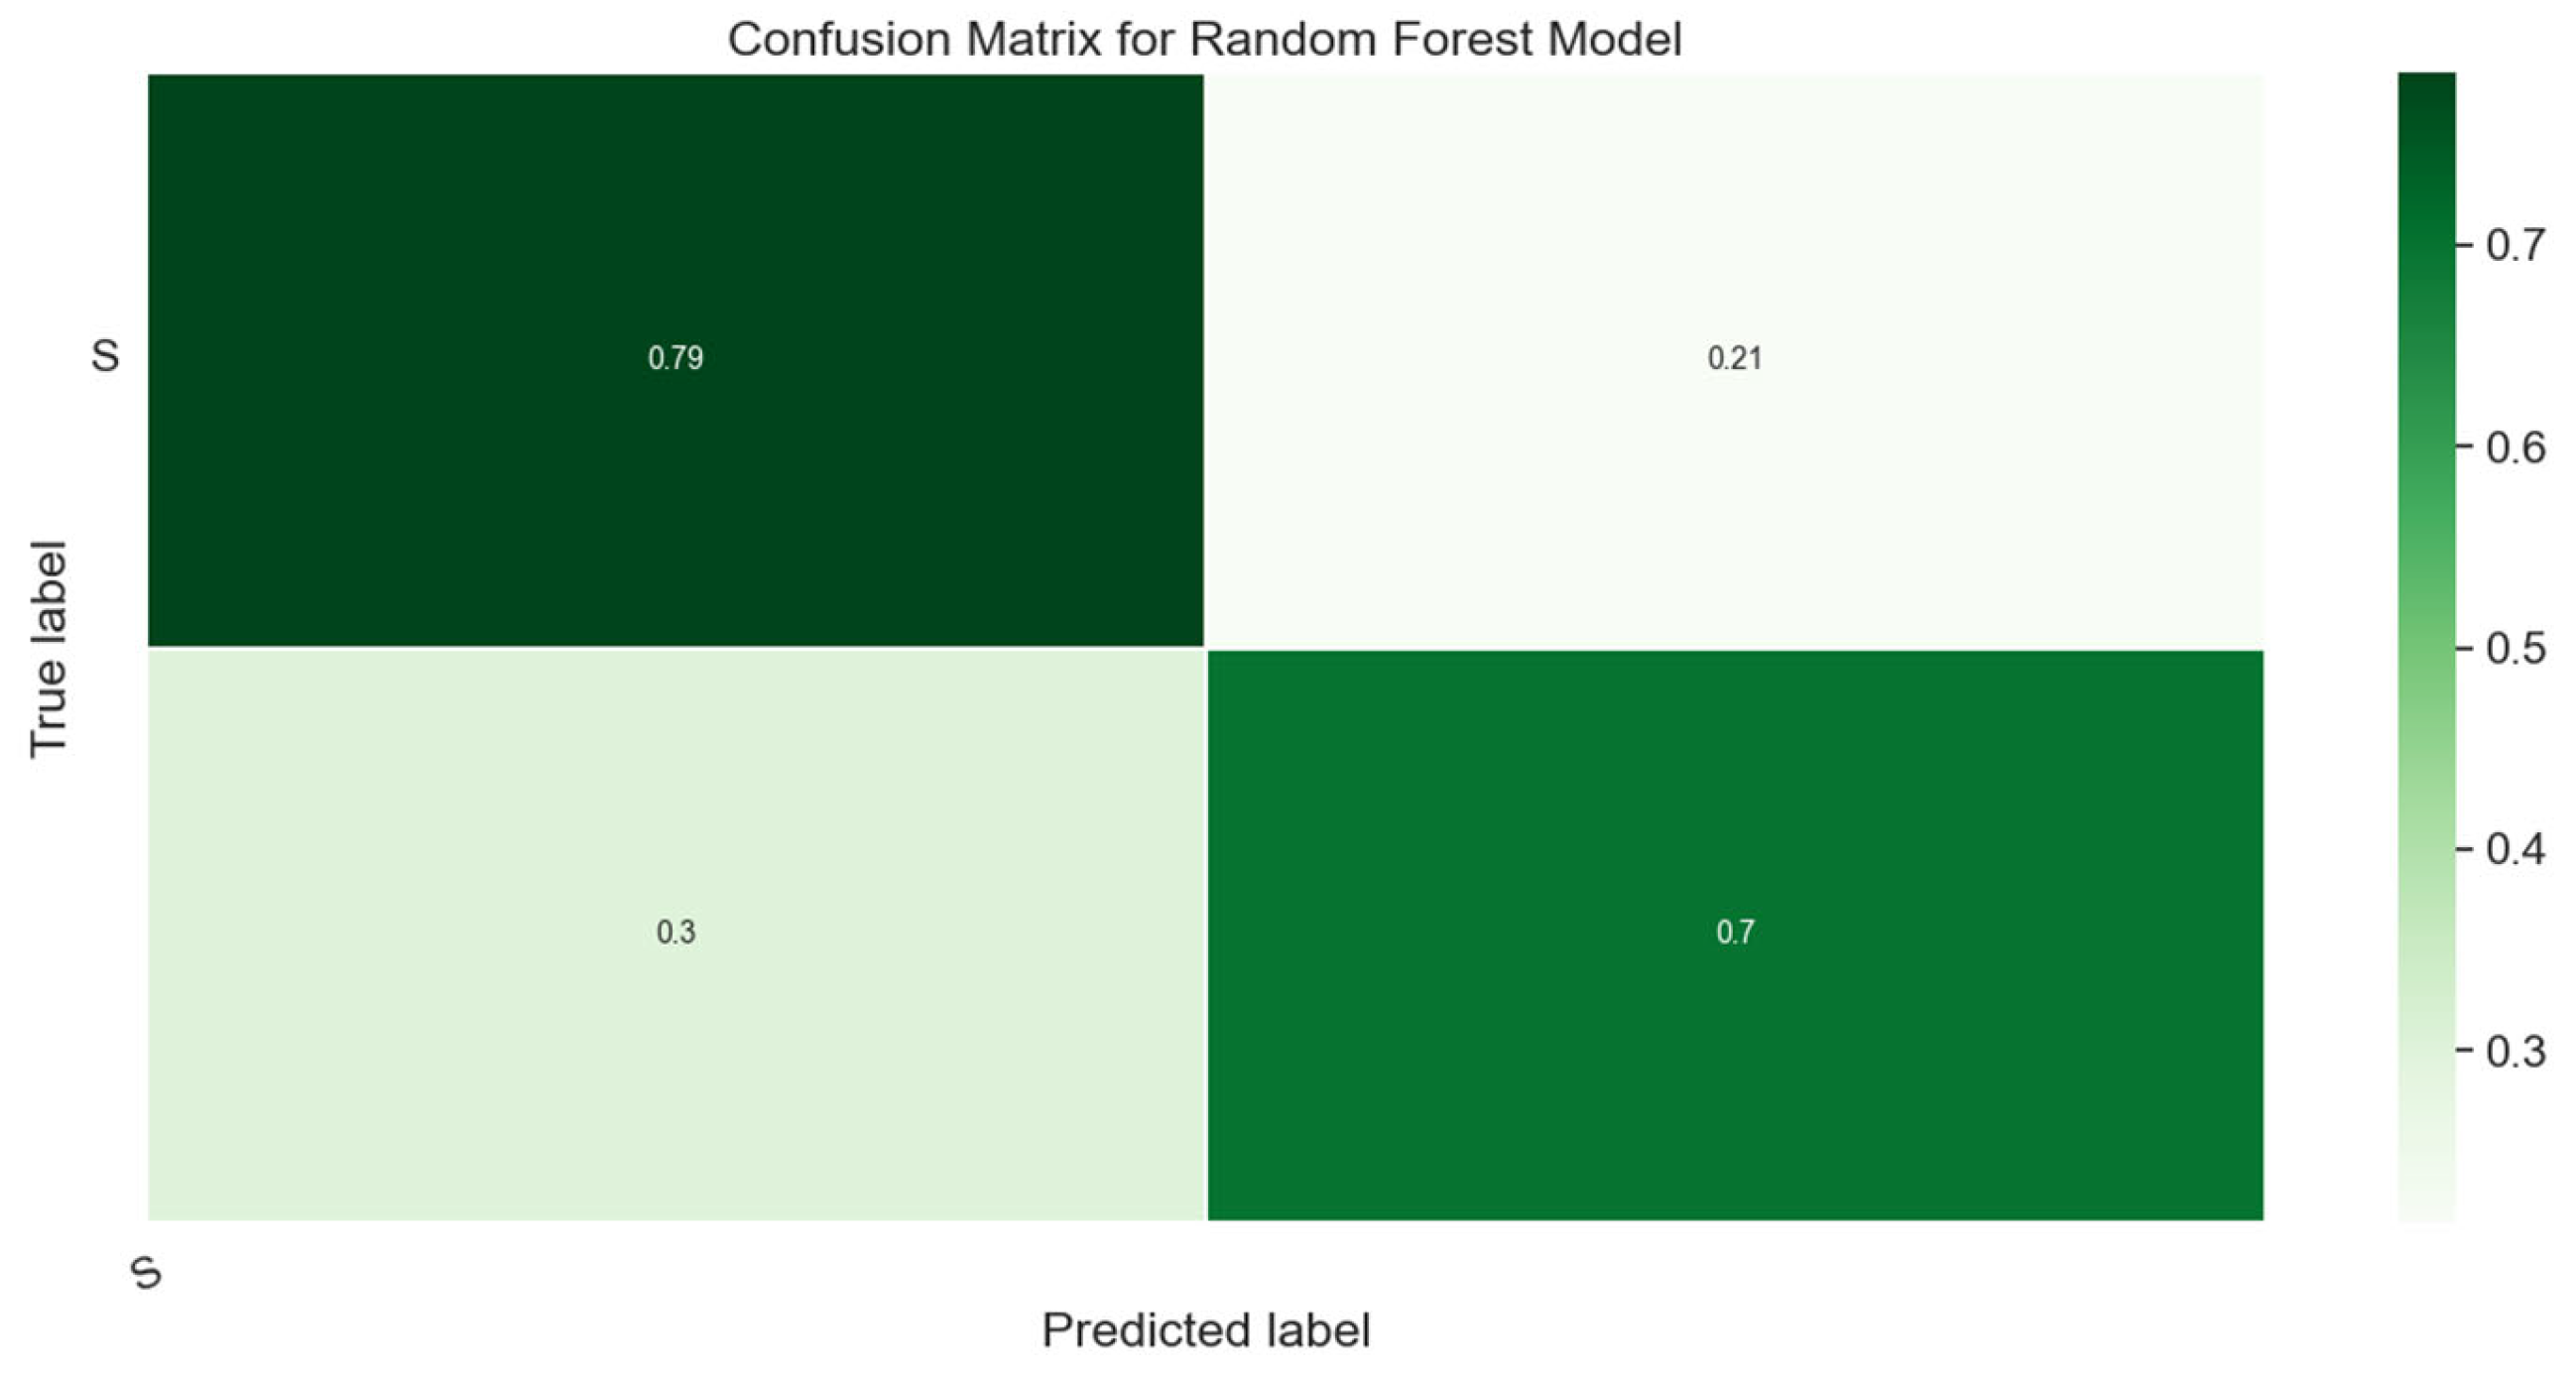
| Random Forest (RF) | 0.75 | 0.75 |
| Decision Trees (DTs) | 0.70 | 0.70 |
| Logistic Regression (LR) | 0.58 | 0.60 |
| Support Vector Machine -Linear (SVM) | 0.55 | 0.68 |
Disclaimer/Publisher’s Note: The statements, opinions and data contained in all publications are solely those of the individual author(s) and contributor(s) and not of MDPI and/or the editor(s). MDPI and/or the editor(s) disclaim responsibility for any injury to people or property resulting from any ideas, methods, instructions or products referred to in the content. |
© 2023 by the authors. Licensee MDPI, Basel, Switzerland. This article is an open access article distributed under the terms and conditions of the Creative Commons Attribution (CC BY) license (https://creativecommons.org/licenses/by/4.0/).
Share and Cite
Tzafilkou, K.; Economides, A.A.; Panavou, F.-R. You Look like You’ll Buy It! Purchase Intent Prediction Based on Facially Detected Emotions in Social Media Campaigns for Food Products. Computers 2023, 12, 88. https://doi.org/10.3390/computers12040088
Tzafilkou K, Economides AA, Panavou F-R. You Look like You’ll Buy It! Purchase Intent Prediction Based on Facially Detected Emotions in Social Media Campaigns for Food Products. Computers. 2023; 12(4):88. https://doi.org/10.3390/computers12040088
Chicago/Turabian StyleTzafilkou, Katerina, Anastasios A. Economides, and Foteini-Rafailia Panavou. 2023. "You Look like You’ll Buy It! Purchase Intent Prediction Based on Facially Detected Emotions in Social Media Campaigns for Food Products" Computers 12, no. 4: 88. https://doi.org/10.3390/computers12040088