Article

A Temporal Transformer-Based Fusion Framework for Morphological Arrhythmia Classification

1
Department of Electronics and Telecommunication Engineering, Chittagong University of Engineering & Technology, Chittagong 4349, Bangladesh
2
School of Computing and Information Systems, Faculty of Science and Technology, Athabasca University, Athabasca, AB T9S 3A3, Canada
*
Author to whom correspondence should be addressed.
Computers 2023, 12(3), 68; https://doi.org/10.3390/computers12030068
Submission received: 22 January 2023 / Revised: 17 March 2023 / Accepted: 17 March 2023 / Published: 21 March 2023
(This article belongs to the Special Issue Feature Papers in Computers 2023)

Abstract

:
By using computer-aided arrhythmia diagnosis tools, electrocardiogram (ECG) signal plays a vital role in lowering the fatality rate associated with cardiovascular diseases (CVDs) and providing information about the patient’s cardiac health to the specialist. Current advancements in deep-learning-based multivariate time series data analysis, such as ECG data classification include LSTM, Bi-LSTM, CNN, with Bi-LSTM, and other sequential networks. However, these networks often struggle to accurately determine the long-range dependencies among data instances, which can result in problems such as vanishing or exploding gradients for longer data sequences. To address these shortcomings of sequential models, a hybrid arrhythmia classification system using recurrence along with a self-attention mechanism is developed. This system utilizes convolutional layers as a part of representation learning, designed to capture the salient features of raw ECG data. Then, the latent embedded layer is fed to a self-attention-assisted transformer encoder model. Because the ECG data are highly influenced by absolute order, position, and proximity of time steps due to interdependent relationships among immediate neighbors, a component of recurrence using Bi-LSTM is added to the encoder model to address this characteristic of the data. The model performance indices such as classification accuracy and F1-score were found to be 99.2%. This indicates that the combination of recurrence along with self-attention-assisted architecture produces improved classification of arrhythmia from raw ECG signal when compared with the state-of-the-art models.

1. Introduction

Heart-related disorders remain the primary cause of death worldwide despite the ongoing advancement of medical procedures. According to the statistics of World Health Organization (WHO), around 17.9 million deaths worldwide were attributed to cardiovascular diseases (CVDs) [1]. Arrhythmias, a significant type of CVD, occur when the electrical signals that control heartbeats are disrupted. Arrhythmias have the potential to result in serious and even fatal symptoms and problems if they are extremely irregular or are arise from a weak or damaged heart [2]. There are many different forms of arrhythmia, such as atrial fibrillation, supraventricular errant beats, premature ventricular contraction, tachycardia, and others. Heartbeat categorization is a crucial area of research in the field of healthcare because it is one of the primary diagnostic techniques for arrhythmia.
An electrocardiogram (ECG), sometimes called an electrocardiogram or EKG, is a diagnostic test that measures and records the frequency and intensity of the electrical activity in a patient’s heart. This data are plotted on a graph that shows the progression of the electrical signal through the heart at each step. Measuring human heartbeat activity through ECG signals has become a common and easy clinical task using modern instruments.
The main challenge lies in classification of the arrhythmia from the ECG signal [3]. The extraction of features and feature assessment methods in classic models developed for arrhythmia classification typically takes a long period of time. Numerous studies suggested deep-learning-based solutions to address these issues, which could more efficiently and automatically extract abstract information [4,5,6]. However, these methods fail to address the long-range dependencies among data instances along with vanishing or exploding gradients due to complex recursive structures, which can lead to inaccurate diagnosis due to misclassification. For long sequences with several hundred-time steps such as ECG data processing with classic recurrent neural networks (RNN), the gradient might become negligible and parameter updates become insignificant which makes learning difficult with inaccurate results.
Recently, the self-attention-based transformer models have emerged as a powerful tool for processing time series data, and have been found to outperform convolutional neural networks (CNN) and RNN [7,8,9]. As the ECG data are periodic time-series data that are often continuous, the current time step and the present categorization or prediction rely on the proximity of previous time steps [10]. Moreover, these data are highly sensitive to fluctuations of closest time steps. For example a slightly longer PR interval is an indication of first-degree heart block [11]. Therefore, the key purpose of this study is to demonstrate that for problems involving temporal classification and prediction, depending solely on self-attention or recurrence would be insufficient. As such, a novel approach is proposed in this study that extracts the local features from small time intervals of ECG data using CNN and combines embedding of long-term correlations in data by pairing self-attention with recurrence. The advantages of transformer and Bi-LSTM networks are utilized for this purpose to achieve the most reliable modeling. The major contributions of the study include:
  • Developing a temporal transformer-based fusion framework to classify morphological arrhythmia into several multiple classes for lowering the fatality rate associated with CVDs.
  • The CNN structure is followed by a transformer encoder network for the interpretation of ECG signals. The Transformer’s integration makes up for CNN’s inadequacies in terms of its inability to function well with temporal features.
  • Additionally, recurrence is combined with the network through Bi-LSTM layers that identify the invariant relationship among neighboring time steps.
  • A wide range of experiments including ablation, parameter selection, and other evaluation methods have been performed which deduced the proposed model’s superiority to produce cutting-edge results on the dataset.
This paper presents a new approach to arrhythmia classification using a temporal transformer-based fusion framework which combines self-attention and recurrence. Rest of the paper is structured as follows: The related works are presented in Section 2. The details of the materials along with the methodology are demonstrated in Section 3. Section 4 discusses the experiment and evaluation findings of the adopted methodology. Finally, Section 5 presents the conclusion.

2. Related Work

With the advent of computer-aided diagnosis (CAD) systems in medical science, the workload of cardiologists has been gradually reduced and more effective diagnosis methods have been developed. A number of such works based on arrhythmia classification have been included in this section.
Jiang et al. [12] proposed a novel data augmentation technique using Borderline-SMOTE and Context Feature Module (CTFM). Here, Two-Phase training (2PT) has been applied before feature extraction and classification using CNN for 1D-ECG signal. The overall accuracy obtained is 96.6%. With the aim of diagnosing CVDs more accurately, Shoughi et al. [13] proposed a CNN-BiLSTM approach with DWT for denoising and SMOTE for balancing the data. This method improved the accuracy to 98.71% compared to the other approaches. In another work, Fang et al. [14] used the focal loss function to handle imbalance and extracted four pieces of RR interval from the ECG signal to avoid information loss due to heartbeat segmentation. CNN is then applied for classification which achieves an Accuracy of 92.6% and an F1-score of 65.9%.
Mittal et al. [15] proposed an arrhythmia classification model using encoded ECG signals (ACES). A prototype was trained using the MIT-BIH dataset and tested using ECG data from human subjects. The prototype encodes each ECG pulse with 13 features derived from the QRS complex. A small wearable ECG patch along with Bluetooth connected host device was used to detect arrhythmia in real time using Bi-LSTM achieving test AUC of 98.4%. A novel data augmentation technique using GANs has been proposed to restore the balance of the dataset by Shaker et al. [16] with two deep learning CNN-based approaches, a two-stage hierarchical approach and an end-to-end approach, for feature extraction and classification. The experimentation with these techniques achieved Accuracy above 98.0%, precision above 90.0%, specificity above 97.4%, and recall above 97.7%. Bertsimas et al. [17] employed the XGBoost Algorithm to classify seven types of ECG signals and extract 110 features from three different datasets, namely, Chapman [18], Tianchi [19] and Physionet [20]. The labels of different datasets were overlapped to further evaluate the proposed method. The overall F1-score for different overlapped data was 93% to 99%.
Two multimodal fusion frameworks, Multimodal Image Fusion (MIF) and Multimodal Feature Fusion (MFF) were proposed by Ahmad et al. [21]. The input for these converted raw ECG signals into three different images using Gramian Angular Field (GAF), Recurrence Plot (RP), and Markov Transition Field (MTF). The MIF method showed 98.6% and the MFF method showed 99.7% overall accuracy for the Massachusetts Institute of Technology-Beth Israel Hospital (MIT-BIH) data. To classify heart disease, a Dual-Layer Stacking Ensemble (DLSE) and a Deep Heterogeneous Ensemble (DHE) technique were introduced by Prakash et al. [22]. For DLSE approach, the Enhanced Evolutionary Feature Selection (EEFS) algorithm was used to select best training parameters which were then subjected to K-fold cross validation. The result of base learners of layer-1, Naïve Bayes (NB), Decision Tree (DT), and Support Vector Machine (SVM), were combined with the original training set to provide as input to layer-2 consisting of Extremely Randomized Trees (ERT), Ada Boost Classifier (ABC), and Random Forest (RF) classifiers. To produce the final prediction, the predictions from the layer-2 were passed into the meta-classifier Gradient Boosted Trees (GBT).
On the other hand, the DHE employed three deep learning models as its base-learners: RNN, Artificial Neural Network (ANN), and CNN with Bidirectional Long Short-Term Memory (CNN-BiLSTM). The level-1 meta-learners applied were the RF and ERT algorithms. GBT was used as level-2 meta-learner. The results of the DLSE approach across different datasets showed a maximum accuracy of 95.17% whereas the DHE approach was evaluated for different datasets and achieved an accuracy of 99.50%, precision of 98.41%, and recall of 98.27% across the MIT-BIH data. For precise premature ventricular contraction (PVC) detection, Ullah et al. [23] employed a transfer learning mechanism using the pre-trained deep residual network, ResNet-18. Segmented ECG beats were converted to 2D (two-dimensional) images before being fed into the network. Weighted random samples, on-the-fly augmentation, the Adam optimizer, and the call back feature were used to optimize the approach achieving a maximum accuracy of 99.93%. However, these sequential models have limited utility in capturing long-range dependencies which is an important factor when considering time series data such as ECG signals. The application of advanced models such as transformer learning has been proposed to address the shortcomings of conventional approaches for time series data. For instance, Guan et al. [24] proposed a low-dimensional denoising embedding transformer with fewer parameters that achieves an average recall of 98.39% and a precision of 98.41%, extracting wide features from the ECG signal using Random Forest Model and deep features using a transformer network. Natarajan et al. [25] proposed a wide and deep network for multi-label classification with a validation score of 0.587. A CNN-based network with an embedded transformer layer has been proposed by Che et al. [26] which introduces a new link constraint to make the embedding vector more accurate for classification with an F1-score of 78.6%.
These models contain complex convolution, either only recurrence or only self-attention, to capture morphological features. Hence, to overcome such limitations, considering both morphological and temporal characteristics of ECG signal, an end-to-end framework adding recurrence with parallelized self-attention has been proposed in this study.

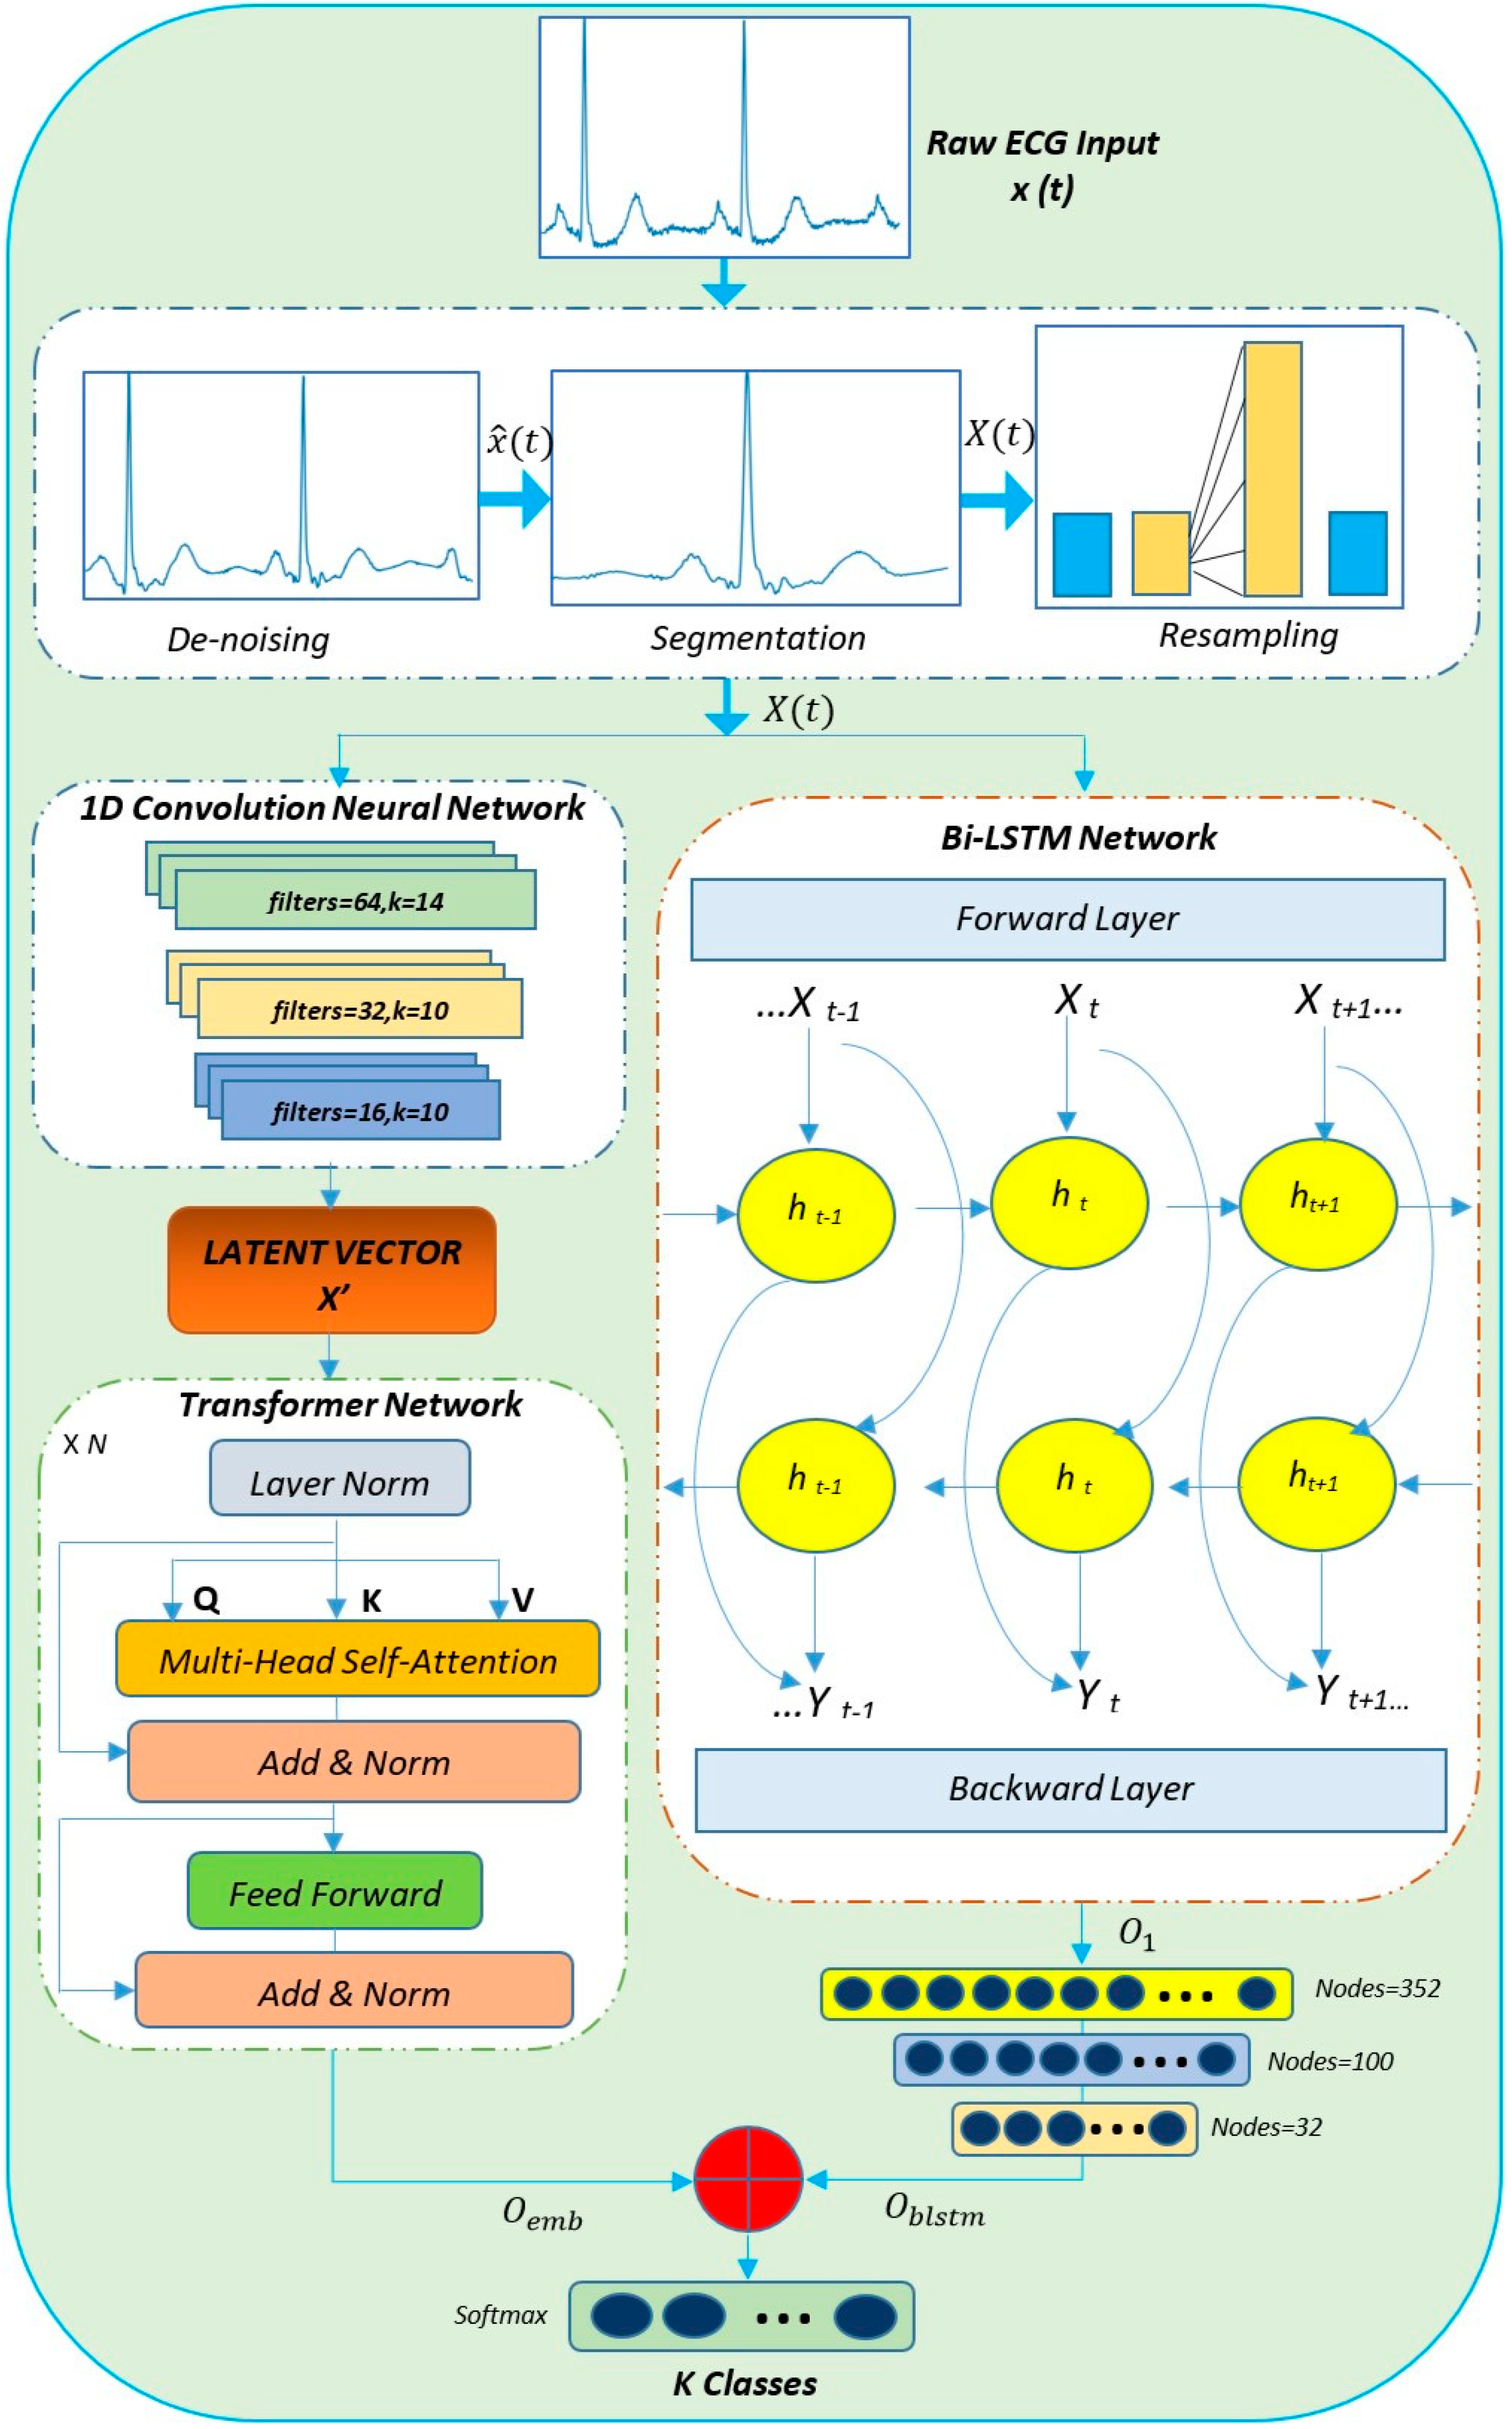
3. Materials and Methodology

The proposed framework is shown in Figure 1. Initially, the raw ECG signal is taken as input. Thereafter, the signal is subjected to de-noising as part of the preprocessing pipeline because of the presence of unwanted random disturbances in the channel. The de-noised signal is then windowed and individual heartbeats are segmented from it through QRS Complex Detection. Then, data augmentation has been performed through resampling, and finally, the processed and augmented output is fed to the classifier architecture. The entire process has been detailed in the following subsections.

3.1. Database Description

The MIT-BIH arrhythmia database was used in this study, which was collected from Physio Bank [27], for training and evaluating the proposed classification system. The dataset consists of ECG sequences of 30 min length each, is extracted from a 24-h recording, and uses 360 Hz sampling in channels lead V1 and lead II. Cardiologists have already pre-annotated and labeled this data. The study uses the recording from both channels and the edited version of recording 102, as the annotations in this version were modified. These numerous annotations pertain to a range of normal and abnormal ECG signals that indicate various arrhythmia types. The dataset contains ECG signals of many classes, but the five classes utilized in this study are “N”, “S”, “F”, “V”, and “Q”, as per the Association for the Advancement of Medical Instrumentation (AAMI) standards. A summary of the categories of heartbeat is presented in Table 1.

3.2. Signal Preprocessing

Prior to being fed into the proposed transformer-based fusion model, Signal Preprocessing is performed which includes data denoising and segmentation of the raw ECG signal.

3.2.1. Denoising

Monitoring an ECG can be affected by various circumstances, such as patient movement or powerline interference from the equipment’s electric element, which may impact the signal’s accuracy. In order to eliminate the noise from the data, processing the original recording is a prerequisite. The proposed framework eliminates noise by utilizing discrete wavelet transform (DWT) with Daubechies orthogonal mother wavelet ‘db10’ because of its complexity and similarity to ECG data. The threshold for filtering is set at 0.03 and sampling frequency 360 Hz is applied. The primary advantage of DWT is the extent of its adjustable frame, which is broad in low frequency and compact in high frequency, resulting in the precision of time frequency in all spectral domains. A wavelet coefficient, γ , is calculated from a signal x(t) of length 2 N having mother wavelet, ψ(t) as follows:
γ j k = - x t 1 2 j ψ ( t - k 2 j ) 2 j d t
Here j is fixed so that γ j k is a function of k only. The result, x ^ ( t ) is a convolution of x(t) with reflected, dilated, and normalized versions of the mother wavelet [28]. The signal is then normalized using z-score normalization. Each heartbeat is segmented from the signal after de-noising and normalizing.

3.2.2. Heartbeat Segmentation through QRS Complex Detection

After the raw ECG signal is filtered, the annotation files provided with the original dataset are used to detect the R-peaks of the waveform, x ^ ( t ) . Peaks that are more than 600 points before or after another peak are discarded as these contain abnormal RR intervals. The window size is selected as 180 before and after each R peak. Therefore, each heartbeat sequence consists of 360 time steps. The output of segmentation, X(t), is then resampled for data augmentation. The visualization of different types of beats after the noise removal and segmentation process is given in Figure 2.

3.2.3. Data Resampling

After performing signal processing, the resampling process is carried out to increase the number of data samples. Originally, high imbalance in the dataset can be observed from Figure 3a where almost 90% of the training data consists of class “N” samples whereas the number of samples for “F” class is almost negligible. The total number of instances for class “N” is 155,352 and this greatly exceeds the combined value of all other class instances which might lead the model to be inclined towards the majority class. Hence, to avoid a biased result, data augmentation is conducted in the training data by using “resample” package from Scikit-learn 1.0.2 where upsampling (minority class) and downsampling (majority class) the signal is performed. This package utilizes one step of the bootstrapping procedure for resampling [29]. The mean value of training samples considering all the classes is 34,457 which is taken as the number of observations to generate a bootstrap sample. Accordingly, upsampling is performed for the minority classes “S”, “F”, “V”, and “Q” where a random sample is taken from the original data each time throughout the number of observations with replacement to generate one bootstrap sample. On the other hand, the majority class “N” is downsampled where random samples are taken from the original data without replacement to generate the bootstrap sample. Consequently, each class consists of 34,457 samples which can be noted in Figure 3b. Subsequently, the ECG data, X(t), is fed to the transformer-based fusion architecture.

3.3. Transformer-Based Fusion Framework

The entire fusion framework consists of three major modules: (a) a one-dimensional convolution layer-based embedded network to extract raw information from segmented ECG wave (b) a transformer encoder stack using multi-head self-attention (c) a component of recurrence using Bi-LSTM network. The modeling approach details have been described as follows:
(a)
CNN Network
The first stage, is to map X(t) at each location into the numeric space. CNNs can extract extremely informative embeddings that are independent of time and are highly resistant to noise. Hence, the heartbeats are processed using three 1D convolutional layers in order to provide an embedding for each point in a latent space. Through representation learning, the feature or latent vector X’ = [x1, x2,….,xn] is generated where xi  Remb. The latent vector is then input to a Transformer encoder architecture. This work used three one-dimensional convolution layers with optimum parameters as listed in Table 2. The first convolutional layer is configured with a kernel size of 14, whereas the second and third layers utilize a size of 10. The size of input and output layers remain unchanged as filters of sizes 64, 32, and 16 are applied for feature learning.
Here the stride and padding are kept as ‘same’ and the number of kernels applied is gradually reduced as 2 k where k = {6,5,4}. This exponential reduction in kernels is found to be more effective in extracting useful information from the experimentally acquired signal. The activation function is set to a rectified linear unit (ReLU) to provide non-linearity to the network.
(b)
Transformer Network
Only the transformer encoder has been applied here to capture long-range dependencies and interactions among time instances. The encoder uses an attention mechanism for this purpose. The output of convolution from the embedding layer is a latent or embedded vector, here represented as X’, which is typically subjected to positional encoding before the attention mechanism is applied.
However, in our case, positional encoding is not applied because it does not contribute any pertinent information to the ECG signal. Here the length of signal found after windowing is a representation of time steps, where a signal measurement appears as a scalar real number or a vector. The same real number might show up once or multiple times in a row, thus, the feature to be learned does not have much impact on prediction performance. In fact, additional positional encoding might deteriorate performance for time-series data [30]. The above reasoning is the basis for not applying the positional encoding in this architecture.
The multi-head self-attention used by the encoder architecture has been detailed as follows:
  • Self-Attention Module: The scaled-dot product attention or self-attention function’s inputs, Q, K, and V, stand for the respective concepts of query, key, and value. The attention weight is determined by how similar the query key is. The attention context is determined based on the attention weight. The scaled dot-product attention used by the model can be calculated as follows:
    A t t e n t i o n Q , K , V = s o f t m a x ( Q K T d k ) V
    Here Q, K, and V represent the query, key, and value embedding matrices. Queries Q Є R N × d k , keys K Є R M × d k , values V Є R M × d v . Here, N and M represent the length of queries and keys (or values). d k and d v represent the dimensions of keys (or queries) and values respectively. The input consists of queries and keys of dimension d k and values of dimension d v . The dot products of the query with all the keys are calculated using Q K T which is scaled by a factor of 1 d k . The softmax of this is then multiplied by the values in V.
  • Multi-Head Self Attention: The attention technique employed in this work is called scaled dot-product attention, which is a type of self-attention that implies self-learning. The query and key-value pairs are from the same source as evident in the data. Despite the usage of attention mechanisms, it might not be possible to fully explain all the dependencies with only a single attention function. Various self-attention functions are combined. Each function is called a ‘head’ and their combination facilitates simultaneous attention to information from multiple representation subspaces. The formula is expressed as follows:
    M u l t i H e a d Q , K , V = c o n c a t ( h e a d 1 , h e a d 2 , , h e a d n )
    The multi-head attention mechanism integrates the results of the several attentions by projecting Q, K, and V through n linear transformations. Here several self-attention heads such as h e a d 1 , h e a d 2 run in parallel and each of the smaller dimension vectors is concatenated and projected to a higher dimension. This parallelization computation capability improves the network’s performance in integrating multiple features. The parameters for the transformer encoder stack have been included in Table 3. Here the embedded Q, K, and V vectors have a size of 256 and are processed using four transformer encoder blocks having eight heads each. The ratio of dropout is set at 0.15 for regularization.
  • Feed Forward Network: The last stage of the encoder architecture is a straightforward feed-forward network with 1012 multilayer perceptron units, as illustrated in Table 3. Two one-dimensional convolution layers with activation as ReLU and kernel size 1 are used in between as projection layers to reduce dimensionality in this part of the network.
    F F N x = max 0 , x W 1 + b 1 W 2 + b 2
    Here, FFN(x) is the linear transformations in the network with weight matrices W 1 , W 2 and biases b 1 , b 2 which is then followed by layer normalization. Finally, the transformer network output O e m b : { o 1 ,   o 2 ,…, o n } is obtained which is a learned vector of each feature.
(c)
Bi-LSTM Network
The Bi-LSTM structure enables the network to access both forward and backward information about the sequence at each time step. ECG data are highly dependent on the proximity of time steps and strict sequential ordering, and the strongest relationships among time steps can be evident within the connection between immediate neighbors. In order to capture this ordered flow of information, recurrence has been included as an element here through two bidirectional LSTM layers having a sequence length of 128. The generated output O 1 is fed to a multilayer perceptron network of hidden units 352, 100, and 32 for each layer respectively. The dimension of the final linear layer output, O b l s t m , is 32 and each layer has an activation ReLU.
(d)
Final Classification
The outputs O e m b and O b l s t m are concatenated before passing through the fully connected network for final classification. Then the fully connected network with the softmax function classifies the probabilities into the arrhythmia categories.
K c l a s s e s = S o f t m a x ( c o n c a t ( O e m b , O b l s t m ) )

4. Experiments and Result Analysis

The experiment is performed on the Google Colaboratory platform with Python version 3.8.16 for both training and testing the model. NumPy 1.21.6 and Scikit-learn 1.0.2 packages are used for dataset preparation and model evaluation. In addition, Keras and Tensorflow 2.9.0 framework is employed for model implementation. To ensure superior classification, a 10-fold cross-validation process is utilized to divide the data samples randomly 10 times using about 80% of ECG segments as training data and the remaining 20% as testing data. Consequently, subsamples taken per fold for validation are not repeated. The training data consisted of 172,285 samples, while the number of samples for testing data is 43,072. The original dataset contains highly imbalanced data, hence the resampling technique is applied to the training data. On top of that, the model is tuned using KerasTuner [31] to obtain more efficient hyper-parameter settings. Table 4 indicates the global hyper-parameter settings for the proposed model. The ‘Adam’ optimizer with a learning rate of 0.001 is chosen for compiling the model. Moreover, the Categorical Cross-Entropy loss function is used to compute the classification loss for 10 epochs.

4.1. Quantitative Analysis

The frequently used metrics, Accuracy, Precision, Recall, Specificity, and F1-score, have been used to quantitatively assess the proposed classification framework. Where true positives and true negatives have been represented as TP and TN. False positives and false negatives have been represented as FP and FN.
A c c u r a c y = T P + T N T P + T N + F P + F N × 100
P r e c i s i o n = T P T P + F P × 100
R e c a l l = T P T P + F N × 100
F 1 - s c o r e = 2 × P r e c i s i o n × R e c a l l P r e c i s i o n + R e c a l l × 100
S p e c i f i c i t y = T N T N + F P × 100
A U C = 1 2 × ( T P T P + F N + T N T N + F P )
Table 5 presents the class-wise performance of the proposed classification model. The analysis shows that the model performs quite well for classes S, V, and Q, but some incorrect predictions have been observed for classes N and F. This error might be due to the fact that the original dataset had highly imbalanced data. Therefore, data augmentation is performed and the experiment conducted again. As a result, the model demonstrates unbiased performance by correctly predicting more than 97% of the ECG data.
The weighted average calculated by taking the number of instances of a class present as weight with its Precision, Recall, and F1-score result in 99.2% Precision, Recall, and F1-score for the model. The Accuracy obtained is 99.2% and Specificity is 99.1%. Additionally, the AUC (Area under the ROC curve) metric provides an overall measure of performance across all potential classification criteria. The AUC obtained here is near perfect for all classes except class F since false negative (FN) is observed to be high for this class comparatively, consisting of 28 FN samples. The Loss and Accuracy graph of the model across each epoch during the training and validation stage is plotted in Figure 4. The curve in Figure 4a shows that after 3 epochs, the variation in Loss gradually reduces in training data although some fluctuation in loss of validation data is observed at epochs 5 and 7. The exponential increase in Accuracy is observed in Figure 4b where after 6 epochs, the training data reaches 98% Accuracy and validation Accuracy fluctuates from around 96.5% to 98.5%.

4.2. Qualitative Analysis

Table 6 demonstrates a qualitative study of the proposed framework to differentiate the actual class and predicted class respectively. It also reveals that the proposed model performs well in the prediction of a substantial number of classes included in the “S”, “V”, “Q”, and “N” categories. However, a random sample from class “F” is predicted as “S”, suggesting that the model shows some discrepancies for this class, as mentioned in the quantitative analysis. This might be due to the smaller number of samples in this class.

4.3. Ablation Study

Table 7 represents the ablation study on the proposed framework as well as different variations of the proposed model considering F1-score and Accuracy as performance metrics. From Table 7, it can be observed that adding one convolutional layer having 64 filters and kernel size 14 presents more efficient embedding with a 98.4% F1-score, which outperforms having two or no layers at all. Furthermore, if four or five layers are added for convolution having an exponentially decreasing filter number and kernel size 10, the F1-score decreases to 98.1% from 98.6%. So, superior performance of CNN for extraction of local features from small shifts in time is obtained with 3-layer architecture. The variation in the Bi-LSTM model on the other hand demonstrates that adding additional neurons or increasing the number of hidden units in the fully connected layers does not necessarily provide a more accurate analysis of data. On the contrary, when the number of hidden units is increased to 2078, the Accuracy and F1-score drop by 0.5%. A reason behind this might be the increase in the number of parameters which makes the training time for the model higher than required. From the variations of the number of heads of the transformer network, it could be deduced that increasing the number of heads does not necessarily improve overall performance since applying 10 heads does not show much different than applying 6 heads. Instead, varying the hidden units of the multilayer perceptron network along with embedding vector size showed improved results. The three convolution layers for latent vector representation with a transformer encoder stack having eight heads are applied for self-attention architecture. Additionally, 352 neurons are observed to be the optimum value for the first layer in the multilayer perceptron network of the recurrence structure comprising the Bi-LSTM network. These optimal values across the proposed Transformer-based fusion network presented the highest F1-score of 99.2%.

5. Discussion

To observe the generalization of the proposed framework, an experiment was conducted with another publicly available dataset called PTB Diagnostic ECG Database [32]. This dataset consists of two classes which contain different arrhythmia cases and healthy cases, respectively. The proposed framework shows promising results for both MIT-BIH and Arrhythmia and PTB Diagnostic ECG datasets as observed in Table 8. The F1-score obtained for the PTB dataset is 98.8% for arrhythmia cases and 98.7% for healthy cases. In addition, above 98% of the data are classified correctly. The weighted average for the PTB dataset results in an Accuracy of 98.7% and an F1-score of 98.8% which are comparable to the results obtained using the MIT-BIH dataset. Hence, the proposed framework produces noteworthy results.
A comparative study of various state-of-the-art methods with the proposed methodology on the MIT-BIH database has been done in Table 9, which establishes that the proposed methodology performs better for multi-class classification. It outperforms CNN, Bi-LSTM, and self-attention-based network architectures, by achieving improved Accuracy of 1% to 6% and an F1-score of more than 8%. Hence, the proposed method exceeds the established only recurrence or only self-attention-based network architectures.
Notwithstanding the great performance of the proposed architecture, some constraints had to be taken into account when assessing the results. The resampling strategy has helped to deal with the data imbalance, but the generalization of the model is still somewhat affected by the data imbalance which can be observed due to some misclassification of class “F” instances. Moreover, addition of recurrence with the self-attention assisted transformer network leads to increased complexity and training time for large datasets.

6. Conclusions

This study presents a hybrid transformer-based fusion method for managing the classification of arrhythmia heartbeats. The proposed study makes use of both morphological and temporal information by using Bi-LSTM along with a transformer encoder stack. Additionally, convolution layers are used to extract useful spatiotemporal features. In the original dataset, the model has attained cutting-edge Accuracy and F1-score which has been further established by analyzing performance metrics across other model variations. Through conducting numerous comparison trials, it has been demonstrated that the proposed framework can offer improved performance in F1-score by more than 8% and achieves greater Accuracy by 1% to 6%. As a part of future work, the goal would be to utilize different data augmentation approaches to improve predictions for some classes such as class “F” which particularly contains lower data samples. Also to implement a time series classification with less complicated models.

Author Contributions

Conceptualization, N.A. and K.A.S.; methodology, N.A.; formal analysis, N.A.; investigation, K.A.S.; writing—original draft preparation, N.A.; supervision, K.A.S. and M.A.H.; writing—review and editing, N.A., K.A.S., M.A.H. and M.A.A.D.; All authors have read and agreed to the published version of the manuscript.

Funding

This research received no external funding.

Data Availability Statement

The data presented in this study are available on request from the corresponding author.

Conflicts of Interest

The author declares no conflict of interest.

References

  1. World Health Organization. Available online: https://www.who.int/health-topics/cardiovascular-diseases (accessed on 23 October 2022).
  2. Mayo Clinic. Diseases and Conditions. Available online: https://www.mayoclinic.org/diseases-conditions/heart-arrhythmia/symptoms-causes/syc-20350668 (accessed on 23 October 2022).
  3. Elgendi, M. Fast Qrs Detection with an Optimized Knowledge-Based Method: Evaluation on 11 Standard Ecg Databases. PLoS ONE 2013, 8, e73557. [Google Scholar] [CrossRef] [PubMed] [Green Version]
  4. Attia, Z.I.; Noseworthy, P.A.; Lopez-Jimenez, F.; Asirvatham, S.J.; Deshmukh, A.J.; Gersh, B.J.; Carter, R.E.; Yao, X.; Rabinstein, A.A.; Erickson, B.J.; et al. An Artificial Intelligence-Enabled Ecg Algorithm for the Identification of Patients with Atrial Fibrillation During Sinus Rhythm: A Retrospective Analysis of Outcome Prediction. Lancet 2019, 394, 861–867. [Google Scholar] [CrossRef] [PubMed]
  5. Hannun, A.Y.; Rajpurkar, P.; Haghpanahi, M.; Tison, G.H.; Bourn, C.; Turakhia, M.P.; Ng, A.Y. Cardiologist-Level Arrhythmia Detection and Classification in Ambulatory Electrocardiograms Using a Deep Neural Network. Nat. Med. 2019, 25, 65–69. [Google Scholar] [CrossRef] [PubMed]
  6. Perez, M.V.; Mahaffey, K.W.; Hedlin, H.; Rumsfeld, J.S.; Garcia, A.; Ferris, T.; Balasubramanian, V.; Russo, A.M.; Rajmane, A.; Cheung, L.; et al. Large-Scale Assessment of a Smartwatch to Identify Atrial Fibrillation. N. Engl. J. Med. 2019, 381, 1909–1917. [Google Scholar] [CrossRef] [PubMed]
  7. Vaswani, A.; Shazeer, N.; Parmar, N.; Uszkoreit, J.; Jones, L.; Gomez, A.N.; Kaiser, Ł.; Polosukhin, I. Attention Is All You Need. In Proceedings of the 31st Conference on Neural Information Processing Systems (Nips 2017), Long Beach, CA, USA, 4–9 December 2017; pp. 1–11. [Google Scholar]
  8. Zhao, H.; Jia, J.; Koltun, V. Exploring Self-Attention for Image Recognition. In Proceedings of the IEEE/CVF Conference on Computer Vision and Pattern Recognition 2020, Virtual, 13–19 June 2020. [Google Scholar]
  9. Wu, N.; Green, B.; Ben, X.; O’Banion, S. Deep Transformer Models for Time Series Forecasting: The Influenza Prevalence Case. arXiv 2020, arXiv:2001.08317. [Google Scholar]
  10. Qin, Y.; Song, D.; Chen, H.; Cheng, W.; Jiang, G.; Cottrell, G. A Dual-Stage Attention-Based Recurrent Neural Network for Time Series Prediction. arXiv 2017, arXiv:1704.02971. [Google Scholar]
  11. Ashley, E.; Niebauer, J. Chapter 3: Conquering the Ecg. In Cardiology Explained; Remedica: London, UK, 2004. [Google Scholar]
  12. Jiang, J.; Zhang, H.; Pi, D.; Dai, C. A Novel Multi-Module Neural Network System for Imbalanced Heartbeats Classification. Expert Syst. Appl. X 2019, 1, 100003. [Google Scholar] [CrossRef]
  13. Shoughi, A.; Dowlatshahi, M.B. A Practical System Based on Cnn-Blstm Network for Accurate Classification of Ecg Heartbeats of Mit-Bih Imbalanced Dataset. In Proceedings of the 2021 26th International Computer Conference, Computer Society of Iran (CSICC), Tehran, Iran, 3–4 March 2021. [Google Scholar]
  14. Fang, H.; Lu, C.; Hong, F.; Jiang, W.; Wang, T. Convolutional Neural Network for Heartbeat Classification. In Proceedings of the 2021 IEEE 15th International Conference on Electronic Measurement & Instruments (ICEMI), Nanjing, China, 29–31 October 2021. [Google Scholar]
  15. Mittal, S.S.; Rothberg, J.; Ghose, K. Deep Learning for Morphological Arrhythmia Classification in Encoded Ecg Signal. In Proceedings of the 2021 20th IEEE International Conference on Machine Learning and Applications (ICMLA), Pasadena, CA, USA, 13–16 December 2021. [Google Scholar]
  16. Shaker, A.M.; Tantawi, M.; Shedeed, H.A.; Tolba, M.F. Generalization of Convolutional Neural Networks for Ecg Classification Using Generative Adversarial Networks. IEEE Access 2020, 8, 35592–35605. [Google Scholar] [CrossRef]
  17. Bertsimas, D.; Mingardi, L.; Stellato, B. Machine Learning for Real-Time Heart Disease Prediction. IEEE J. Biomed. Health Inform. 2021, 25, 3627–3637. [Google Scholar] [CrossRef] [PubMed]
  18. Zheng, J. ChapmanECG. 2019. Available online: https://figshare.com/collections/ChapmanECG/4560497/1 (accessed on 3 October 2022).
  19. Tianchi Hefei High-Tech Cup Ecg Human-Machine Intelligence Competition. 2019. Available online: https://tianchi-competition.oss-cnhangzhou.aliyuncs.com/231754/round2/hf_round2_train.zip (accessed on 3 October 2022).
  20. Clifford, G.D.; Liu, C.; Moody, B.; Li-wei, H.L.; Silva, I.; Li, Q.; Johnson, A.E.; Mark, R.G. AF Classification from a Short Single Lead Ecg Recording: The Physionet/Computing in Cardiology Challenge 2017. In Proceedings of the 2017 Computing in Cardiology (CinC), Rennes, France, 24–27 September 2017. [Google Scholar]
  21. Ahmad, Z.; Tabassum, A.; Guan, L.; Khan, N.M. Ecg Heartbeat Classification Using Multimodal Fusion. IEEE Access 2021, 9, 100615–100626. [Google Scholar] [CrossRef]
  22. Prakash, V.J.; Karthikeyan, N.K. Dual-layer deep ensemble techniques for classifying heart disease. Inf. Technol. Control. 2022, 51, 158–179. [Google Scholar] [CrossRef]
  23. Ullah, H.; Heyat, M.B.; Akhtar, F.; Muaad, A.Y.; Ukwuoma, C.C.; Bilal, M.; Miraz, M.H.; Bhuiyan, M.A.; Wu, K.; Damaševičius, R.; et al. An Automatic Premature Ventricular Contraction Recognition System Based on Imbalanced Dataset and Pre-Trained Residual Network Using Transfer Learning on ECG Signal. Diagnostics 2022, 13, 87. [Google Scholar] [CrossRef] [PubMed]
  24. Guan, J.; Wang, W.; Feng, P.; Wang, X.; Wang, W. Low-Dimensional Denoising Embedding Transformer for Ecg Classification. In Proceedings of the ICASSP 2021–2021 IEEE International Conference on Acoustics, Speech and Signal Processing (ICASSP), Toronto, ON, Canada, 6–11 June 2021. [Google Scholar]
  25. Natarajan, A.; Chang, Y.; Mariani, S.; Rahman, A.; Boverman, G.; Vij, S.; Rubin, J. A Wide and Deep Transformer Neural Network for 12-Lead Ecg Classification. In Proceedings of the 2020 Computing in Cardiology, Rimini, Italy, 13–16 September 2020. [Google Scholar]
  26. Che, C.; Zhang, P.; Zhu, M.; Qu, Y.; Jin, B. Constrained Transformer Network for Ecg Signal Processing and Arrhythmia Classification. BMC Med. Inform. Decis. Mak. 2021, 21, 184. [Google Scholar] [CrossRef] [PubMed]
  27. Goldberger, A.; Amaral, L.; Glass, L.; Hausdorff, J.; Ivanov, P.C.; Mark, R.; Mietus, J.E.; Moody, G.B.; Peng, C.K.; Stanley, H.E. PhysioBank, PhysioToolkit, and PhysioNet: Components of a new research resource for complex physiologic signals. Circulation 2000, 101, e215–e220. [Google Scholar] [CrossRef] [PubMed] [Green Version]
  28. Mallat, S. A Wavelet Tour of Signal Processing; Elsevier: Amsterdam, The Netherlands, 1999. [Google Scholar]
  29. Pedregosa, F.; Varoquaux, G.; Gramfort, A.; Michel, V.; Thirion, B.; Grisel, O.; Blondel, M.; Prettenhofer, P.; Weiss, R.; Dubourg, V.; et al. Scikit-learn: Machine learning in Python. J. Mach. Learn. Res. 2011, 12, 2825–2830. Available online: https://www.jmlr.org/papers/volume12/pedregosa11a/pedregosa11a.pdf?ref=https://githubhelp.com (accessed on 13 December 2022).
  30. Katrompas, A.; Ntakouris, T.; Metsis, V. Recurrence and Self-Attention Vs the Transformer for Time-Series Classification: A Comparative Study. In Proceedings of the International Conference on Artificial Intelligence in Medicine, Halifax, NS, Canada, 14–17 June 2022. [Google Scholar]
  31. O’Malley, T.; Bursztein, E.; Long, J.; Chollet, F.; Jin, H.; Invernizzi, L.; de Marmiesse, G.; Hahn, A.; Mullenbach, J.; Podivín, J.; et al. KerasTuner. Available online: https://github.com/keras-team/keras-tuner (accessed on 23 November 2022).
  32. Bousseljot, R.; Kreiseler, D.; Schnabel, A. Nutzung der EKG-Signaldatenbank CARDIODAT der PTB über das Internet. Biomed. Tech. 1995, 40, 317–318. [Google Scholar] [CrossRef]
Figure 1. Flow diagram of the proposed transformer-based fusion framework.
Computers 12 00068 g001
Figure 2. Segmented individual heartbeats of different categories.
Computers 12 00068 g002aComputers 12 00068 g002b
Figure 3. (a) Imbalance in training data (b) Training data after resampling.
Computers 12 00068 g003aComputers 12 00068 g003b
Figure 4. Loss and Accuracy curve for train and validation set.
Computers 12 00068 g004
Table 1. Heartbeat categories mapped to AAMI classes in the MIT-BIH arrhythmia database.
AAMI
Category
IDHeartbeat Type
N0Normal beats (N), Right bundle branch block (R), Left bundle branch block (L), Nodal escape beat (j), Atrial escape beat (e)
S1Supraventricular premature beat (S), Atrial premature contraction (A), Aberrated atrial premature beat (a)
F2Fusion of normal and ventricular beat (F)
V3Ventricular ectopic beats and ventricular premature contraction (V)
Q4Unclassifiable beats(Q), fusion of paced and normal beat (f), paced beat (/)
Table 2. Selected parameters for CNN Network.
Conv LayerNumber of FiltersKernel Size
16414
23210
31610
Table 3. Selected Parameters for Transformer Network.
ParametersMeaningValues
encoderNumber of transformer encoder stacks4
d m o d e l Embedding output size and dimension of Q, K, and V vectors256
num_headsNumber of attention heads8
ffn_unitsNumber of units of feed-forward layer1012
ff_dimFilters for convolution layers of feed-forward part4
mlp_dropoutDropout value of feed-forward part0
dropoutDropout value0.15
Table 4. Selected Global Hyper-parameters.
HyperparameterValue
Loss functionCategorical Cross-Entropy
OptimizerAdam
Batch size64
Learning rate0.001
Epoch10
Number of folds10
Table 5. Quantitative assessment of proposed methodology.
ClassAccuracy (%)Precision (%)Recall (%)F1-Score (%)Specificity (%)AUC
Non-ectopic beat (N)98.99997.598.298.20.99
Supraventricular ectopic beat (S)99.999.999.999.999.91.0
Fusion beat (F)97.497.499.998.799.10.98
Ventricular ectopic
beat (V)
99.0899.197.798.498.30.99
Undetermined beat (Q)99.910010099.999.91.0
Table 6. Qualitative assessment of proposed methodology for different classes.
SampleModelsActual ClassPredicted Class
Computers 12 00068 i001CNN [12]Non ectopic beat (N)S(Χ)
Bi-LSTM [18]N(√)
Transformer [22]N(√)
CNN + TransformerN(√)
CNN + Bi-LSTMV(Χ)
Bi-LSTM + self-attentionN(√)
CNN + Transformer + Bi-LSTM (Proposed)N(√)
Computers 12 00068 i002CNN [12]Supraventricular ectopic beat (S)F(Χ)
Bi-LSTM [18]F(Χ)
Transformer [22]N(Χ)
CNN + TransformerS(√)
CNN + Bi-LSTMS(√)
Bi-LSTM + self-attentionS(√)
CNN + Transformer + Bi-LSTM (Proposed)S(√)
Computers 12 00068 i003CNN [12]Fusion beat (F)F(√)
Bi-LSTM [18]F(√)
Transformer [22]F(√)
CNN + TransformerF(√)
CNN + Bi-LSTMS(Χ)
Bi-LSTM + self-attentionF(√)
CNN + Transformer + Bi-LSTM (Proposed)S(Χ)
Computers 12 00068 i004CNN [12]Ventricular ectopic beat (V)N(Χ)
Bi-LSTM [18]N(Χ)
Transformer [22]Q(Χ)
CNN + TransformerV(√)
CNN + Bi-LSTMV(√)
Bi-LSTM + self-attentionV(√)
CNN + Transformer + Bi-LSTM (Proposed)V(√)
Computers 12 00068 i005CNN [12]Unclassifiable and paced beats (Q)Q(√)
Bi-LSTM [18]Q(√)
Transformer [22]Q(√)
CNN + TransformerQ(√)
CNN + Bi-LSTMQ(√)
Bi-LSTM + self-attentionF(Χ)
CNN + Transformer + Bi-LSTM (Proposed)Q(√)
Table 7. Ablation Study across the proposed methodology. The ‘-’ sign indicates keeping the constant or unchanged original parameters of the framework.
ModelConv LayerHidden Units Attention HeadsAccuracy (%)F1-Score (%)
Bi-LSTM+
Transformer
None--97.197.1
198.498.4
297.797.3
498.698.6
598.398.1
CNN+
Transformer
-100-9898.0
61298.298.1
97698.298.2
207897.797.7
CNN+Bi-LSTM--297.997.7
498.398.2
698.498.4
1098.398.3
CNN+
Transformer+
Bi-LSTM
3352899.299.2
Table 8. Results of performance metrics on MIT-BIH and PTB ECG Diagnostic Datasets.
DatasetClassAccuracy (%)F1-Score (%)AUC
MIT-BIH
Arrhythmia
Non-ectopic beat (N)98.998.20.99
Supraventricular ectopic beat (S)99.999.91.0
Fusion beat (F)97.498.70.98
Ventricular ectopic beat (V)99.0898.40.99
Undetermined beat (Q)99.999.91.0
PTB Diagnostic ECGArrhythmia98.698.80.98
Healthy98.898.70.98
Table 9. Comparison of the proposed methodology with state-of-the-art methods.
ReferenceApproachPerformance
Jiang et al. [12]CNNAccuracy: 96.6%, MAUC: 97.8%
Shoughi et al. [13]CNN-BiLSTMAccuracy: 98.71%
Fang et al. [17]CNNAccuracy: 92.6%, F1-score: 65.9%
Mittal et al. [18]BiLSTMAUC: 98.64%
Shaker et al. [19]GANs and CNNAccuracy: 98%, Recall: 97.7%
Bertsimas et al. [20]XGBoost AlgorithmAccuracy: 94% to 96%
Guan et al. [22]TransformerRecall: 98.39% and Precision: 98.41%
Che et al. [24]CNN-TransformerF1-score: 78.6%
ProposedCNN+Transformer+
Bi-LSTM
Accuracy: 99.2%, F1-score: 99.2%
Disclaimer/Publisher’s Note: The statements, opinions and data contained in all publications are solely those of the individual author(s) and contributor(s) and not of MDPI and/or the editor(s). MDPI and/or the editor(s) disclaim responsibility for any injury to people or property resulting from any ideas, methods, instructions or products referred to in the content.

