1. Introduction
The pandemic caused by the Coronavirus disease discovered in 2019 (COVID-19) [
1] has left devastating effects on society and on how it carries out its activities, especially regarding work and educational activities [
2]. In higher education, the face-to-face education model could not be implemented; however, the universities reacted quickly and took to the experience of online educational models to continue their activities [
3]. Several works address the identification of the factors that influence teaching environments, and we have divided their review into two groups. In the first, the works that address the creation of academic resources in a pedagogical field are marked. In the second group, the works that analyze the viability of hybrid education based on the new needs of students stand out.
The first group of works reviewed takes hybrid education from the creation of new pedagogies, competencies, and teacher profiles. The works that emphasize this proposal have information and communication technologies (ICT) as the main actor, and they emphasize that these must be used to make the student experience more attractive and capture their interest in learning [
4]. The basis of the proposal they make takes as a background that the duality of hybrid education is an opportunity to optimize face-to-face time and learn what to do remotely [
5,
6]. The contribution of these works to our proposal is mainly because when moving from a face-to-face education model to a hybrid model, a change in pedagogy is necessary. In the design of the new pedagogy, the implementation of innovative strategies that encourage creativity and generate an inclusive education is proposed. The central point that this group of works considers in the hybrid education modality is the role that the teacher develops [
7]. Therefore, teachers must be accompanied and trained to be part of this educational model, developing hybrid learning skills and taking advantage of technologies so that they are a motivating channel for student learning.
The second group of works reviewed proposes various data analysis architectures, and its purpose is to determine the factors that affect learning in a hybrid education model. These works consider that in a hybrid educational model, where the use of technologies becomes more relevant, it is important to consider concepts such as accessibility and usability. For this, works such as [
8,
9] evaluate educational platforms and websites, using questionnaires composed of questions on accessibility and usability. These works are mainly aimed at students who have the necessary knowledge about web pages and the management of educational platforms, accessibility, and usability that are required within a subject. Other works focus on the analysis of design standards that recommend the separation of information (XHTML/HTML) and its appearance.
In the approaches identified in the two groups of works reviewed, there is a convergence in that the success of hybrid education depends expressly on the connection that exists between the feelings of the student and an educational modality governed by technology. Data mining techniques help to identify patterns in the data of students. Therefore, data analysis applied to education helps to identify the factors that influence hybrid education [
10,
11].
With the pandemic, universities have seen how ICTs cover the needs of their students and improve their educational model, making it more attractive for the generation of new professionals with training according to their needs. However, including ICTs in this educational model represents a greater challenge for universities. Among the main reasons are the availability of the systems and the option to profile students around their needs. The analysis framework makes it possible to identify the students’ feelings about their learning and the use of ICTs as an educational tool. With the results obtained, it is proposed to create an academic model based on the use of ICTs that guarantees student learning.
2. Materials and Methods
For the development of the method, several concepts are used as a starting point and basis of the proposal. In addition, the concepts used make it possible to establish the educational models and their characteristics that positively or negatively affect student learning.
2.1. Preliminary Concepts
The development of this work depends on the concepts that define the educational models that are part of the hybrid educational modality. The concepts allow for establishing the functioning and learning characteristics of the educational models. With this foundation, it is possible to establish a point of convergence between educational technologies, teaching methods, and academic management.
2.1.1. Remote Education
Education is currently going through a significant change; this change is due to a greater extent to the effects of COVID-19 and confinement to prevent its spread. As one of the answers to this problem, higher education institutions have opted for a remote education model [
12]. However, remote education is an adaptation of face-to-face educational systems; that is, it is based on giving teachers the role of supervisor and authority. The remote learning modality has become popular in recent months and is chosen more frequently by those who wish to have autonomy in their teaching processes, considering that the demand for time is gigantic. Just like face-to-face education, in remote education connection, times are established, a strict grading system is parameterized, and several academic activities are proposed.
From a practical point of view, no learning method applied to students is wrong; however, an educational process based on pillars such as collaborative learning, teamwork, autonomy, and leadership is more efficient. For example, virtual education, unlike remote education, in recent years has become one of the most important technological advances in digital transformation [
13]. In virtual education, the entire learning process is collaborative, allowing both teachers and students to digitally share all the information that enriches the knowledge.
2.1.2. The Digitization of Education
Access to technology has impacted the way of working in educational institutions, and this is known as digital transformation. Its concept is based on the reinvention of an institution using digital technology to optimize the way both its managers and its students work [
14]. Educational institutions must integrate new technologies into all their processes and provide tools and platforms to improve academic effectiveness with the use of technologies that assist students throughout their learning process. Without adaptability to technological changes, universities fall behind and are unable to generate and share knowledge in society. However, when giving way to digitization, it is necessary to raise awareness and train teachers to be capable of making the most of digital tools in their educational methods.
2.2. Environment Identification
This work is carried out in a private university in Ecuador that offers its careers in the face-to-face modality of both undergraduate and master’s degrees. However, with the impact of the pandemic, the university went from a traditional model to a remote mode. Its population is around 12,000 students and 1000 teachers and administrators who, in a normal environment, are responsible for managing academic quality and verifying student achievement in their learning. Academic quality management has the task of following up on the students, for which it takes information from the students available for the development of activities and evaluations.
This process of monitoring and managing academic quality presents a deficiency in decision-making and depends largely on the student’s grades. Taking student grades is not necessarily appropriate or showing a true result of what is expected of students. Learning has a deeper role, where universities seek to establish axes that assess the hard and soft skills of students. In hard skills, it is sought to evaluate the professional knowledge of the students, and generally, here a degree is required, and this marks the approval of a subject. The soft skills evaluated mark an identifier to define the learning status of each student, and the evaluation of these skills does not require qualification. By not linking soft skills to qualified activities, the veracity of the results of student learning is guaranteed in a large percentage.
The population considered for this study has been segmented into a single career of the engineering faculty, and this career is made up of 390 students. However, Equation (1) is applied to the total population, which refers to the calculation of the most representative sample to provide greater validity to the proposed prototype.
where:
N = Population size
Z = Confidence level (statistical parameter)
p = Percentage of the population that has the desired attribute
q = Percentage of the population that does not have the desired attribute
e = Maximum accepted estimation error
2.3. Identification of the Problems in the Current Education Models
Education is going through a stage of change where the paradigm of face-to-face education has changed considerably. The face-to-face educational model sets its educational method by taking the teacher and his experience and knowledge as the main axis. The universities maintain this educational method considering that the students who opt for this education dedicate themselves to their learning full-time. However, the needs of society have changed, and educational models must cover those needs. Currently, these modalities, due to COVID-19, have had to be updated, allowing for the application of a hybrid educational method [
15]. Hybrid education is not a new concept, but it has not been fully implemented and there is no analysis of its effectiveness [
16].
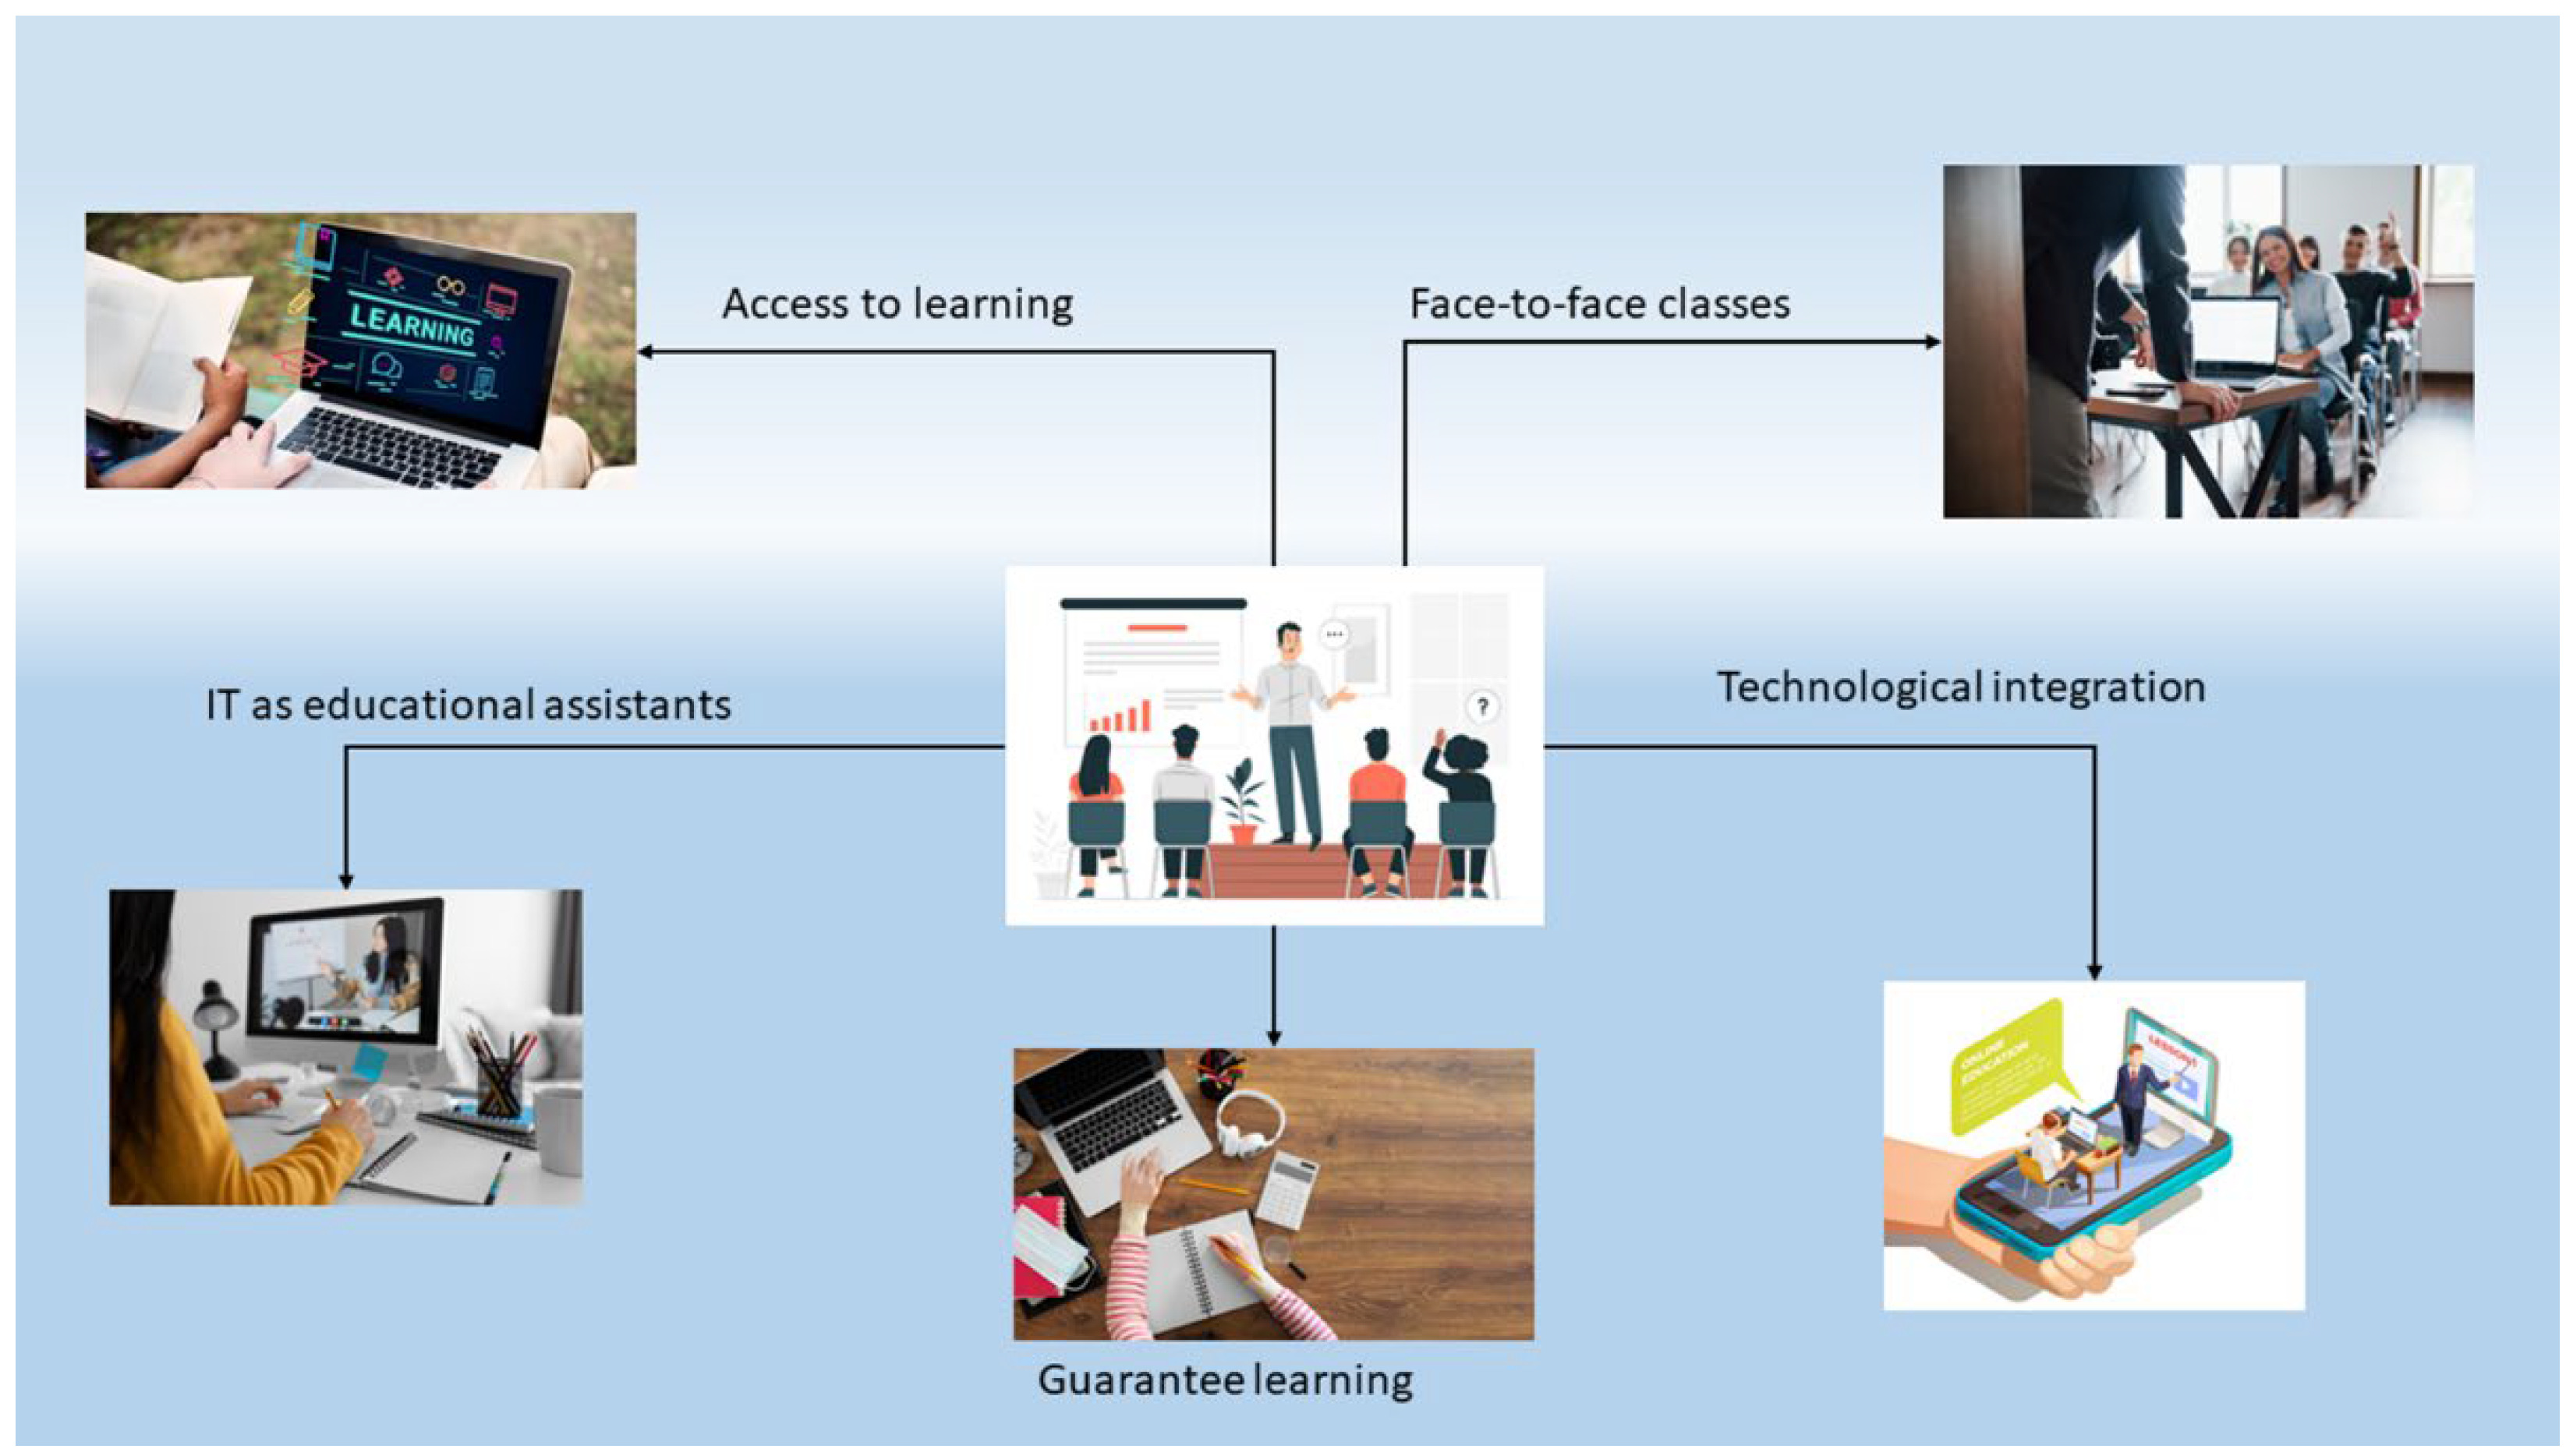
Figure 1 presents the basic components of a hybrid educational model. However, meeting these components is not enough to run the model efficiently and ensure student learning.
A key point for the operation of the hybrid education model is academic planning and technological capacity and integration. The planning and the academic method must be adapted to the needs of each actor in education, since in the hybrid model students and teachers have similar roles. Students are an active part of their learning, and the teacher must interact with technology, using it as an assistant to replace the control it exercises in a face-to-face modality. The control exercised by the teacher in a classroom is essential to identify the progress of each student in their learning. By moving the teacher to a hybrid environment, he will lose the ability to identify the progress of students who follow classes remotely. This is one of the problems that must be avoided, and that responsibility must be handed over to ICTs. With this, it is necessary to establish that ICTs must be included in all stages of learning and not only in telecommunications.
In the figure, the elements that are established as fundamental to executing a hybrid education model are observed. The teacher has multimedia devices that allow him to connect computers and other end devices without wasting time, as well as reproduce the audio and the image with great quality and with greater comfort. In addition, in the LMS, the integration of learning methods and techniques, such as gamification, helps to understand the different subjects of study in an innovative and didactic way. The implementation and integration of ICT to the environment and the LMS have adapted without major complications and its implementation is feasible. However, other factors must be considered that represent a greater challenge for ICTs, such as academic support and the quality of learning. These factors are usually a task that the teacher oversees, which is an important part of the process that these tasks require [
17]. In face-to-face teaching, performing this task for a teacher is feasible due to the control that this generates within the group, which can capture all the events that happen in the classroom and make decisions that help students to solve any doubts or problems in the classroom in real time.
In the online and hybrid modalities, the teacher does not maintain control of the entire environment, and the solution to this problem is found again in ICTs. For this, the digitization of educational environments provides a solution to meet the new needs of students. However, the digitization of educational environments includes emerging technologies, such as Big Data, Artificial Intelligence (AI), the Internet of Things (IoT), Blockchain, etc. [
18,
19].
2.4. Data Collection
The data with which the analysis works is collected from two types of sources. The first type includes transactional databases; these sources store information about the academic development of students, as well as financial information. The second type of source includes data obtained through surveys of those involved in education [
20].
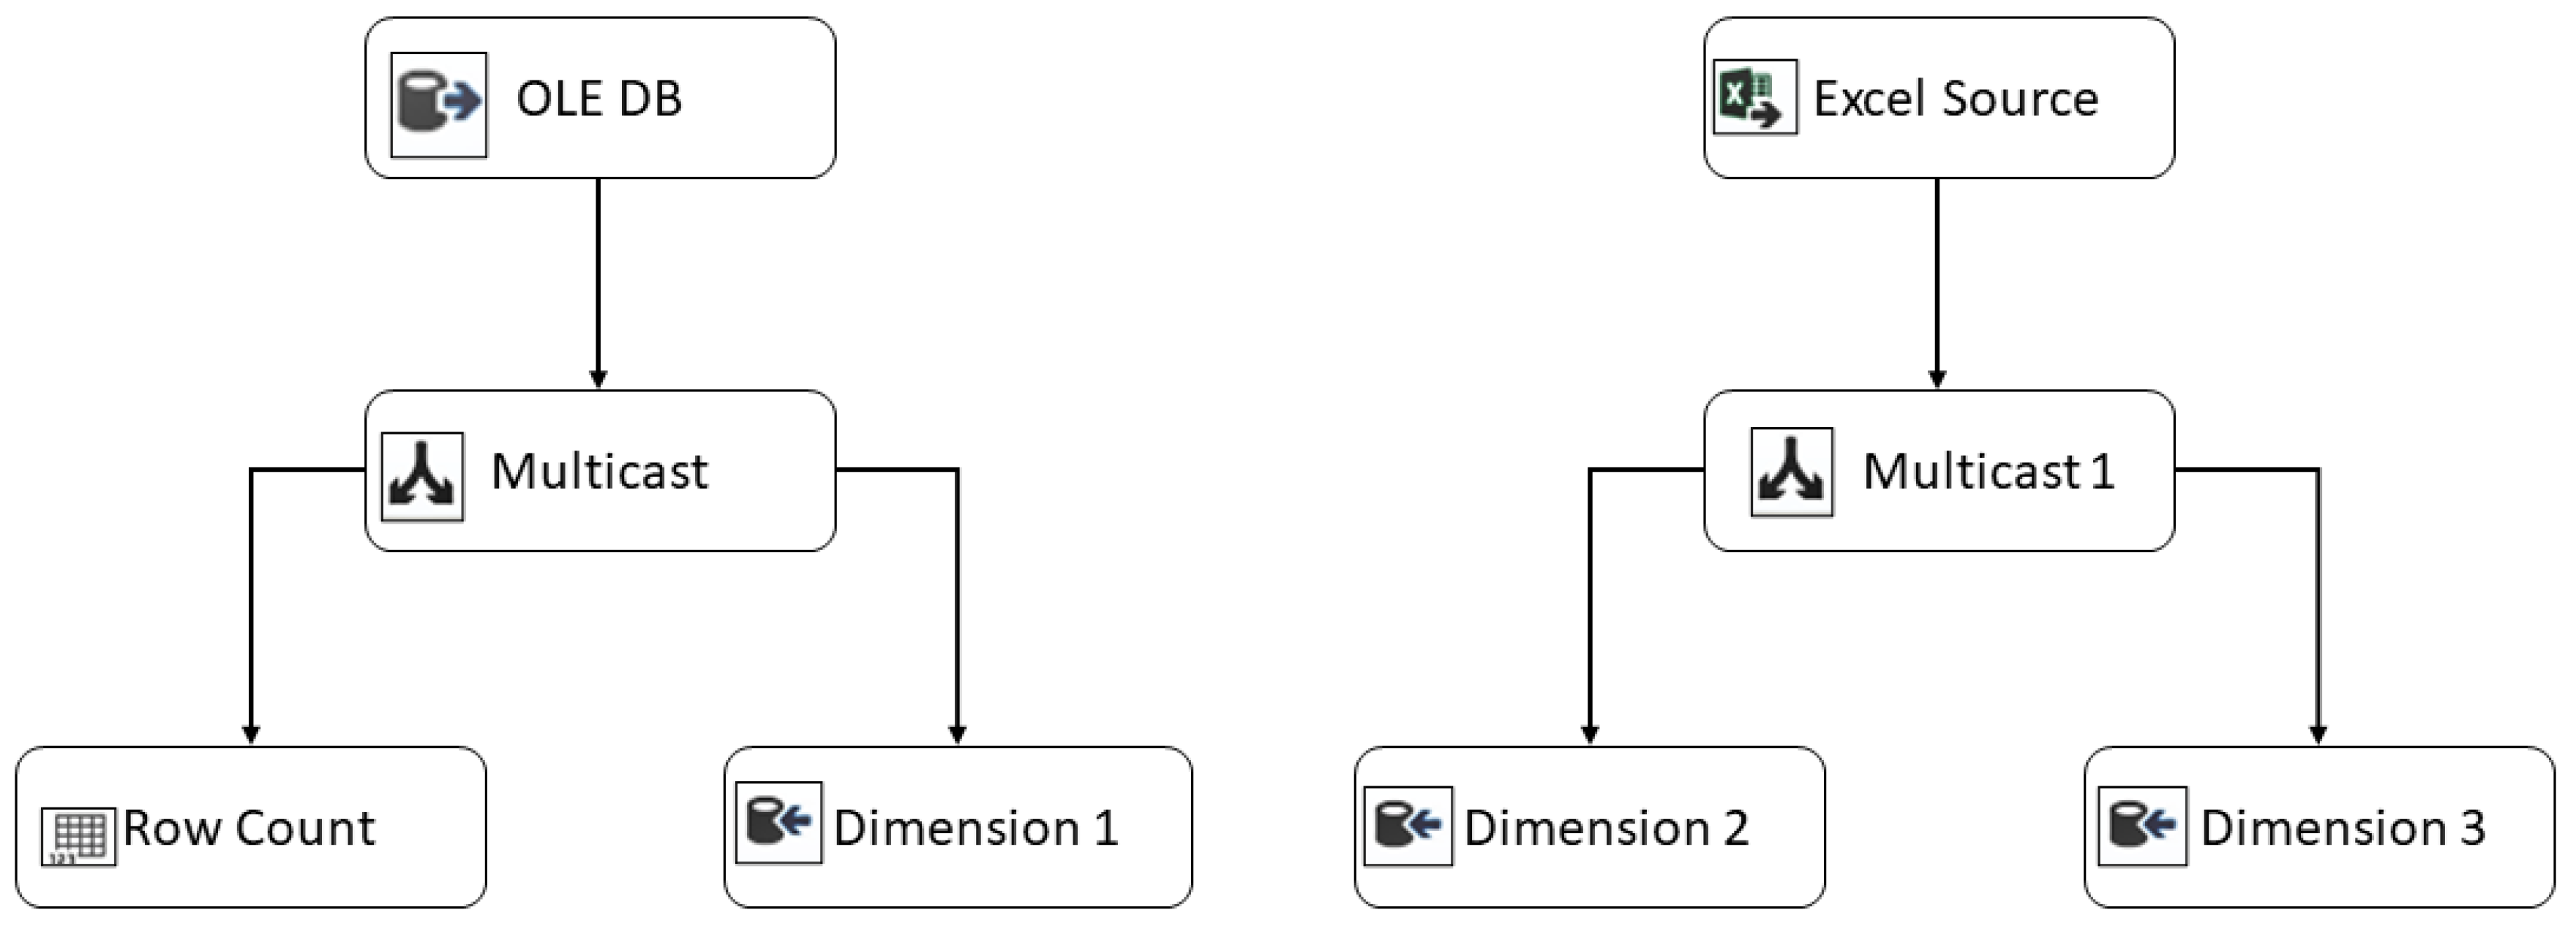
The data extraction is done through an ETL process, and several tools allow the design of these processes. The tool used in this work is Microsoft SQL Integration Service. This tool, in addition to its functionality, is graphical, which means that its application does not require excessively deep knowledge on the part of the user. This does not imply that the tool only has basic operations; on the contrary, within its transformation components, it presents several options for a granular transformation of the data.
Figure 2 shows one of the processes used for data extraction and transformation. In the segment shown on the left, the source is a transactional database, for which integration services handle an “OLE DB” data source in its tools. This tool allows one to generate a connection string with the desired database and choose the table from which the data is extracted. For the method, in addition to extracting data directly from the different tables, Query is also used to allow the data from different tables to be joined or to perform certain transformations on the data, such as the elimination or transformation of null values. In addition, in the process presented in the figure, a multicast transformation is applied to distribute the data input to two outputs [
21]. For this, a conditional split is applied in the transformation to route the data rows to different outputs. In the first output, the data is routed to a few rows, and this information will be useful for storing the number of rows inserted in a dimension. The other destination of the data is the dimensions of the Datamart, which serves as a multidimensional data warehouse. In the right-hand segment of the figure, the ETL extracts the necessary data from an Excel file. This may be a survey or additional student data that has not been aggregated into traditional systems.
The objective of generating the surveys is to obtain data that allow determining which are the factors that most affect learning, according to what the student thinks. The factors have been selected according to the review of the literature, where the authors have carried out various analyses and evaluations of the parameters that influence student learning. For example, the work [
22] carries out a correlational study, which is intended to see the relationship between the motivation of students, their learning strategies, and their perception of the school climate with academic performance. The data collection is done in a random population where an individual questionnaire is applied, according to the previously established instructions.
The work [
23] determines the factors that determine an ideal environment for online learning, and in its application, they mention that it is difficult to observe the activity of students and teachers in this educational model. Therefore, they have applied personalized interviews to be able to interpret what is seen in the LMS. When collecting the necessary information, they used qualitative and quantitative techniques. In this way, they have designed a table with the criteria that they consider important in the development of learning. Among these criteria, the instructional methodology stands out, accessibility and usability, interactivity with the environment, organization and planning of content and activities, etc. With this information, the evaluation factors for the proposed method are established, and these are:
Accessibility
Interaction
Usability
Time
Effectiveness
Motivation
Methodology
Generally, survey questions are designed to elicit as much real information from the respondent as possible, so they need to be clear, direct, and objective. The response model is presented by levels of acceptance or rejection, and in this way the respondent does not generate a state of annoyance or discomfort that punishes the veracity of the answers. An example of the type of questions used in this work is the following:
Please rate from 1 to 5 according to the following statements that are related to the experience you have had with remote education, where 1 means “Totally disagrees” and 5 means “Totally agree”.
To define the validity of the data acquisition instrument (survey), factorial analysis has been applied to identify if it responds to the study phenomenon. For this, two processes are considered: the calculation of the Kaiser-Meyer-Olkin Measure (KMO) of Sampling Adequacy and Bartlett’s test and the applied variance.
Table 1 shows the results of the KMO analysis that relates the correlation coefficient rjh, observed between the variables Xj and Xh, and ajh, which is the partial correlation coefficient between the variables Xj and Xh. The closer the value obtained from the KMO test is to 1, the more it implies that the relationship between the variables is high. If KMO ≥ 0.9, the test is very good; remarkable for KMO ≥ 0.8; the median for KMO ≥ 0.7; low for KMO ≥ 0.6; and very low for KMO < 0.5.
Bartlett’s test of sphericity evaluates the applicability of the factorial analysis of the variables studied. The model is significant (we accept the null hypothesis, H0) when factor analysis can be applied.
According to the results obtained, the survey responds to the study phenomenon, and it is possible to apply the factorial analysis.
Table 2 shows the total explained variance, where four components, according to the Kaiser rule, provide a factorial structure that explains 63,044 of the total variances. The total explained variance must be able to respond to the study phenomenon with at least 50% of the accumulated percentage. Therefore, with four components, the factorial analysis responds to the study phenomenon, and it is possible to determine that there is a difference that is significant between factors or dependent variables, and it is possible to apply different data analysis models to determine the existing relationships in the data.
2.5. Technological Architecture for a Hybrid Education Model
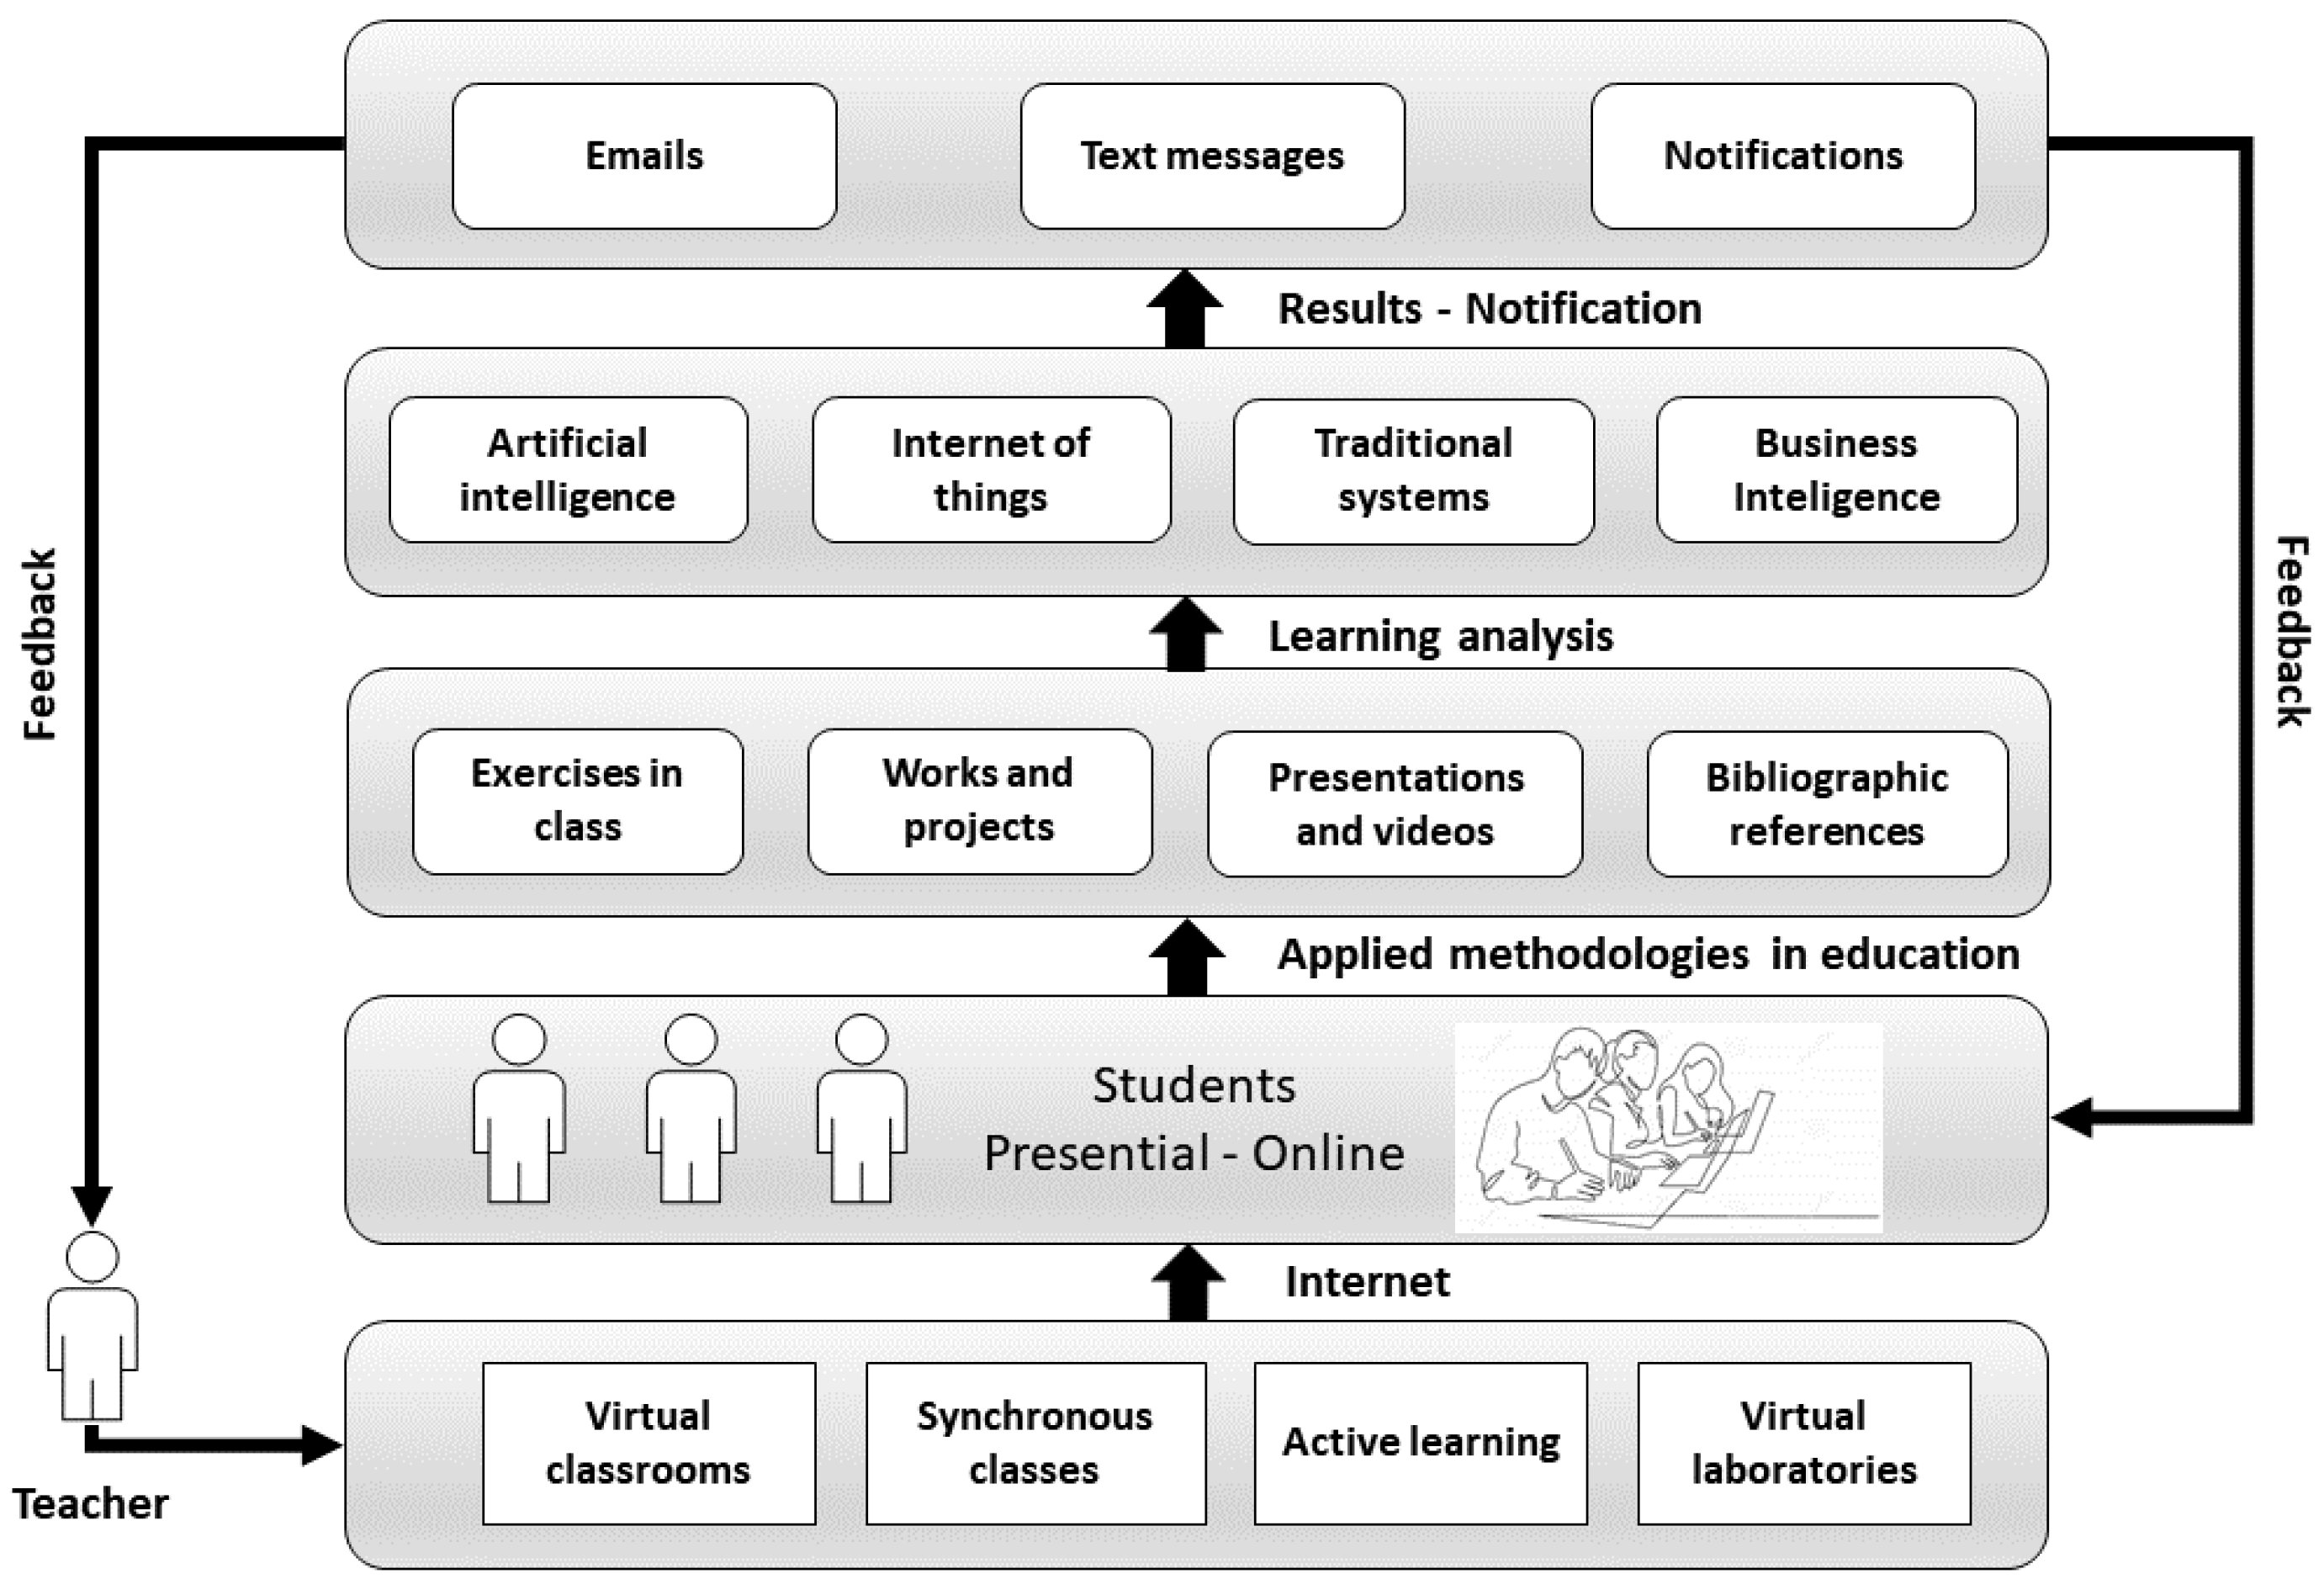
Figure 3 presents an IT architecture that aligns with a hybrid educational model. This architecture is considered to solve the problems of monitoring and academic effectiveness, among others. For this, the architecture integrates emerging technologies as fundamental components for the acquisition, treatment, analysis, and data to improve decision-making that contributes to learning and generate an educational environment adaptable to the user’s needs [
24]. The representative scheme of the architecture uses layers and is described from the lowest layer to the highest. In the first layer, the educational media that teachers generally use to conduct their classes are presented. In this layer, the synchronous or asynchronous interaction models stand out. These models are key in the development of hybrid education since, given that there is a group of students who do not attend in person, the university must provide the tools that allow them to serve the student remotely. The student can even access the review of classes asynchronously, a method widely used in distance education [
25]. Therefore, the need for videoconferencing platforms plays a fundamental role in being able to generate recordings and make them available to all students for review.
The next layer identifies the groups of face-to-face and remote students. Once each group is identified, the university must establish rules and policies that regulate the number of students admitted to each of the classes. The factor that determines the maximum number of students in each course must be analyzed in a granular way, in such a way that it does not affect learning performance [
26]. In the hybrid modality, to maintain academic quality, it is recommended to apply the guidelines of face-to-face education. Face-to-face universities work with several students that range between 15 to 30 people per classroom. With this number of students, it is possible to establish adequate monitoring and development of knowledge [
27].
In the next layer, the educational method is considered. It has been mentioned in previous sections that the method must consider the use of ICTs and digital environments for the generation of learning. In the face-to-face educational model, the use of virtual learning environments is more an option than a necessity, and in hybrid education, these environments are mandatory. Similarly, in the online education model, the use of virtual learning environments has a very high component based on student self-training [
28]. This leads to an analysis of the educational process that focuses on the following stages:
Determination of basic learning needs
Translation of needs into development profiles
Proposal of study plans that respond to performance profiles by educational levels.
When carrying out the analysis of the educational process while considering each stage, it is possible to propose an academic model with integrated competencies and curricular flexibility that allows for defining the type of courses and activities. The academic proposal must be specific to each educational institution based on its infrastructure and human and academic resources. To define the needs, the integration of technologies such as data analysis is necessary, as the application environment will depend on the volume and variety of data [
29].
The learning analytics layer works directly with the academic method. In this layer, the student data is processed. At this point, it is necessary to design a data analysis architecture that adapts to the needs of each university. Among these architectures is business intelligence (BI), or Big Data, and each of these needs specific infrastructures. For the design of the method in this work, a BI architecture is used [
30].
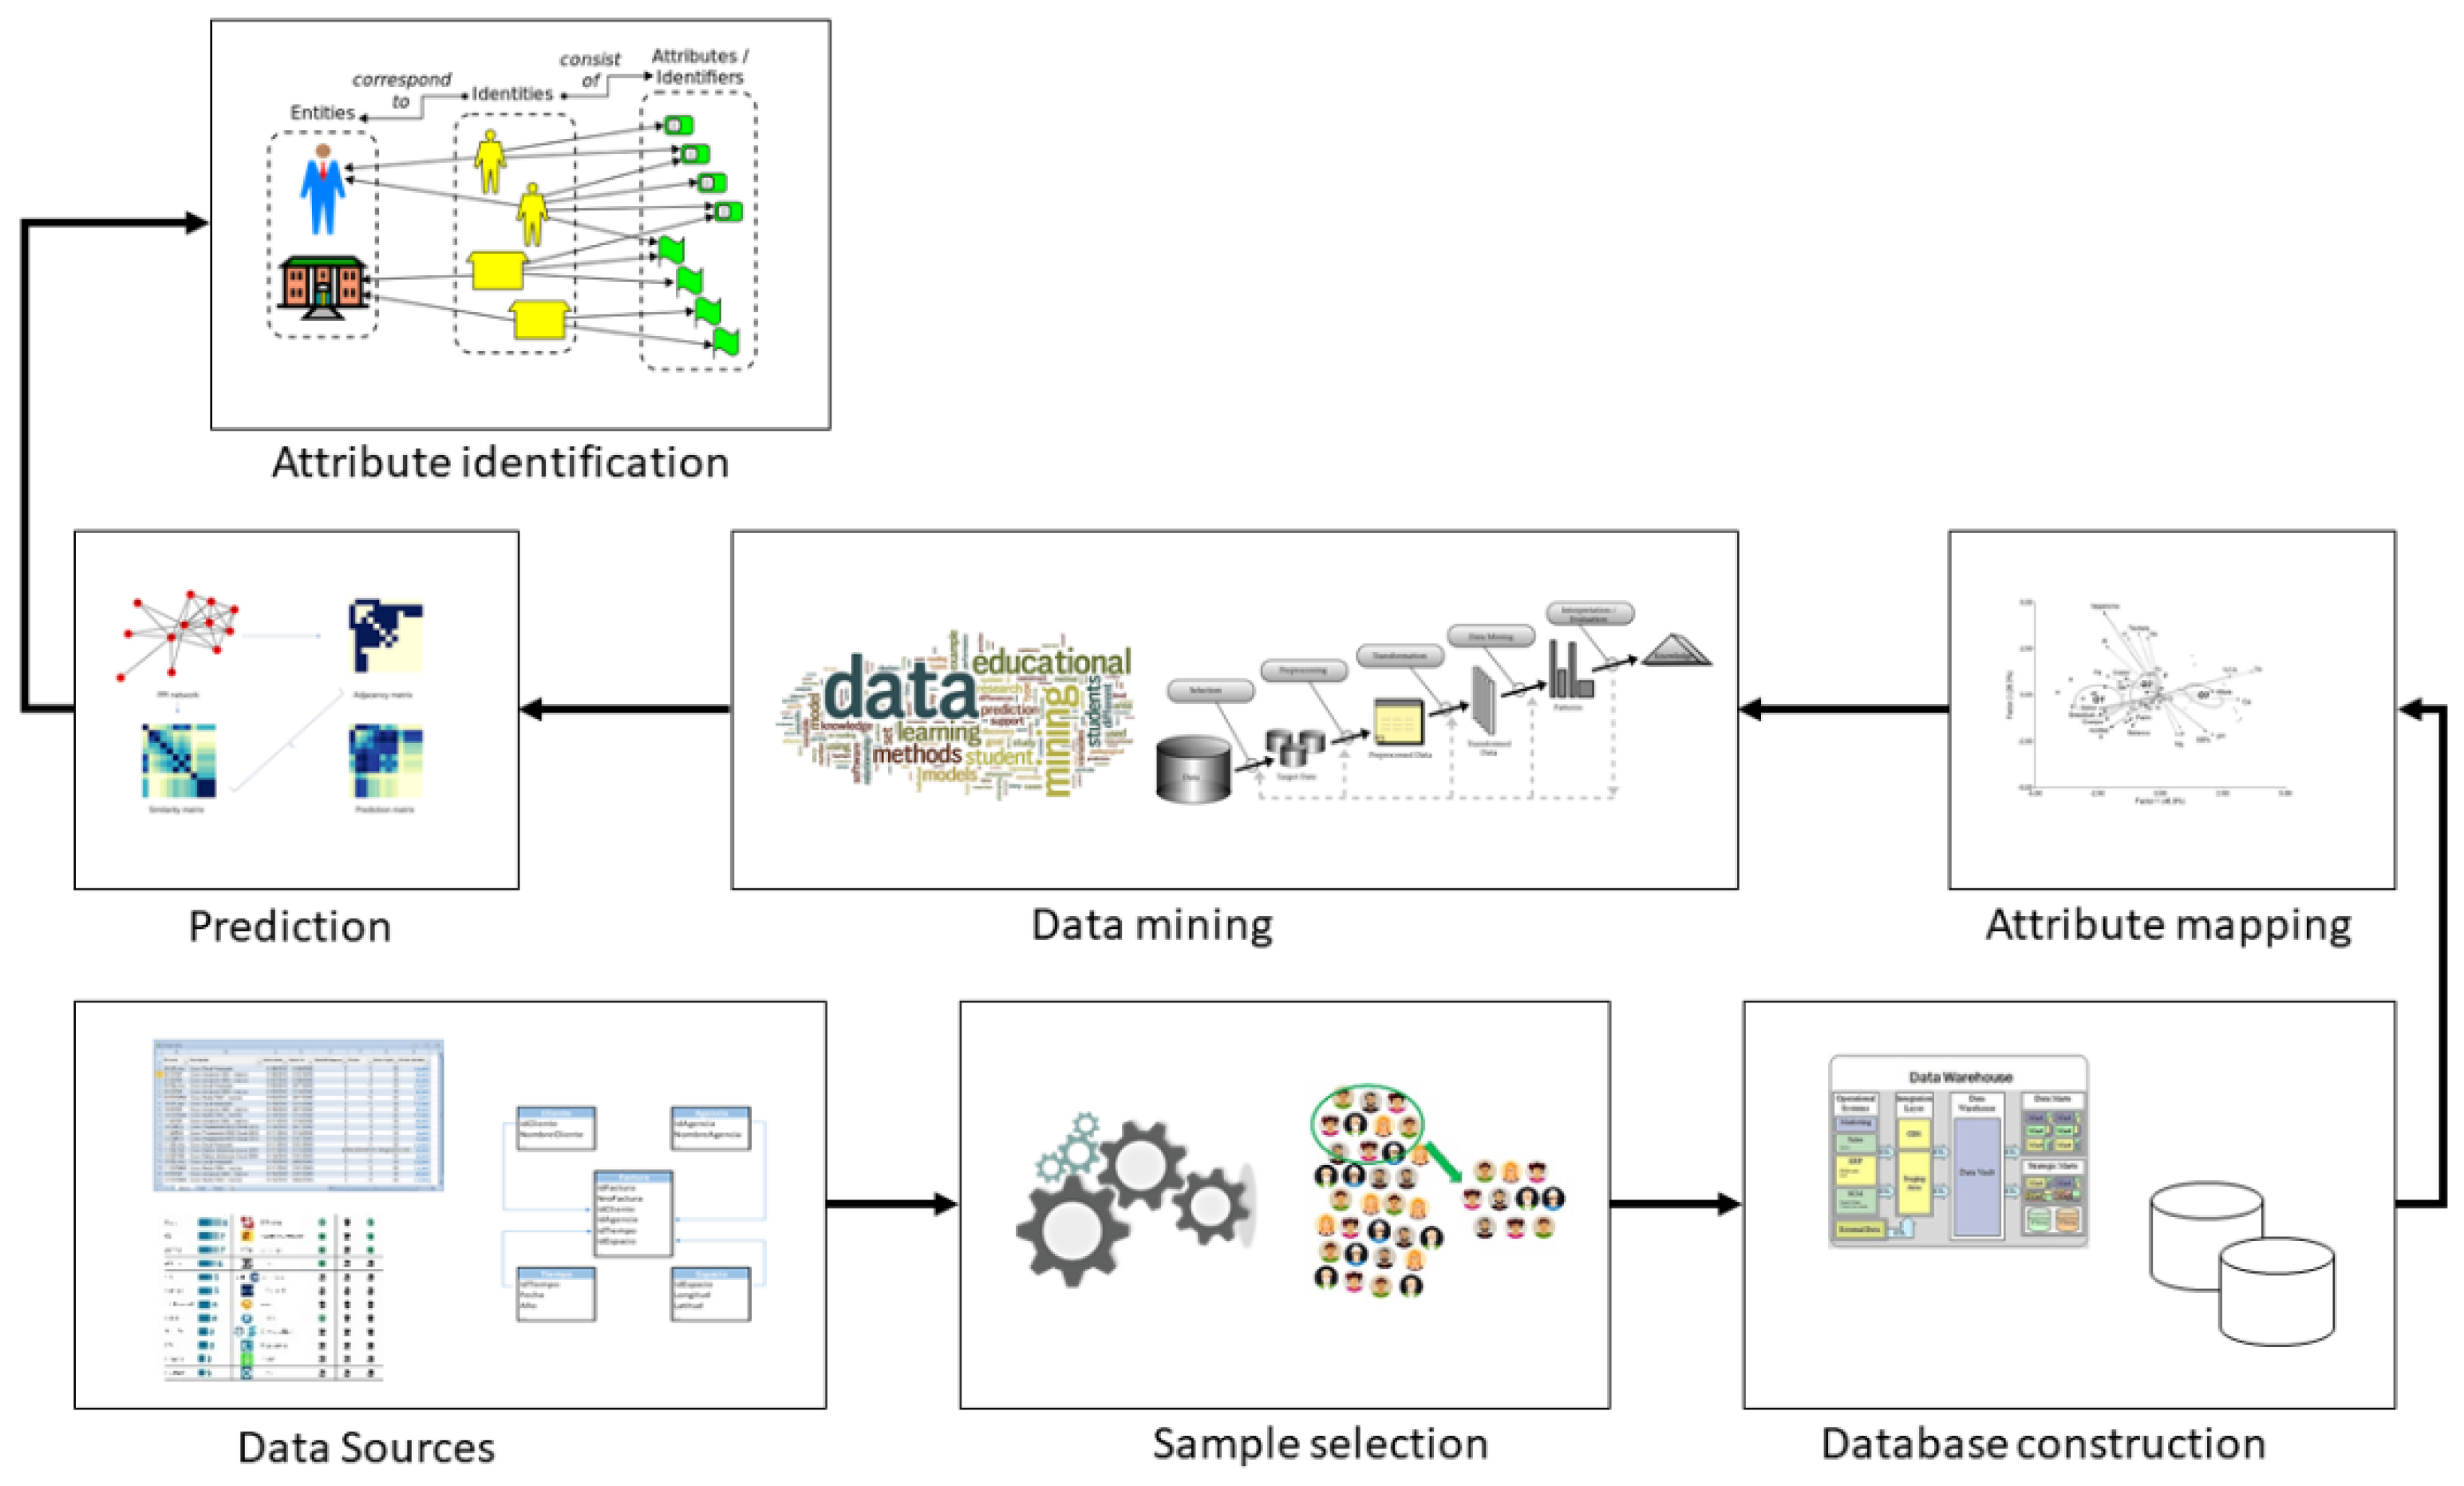
Figure 4 presents the stages considered for the analysis of educational data. The process begins with the identification of data sources. The integration of ICTs in education allows environments to have several data acquisition systems, which allow monitoring of academic management and learning development. In the next phase, a simple selection of the data to be analyzed is carried out; for example, if it is necessary to include only academic management, the data sources must respond to these needs. Next, a database is created, which can be relational or multidimensional. Your choice depends on the questions to be answered and the existing infrastructure to guarantee the quality of the data as well as the scalability of the analysis. To meet these requirements, the ideal is to adopt a multidimensional architecture. For this, it is possible to use two methodologies: the first is Bill Inmon’s top-down methodology and the second is Ralph Kimball’s bottom-up development methodology. For the development of this work, the Kimball bottom-up method was used. This methodology contemplates the development of one or several data marts that can feed a data warehouse. However, depending on the analysis to be carried out or the volume of existing data, it is possible to build a data mart and exploit the knowledge about it.
In the next phase, the mapping of attributes is carried out, which seeks to establish the existing relationships between the different dimensions of the data mart. By mapping the attributes, it is possible to work with the identified characteristics that must enter the analysis. During this stage, it is possible to create several instances to analyze different attributes and see the behavior of the data. In the next phase, analysis is carried out using data mining algorithms. In the prediction phase, the aim is to discover the knowledge about the patterns of the previously analyzed and classified data. For the prediction, it is necessary to establish the questions that need an answer; for example, for the 2021 cohort, what are the factors that impact the academic performance of students in a hybrid education model? The final phase is the identification of attributes. With the knowledge generated, it is possible to determine which are the different entities related to learning and how they affect its execution.
3. Results
For the presentation of the results, the analysis begins with the selection of the sample, as indicated in the method. This work collects the data of the students of an engineering career. However, to segment the population, the equation of the most representative sample is applied, for which the data considered are:
N = 475
Z = 1.96
p = 50%
q = 50%
e = 3%
When applying the equation, it is obtained that the most representative sample is 329 students. This sample is made up of 157 women and 129 men. The age range of the population is 20 to 22 years old. These data are informative and are not considered for the analysis.
3.1. Educational Data Analysis
For the analysis of educational data, each element established in the
Section 2 is detailed.
3.1.1. Data Sources
The data sources that are part of the university are varied, as it has several academic and financial systems that are stored in relational databases. As the LMS uses the Moodle platform with a relational database in MySQL, other systems are currently part of the academic environment, such as videoconferencing platforms and gamification tools. In this study, the data stored in Moodle has been considered the main source of analysis, considering that the LMS is the main tool for recording all academic activities [
31]. In 2021, several surveys were carried out on both academic staff and students to collect data on the experience of using the IT tools integrated into education, as well as the feelings of students about the hybrid modality that had been executed in the year. The categories or attributes in which the survey is aligned are accessibility, interaction, usability, time, effectiveness, motivation, and methodology.
The categories with two items or questions are presented below. The choice of items for the presentation of results is mainly due to the guidelines considered for the design of the surveys. In the revised guides, it is established that to guarantee the veracity of the answers, the surveys must be objective and must comply with certain guidelines that prevent the respondent from losing motivation in the development of the survey [
32]. Therefore, a multiple-choice type of survey is considered adequate when it contains fewer than 20 questions. In this work, 14 general questions have been considered, and their results can be analyzed to define which of the categories or dimensions has the greatest influence on the explanation of the phenomenon under study.
Accessibility
- ○
Is it easy to find what I need on the website?
- ○
Does the website allow me to complete a transaction quickly?
Interaction
- ○
How often do you interact with your teachers per week?
- ○
How often do your teachers provide feedback on your schoolwork?
Usability
- ○
Are you satisfied with the technology and software you use for online learning?
- ○
How satisfied are you with the remote education tools implemented by the school?
Time availability
- ○
How much time do you dedicate each day on average to distance education?
- ▪
1–3 h
- ▪
3–5 h
- ▪
5–7 h
- ▪
7–10 h
- ▪
More than 10 h
- ○
How well could you manage time while learning remotely? (Consider that 5 is extremely well and 1 is not at all)
Effectiveness
- ○
How helpful are your teachers while you study online?
- ○
How helpful has your (school or university) been in offering you the resources to learn from home?
Motivation
- ○
Are the contents of your courses necessary to understand the contents of other subjects?
- ○
Do the contents of your courses respond to the training needs of the context in which you intend to work?
Methodology
- ○
Is the way in which learning activities (methodology) are developed in your courses clear?
- ○
Are activities carried out in your courses that require a critical position of what you have learned?
Once the survey was completed, 4046 records were obtained, responding to 329 individuals surveyed (of whom 320 are students and 9 are teachers). This data is in text format and responds with the survey response type. These responses are converted to values between 1 and 5 to be processed with the data mining algorithms.
3.1.2. Selection Simple
The university, by using the LMS as the main component of its educational model, stores a large volume of data in the different tables of the LMS. It is possible to integrate all the data into the analysis; however, in this work, only the data referring to academic activities, students, groups, and use records and data related to learning and academic events raised by teachers have been considered. The main objective of the simple selection is to identify the data that is needed for the analysis and will be processed with the ETL [
33].
3.1.3. Database Construction
The construction of the database has been developed following Kimball’s multidimensional model for the design of a data mart that acts as a subset of a possible data warehouse if necessary. It is important to point out that representing a system or an object through a data mart does not imply that it is a simplified model or that it requires less effort than the construction of a data warehouse [
34]. On the contrary, it maintains the same complexity; however, its star schema is used to represent the problem in learning.
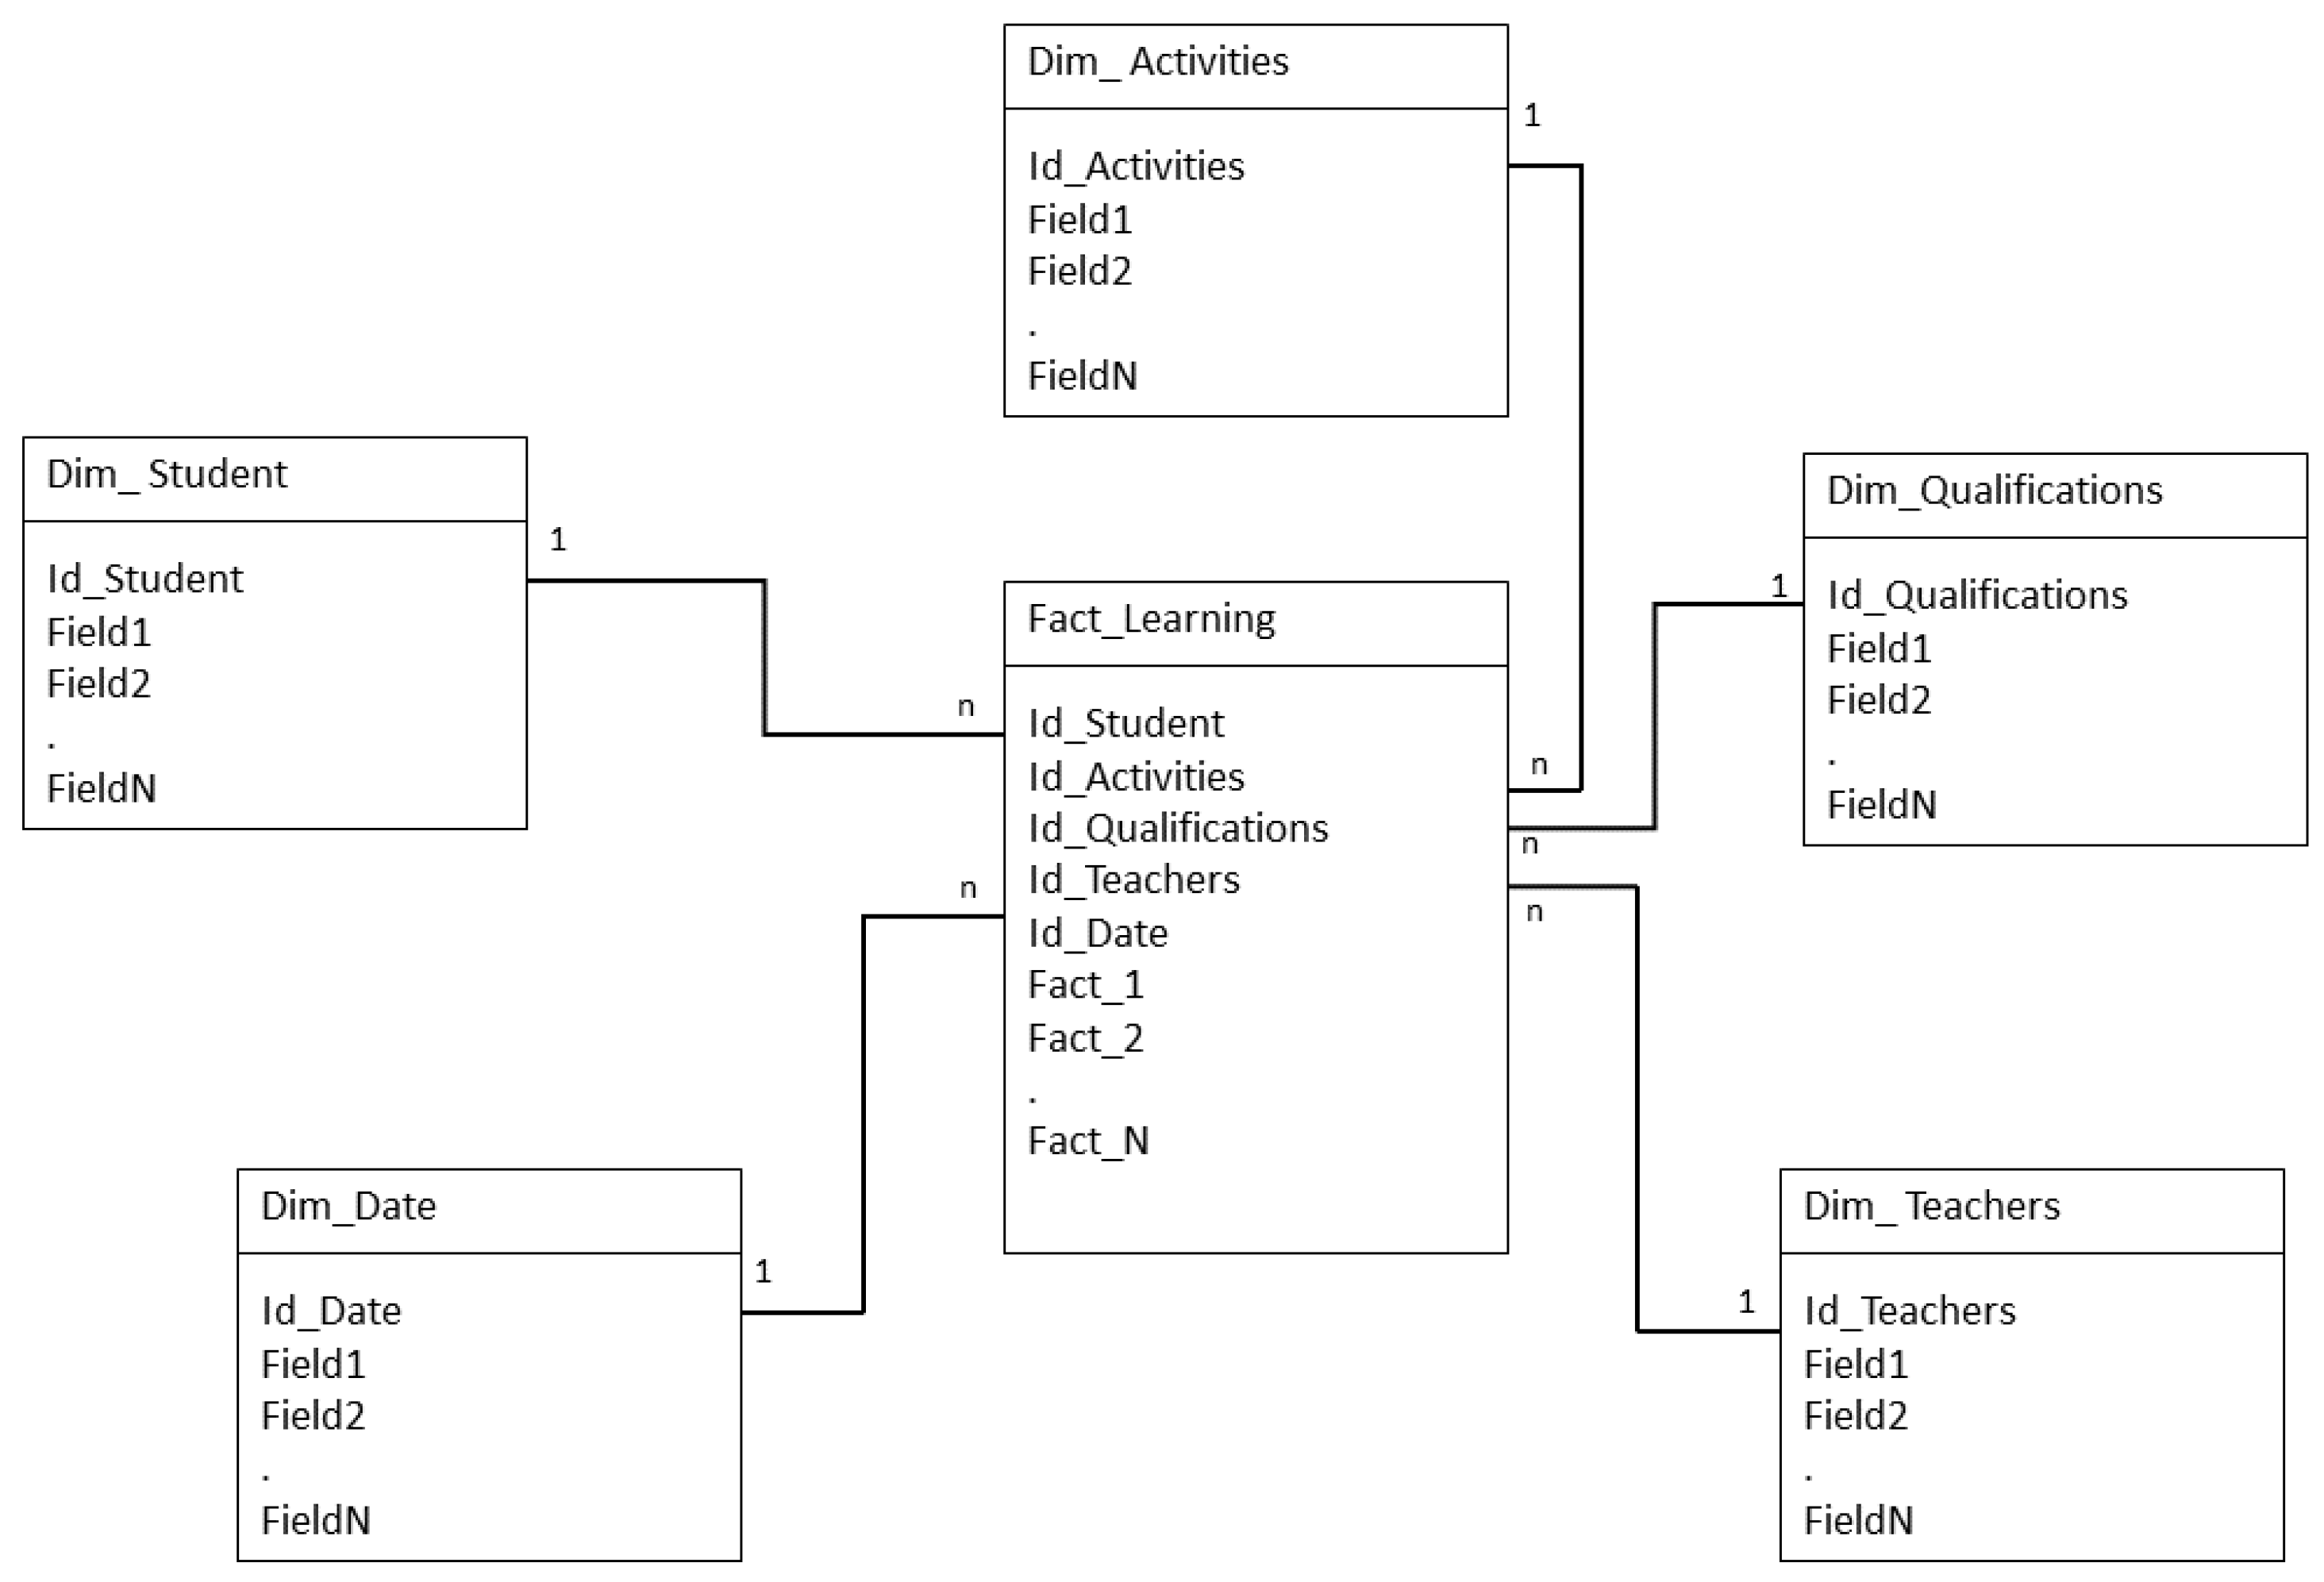
Figure 5 shows the structure of the data mart model used, in which five dimensions and a fact table have been used. Among the dimensions are:
Students: you have your identifiers, courses, parallels, and subjects in which you are assigned.
Activities: contains information on each task, questionnaires, forums, surveys, etc.
Qualifications: you have the qualifications of each activity and their totals.
Teachers: stores information on teachers, assigned courses, attendance, etc.
Date: allows to generate projections.
In the Datamart with five dimensions, the information that is considered important for the study is covered. In the activities, dimension data that has been extracted and transformed from the LMS is loaded. The relevant data in this dimension is focused on identifying all the activities that the student performs as components of their learning. The extraction is done from the transactional database of the LMS, and to do so, priority has been given to the use of Query, which extracts the columns and joins them from several tables to link with the fields of the data mart. In the student dimension, student information is uploaded, such as names, addresses, ages, subjects taken, levels, financial statuses, etc. In the qualifications dimension, the information corresponding to the performance of each student in the development of the activities proposed by the teachers is loaded. The dimension of professors contains relevant information regarding their identification, their academic load, assigned subjects, schedules, and the data of the evaluations carried out on each professor. In the time dimension, the data of quartiles, schedules, start and end dates of each period, etc. are loaded. This dimension allows for the monitoring of students in a specific period, as well as the generation of projections. The learning fact table loads quantitative data that determine the exact values of each student activity. In the fact table, you can perform operations on the score a student needs to pass a subject or the number of subjects each student takes. With the proposed scheme, it is proposed to respond to the phenomenon by studying what, in this case, is learning. In addition, the model allows for granular analysis using OLAP cubes or data mining algorithms.
3.1.4. Attribute Mapping
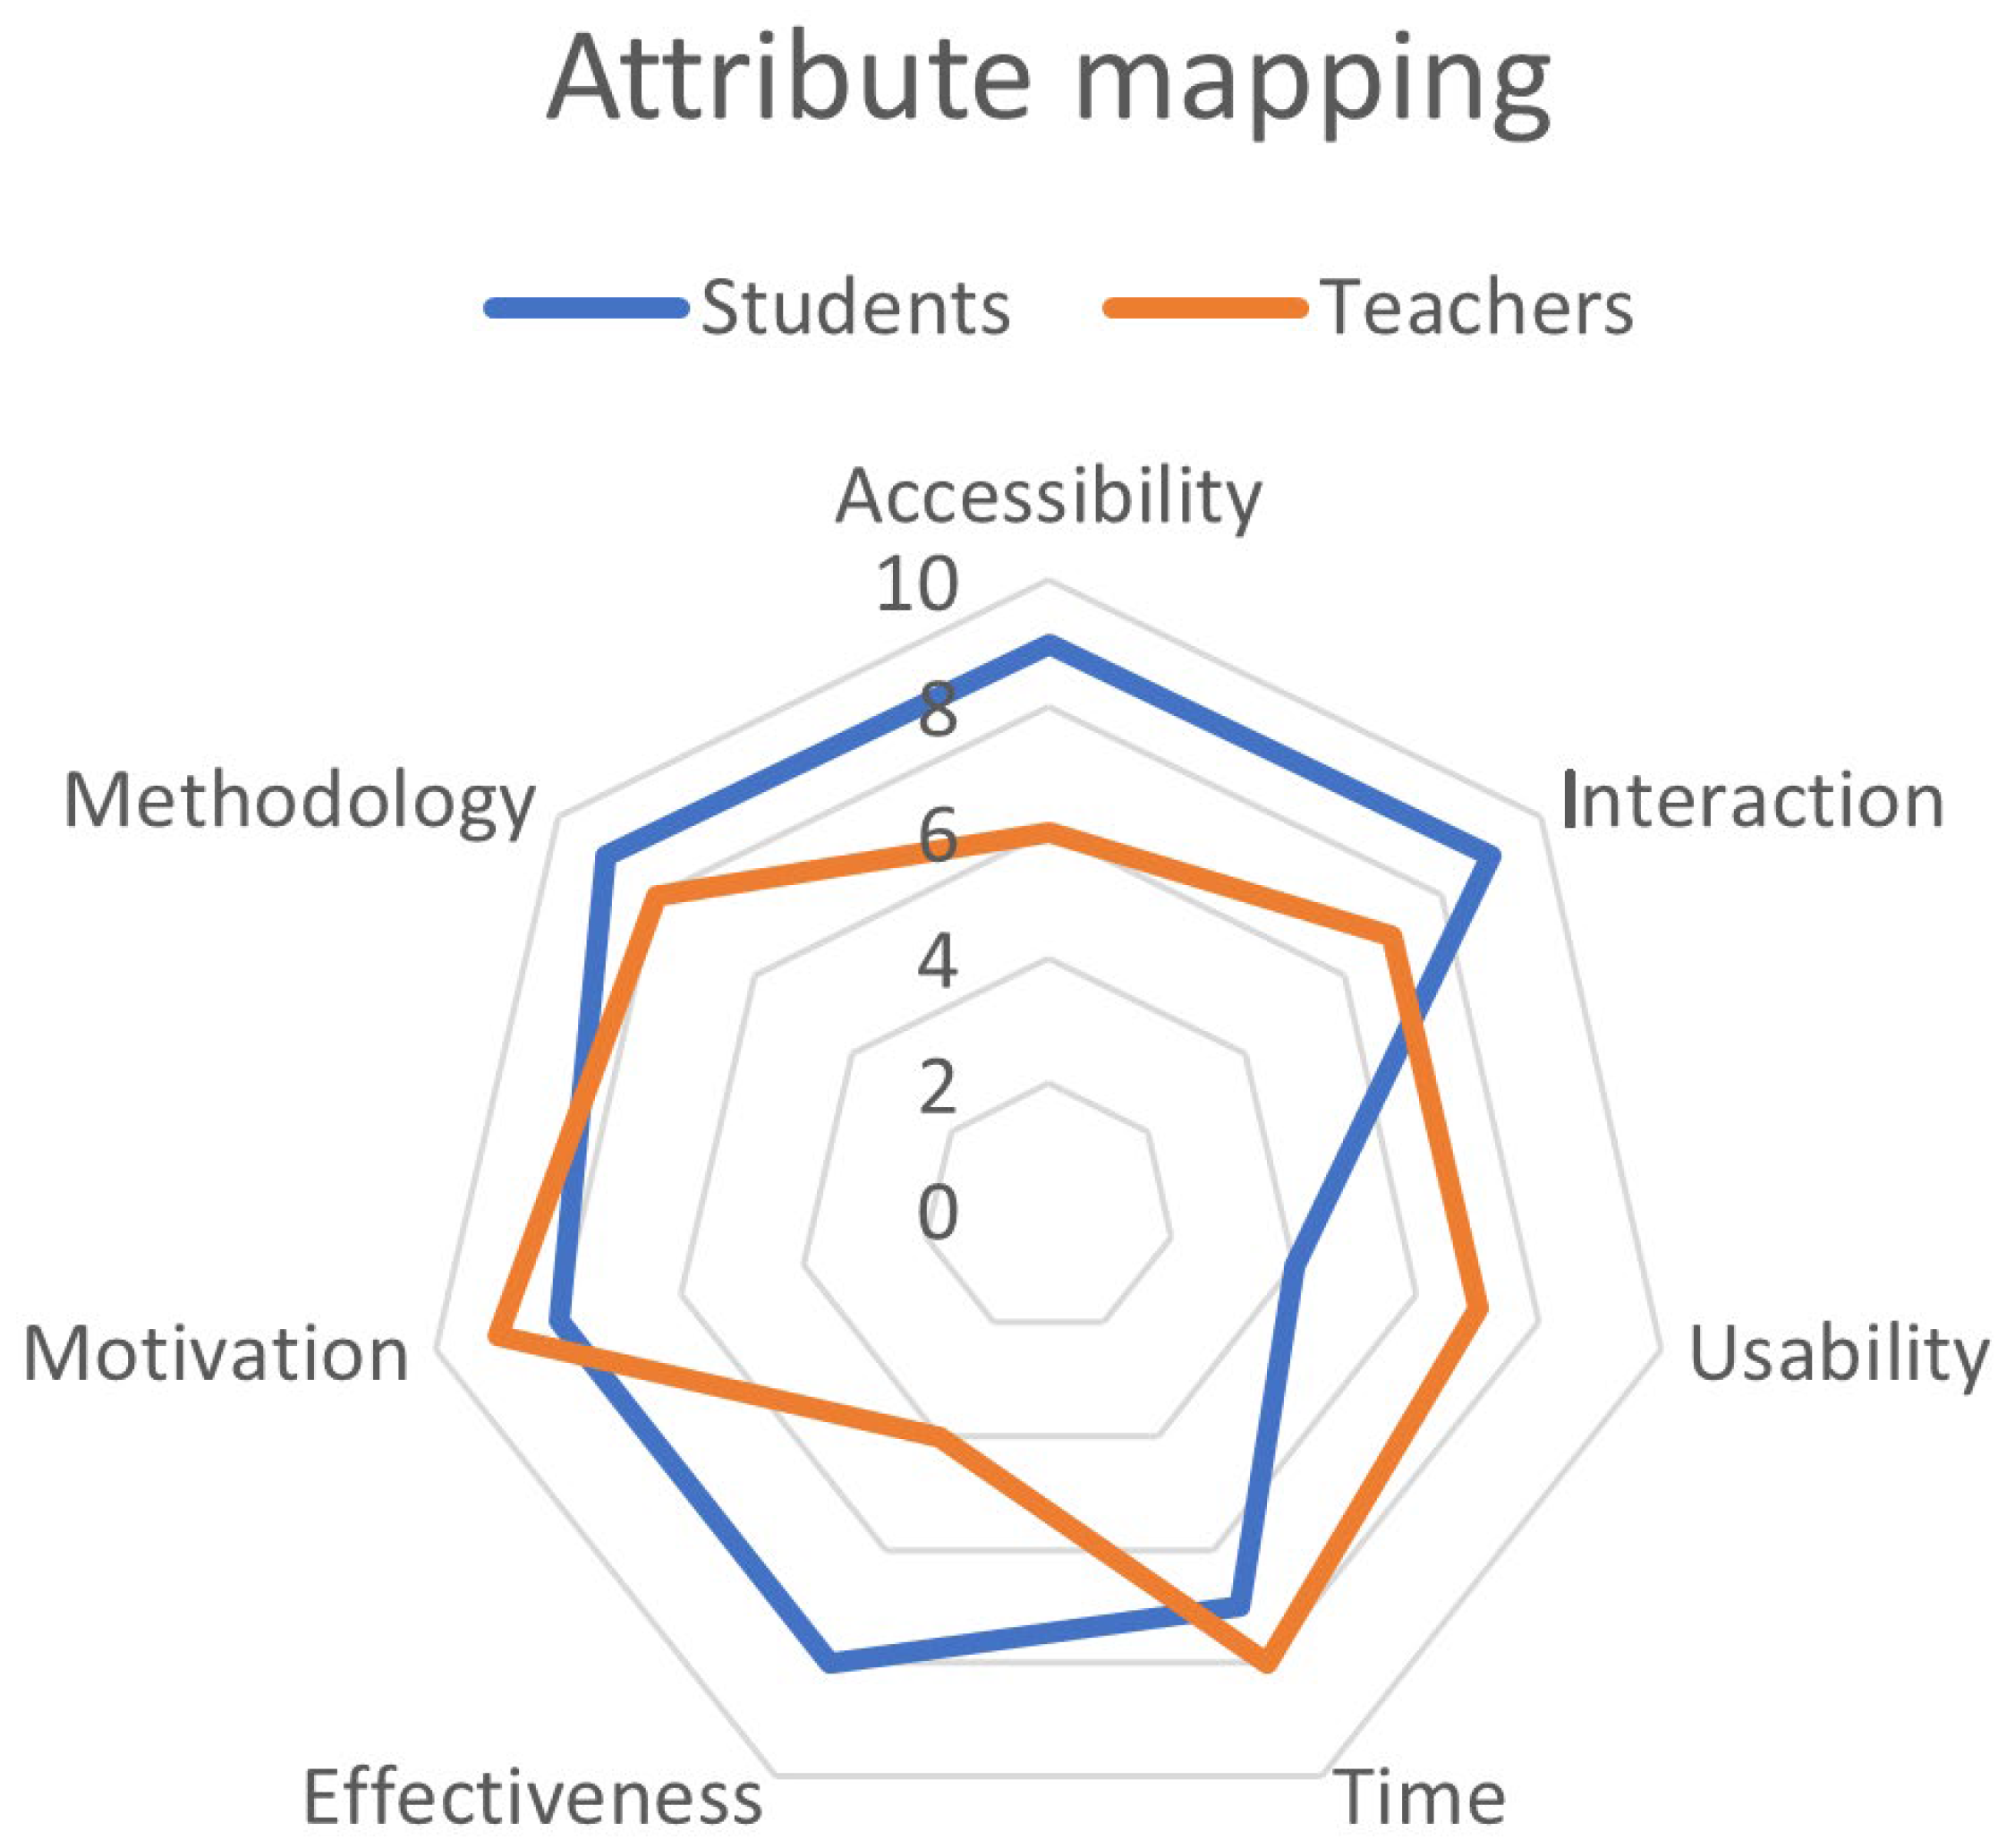
A map of attributes of a product or service is a graphic representation in which the most appreciated or most important features or characteristics of a customer can be quickly and visually appreciated. Through an image and in an intuitive way, we can detect which attributes are valued more and which characteristics or qualities are less appreciated. The mapping of attributes considered data from surveys of teachers and students. The objective is to identify the most relevant characteristics that affect those directly involved in education and integrate the corresponding sources. For this, we work with the most representative sample calculated in 329 people. The questions included address seven fields considering the main axes of current education.
Table 3 presents the fields addressed by the questions of the survey. In the first row, reference is made to the groups that have participated in the activity, the group of students, and the group of teachers. The values that are presented have been obtained by taking the average value of importance that the participants have given to each category, with 0 being the value with the least incidence and 10 being the value with the greatest influence on learning. For example, in the field of interaction, the group of students indicates that it has a greater influence on their learning, as well as the methodology used by teachers. In the case of teachers, this group considers the functioning of ICTs as one of the factors that most influence academic performance. The motivation of students in a hybrid educational model is another of the strengths that teachers consider important for learning.
Figure 6 shows the most significant attributes in the learning of each group, and the students have defined five domains as critical for learning. Of the five fields, the methodology used by teachers is one of the most committed, which makes sense with what has been mentioned in previous sections where certain universities use a methodology of face-to-face education in a remote model, generating learning problems. The other fields with the greatest influence on learning (with a value of nine) are interaction and accessibility to learning and technology. Motivation is important with a value of eight; however, in the same field, teachers consider this field one of the most influential in learning [
35]. An aspect identified in this activity is that the field of usability is marked as the digital gap that refers to the use of ICTs, where teachers have a greater problem than students. This factor is related to the penetration of technologies and their use in new generations of students. For this, it has been considered that the age range of the students is between 17 and 23 years. Therefore, their relationship with technology is very friendly, but on the other hand, the teachers who belong to the researched university are in the age range of 38–55 years. Once the fields of greatest influence have been identified, it is possible to determine the data that will be integrated into the analysis in the next phase.
3.1.5. Data Mining
Data mining allows you to identify patterns in data and classify them based on discovered trends. For the process, the methodology proposed by Fayyad [
36], which deals with knowledge discovery in databases (KDD), is used. This methodology is interactive and involves several stages with user intervention in decision-making. The stages of the methodology are selection, preprocessing, transformation, data mining, and knowledge interpretation.
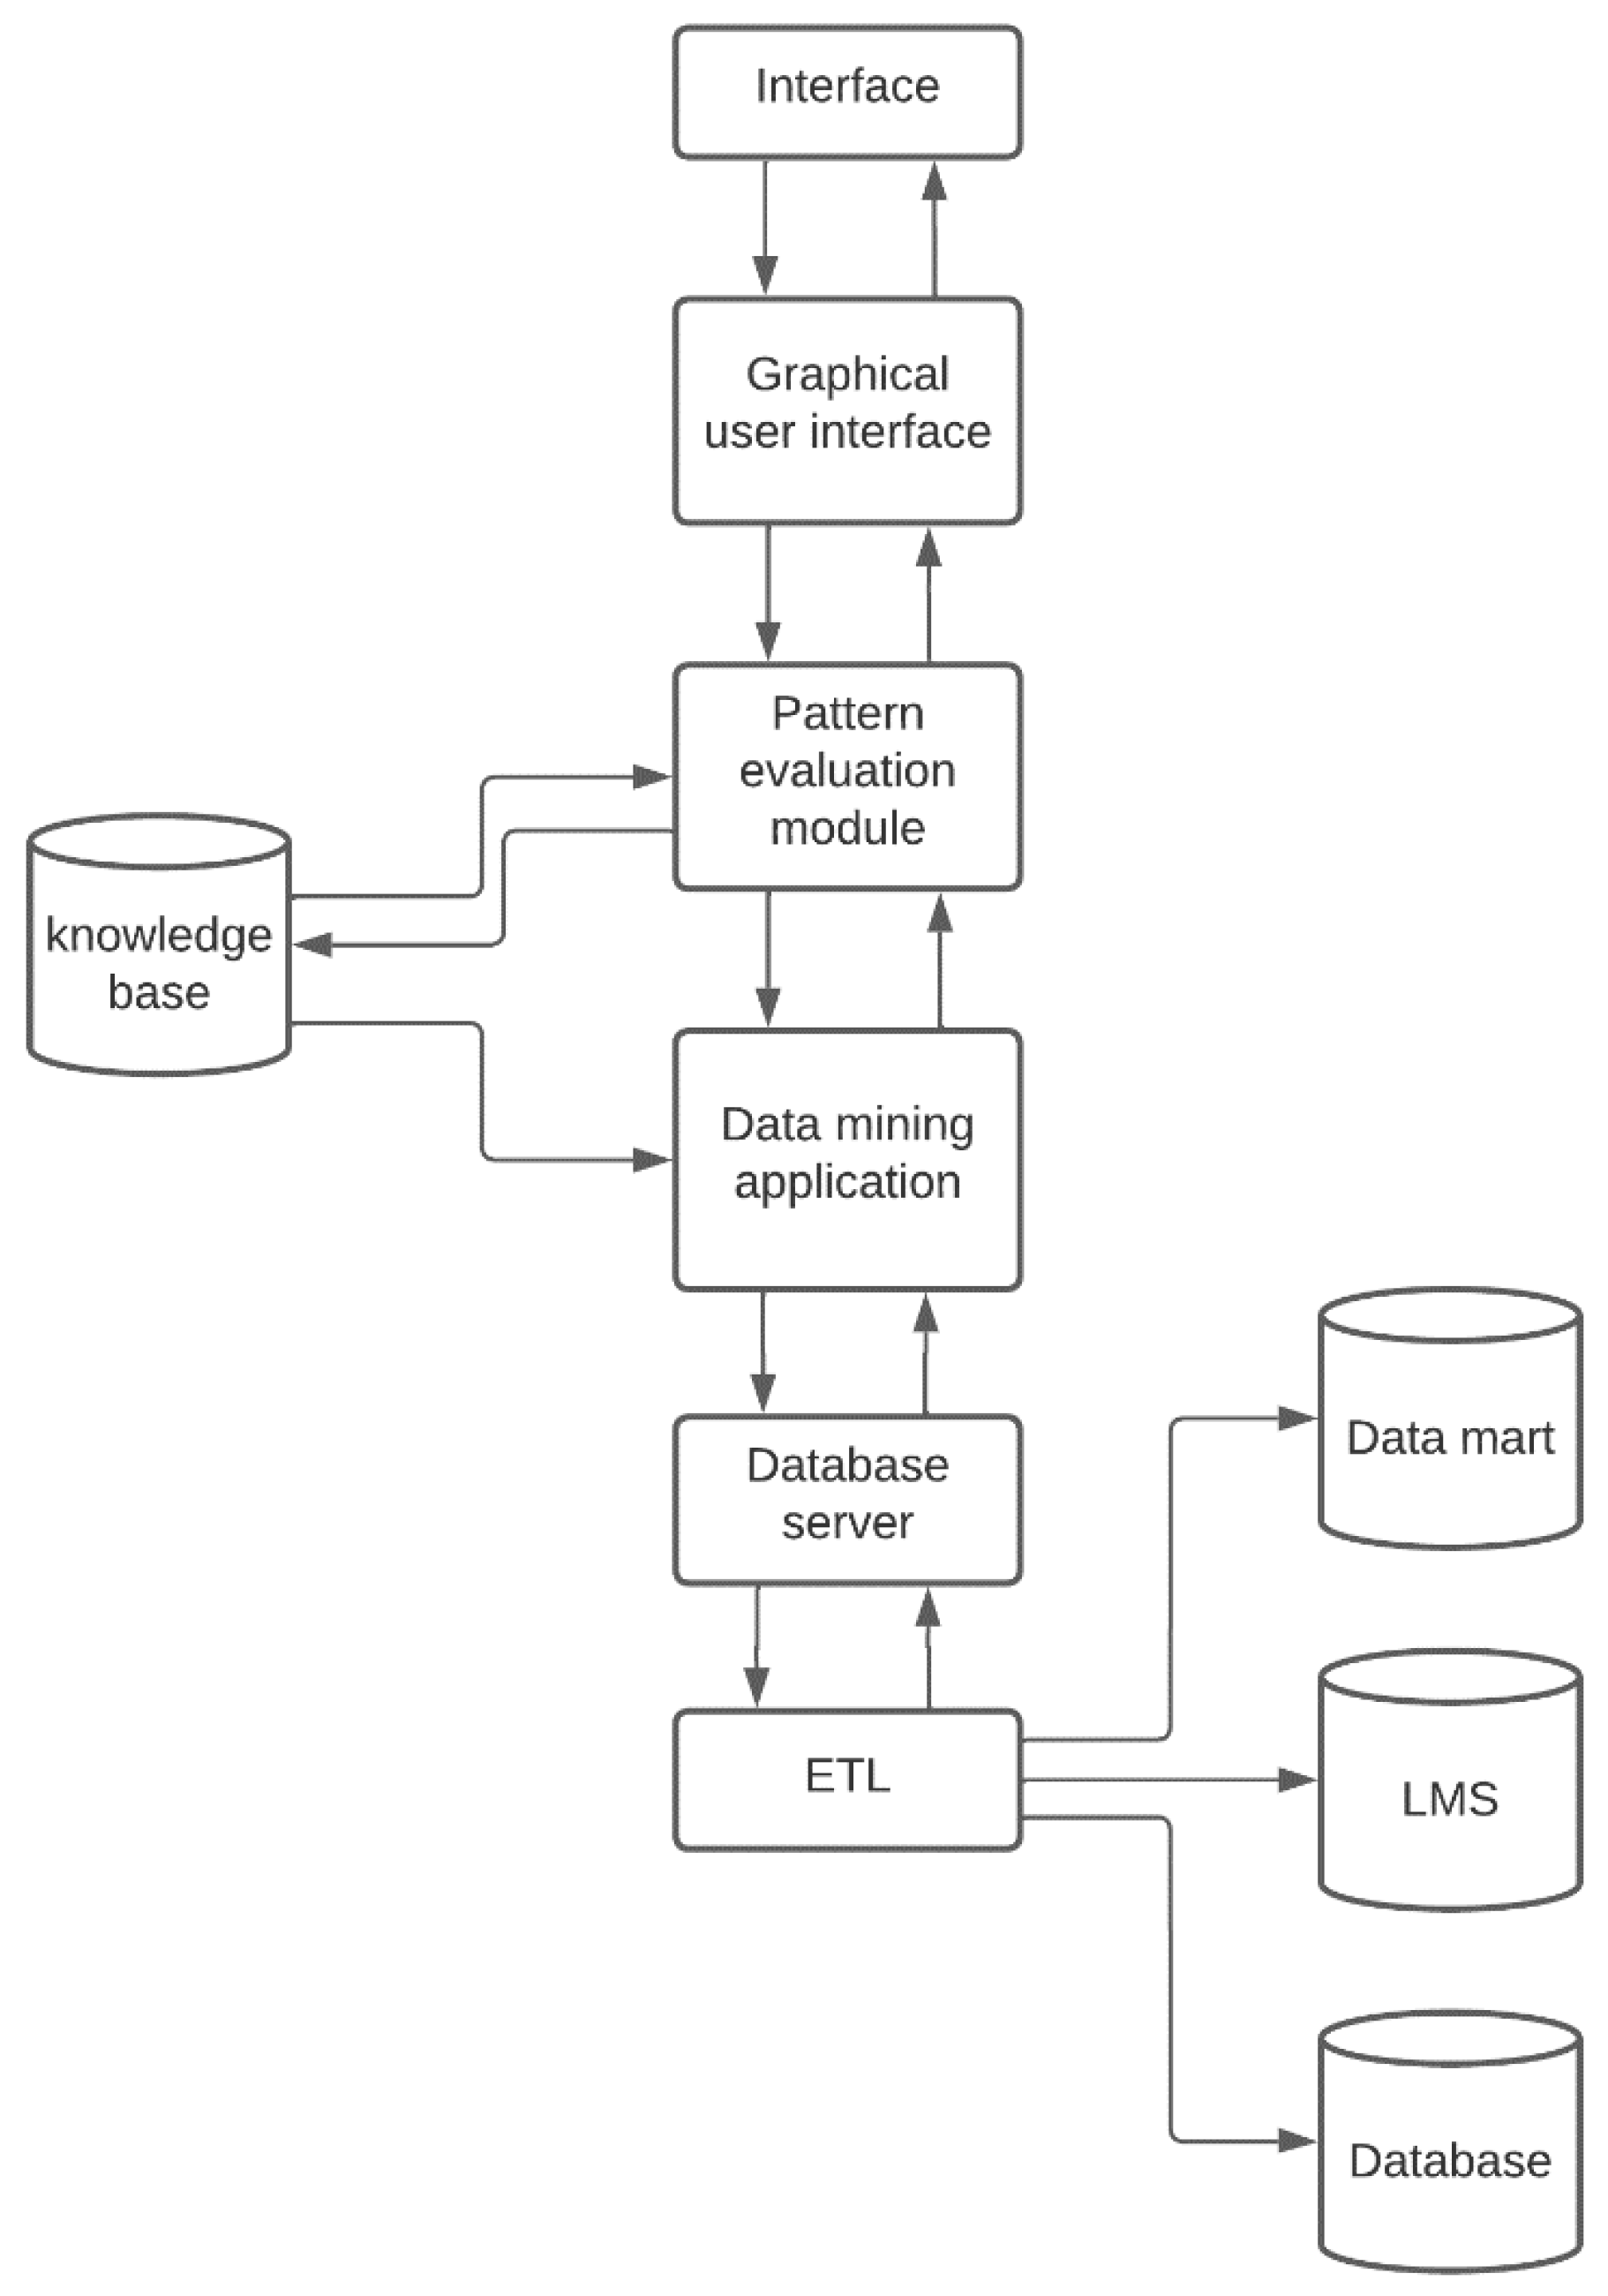
Figure 7 presents the data mining architecture applied to the needs of the university that has participated in the study. The process begins when there is a data mining request from a user. Requests are sent to the data mining engine, where existing patterns in the data are identified and evaluated. The implemented data mining algorithms and applications try to find the solution to the query by using the existing database. If there is no solution, an extraction, transformation, and loading (ETL) process is started from the different data sources available in the database. The extracted metadata is sent to the data mining engine for pattern analysis and evaluation in order to determine the solution to the initiated request. The results are understandably sent to the user interface through dashboards.
The choice of a data mining algorithm depends on aspects such as the type of data, the volume, the type of response that is needed, etc. Choosing a suitable algorithm is one of the processes that can be complicated if you don’t have the right information. However, there are similar works that have defined the algorithms and the use for which each of them is suitable. This information is presented in
Table 4. Based on this information, several algorithms are applied to the academic data to determine which of these respond to the needs of the analysis.
3.1.6. Prediction
This phase makes use of predictive analytics, which is the process of using data analytics to make predictions based on existing data on the academic activities performed by students. The data is extracted from the LMS as well as from surveys integrated into the platform, where information is sought on the financial situation and the usefulness of academic resources. For the process, various statistical techniques are used to create an analysis model of academic events. The algorithms used belong to tools such as SQL and WEKA, and the fundamental objective is to obtain the results and evaluate the analysis process and the implemented architecture. The data included in the analysis correspond to 329 students. In
Table 5, the first 10 records of the database are presented. This table presents a sample of the data and how it is extracted from the surveys and different sources considered in the analysis. The purpose of this table is to provide an example of the format and fields to consider for replicating the method. Letters have been added to each of the columns to identify each factor considered and its equivalent is as follows:
A = Student: student identifier
B = Prob finan: financial problems presented by the student
C = Frequency in the study: time spent using the LMS for learning
D = Frequency in academic activities: time spent to develop activities
E = Frequency at work: time that the student dedicates to his work activities
F = Environment: environment where student learning takes place
G = Educational resources: educational resources included by the teacher and university
H = Interaction: value assigned by the student to the quality interaction with the teacher
I = Schedules: value assigned to study hours
J = Pedagogy: pedagogy and methodology used by the teacher
K = Average: grade point average for each student
L = Learning: evaluates the level of learning presented by students through compliance with learning outcomes in the LMS
All values except the academic average and income level have been obtained through surveys and transformed to a scale from zero to five, considering 1 as the lowest value that can be assigned to each criterion. The academic average is evaluated out of 10 according to the university’s policy; however, it has been transformed on a scale of 1 to 5. In addition, the economic factor is included as low = 1, medium = 2, and high = 3.
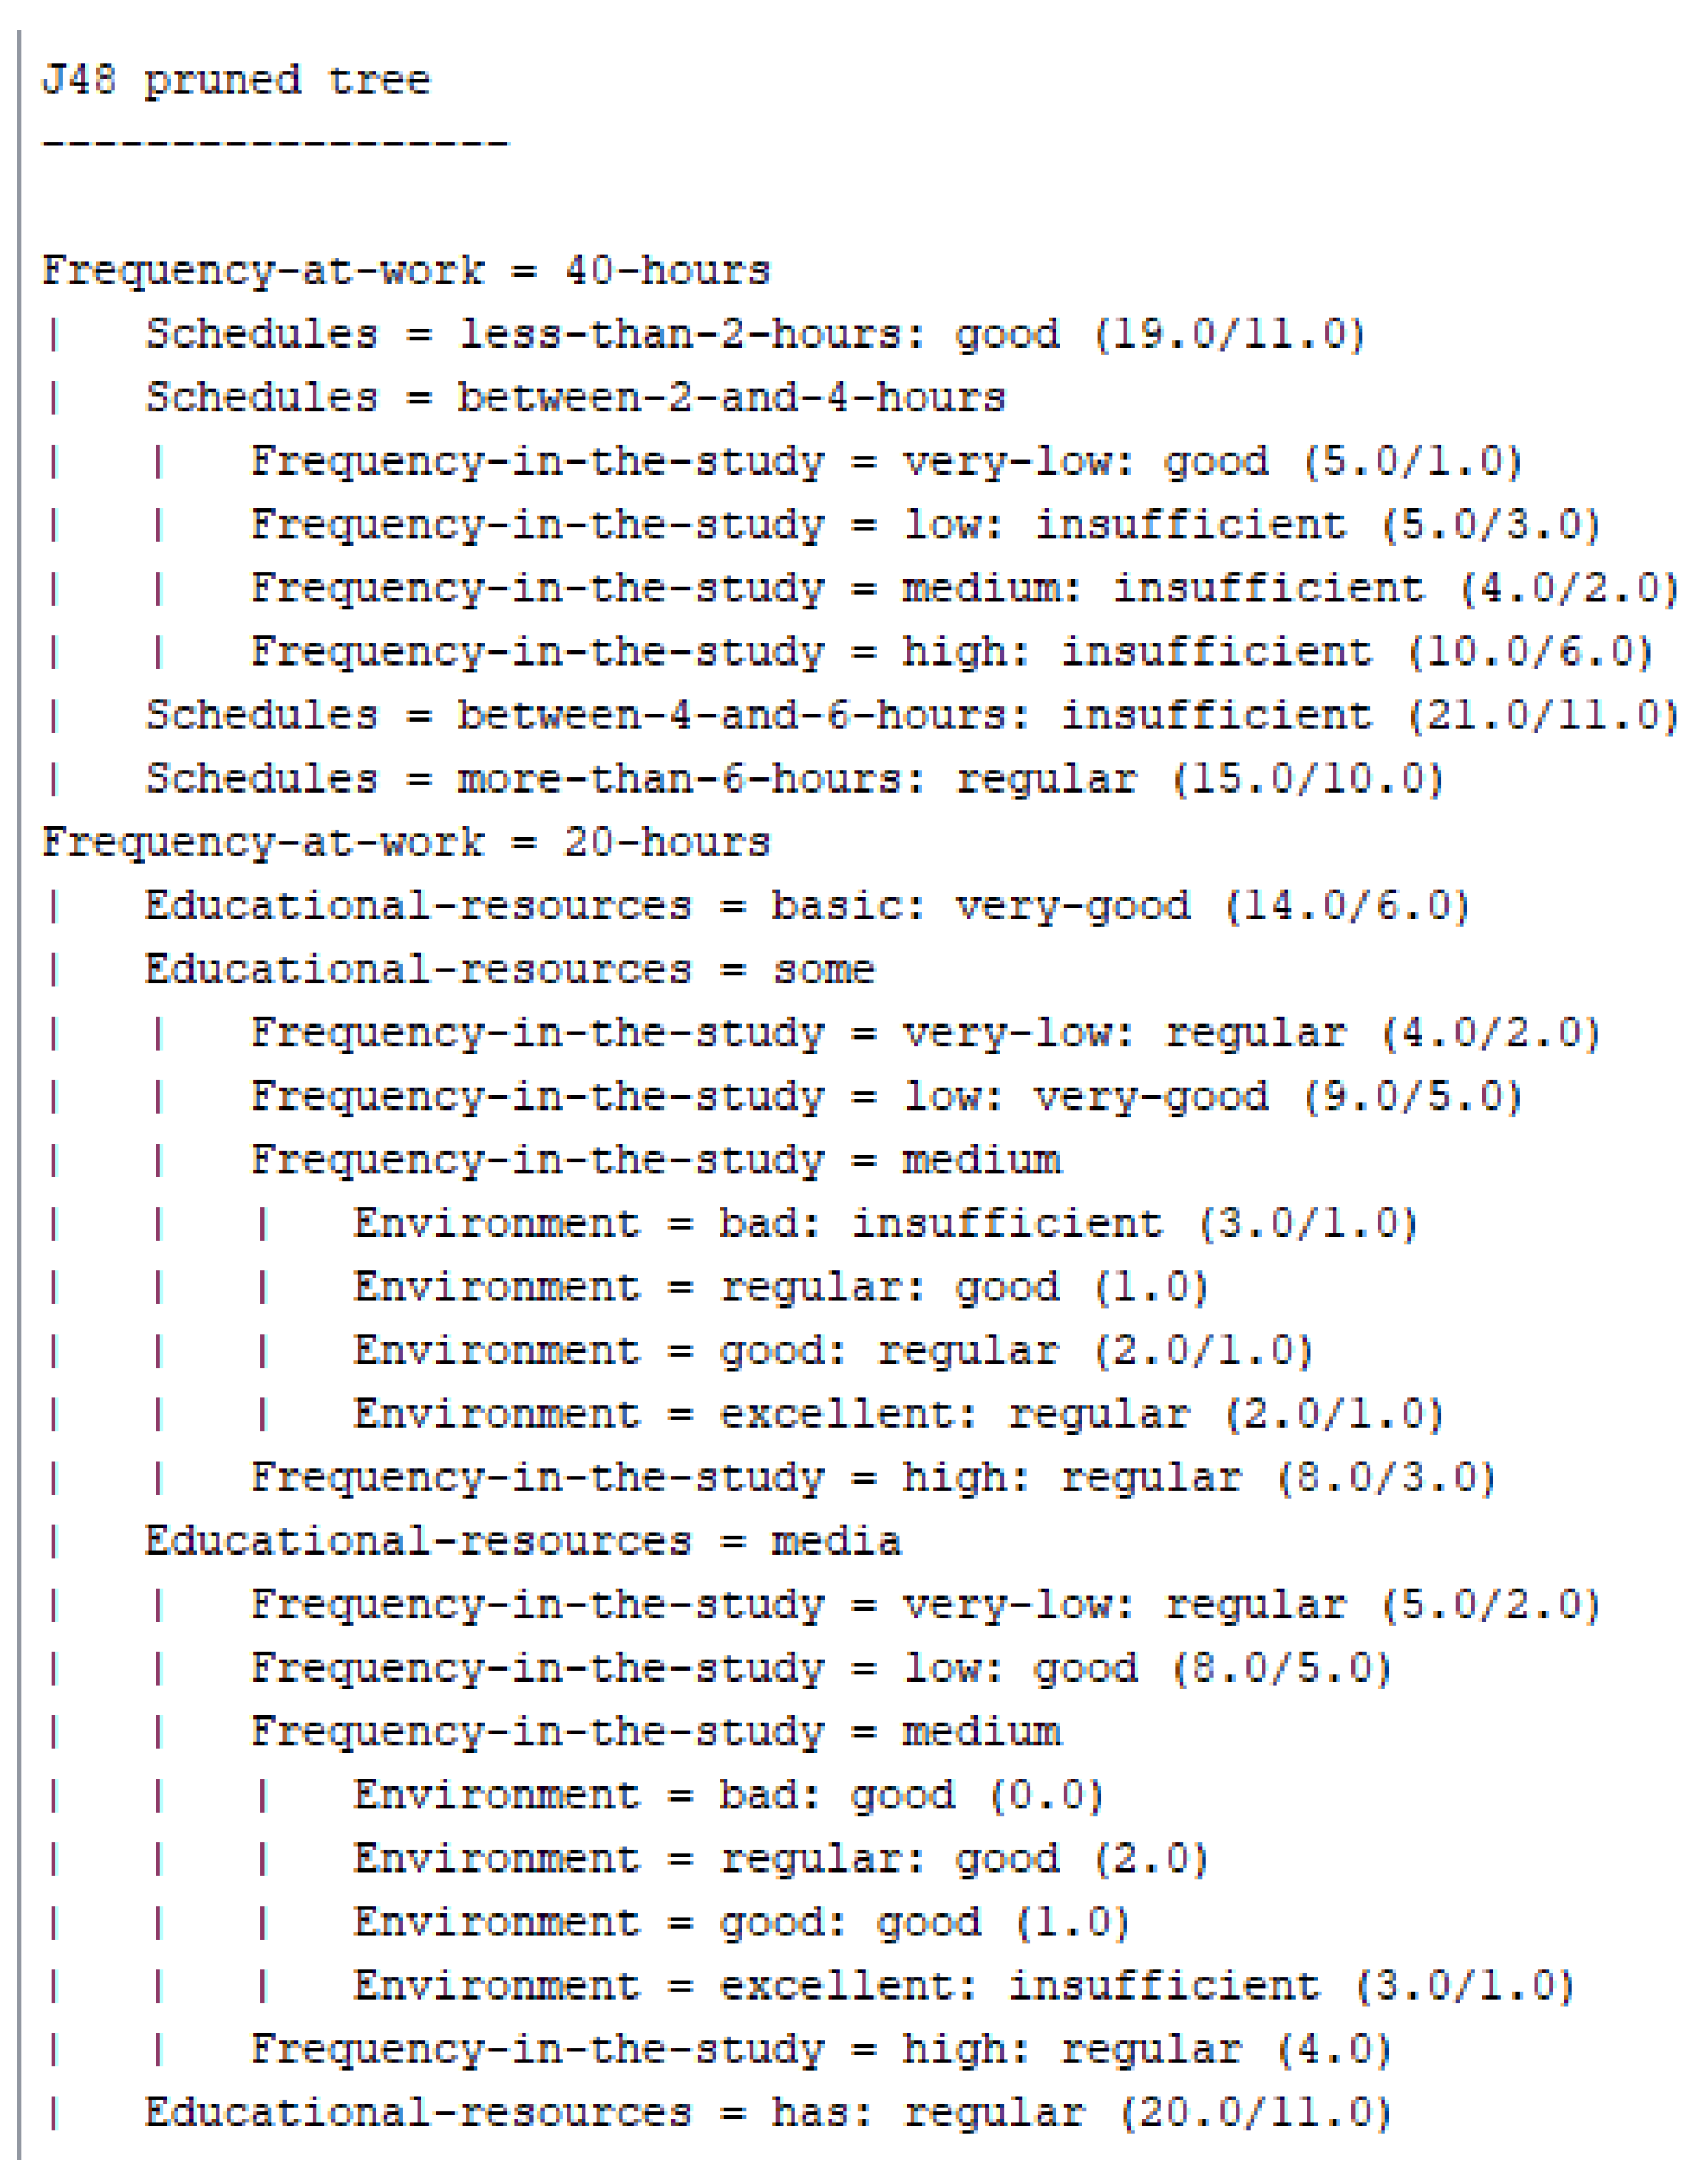
The data to be processed goes to a .arff file, which is to use in WEKA. Once the process has started, a tree algorithm is applied to determine the factors that have the greatest impact on learning.
Figure 8 shows a part of the generated tree, which is made up of 58 levels with a size of 77. In the figure, the levels are presented when it is equal to 40 h of work and 20 h of work for the student. The tree in the analysis takes the frequency of work that students have as the most important factor. A student who works full time (40 h per week) will have a greater inconvenience to achieve a higher level of learning.
Table 6 shows the stratified cross-validation, where the total number of instances is 329, which corresponds to the number of records entered in the study. Of these, 175 interactions are classified as correct with a validity percentage of 52.2%. This value is less than 80%, being an indicator that establishes that the process is not valid enough with 46.8% of instances classified as erroneous. Similarly, the figure details the values of different variables such as Kappa, which is a value of 0.38. This is a value far from 1, so it is considered that there is no strong agreement between the evaluations made by the algorithm.
Since the algorithm used was not sufficiently apt to detect the validity of the processing, it is necessary to use other data mining techniques. In the first instance, it had been declared that the use of the J48 algorithm would be sufficient. The text is maintained, but a complementary phase was applied to generate greater validity to the study. The next applied algorithm is “NaveBayes”, which is an algorithm that, according to the algorithm usage table, is marked as one that can be used under the same consideration as a decision tree. The results are presented in
Table 7, these being even lower than in the case of the application of the decision tree. The statistical value of Kappa is 0.12; therefore, the results are discarded, and a new algorithm is used.
Table 8 presents the results of applying the RandomForest algorithm to the data. For the training of this algorithm, all the records of the data set have been used. According to the results, this algorithm has 27.67% of instances classified as correct. The Kappa statistic is 0.034, which is marked as an invalid result for data mining processing.
Table 9 presents the results of applying the SMO-SVO algorithm to the data. For the training of this algorithm, all the records of the data set have been used. According to the results, this algorithm has 24.31% of instances classified as correct, which defines its training and results as invalid. The statistical value of Kappa is 0.01 which is marked as a poor result for data mining processing; however, other algorithms have been applied that have higher effectiveness.
Table 10 presents the results of applying the multilayer perceptron algorithm to the data. For the training of this algorithm, all the dataset records have been used. According to the results, this algorithm has a better percentage of instances classified as correct with 76.6%, which defines its training and results as valid. The statistical value of Kappa is 0.69, which is marked as a valid result for data mining processing.
The next phase of data mining is to generate the data cluster for which the SimpleKMeans algorithm is applied. In
Table 11, the results obtained are presented, where three clusters are generated. The first and third evaluate the data when the students reach a very good level of learning, and the second cluster evaluates the data when the students reach a level of learning regularly. In each cluster, the existing relationships in each factor are indicated, as well as how these determine the level of learning achieved by the students.
For the analysis, it is important to identify the factors that have the greatest impact on learning and present them to those in charge of academic monitoring. To determine these factors, the tree generated by the J48 algorithm is verified, where learning marked as A, B, and C are considered levels where the student generates knowledge. In processing, the following factors with greater influence on learning are identified:
Frequency in the study
Educational resources
Frequency at work
Environment
Schedules
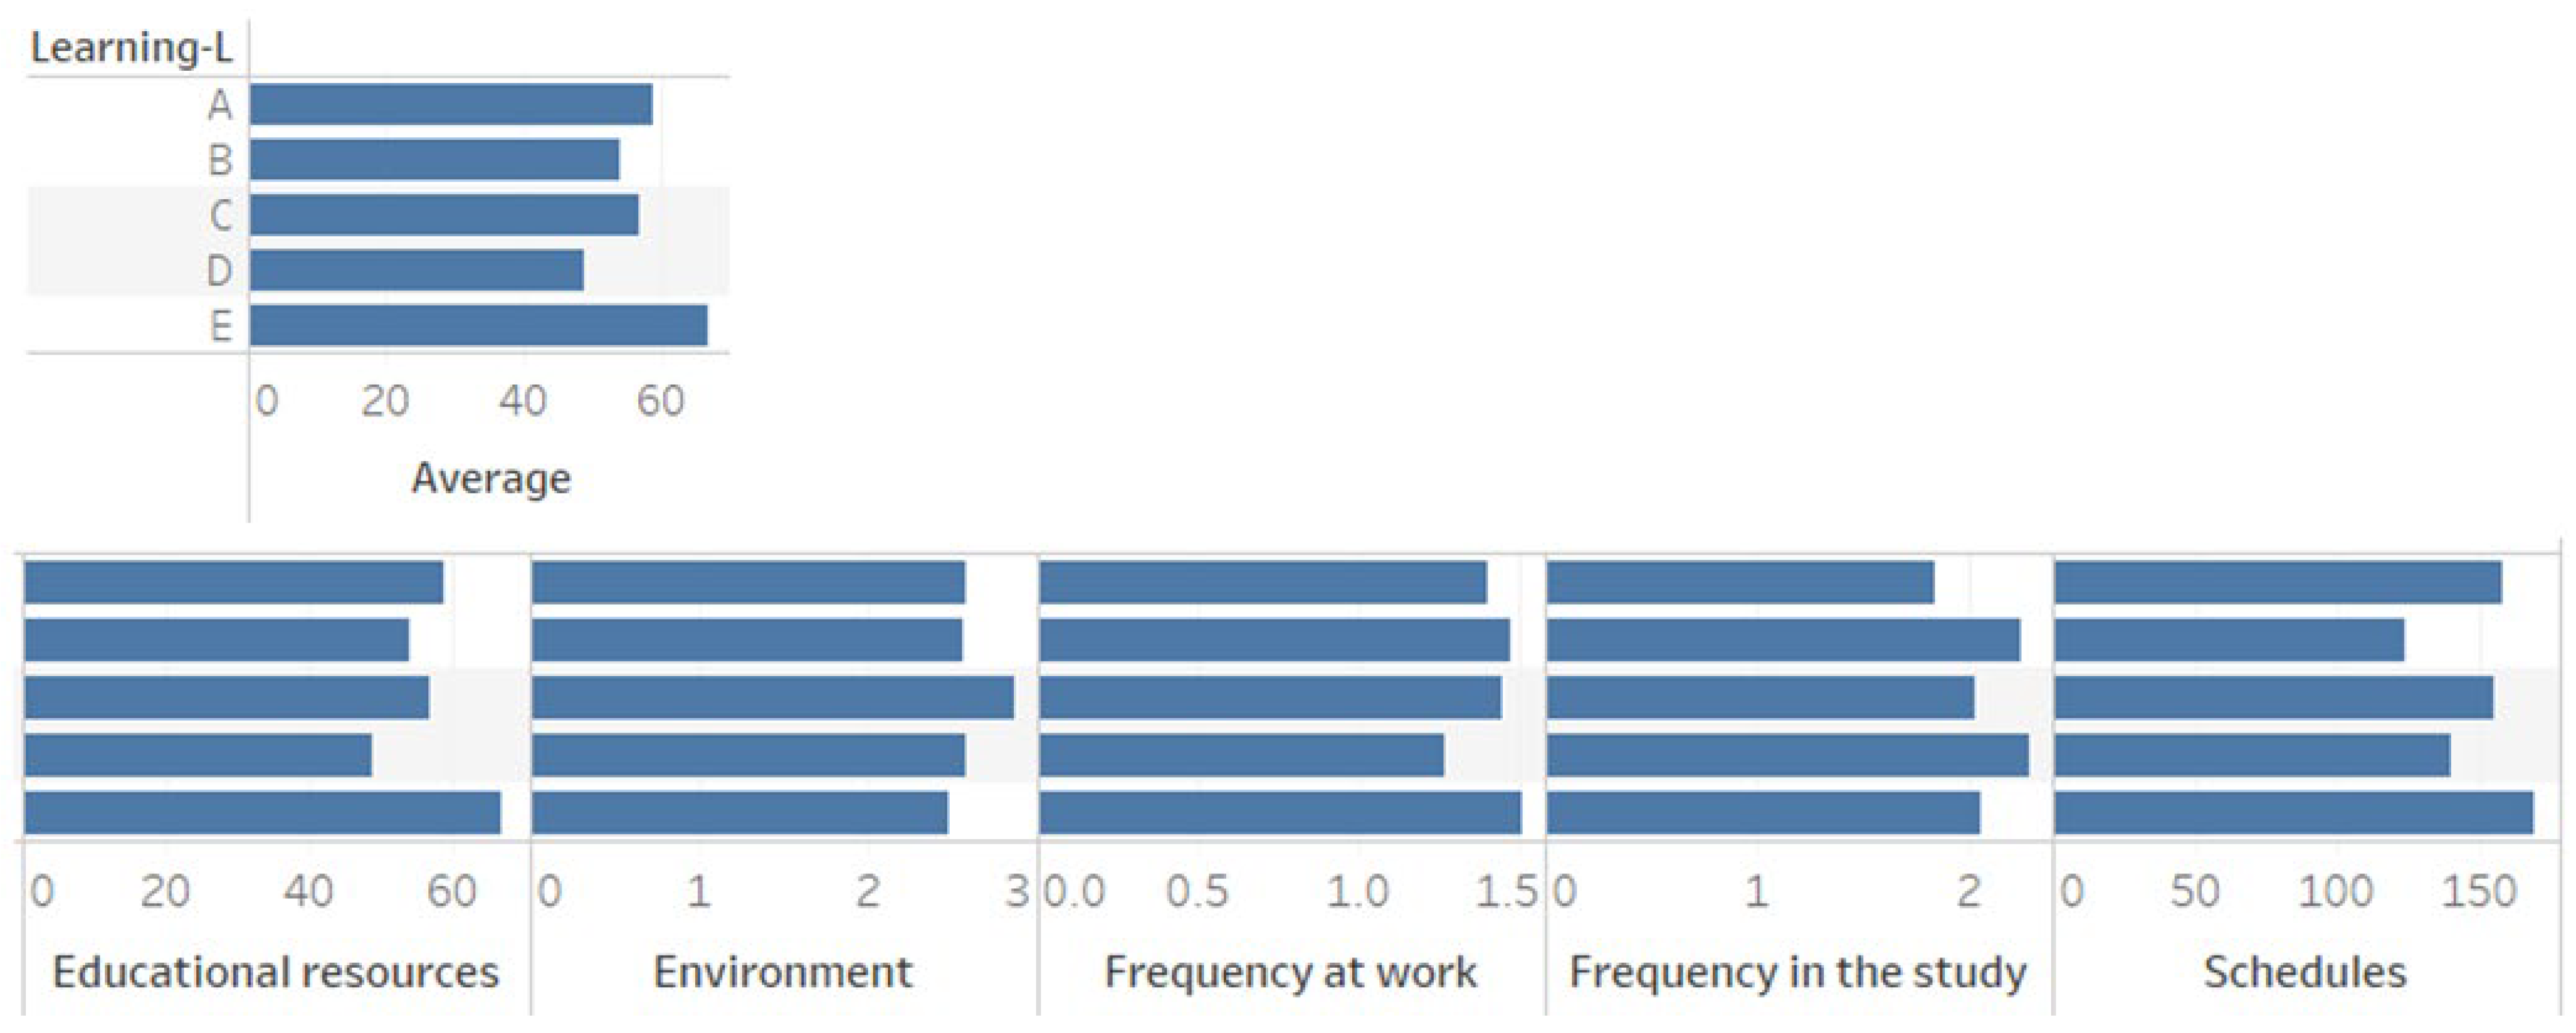
Figure 9 processes these, and they are presented in six groups. The first refers to the level of learning, the second to academic resources, the third to the learning environment (technology, availability, place), the fourth to the frequency of student work, the fifth to the frequency of study, and the sixth to the student’s class schedules and available time. Each group consists of five indicators on the “y” axis. These indicators group the students who have obtained or given an assigned importance value as follows:
A = 5
B = 4
C = 3
D = 2
E = 1
The value of five means that the student has obtained the maximum value in the average, the frequency of study, resources, etc. In the graph of the results of the academic average, the factor has been directly related to the learning of this value depending on whether the student passes or fails a subject. Of the 329 students, 54 obtained an “A” average; that is, they passed their subjects without any problem. If we compare this with each of the factors included in the analysis, it is observed that the frequency of study has a value higher than the mean of all the values. This undoubtedly has a logical relationship; for example, a student who dedicates adequate time to his studies will obtain excellent results in terms of learning. On the other hand, if we analyze the end of the academic average graph, the students with poor performance are 67 students who, about the frequency of study, have a low value in the criteria. To continue with the analysis, the status of the students who have been classified in the “E” indicator, which represents a group with learning problems, is taken as a reference. Regarding academic resources, students indicate that they are not clear enough or aligned with hybrid education [
37,
38]. Group “E” assigns the lowest value to the schedules. In detail, this implies that the development of the activities proposed in the subjects takes the students too much time. This is due to the little interaction that exists with the teachers, which creates an alarm for teachers and managers of academic quality. Therefore, the first evaluation and update must be developed at the level of resources and learning activities. It is necessary to mention that the resources used by most teachers have been updated or adapted from the face-to-face modality. Therefore, the results obtained are presented as a fundamental guide of the processes and resources that must be considered as main in the change of modality.
4. Discussion
In the proposed work, an approach based on educational data mining is used to analyze the data that reflects the behavior of students and identify patterns of interaction with the different categories or factors proposed as lines of study. To meet this objective, we have worked on obtaining data through surveys and sources such as LMS or systems of the university that has participated in this study. This coincides with works such as, which suggest using data mining data on student behavior and how this can benefit education, especially by revealing, mapping, and monitoring the factors that influence learning.
Several studies that have worked in educational data analysis, among which can be highlighted, give relevance to the analysis of the grouping technique to identify the learning profiles existing in each population. Among the techniques used are neural networks and K mens, used with the aim of identifying students at risk of repetition, characterizing student profiles, and applying grouping and prediction algorithms. Other works such as [
39] analyze the learning activities proposed in the LMS to identify compliance patterns and deadlines, with the aim of making effective decisions and avoiding student failure.
According to the results obtained, this work differs by integrating data that is collected from the feeling that students have about the study categories. These have been determined by the study population; therefore, the validity of collecting data through surveys has a more significant impact compared to the analysis of traditional sources. The proposed method integrates several phases that, unlike other works, focus on methodologies such as KDD, which are widely used by business intelligence. For its part, this method integrates several phases where it focuses on determining the interest of students and teachers. With this information, it executes various data mining techniques that allow for identifying the attributes that have the greatest influence on learning.
This work presents a fundamental basis for the development of the identification of the attributes that affect a hybrid education model. To do so, a review of the most representative works that study this phenomenon has been carried out and the information found is used to move from attributes to dimensions, where each of them is evaluated or acquires information on the sentiment of individuals through surveys. This process means that our proposal does not focus on an isolated choice of the authors, but on the contrary, what has been identified in other works is considered fundamental. Once the dimensions have been identified, a mapping of attributes will be generated that has the purpose of generating a quick vision of the incidence that each dimension has in hybrid education according to the feelings of students and teachers. Attribute mapping is represented graphically and allows for the integration or elimination of certain attributes that the population participating in the study considers having a high or low incidence of the study. This work, by establishing several phases, turns the proposal into a modular model that can determine which attribute needs further analysis to determine its validity or incidence. In the same way, the model is capable of filtering unnecessary attributes quickly, preserving the good use of technological and human resources.
However, a designed and executed model must have all the tools that allow it to evaluate and act in real-time on any anomalous event. In response to this need, a tool has been designed that allows managers of educational quality and teachers to obtain constant and precise information about each student. By including learning analytics, it is possible to determine the preferences and difficulties that occur in learning [
27,
40,
41]. The BI-based model makes the system modular and scalable with the ability to aggregate multiple data sources, improving understanding of the state of learning and the factors that influence it. Taking advantage of BI methodologies in the educational environment facilitates the delivery of reports and the creation of new knowledge with greater ease. Even the generation of notifications and early warnings becomes the ideal aid for students and teachers, helping to improve learning and design personalized education.
By having a data analysis model like the one proposed, an environment adjustable to the needs of the data is created. Regarding other works, it is important to highlight that in this proposal, an integral process is considered, which includes the identification of the different data sources and the creation of multidimensional databases to the application of data mining algorithms that allow students to be profiled according to their needs. In addition, this work focuses on the acquisition of unstructured data through surveys, which allows for the capturing of the feelings of students regarding the use of technologies in the classroom, and through this model, educational environments are improved.
In educational models, the learning components depend on how they are executed. Therefore, the components in a face-to-face model are very different from those used in an online modality. In attendance, the education model can be executed with the assistance of general academic resources, such as the study plan or strategic planning. The components of hard skills are part of the teacher and are transmitted through the teaching methodology that he uses, as well as his experience. In the online modality, there are other components on which its execution is based, and it depends on the use of ICTs. For example, in this modality, it is specified that a certain percentage of activities are developed in class and others autonomously, giving greater impetus to innovation and research. In this modality, the student has greater responsibility for his learning. Therefore, the academic resources have an approach aligned with learning strategies, such as the active learning model, project-based learning, the flipped classroom, etc.
5. Conclusions
Universities are considered the main sources of innovation for society. In addition, the pandemic has forced these institutions to give greater emphasis to new models and techniques that allow for improving the activities of people and organizations, for which they saw the inclusion of ICTs in all processes of an organization as fundamental. In this work, the authors focus on learning management and its quality through the integration of data analysis techniques and models. This proposal has been applied in a hybrid education model that can be replicated in other educational models to help the areas and individuals involved in learning.
In this work, it has been proposed to determine the factors that influence learning in a hybrid modality, where the methodology of face-to-face education is maintained in a remote educational model and the teacher has taken a back seat in student learning. Currently, in the hybrid education model, a student can use the characteristics of face-to-face or online education to establish their way of generating knowledge. Under this concept, the hybrid modality requires the integration of ICTs, complemented by an update of the educational method. The university that has participated in this study has updated the syllabi of the subjects to establish activities that are suitable both for students who attend in person and for students who connect online. In academic planning, it has been necessary to establish dates and groups of students where it is required to develop different laboratories in person in such a way that student learning is guaranteed. Other measures that have been taken are the acquisition of various computer platforms that guarantee communication with students and that can generate reports on the effective use of these tools. The use of reports helps academic monitoring departments and the teacher himself to determine the effectiveness of student performance. With this description of the environment where the method is applied, each of its phases is implemented to determine if universities, teachers, students, and technology can carry out a hybrid education model without affecting learning.
The results obtained have allowed the quality managers and teachers of the university that has participated in this study to identify the factors that affect learning and take action so that the change between modalities is optimal and aligned with the needs of the students. Currently, several works make a significant contribution to the curricular part of each educational model. The proposals and research carried out embrace new methods in the classroom, such as project-based learning, flipped classroom, cooperative learning, gamification, etc. However, these methodologies, which are excellent at the learning level, have been applied more frequently in online educational models. Their effectiveness has been proven in these models and all students are aligned and included under the same methodology. There are even universities that have applied these methodologies in their face-to-face academic models. It is in this aspect that our work interprets the first and most important difference, since we work from a point in which the hybrid modality is a new educational model that is based on face-to-face and online modalities, but has its features and resources.
By performing the data analysis, we can cross as much information as necessary to answer the different questions that the academic areas of the university have. The scalability of a data mart allows you to move from one educational model to another, preserving academic quality. In an environment where education is developed in a hybrid way, it is necessary to have the necessary tools to detect any eventuality that influences student learning. Even this architecture must be projected to the possible variations of the environment where education is carried out and adjusts to new needs. The analysis of educational data provides an overview of the behavior of a group of students; the depth levels depend on the independent variables and their percentage of influence. In future work, the integration of an activity recommendation system in the BI is proposed in order to create an autonomous system that can make decisions.


