Article

Performance of a Live Multi-Gateway LoRaWAN and Interference Measurement across Indoor and Outdoor Localities

1
School of Computing, Engineering and Built Environment, Glasgow Caledonian University, Glasgow G40BA, UK
2
School of Engineering and Built Environment, Nathan Campus, Griffith University, 170 Kessels Road, Brisbane, QLD 4111, Australia
*
Authors to whom correspondence should be addressed.
Computers 2022, 11(2), 25; https://doi.org/10.3390/computers11020025
Submission received: 13 October 2021 / Revised: 23 November 2021 / Accepted: 6 December 2021 / Published: 11 February 2022
(This article belongs to the Special Issue Edge Computing for the IoT)

Abstract

:
Little work has been reported on the magnitude and impact of interference with the performance of Internet of Things (IoT) applications operated by Long-Range Wide-Area Network (LoRaWAN) in the unlicensed 868 MHz Industrial, Scientific, and Medical (ISM) band. The propagation performance and signal activity measurement of such technologies can give many insights to effectively build long-range wireless communications in a Non-Line of Sight (NLOS) environment. In this paper, the performance of a live multi-gateway in indoor office site in Glasgow city was analysed in 26 days of traffic measurement. The indoor network performances were compared to similar performance measurements from outdoor LoRaWAN test traffic generated across Glasgow Central Business District (CBD) and elsewhere on the same LoRaWAN. The results revealed 99.95% packet transfer success on the first attempt in the indoor site compared to 95.7% at the external site. The analysis shows that interference is attributed to nearly 50 X greater LoRaWAN outdoor packet loss than indoor. The interference measurement results showed a 13.2–97.3% and 4.8–54% probability of interfering signals, respectively, in the mandatory Long-Range (LoRa) uplink and downlink channels, capable of limiting LoRa coverage in some areas.

Graphical Abstract

1. Introduction

Long-Range Wide-Area Network (LoRaWAN) technology [1] is one of several recently developed Low-Power Wide-Area Network (LPWAN) technologies competing for market and mind-share in the Internet of Things (IoT) space. It is a low-power bidirectional wireless standard that operates in different unlicensed Radio Frequency (RF) bands. It has a range, depending on propagation conditions, of up to tens-of-kilometers. For instance, authors in [2] reported the reception of more than 60% of LoRaWAN packets on water. The clear line-of-sight (LoS) and absence of interference from other radio systems are attributed to successful LoRaWAN packet reception. In one unusual case, an experimenter with a 14 dBm 868 MHz Long Range (LoRa) received the LoRaWAN packets at 702 km distance [3,4] in the atmosphere, which is expected due to lack of obstructions and interfering radio systems. However, in Non-Line-of-Sight (NLoS) and other interfering radio systems, the more likely scenario is 2 to 15 km [5,6,7,8,9] depending on the environment. LoRaWAN has several operating models, including a purely private network, a carrier-based approach where customers can connect devices to an existing network for a fee, and an open-source model [10] where users connect LoRaWAN gateways via a shared network and then any registered user has access to any LoRaWAN gateway.
LoRaWAN has different ownership models [11,12] the long-range low-power operation, and operational modes, including availability of acknowledgements, bidirectional data, and a multicast mode. These features earn LoRaWAN a wider public appeal than technologies such as Sigfox [13]. Sigfox operates in the same spectrum like LoRa. Unlike LoRaWAN, Sigfox is a subscription-only service with a limited number uplinks and a more limited number of downlink packets determined by subscription level. In addition, Sigfox supports much lower data rate applications.
The recency of the developments of IoT applications and the release of LoRa and LoRaWAN technology has led to a scarcity of information regarding its performance and co-existence with other technologies operating in the European Union (EU) 868 Industrial, Scientific, and Medical (ISM) band [14]. Additionally, few studies have analysed the performance of LoRaWAN multi-gateway deployment in a real-world scenario.
Radio transmission density in the unlicensed ISM 868 MHz band is expected to surge as the deployment of LPWAN technologies is becoming omnipresent in communities. As these transmissions increase, a failure to comply with regulations is imminent because of increasing devices contesting for a small frequency band. The model in [15] predicted 15% and 10% probabilities of the Duty Cycle (DC) of 1% being violated for Sigfox and LoRa in indoor for 10 devices, respectively. These predictions slightly agree with indoor measurements in this study where interference did not cause the Signal-to-Noise Ratio (SNR) to unacceptable power levels.
Non-compliance with regulation risks the IoT infrastructure operating in the unlicensed 868 MHz ISM band into the “Interference of Things” instead of the IoT. For example, authors in [16] based on measurement results in Belgium (2017) asserted that due to large-scale interference, there was a strong potential for performance degradation in the future, making the long-range sub-GHz technologies a victim of their success, thus unusable. Moreover, a study of interference [17] in the EU’s 868 MHz ISM band measured signal activity and power levels with a focus on LoRa and Sigfox in the city of Aalborg, Denmark, in 2017 revealed interference increase in the unlicensed ISM 868 MHz band. Measurement results put the probability of interference at 33.7% in the shopping area for LoRa core uplink channels and at 58.2% in the business park for LoRa downlink channels. These measurement results were recorded four years ago and must be different from the recent situation due to rapid deployment of IoT applications.
As the deployment of LoRa Sub-GHz technologies and LPWAN Short-Range Devices (SRD) is rapidly growing, there is little knowledge of interference in the unlicensed 868 MHz ISM band and its signal degradation effect on urban LoRa transmissions. In particular, the number of LoRa end-devices is steadily growing [18], making LoRa-based transmissions subject to interference despite the presence of DC and maximum transmission power (Tx) regulatory regime. With this in mind, the probability that the presence of interference degrades signal-to-interference ratio of LoRa transmission, resulting in a loss of communication in Glasgow CBD, is important to determine.
This paper investigates performance of a live LoRaWAN network over multiple gateways at multiple sites carrying live traffic. It builds on an earlier analysis of LoRa range and LoRaWAN networking reported in [19], which fell short of interference analysis on the performance of performance. Additionally, the paper investigates presence of interference in the 868 MHz ISM band in Glasgow CBD and degradation effects on LoRa transmissions. The interference study in the 868 MHz ISM band comes after it emerged that LoRaWAN outdoor packet losses measured from Glasgow CBD were 50 X greater than the indoor measurement test results. The SNR levels recorded in the Glasgow CBD environment were attributed to possible interference from other sources, including ISM band technologies working in the same band and other LoRaWAN installations. Hence,the establishment of an understanding of interference in the 868 MHz ISM band and whether the behavior of signals occupying LoRa core uplink channels, 868.1 MHz, 868.3 MHz, and 868.5 MHz, and the downlink channels, 869.4–869.65 MHz may have had degradation effects on LoRaWAN packet losses in Glasgow CBD enhances the present knowledge of the LoRaWAN transmission environment.
The contributions of this work are four folds:
  • The performance analysis of a live LoRaWAN multi-gateway in an indoor site.
  • The comparative performance analysis of LoRaWAN packet losses for indoor and outdoor measurements results.
  • Measurements of signal activity and power levels in the 868 MHz ISM band in five different locations in Glasgow CBD.
  • An analysis of the measurement results to determine the extent which interference in Glasgow CBD is likely to prevent LoRa communication.
The rest of paper is organised as follows: The related work in Section 1, a brief introduction to LoRaWAN operation is specified in Section 2, followed by the description methodology in Section 3. Section 4 presents results and measurements analysis. The discussion follows this section in Section 5 and the conclusion and future work in Section 6.

2. Related Work

An analysis of low-throughput networks [20] briefly analysed several technologies, including LoRaWAN, while [21] performed a comparison of LoRaWAN with RF mesh. These studies identify advanced modulation techniques as an effective measure to counter interference in LoRaWAN networks. However, Chirp Spread Spectrum (CSS) modulation technology [22] employed in LoRa has not entirely suppressed interference in LoRaWAN. A more in-depth theoretical analysis of the scalability of LoRaWAN was developed in [23] with [24] analysing the performance of the LoRaWAN ‘Join’ and observed a small probability of interference in the presence of a large number of uplink transmissions. The ‘Join’ is the process where authorised devices, hereafter referred to as ‘motes’, come online on the network and where the mote and network generate encryption keys. An indoor deployment case study [25] conducted with a single gateway and a single mote showed that SNR values plummeted when an end-device was moved from the floor to basement. In [26], the authors investigated the performance of LoRaWAN for indoor industrial monitoring as an application of the Industrial Internet of Things (IIoT). These authors compared the performance of LoRaWAN with IEEE 802.15.4 network protocol. LoRaWAN demonstrated good performance in terms of reliability and power consumption. In [27], authors evaluated the performance of LoRa for indoor IoT applications and concluded that for a closer distance to the gateway, a low Spreading Factor (SF) should be selected and high SF selected for a longer distances. Similarly, LoRa performance indoor environment was evaluated in [28]. The study results found packet delivery success rate at 96.7% but did not indicate reasons attributed to lost packets. A smart controller for heating ventilation and air conditioning using LoRa was developed in [29]. Authors considered reduction of human interference such as clothing insulation and air velocity in indoor propagation environment. Such interference sources were not necessary in this study because no humans lived in the building site.
LoRa performance was compared with RSD RF communication [30], and results showed that LoRa outperforms short-range RF communication in terms of battery life and coverage range. In [31], the authors investigated the performance of LoRaWAN in the CBD of Melbourne, Australia, and reported that loss-free communication is limited to 200 m. Although interference from other radio channels is mentioned as one of the variables that affect LoRaWAN performance in a CBD, the study was limited to LoRaWAN performance evaluation in a high-density urban structures. In [2], authors evaluated the performance of LoRa in the outdoor environment.
A recent study [17] focusing on LoRa and Sigfox in the city of Aalborg, Denmark, measured signal activity and power levels in the EU’s 868 MHz ISM band. The activity of signals was measured and reported by the use of network scanner and spectrogram, respectively, for five distinct locations. The authors determined whether there was any interference in the measurement area and calculated interference probabilities for selected channels. However, the network scanner used to record the measurements could not capture real-time transient signals.
The signal activity in the 868 MHz ISM band is different in parts of the world. The European Radiocommunications Committee (ERC) Recommendation 70-30 relating to the use of SRD [32], and Ofcom Interface Requirements 2030 (IR-2030) [33] specify the regulatory parameters; the DC, Tx, and usage of the ISM band in Europe and the United Kingdom (UK) respectively. The DC is maybe 0.1%, or 1% [34], and the Tx is 14 dBm for LoRa in the EU. The regulation offers an alternative to DC, the implementation of polite spectrum access techniques, a combination of Listen Before Talk (LBT) and Adaptive Frequency Agility (AFA). Hendrik. L et al. [35] monitored the sub-GHz unlicensed frequency band in a German city. The study measured the spectrum occupancy in the 169 MHz, 433 MHz, and 868 MHz bands. This study utilised measurements to parameterise an interference prediction model. However, the model describes collision probability of LoRaWAN packets in the channel.

3. LORAWAN Operation

LoRaWAN technology consists of the LoRa wireless physical layer and the different protocols and layers that create the Wide Area Network (WAN) functionality.

3.1. LoRa

LoRa, a Chirp Spread Spectrum (CSS) technology [22], can operate in different ISM bands, including bands in the range 136–174 MHz, 433 MHz, 470 MHz, 780 MHz, 868 MHz, 915 MHz, and 920/925 MHz. The operating parameters; frequency, bandwidth, maximum power, and other factors are determined by the regulatory environment of the country of operation. In Europe, the typical operation is the 868 MHz ISM band and can include the frequency band from 863 to 869 MHz. The frequency band may be split into sub-bands and designated for other purposes to allow ‘underlay’ services limited to a Tx of 25 mW (+14 dBm) Effective Isotropic Radiated Power (EIRP) and a DC of 0.1%. The core channels for LoRa operation in EU are 868.1, 868.3, and 868.5 MHz, also limited to 25 mW Tx with a 1% DC limitation.
Several LoRa modulation parameters are adjustable. One of the main parameter is the SF, which is used to trade-off transmission speed for receiver sensitivity. For LoRaWAN 868 MHz operation, there are seven SF used (SF6-SF12). LoRa signals can be modulated with SF7–SF12 [36]. The SFs are orthogonal and allows the concurrent decoding of messages sent on the same channel with a different SF without interference As the higher SF causes a slower transmission, the packet size is reduced to minimise the on-air time and to reduce the chance of packet corruption. To exploit the opportunity of multiple concurrent decodable transmissions, the SX1301 Semtech Base Band Processor emulates 49 LoRa Demodulators [37], and according to the Semtech LoRa FAQ [38], a LoRaWAN gateway utilizing the SX1301 component and operating on eight channels can handle approximately 1.5 million LoRaWAN packets per day.

3.2. Architecture and Operation Modes

The LoRaWAN consists of three key components identified in Figure 1:
  • LoRaWAN motes,
  • LoRaWAN gateway,
  • The LoRaWAN Network Server (NS).
Figure 1. LoRaWAN Topology comprising LoRaWAN motes, Gateways, the Network Server, databases and feeds to data owners.
Computers 11 00025 g001
The LoRaWAN motes comprise the LoRa transceiver and the LoRaWAN stack. Motes have an eight-byte device identifier, and they have different modes of operation consisting of classes [39] A, B, and C.
Class A motes can transmit and then, turn their receiver on at specified time windows to listen for the downlink and acknowledgement (ACK), if they requested an ACK. Typically the mote listens for the downlink and ACK in a window starting one second after completion of the transmission. If the ACK was requested, the ACK would use the same SF as the original message. If the ACK were not received, the mote starts listening in a window that starts two seconds after completing the transmission, and this ACK uses a network-defined fallback SF on a specified channel. If there is a downlink message for the mote, it is sent as part of the ACK packet. Unless there is some form of edge processing, a reply to an uplink message (mote to the network) could not be included in the current ACK (network to mote) since the uplink data needs to be forwarded back to the data owner, but the NS needs to have the appropriate gateway prepare the ACK. For networks with high latency, such as gateways with a satellite backhaul, the network may implement different receive window timing.
Class B motes require gateways that implement Class B operation. The specification requires a Class B gateway to transmit a beacon. The time following the beacon is divided into time slots, and the mote and gateway negotiate a timeslot which the mote will listen for downlink messages. This mode of operation is required for motes that need to listen for messages without enough power budget to listen continuously. Uplink messages and ACKs are handled as for Class A motes.
Class C motes listen continuously except when transmitting. Downlink messages can be sent to Class C motes at any time.
LoRaWAN Gateways comprise a LoRa transceiver chip and a Base Band Processor, enabling the concurrent decoding of multiple channels and SF combinations. The gateway processor accepts the demodulated packet and the meta-data related to the transmission, and together these are forwarded to the NS using a JavaScript Object Notation (JSON) packet transported in a User Datagram Protocol (UDP) [40] packet. Since this is UDP, there is no guarantee that the NS will receive the packet. The actual user data sent by the mote is encrypted in the packet and not readable in transit. Gateways transmit data to motes as per the class of the mote. Therefore, Class A motes receive data within an ACK, Class B motes in an ACK or a designated time slot, and Class C at any time.
Network Server defines a LoRaWAN network. The NS communicates with gateways, identifies if a mote belongs to network, handles the up and downlink traffic, handles keys generation, and decodes user data. The NS manages the separation of motes based on their ownership. The database of the network server maps the mote hardware identifier and application group to the mote current network address. The database can store the encryption keys for communicating with the mote. As an alternate network implementation to that of Figure 1, each application owner has an application server where application keys are generated for motes. In this scenario, the application owner and the network operator are separate and unencrypted data passes from the NS to the application server [41]. The application server then uses the applicable application key to decode the data.

3.3. LoRaWAN Joins and Communications

A LoRaWAN can comprise a handful of sensors and a gateway with an inbuilt NS or tens of millions of motes and thousands of gateways tied together by one NS.
A mote may be pre-joined to a network or need to “join” a network. The joining process [42] requires the mote and the network to share some prior knowledge of each other and share an application key. An application group is defined in the NS database and given an eight-byte identifier. The eight-byte hardware addresses of all motes belonging to this group are associated with the application group in the database. A sixteen-byte application key is generated for the mote, then the application group eight-byte identifier and the sixteen-byte application keys are programmed into the mote.
To join the network, the mote transmits a join request consisting of the eight-byte device address, the eight-byte application address, and a two-byte random number with a Media Access Control (MAC) layer Integrity Check (MIC) value is generated and the application key is shared. The gateway/gateways hearing this request forward radio packet along with the associated meta-data to their NS. If the NS recognises the mote hardware address and the MIC generated by the server matches the MIC sent, the NS generates a unique four-byte network address and a three-byte random number. The server uses the random number to generate the sixteen-byte network and application session keys stored in the database. The NS builds a join-accept packet consisting of a three-byte network identifier, the three-byte random number, the four-byte mote network address, and some network management information. The NS then sends the Join-Accept packet to the gateway with the best Received Signal Strength Indicator (RSSI), and the gateway forwards join-accept to the mote at a specific time. Finally, the mote generates the application session key and network session key by the use of join-accept packet. Unless the mote rejoins the network, from this time on, it will use the four-byte network address and encrypt data with the generated network and application session keys. An example of the network address is visible in Figure 2, identified as the “DevAddr.”
For a mote that has pre-joined the network, the mote’s four-byte network address and the network and application session keys are generated by the NS and programmed into the mote.
Deduplication: Because the LoRaWAN can include many gateways with overlapping coverage, it is expected that multiple gateways will receive the same packet from a mote. Every receiving gateway will forward this packet to the NS, which will identify duplicate packets and associate them together. Since a packet includes RSSI information, the NS can direct any return packets to the gateway with the best RF path to the mote. Because the mote listens at specific times for ACKs, the NS must begin processing the received packet and prepare to send the ACK to the gateway in time for the mote to receive it. If the latency on a gateway to NS server link is excessive, the NS can send the ACK back via a less optimal gateway. The NS may have already forwarded the packet to the application owner when the duplicate packet arrives. In this scenario, the NS still has to recognise the duplicate packet and should not send an ACK but should still forward the duplicate packet to the application owner. The example in Figure 2 shows a ‘”gateway_count”:1’ indicating that this message was only received by one gateway. If multiple gateways had received the same message, the gateway count would be higher, and the array “gateway_info” would contain a set of gateway information for each receiving gateway.
Reply Delay: If a mote is intended to send data and have the receiving system respond with instructions, there will likely be a transmit/receive cycle delay. For example, a Class A mote sends a message that a measured variable has reached a particular value. The monitoring system makes a decision and sends a reply that the mote should act in a certain way (change an output). When the initial message was sent, the NS received that message, immediately arranged the ACK, and forwarded that message to the mote monitoring system. This system made a decision based on the data and sent a reply to the NS that needs to be forwarded to the mote, but the ACK has already been prepared, sent to the gateway, and may have already been transmitted. In that case, the reply message will sit until the following uplink message then the reply will be included in the ACK. For a system transmitting once an hour, the response to a particular condition may be delayed an hour. The system designer of the mote application needs to take this into account.

4. Methodology

This section presents the case studies and measurement methods. It consists of live and passive indoor and outdoor data collection sites and measurement tools.

4.1. Case Study 1: Live Indoor Site

The live indoor site was located in Glasgow city and consisted of a three-story open plan office building, Figure 3 of an undeveloped flat open area. The floors were essentially rectangular with 12 × 45 meters with a small taper at one end for an overall area of 510 square meters per floor. The roof and large part of the outer skin of the top two floors were metal. Against the building long side was a two-story atrium linking this building to an adjacent two-story building. There were two LoRAWAN connected environmental monitoring stations on each floor, with an additional monitoring station located in a bathroom area on the ground-floor. A portable monitoring station was located in different building areas or outdoors as required. The seven fixed monitoring stations measured several environmental parameters and reported values approximately every 15 min. The mobile monitoring station measured the same environmental parameters and transmitted these values every seven to eight seconds if turned on. All monitoring stations requested an ACK when they transmitted.
Correct transmission and reception of packets from the monitoring stations to the network were identified from the monotonic incrementing of the packet up-counter for a specific monitoring station, and lost packets were identified from a missing count. Lost acknowledgements from the NS to the monitoring stations via a gateway were inferred by monitoring stations sending a repeat transmission of a packet approximately twenty seconds after a previous successful transmission. The monitoring stations were designed to resend several times, and if an ACK were not received, the monitoring stations would attempt to rejoin the network. Monitoring stations utilised the Multitech mDot [43] LoRaWAN module.
Monitoring stations communicated with two Multitech ‘Conduit’ gateways [44] in the building, one on the top-floor and another on the ground-floor. Initially, one gateway used a mobile network backhaul, but the mobile network latency was extremely variable, with latency commonly exceeding 1500 ms, it would have compromised the correct operation of the network.

4.2. Case Study 2: Live Outdoor Site

The outdoors comparison data was collected in the Glasgow CBD with use of a Multitech mDot operating in AT command mode and controlled by a Python script. The mDot requested ACKs with each transmission and only transmitted using SF9 and SF10. The gateways were Kerlink [45] devices mounted on the rooftops of two buildings 1.9 km and 2.1 km away from the transmitting mote. Logged data from the mote and the NS was combined for the analysis. Data was available from different live sensor devices, but these devices did not request ACKs and two-way performance could not be measured with this data.

Performance Measures

Several LoRa and LoRaWAN network performance measures were used in this analysis, including the total number of test-site packets handled by the network and a per-mote per-gateway basis. For every transmission, the channel frequency, RSSI, and SNR were captured by the NS and the uplink and downlink counters, the server time, gateway time, and other parameters such as network deduplication of packets.

4.3. Case Study 3: Passive Outdoor Site Interference Measurement

This case study further investigates the possibility of interference in the 868 MHz ISM band in Glasgow CBD. This study is performed to ascertain if interference from SRDs and sub-GHz technologies or other sources was responsible for the LoRaWAN outdoor packet losses measured from Glasgow CBD in which outdoor packet losses were 50 X greater than the indoor measurement test results. Numerous and different signal patterns were intercepted for later observation and analysis. These measurements help to establish an understanding of signal activity in the 863–870 MHz ISM band. The study of measurement results should indicate whether the behavior of signals occupying LoRa channels may have affected packet losses for the LoRaWAN core channels in Glasgow CBD.
The measurement of signal activity is based on the principle of energy detection. The utilised measurement equipment, Tektronix RSA306B [46] has a sensitivity of approximately −107 dB when set between 863 MHz and 870 MHz to capture signal activity in the span of 7 MHz and the Resolution Bandwidth (RBW) at 10 kHz. The Tektronix RSA306B is a portable real-time spectrum analyser with a 100% Probability of Intercept (PoI), capable of intercepting as short as 100 μ s transient signals. It was fitted with an omnidirectional Whip antenna which continuously captured the RF signals from the 863–870 MHz band. The Tektronix RSA306B analyser was controlled with the SignalVu-PC software installed in Lenovo ThinkPad P51 series laptop with Intel Xeon E3-1505M v6. The computer hosted the control software and supplied the power to the analyser, and stored the collected data through a USB 3.0 cable.
The degree of signal activity in the 868 MHz ISM band was investigated in five different open space locations within Glasgow CBD for the duration of two hours per location in ten days. The time was set to two hours to allow transmission in two DC. The first measurement was conducted in a relatively small garden at Glasgow Caledonian University (GCU). This garden is closely surrounded by two tall buildings and a short traffic police building. The second measurement location was a relatively large garden, Rottenrow Garden. It is surrounded by Strathclyde University buildings in the south, Glasgow College in the East, a multi-story residential building in the north, and an unused old building in the west. There is a small car park near this garden. The third location, George square, is in downtown Glasgow, with commercial, administrative buildings, and roads with busy traffic surrounding it. The fourth measurement location was inside Buchanan bus station, the biggest bus station located at the heart of Glasgow city. The Kelvingrove park was the fifth location. The park constitutes Kelvingrove Museum, numerous playgrounds, and nature with a river flowing through the middle of the park. The measurement locations circled in red in Figure 4 shows the measurement locations.

5. Results and Analysis

Results for the indoor test site are presented first, then the outdoor LoRaWAN test site and interference measurements results and analysis. For some measures, the movable monitoring station was reported separately due to the different operation of this device compared to the other sensors.

5.1. Indoor Performance of LoRaWAN

The uplink and downlink packet statistics in Table 1, Table 2 and Table 3 constitute the RSSI and SNR records on a per RF link basis. The graphs in Figure 5a,b represent the RSSI and SNR for the link between the ground-floor showers sensor and the upper-floor gateway. This link was the only RF path with exciting features. Other RF paths were consistent over the test period.
Deduplication: An analysis was conducted to identify any errors related to gateway backhaul latency and deduplication. This was performed by searching the server logs for traffic related to this site where there were successive “gateway_count:1” for the same mote for the same packet (same value in “f_count_up”). No deduplication errors were identified. However, there was an underlying 2.5% of all traffic where the mote packet was only forwarded by one gateway, excluding traffic for the high transmit rate mobile mote, which became 2.12%. Further analysis identified seven occasions, from 10 to 30 min, where one gateway or the other was not forwarding any messages. None of these occasions were observed during regular business hours, although that did not preclude human intervention. On one occasion, one gateway was off for at least 24 min, then 20 min. Later on, the other gateway was off for 27 min. These periods account for 0.42% of “gateway_count = 1”. There was no obvious explanation for the periods of gateway inactivity.
Outdoor Range (Indoor Site): This site was not set up for outdoor monitoring, but both gateways could be accessed at the distant edge of the property at 650 m range. The top-floor gateway had the best reception at between −100 and −110 dBm, while the ground-floor gateway was below this level and not capturing as many packets. The range for the top-floor gateway was good, considering that the building had a metal outer skin.
Channel Response by Frequency: Mean RSSI for each channel for each sensor to each gateway was calculated, but no significant variation between results for the different channel frequencies was identified. As the sensors operated on a fixed SF, it was impossible to analyse the combination of SF and channel performance.

5.2. Outdoor Performance of LoRaWAN

Uplink and downlink success rates are reported in Table 4 with RSSI, SNR, and channel performance reported in Table 5. The channel performance was reported since performance across the channels varied. Deduplication and other gateway and network performance measures were reported in Table 6.

5.3. Live Measurement Results and Comparative Analysis

As expected, the results for indoor LoRaWAN traffic were good, which can be seen from Table 1. There was a low uplink packet loss rate of 0.03%, and the sensors were able to resend the data for lost packets. The rate of lost ACKs, where it was possible to calculate, was slightly higher. These ACKs would have also caused the sensor to resend its data. This low packet loss could be attributed to the high received signal strength recorded by the gateways (Table 2) and the low RF noise environment identified by the good SNRs (Table 3). Figure 6 shows relative plots for mean RSSI and standard deviation summarised in Table 2 per gateway. Similarly, Figure 7 shows relative plots for mean SNR and standard deviation summarised in Table 3 per gateway. The only RF path with any noticeable variation was from the shower rooms to the upstairs gateway (Figure 5). In this case, the RF signal path was affected by opened or closed doors, intervening equipment, lockers, or various other conditions. The correlation between RSSI (Figure 5a) and the SNR (Figure 5b) indicated that any noise was a constant low-level background noise.
Deduplication errors were not considered because both gateways used cabled backhaul network connections, but performing the analysis did identify some deduplication errors with the gateways. These gateways were connected via a private network, making it not possible to monitor them directly. Therefore, the causes of deduplication errors were unknown.
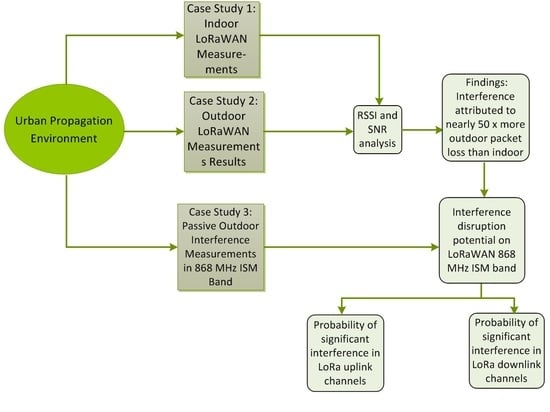
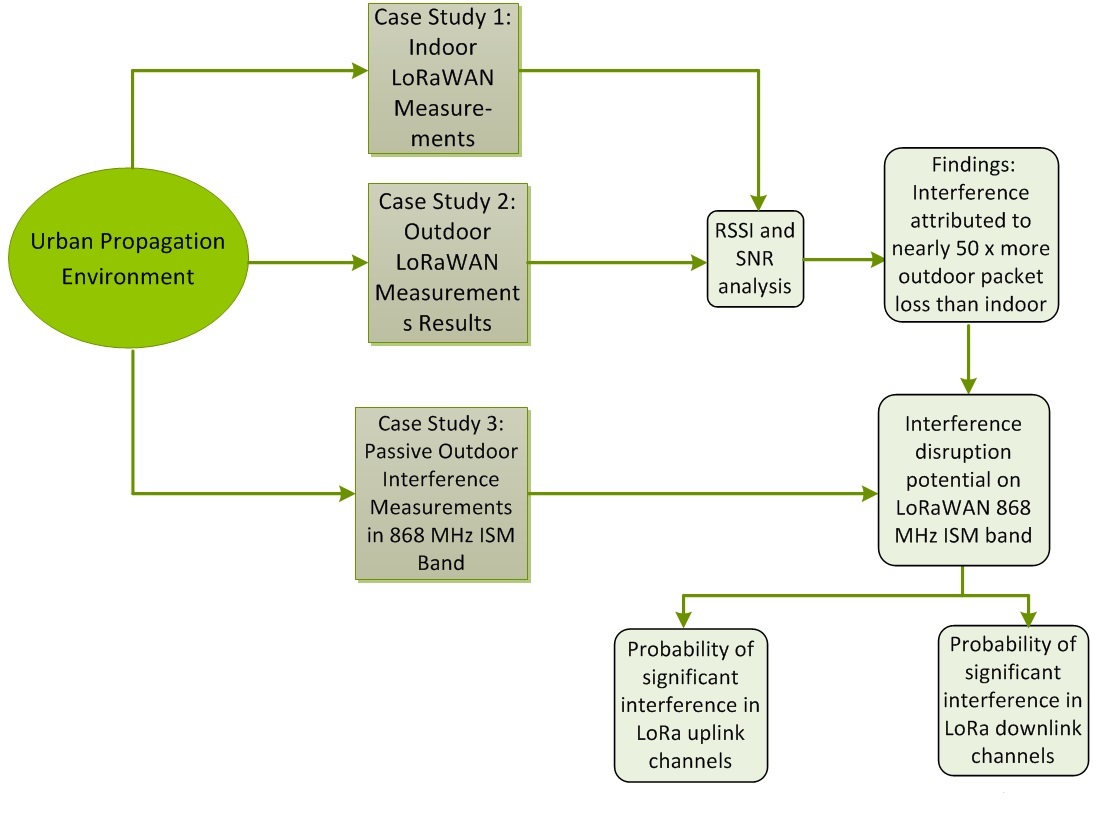
Although the outdoor LoRaWAN packet losses (Table 4) were 50 times greater than for the indoor test, these results appeared “good” for low-power wireless packets transmitted to and from gateways approximately 2 km distant. Although the indoor testing did not identify any variation due to the channel frequency, the outdoor testing indicated that the channel frequency could affect the ability to receive packets successfully. From Table 6, it was seen that Gateway-1 (GW-1) received 20% fewer packets than Gateway-2 (GW-2), and the Table 5 results indicated that this amount was due to a much lower reception of packets transmitted on channels zero or two (868.1 MHz and 868.5 MHz). The SNR results revealed a significant noise on channel zero and that the noise source was closer to GW-2 than GW-1. This was inferred from the GW-2, channel zero mean RSSI of −96.6 dBm and SNR of −8.9 dB compared to the GW-1 results for the same channel of a mean RSSI −110 dBm and SNR of −8.05 dB. Based on these figures, the noise in the 868.1 MHz channel was 14 dB higher in the proximity of GW-2 compared to GW-1. Despite this, GW-2 performed better at capturing packets on the 868.1 MHz channel due to a better RF path and subsequent higher signal strength.
Because of the RSSI and SNR results, some further testing was performed over seven days, and some results graphed in Figure 8. Comparing Figure 5 and Figure 8, it was found that (a) a source of noise that operated predominately at night, and (b) the RF path improved at night. This meant that SF12 transmissions could be received at a level of −95 to −100 dBm despite noise levels at 15 dB higher. During this test period, very few night-time SF7 transmissions were successful, so the reception of SF12 packets could be attributed to the additional receiver sensitivity when demodulating SF12 transmissions.
Deduplication errors were identified on outdoor testing, and this was expected as both gateways used in this instance used mobile network backhaul. During this testing ICMP, ping packets ran on both backhaul links and the latency recorded in Table 6. Although the mean latency for both backhaul links was similar, the GW-2 link had nearly 10,000 instances of latency over 350 ms, and both had instances of latency of over two seconds. The inspection of the gateway receive times indicated that the gateways recorded receive times within microseconds of each other, but these packets could be received by the NS a second apart on occasion.
The LoRaWAN range was not explicitly measured on this test, although it is known that sensors are operating at ranges greater than 4 km from gateways on this network.

5.4. Interference Measurement Results and Analysis

This section presents the measurement results, observations, and analysis of data from five different Glasgow CBD locations. The observation is based on the view of signal activity in the occupied sub-bands. The analysis of the data is performed to determine the probability of having signal interference that affect LoRa transmission in LoRa mandatory uplink and downlink channels.
In presenting the measurement results, the spectrogram is more preferred than the power spectral density due to a display that provides a valuable insight into signal activity and power levels of transient RF signals. In this study, the spectrogram will be used instead of the histogram. The International Telecommunication Radio (ITU-R) in [47] indicates that presenting spectrum occupancy measurement results with a spectrogram provides quality visual representation of signal activity and power levels. This tool is employed to help visually represent the activity of signal power levels in the sub-bands between 863–870 MHz ISM band in CBD. The 868 MHz sub-bands, 863–865 MHz, 865–868 MHz, and 868–870 MHz for audio, alarms, and LPWAN technologies, respectively, are individually examined to gain more intuition into the signal activity. Next, calculating the probability of signal interference in each location for LoRa mandatory uplink, and downlink channels, 868.1, 868.3, and 868.5 MHz in Europe follows. Usually, LoRa must comply with 25 mW transmit power limits, and the 1% DC follows. The sub-bands, 868.0–868.6 MHz and 869.4–869.65 MHz for LoRa uplink and downlink, respectively, are considered as occupied with signals if the power levels are 10 dB [35,47] above sensitivity of the spectrum analyser.
The possibility that signals in these sub-bands experience interference either from LoRa installations, other ISM band technologies, or other sources is determined based on the accumulation of signals in the collected samples being above or below the threshold of −97 dBm, that is 10 dB above sensitivity of RSA306B measurement up. The probability, p of signal interference in these sub-bands is determined by the sum of signal power levels above the threshold, -97 dBm to the total measurement samples and is calculated as follows:
p = i = 1 N S ( R i ) N
where
S ( R i ) = 1 If R i > 97 0 If R i 97
and R i is the received signal power levels in the 10 kHz × 100 μ s measurement samples S, and N is the total number of measurements per location.
The measurement results in Figure 9 were recorded from Glasgow Caledonian University (GCU), and sub-bands with significant signal activity in 868 MHz ISM band are investigated separately. The sub-band, 865.0–868.0 MHz standardised for radio frequency identification (RFID) [48], displayed high signal activity. The measurement results show four frequent discontinuous transmissions centred at 865.6 MHz, 866.2 MHz, 866.9 MHz, and 867.4 MHz with power levels at around −63.75 dBm, −67.49 dBm, −69.95 dBm, and −67.42 dBm, respectively. These transmissions appeared at the rate of 1 s and were either access control systems at GCU or the tracking systems at a nearby traffic police station. The 868.0–868.6 MHz sub-band for mandatory LoRa uplink channels measurement results showed sporadic transmissions centred at 868.0 MHz, 868.1 MHz, 868.3 MHz at an interval of 4.03 min and power levels at −85.44 dBm, −85.25 dBm, and −83.36 dBm, respectively. The change in power levels over the monitoring duration was not significant. There were strong emissions in some channels, for instance, 868.1 MHz, which appeared to spread into the adjacent channels. The rate of signal activity level in this sub-band was high and seemed to violate the DC. The transmissions observed in this sub-band may originate from IEEE 802.15.4 technologies, wireless-M readings, and Sigfox, which share the same sub-band [49]. The last sub-band with signal activity in this area is the downlink 869.4–869.65 MHz, but rare transmissions mainly centred at 869.5 MHz with power levels at −107.03 dBm were observed. The sub-band requires a 10% DC restriction or the implementation of LBT + AFA, and the intensity of signal activity shows fewer chances of signal interference, if any.
The next measurement results, in Figure 10, were recorded from George Square. The sub-band 865–867 MHz signal activity was characterised by nearly continuous but weaker signals. Notable transmissions were centred at 865.7 MHz, 866.5 MHz, and 866.8 MHz with power levels at −107 dBm, −109.8 dBm, and −110 dBm, respectively. The next sub-band, 868.0–868.6 MHz for mandatory LoRa channels, showed the variation of periodic strong and frequent weaker signals. These transmissions centred at 868.1 MHz, 868.3 MHz, and 868.5 MHz with power levels at −94.8 dBm, −106.89 dBm, and −79.20 dBm, respectively. Moreover, strong transmissions centred at 868.0 MHz and 868.3 MHz at −78.44 dBm and −79.3 dBm, respectively, were observed in this area. Furthermore, the measurement observed weaker signal activity of 3 s periodic behaviour with the transmission centred at 868.1 MHz. Unlike the previous measurement results (Figure 9), weaker signals were observed at George Square in mandatory LoRa channels but at a high period rate. In these areas, the probability signal interference, shown in Table 7, for mandatory LoRa uplink and downlink is 13.2% and 0%, respectively.
The measurement results presented in Figure 11 were recorded from Kelvingrove Park. In the upper section of 865.0–868.0 MHz sub-band, infrequent multiple signal activity was observed with transmission centred at 867.3 MHz and 867.8 MHz with power levels at −79 dBm and −75 dBm respectively. The 868.0 MHz–868.6 MHz sub-band was highly occupied with signals of varying nature. The measurement results showed two periodic transmissions centred at 868.0 MHz with weaker signal power levels at −91 dBm and stronger signal levels at −78 dBm. There was activity of signals at roughly 2 s periodic behaviour centred at 868.1 and 868.3 MHz and power levels between −101.22 dBm and −93.9 dBm and another relatively strong signal activity with transmission centred at 868.5 MHz with power level at −77 dBm. The 869.4–869.65 MHz sub-band for LoRa downlink channels was occupied with three transmissions centred at 869.5 MHz. A transmitter emitted infrequent power levels at −107 dBm, whereas the other signals with power levels at −92.61 dBm and −91 dBm appeared frequently. As shown in Table 7, the probability of signals experiencing interference in mandatory LoRa uplink, 868.0–868.6 MHz and downlink, 869.4–869.65 MHz is 64.9% and 49.7%, respectively.
The subsequent measurement was performed at Buchanan bus station, and the measurement results are presented in Figure 12. The signal activity was only observed in the audio sub-band, 863–865.0 MHz and the 865.0–868.0 MHz for RFID. The latter was occupied with frequent but discontinuous transmissions centred at 865. 7 MHz, 866.3 MHz, 866.8 MHz, and 867.5 MHz with power levels at −83.52 dBm, −78 dBm, −79.93 dBm, and −80.58 dBm, respectively. The signal activity in this sub-band was quite similar to signal activity observed in the same sub-band at GCU, with the difference being the power levels and the carrier frequencies. It was observed that an RFID-based [50] system could have been operating to track bus location and display the bus arrivals. Although no signal activity was observed in the mandatory LoRa channel for uplink, traffic was observed in 869.4–869.65 MHz sub-band for mandatory LoRa downlink channels. These signals were weak, with power levels varying between −103.5 dBm and −108.56 dBm. The probability of mandatory LoRa channel experiencing interference, shown in Table 7 at this location is at 0%.
The measurement at Rottenrow Garden was the final, and Figure 13. displays the results. The RF signal activity with intense power levels was noted in the audio sub-band, 863–865.0 MHz, unlike the previous locations. There were strong and continuous transmissions centred at 863.1 MHz, 863.6 MHz, and 864.4 MHz with power levels at −91.28 dBm, −80.88 dBm, and −106 dBm, respectively. Additionally, weaker continuous and periodic signals were observed in the lower frequencies of 865.0–868.0 MHz sub-band and the upper part of this sub-band was occupied with strong periodic signal activity. These transmissions were centred at 867.3 MHz and 867.6 MHz with power levels at −51.3 dBm and −49.9 dBm, respectively. In the 868.0–868.6 MHz sub-band for mandatory LoRA uplink, diverse patterns of signal activity showed up. The strong transmissions centred at 868.1 MHz, 868.3 MHz, and 868.5 MHz were periodically observed. At the same time, a relatively weaker but more frequent signal activity was centred at 868.3 MHz with power levels at −99 dBm. In this sub-band, an unusual continuous but weaker signal activity centred at 868.6 MHz with a power level at −107 dBm was violating the DC regulations. The next sub-band with signal activity was 869.4–869.65 MHz for mandatory LoRa downlink channels. The activity of 4.082 s periodic signal transmissions centred at 869.5 MHz with power levels at −93 dBm and another weaker signal activity centred at 869.5 MHz were observed at Rottenrow Garden. As shown in Table 7, the probability of LoRa signals experiencing interference in the 860.0–868.6 MHz and 869.4–869.65 MHz sub-bands for LoRa uplink and downlink in this location is at 51% and 54% respectively.

6. Discussion

Since the deployment of LoRaWAN for indoor and site-wide sensor data collection will become more common, this live site has provided some needed performance information. The site may not be typical in that the building was predominately open plan, and the outer skin was metal. However, the LoRaWAN range beyond the building indicated a wider scope of coverage in more complex buildings. The gateway positions in the building were chosen for their proximity to power and existing network connections, not for their optimal RF coverage, so planning for gateway installations is essential. As commercial gateways can be powered by power-over-ethernet and gateways can include mobile network backhaul, installations do not necessarily need to be limited by mains power or wired network availability.
As the measurement site of approximately 80 hectares develops and more buildings are constructed, the probability is that the entire site could be covered, including sensors ‘deep indoors, by two or three appropriately located external gateways. This appears very reasonable given the reception levels and packet success rates in the much larger and more complex Glasgow CBD environment also reported here. In Glasgow CBD environment, the height of the gateways relative to their surroundings was essential for getting good coverage down to sensors located near the ground level. One aspect of Glasgow CBD environment was the possibility of interference from other sources, including other ISM band technologies and other LoRaWAN installations. It is essential that LoRaWAN installations spread their traffic over as many channels as available to minimise congestion on core channels and co-channel interference. At the same time, interference should be minimised by implementing transmission power control in the motes to reduce the transmit power to the levels necessary for reliable connections. Since adaptive data rate is part of the LoRaWAN specification, newer endpoint products and NSs are expected to implement some power management.
The measurement results from different locations in Glasgow CBD have shown varying signal activity occupying the 868 MHz ISM band. Table 7 shows the probability of LoRa signal interference for LoRA mandatory uplink and downlink Channels. The measurement sites were open spaces with the buildings in closer proximity except for Kelvingrove Park. While the measurement results in some areas showed a high probability of LoRa signal interference in the 868.0–868.6 MHz, this sub-band was not occupied at all in other locations.
The comparison of interference measurement results in this study with a recent study (four years old) [35] for interference in the 863–870 MHz ISM band for LoRa and Sigfox in the city of Aalborg, Denmark shows an increase in interference. While the highest probability of interference was at 33.7% in Aalborg, it is at 97.3% at GCU. All the measurement locations in Aalborg showed high interference presence in the 868.0–868.6 MHz for LoRa uplink, whereas areas like Buchanan Bus station in Glasgow CBD have no chances of LoRa signal interference. Surprisingly, the reported higher probability of LoRa signal interference at 58.2% in the Business Park in Aalborg four years ago in the 869.4–869.65 MHz sub-band is still the highest to Glasgow measurement locations. However, on average, the probability of LoRa interference is still more in Glasgow in the downlink compared to Aalborg.
The probability of LoRa signal interference was independent of the 868.0–868.6 MHz sub-band transmission density. For instance, at GCU, the probability of interfering signals to affect LoRaWAN was 97.3% for LoRa uplink, and 4.8% for downlink was the highest, but fewer transmission signals were observed in the 868.0–868.6 MHz and 869.4–868.65 MHz. On the other hand, in locations with significant transmission density such as George Square and Kelvingrove Park, the probability of signal interference was at 13.2% and 64.9%, respectively, for mandatory LoRa uplink channels. The increasing possibility of LoRa signal interference at GCU can be attributed to nearly all the measurement samples being above the threshold, −97 dBm. During the measurement time, there was a 4.03 min periodic signal with intense power levels. Moreover, transmissions possessed nearly equal power levels, which indicates an origin from the same source. These transmissions violate the 1% DC, requiring a device to transmit only 36 s and wait for 3564 s. In the measurement locations, there were instances of DC violation. The measurement results have shown that signals with intense power levels are more likely to overshadow weak signals. This case was observed at GCU and Rottenrow Garden. As both locations are surrounded by education institutions (GCU, Glasgow College, and the University of Strathclyde), it is more likely that experimental platforms are left to operate out of the transmit regulations.
The core downlink channels for LoRa were less occupied. The probability of signal interference in the downlink was insignificant except for Kelvingrove Park, 49.7% and Rottenrow Garden, 51%. Multiple transmissions occured in the same channel in these locations, largely at 969.5 MHz. and irregular and weak signals were observed in the downlink channels.
It is essential to underscore that LoRa shares the core channels with other technologies. Transmissions occupying the 868.0–868.6 MHz core LoRa channels for downlink and 869.4–869.65 MHz for the uplink may be LoRAWAN, Sigfox, Wireless-M, and other IEEE 802.15.4 technologies. The end devices must comply with the DC and implement the transmission power control mechanisms to reduce signal interference in the channels. These practices will reduce interference and improve the reliability of LoRa channels as the deployment of IoT networks continue to grow.

7. Conclusions and Future Work

In this paper, real-world measurements were captured to evaluate the performance of a live multi-gateway LoRaWAN 868 MHz and interference across indoor and outdoor localities. There were packet delivery success rates of 99.95% and 95.7% for the indoor site and outdoor, respectively, along with the achievable range. Performance parameters of the LoRaWAN technology reported here show that LoRaWAN technology has a place in enabling the IoT. Only a small portion of the overall functionality and performance of the LoRaWAN has been evaluated to date. However, new sites and networks are coming online, so further research is required to fully understand LoRaWAN performance for different quality use cases and scenarios. The LoRaWAN ecosystem is constantly growing with a range of consumer devices now available, so the primary constraint on the uptake of the technology is the demand for the service that LoRaWAN provides. This demand grows as building owners implement energy monitoring and energy management while the smart meter market continues to develop. Undoubtedly, other IoT sensing, and control opportunities are developing. Although LoRaWAN is only one of the potential IoT enablers, the combination of performance and developing ecosystem means that it will play some significant role in the roll-out of the IoT. The coverage of LoRaWAN, which is being deployed to facilitate wireless connectivity for the IoT, is likely to be affected by the interference from other sources, including other sub-GHz technologies and other LoRaWAN networks.
The study of interference in Glasgow CBD has shown a significant signal activity in the 868 MHz ISM band. The core LoRa 868.0–868.6 MHz sub-band for uplink was occupied with signals stronger than −97 dBm with the higher and lower probability of interference of 97.3% and 0% at GCU and Buchanan Bus station, respectively. The potential to interference in the LoRa 869.4–869.65 MHz sub-band for downlink is higher at Rottenrow Garden and Kelvingrove Park with the probability of interference at 54% and 49.7% respectively. The comparison of interference probability reported for LoRa core channels in Aalborg city, Denmark, and Glasgow, the UK, four years ago shows that interference in the 868 MHz ISM band is increase with growth of LPWAN deployment.
In the future, lessons learned from Glasgow measurements and a detailed measurement dataset for 868.0–868.6 MHz will be combined to model interference for 868 MHz ISM band in Glasgow city. The ongoing deployment of long-range sub-GHz technologies will make the 868 MHz ISM frequency band heavily contested.

Author Contributions

Original data collection, E.H. and A.J.W.; conceptualisation approach, proofreading and funding for original research data, H.L.; proofreading and validation of technical approach, A.-U.-H.Q. and R.M.G. All authors have read and agreed to the published version of the manuscript.

Funding

This research received scholarship from the British Commonwealth PhD Scholarship scheme.

Institutional Review Board Statement

Not applicable.

Informed Consent Statement

Not applicable.

Data Availability Statement

Data is contained within the article.

Acknowledgments

The authors wish to acknowledge the British Commonwealth PhD Scholarship scheme for their financial support for this project.

Conflicts of Interest

The authors declare no conflict of interest.

References

  1. Semtech, Lora (phy). 2021. Available online: https://www.semtech.com/lora/what-is-lora (accessed on 23 November 2021).
  2. Petäjäjärvi, J.; Mikhaylov, K.; Pettissalo, M.; Janhunen, J.; Iinatti, J. Performance of a low-power wide-area network based on lora technology: Doppler robustness, scalability, and coverage. Int. J. Distrib. Sens. Netw. 2017, 13, 1550147717699412. [Google Scholar] [CrossRef] [Green Version]
  3. Telkamp, T.; Slats, L. Ground Breaking WORLD record! Lorawan Packet Received at 702 km (436 miles) Distance. 2017. Available online: https://www.thethingsnetwork.org/article/ground-breaking-world-record-lorawan-packet-received-at-702-km-436-miles-distance (accessed on 14 September 2021).
  4. Akerman, D. High Altitude Ballooning. 2014. Available online: http://www.daveakerman.com/?p=1658 (accessed on 12 May 2021).
  5. Pasolini, G.; Buratti, C.; Feltrin, L.; Zabini, F.; Castro, C.D.; Verdone, R.; Andrisano, O. Smart city pilot projects using lora and ieee802.15.4 technologies. Sensors 2018, 18, 1118. Available online: https://www.mdpi.com/1424-8220/18/4/1118 (accessed on 14 September 2021). [CrossRef] [PubMed] [Green Version]
  6. Wendt, T.; Volk, F.; Mackensen, E. A benchmark survey of long range (loratm) spread-spectrum-communication at 2.45 ghz for safety applications. In Proceedings of the 2015 IEEE 16th Annual Wireless and Microwave Technology Conference (WAMICON), Cocoa Beach, FL, USA, 13–15 April 2015; pp. 1–4. [Google Scholar]
  7. Parri, L.; Parrino, S.; Peruzzi, G.; Pozzebon, A. Offshore lorawan networking: Transmission performances analysis under different environmental conditions. IEEE Trans. Instrum. Meas. 2021, 70, 1–10. [Google Scholar] [CrossRef]
  8. Reda, H.T.; Daely, P.T.; Kharel, J.; Shin, S.Y. On the application of iot: Meteorological information display system based on lora wireless communication. IETE Tech. Rev. 2018, 35, 256–265. [Google Scholar] [CrossRef]
  9. Agbuya, F.; Apolinario, G.F.; Ramos, D.M.; Villanueva, J.M.; Zafe, P.; Hernandez, J.A.; Coquia, J. Design of a real—tim4e ocean data—logg4ing drifter thru cloud technology for collecting tidal parameters. In Proceedings of the TENCON 2018-2018 IEEE Region 10 Conference, Jeju, Korea, 28–31 October 2018; pp. 0844–0849. [Google Scholar]
  10. Network, T.T. Getting Started. 2021. Available online: https://www.thethingsindustries.com/docs/getting-started/ttn/ (accessed on 1 September 2021).
  11. Hill, K. Three Models of Iot Network Ownership for Smart Cities. 2021. Available online: https://www.rcrwireless.com/20190717/internet-of-things/three-models-of-iot-network-ownership-for-smart-cities (accessed on 23 November 2021).
  12. Gupta, R. The Business Case of Densifying Lorawan Deployments. 2019. Available online: https://blog.3g4g.co.uk/2019/01/the-business-case-of-densifying-lorawan.html (accessed on 23 November 2021).
  13. Sigfox, Sigfox Technology. 2021. Available online: https://www.sigfox.com/en/what-sigfox/technology (accessed on 23 November 2021).
  14. Mishra, A.R. Fundamentals of Network Planning and Optimisation 2G/3G/4G: Evolution to 5G; John Wiley & Sons: Hoboken, NJ, USA, 2018. [Google Scholar]
  15. Vejlgaard, B.; Lauridsen, M.; Nguyen, H.; Kovacs, I.Z.; Mogensen, P.; Sorensen, M. Coverage and capacity analysis of sigfox, lora, gprs, and nb-iot. In Proceedings of the 2017 IEEE 85th Vehicular Technology Conference (VTC Spring), Sydney, Australia, 4–7 June 2017; pp. 1–5. [Google Scholar]
  16. Poorter, E.D.; Hoebeke, J.; Strobbe, M.; Moerman, I.; Latré, S.; Weyn, M.; Lannoo, B.; Famaey, J. Sub-ghz lpwan network coexistence, management and virtualization: An overview and open research challenges. Wireless Personal Commun. 2017, 95, 187–213. [Google Scholar] [CrossRef] [Green Version]
  17. Lauridsen, M.; Vejlgaard, B.; Kovacs, I.Z.; Nguyen, H.; Mogensen, P. Interference measurements in the european 868 mhz ism band with focus on lora and sigfox. In Proceedings of the 2017 IEEE Wireless Communications and Networking Conference (WCNC), San Francisco, CA, USA, 19–22 March 2017; pp. 1–6. [Google Scholar]
  18. Lynn, A. The Growth of Lora and the Lorawan Open Protocol. 2021. Available online: https://www.electronicspecifier.com/industries/wireless/the-growth-of-lora-and-the-lorawan-open-protocol (accessed on 23 November 2021).
  19. Wixted, A.J.; Kinnaird, P.; Larijani, H.; Tait, A.; Ahmadinia, A.; Strachan, N. Evaluation of lora and lorawan for wireless sensor networks. In Proceedings of the 2016 IEEE SENSORS, Orlando, FL, USA, 30 October–3 November 2016; pp. 1–3. [Google Scholar]
  20. Margelis, G.; Piechocki, R.; Kaleshi, D.; Thomas, P. Low throughput networks for the iot: Lessons learned from industrial implementations. In Proceedings of the 2015 IEEE 2nd World Forum on Internet of Things (WF-IoT), Milan, Italy, 14–16 December 2015; pp. 181–186. [Google Scholar]
  21. Filho, H.S.; Filho, J.P.; Moreli, V. The adequacy of lorawan on smart grids: A comparison with rf mesh technology. In Proceedings of the 2016 IEEE International Smart Cities Conference (ISC2), Trento, Italy, 12–15 September 2016; pp. 1–6. [Google Scholar]
  22. Corporation, S. Lora™ Modulation Basics. 2021. Available online: http://wiki.lahoud.fr/lib/exe/fetch.php?media=an1200.22.pdf (accessed on 2 May 2021).
  23. Mikhaylov, K.; Petaejaejaervi, J.; Haenninen, T. Analysis of capacity and scalability of the lora low power wide area network technology. In Proceedings of the European Wireless 2016; 22th European Wireless Conference, Oulu, Finland, 18–20 May 2016; pp. 1–6. [Google Scholar]
  24. Toussaint, J.; Rachkidy, N.E.; Guitton, A. Performance analysis of the on-the-air activation in lorawan. In Proceedings of the 2016 IEEE 7th Annual Information Technology, Electronics and Mobile Communication Conference (IEMCON), Vancouver, BC, Canada, 13–15 October 2016; pp. 1–7. [Google Scholar]
  25. Neumann, P.; Montavont, J.; Noël, T. Indoor deployment of low-power wide area networks (lpwan): A lorawan case study. In Proceedings of the 2016 IEEE 12th International Conference on Wireless and Mobile Computing, Networking and Communications (WiMob), New York, NY, USA, 17–19 October 2016; pp. 1–8. [Google Scholar]
  26. Luvisotto, M.; Tramarin, F.; Vangelista, L.; Vitturi, S. On the use of lorawan for indoor industrial iot applications. Wirel. Commun. And Mobile Comput. 2018, 2018, 3982646. [Google Scholar] [CrossRef] [Green Version]
  27. Ayele, E.D.; Hakkenberg, C.; Meijers, J.P.; Zhang, K.; Meratnia, N.; Havinga, P.J.M. Performance analysis of lora radio for an indoor iot applications. In Proceedings of the 2017 International Conference on Internet of Things for the Global Community (IoTGC), Funchal, Madeira Island, 10–13 July 2017; pp. 1–8. [Google Scholar]
  28. Petäjäjärvi, J.; Mikhaylov, K.; Hämäläinen, M.; Iinatti, J. Evaluation of lora lpwan technology for remote health and wellbeing monitoring. In Proceedings of the 2016 10th International Symposium on Medical Information and Communication Technology (ISMICT), Worcester, MA, USA, 20–23 March 2016; pp. 1–5. [Google Scholar]
  29. Javed, A.; Larijani, H.; Wixted, A. Improving energy consumption of a commercial building with iot and machine learning. IT Prof. 2018, 20, 30–38. [Google Scholar] [CrossRef] [Green Version]
  30. Augustin, A.; Yi, J.; Clausen, T.; Townsley, W.M. A study of lora: Long range & low power networks for the internet of things. Sensors 2016, 16, 1466. [Google Scholar]
  31. Radcliffe, P.J.; Chavez, K.G.; Beckett, P.; Spangaro, J.; Jakob, C. Usability of lorawan technology in a central business district. In Proceedings of the 2017 IEEE 85th Vehicular Technology Conference (VTC Spring), Sydney, Australia, 4–7 June 2017; pp. 1–5. [Google Scholar]
  32. European Radiocommunications Committee. 70-03 Relating to the Use of Short Range Devices (srd); ERC/REC 70-03; European Radiocommunications Committee: Copenhagen, Denmark, 2009; p. 7. [Google Scholar]
  33. Ofcom. Ir 2030-uk Interface Requirements 2030. 2021. Available online: https://www.ofcom.org.uk/ (accessed on 24 April 2021).
  34. Nolan, K.E.; Guibene, W.; Kelly, M.Y. An evaluation of low power wide area network technologies for the internet of things. In Proceedings of the 2016 International Wireless Communications and Mobile Computing Conference (IWCMC), Paphos, Cyprus, 5–9 September 2016; pp. 439–444. [Google Scholar]
  35. Lieske, H.; Beer, F.; Kilian, G.; Robert, J.; Heuberger, A. Characterisation of channel usage in ism/srd bands. In Proceedings of the European Telemetry and Test Conference, Nuremberg, Germany, 2–5 June 2014; pp. 32–38. [Google Scholar]
  36. Croce, D.; Gucciardo, M.; Mangione, S.; Santaromita, G.; Tinnirello, I. Impact of lora imperfect orthogonality: Analysis of link-level performance. IEEE Commun. Lett. 2018, 22, 796–799. [Google Scholar] [CrossRef] [Green Version]
  37. Semtech. Wireless and Sensing Products Datasheet. 2021. Available online: https://www.astute.global/wp-content/uploads/product-documents/sx1301.pdf (accessed on 2 May 2021).
  38. Portal, L.D. Frequently Asked Questions. 2021. Available online: https://lora-developers.semtech.com/community/faq/faq-lorawan (accessed on 15 May 2021).
  39. Cheong, P.S.; Bergs, J.; Hawinkel, C.; Famaey, J. Comparison of lorawan classes and their power consumption. In Proceedings of the 2017 IEEE Symposium on Communications and Vehicular Technology (SCVT), Leuven, Belgium, 14 November 2017; pp. 1–6. [Google Scholar]
  40. Postel, J. User Datagram Protocol. 1980. Available online: https://www.ietf.org/rfc/rfc768.txt (accessed on 15 September 2021).
  41. Actility. The Lorawan Network Server Is the Brain and the Controller of a Lorawan Network. 2021. Available online: https://www.actility.com/lorawan-network-server/ (accessed on 15 September 2021).
  42. You, I.; Kwon, S.; Choudhary, G.; Sharma, V.; Seo, J.T. An enhanced lorawan security protocol for privacy preservation in iot with a case study on a smart factory-enabled parking system. Sensors 2018, 18, 1888. [Google Scholar] [CrossRef] [PubMed] [Green Version]
  43. MultiTech. Long range lora modules. 2019. Available online: https://www.multitech.com/brands/multiconnect-mdot (accessed on 15 September 2021).
  44. Industries, T.T. Multitech Conduit Aep. 2020. Available online: https://www.thethingsindustries.com/docs/gateways/multitechconduit/ (accessed on 12 September 2021).
  45. Kerlink. Wirnet Outdoor Lorawan Gateways. Available online: https://www.kerlink.com/iot-portfolio-and-technologies/connectivity-management/wirnet-outdoor-lorawan-gateways/ (accessed on 14 September 2021).
  46. Tektronix, Rsa306b usb Spectrum Analyzer. 2021. Available online: https://uk.tek.com/spectrum-analyzer/rsa306 (accessed on 24 April 2021).
  47. Series, S. Spectrum Occupancy Measurements and Evaluation; 2017. Available online: https://www.itu.int/dms_pub/itu-r/opb/rep/R-REP-SM.2256-1-2016-PDF-E.pdf (accessed on 24 April 2021).
  48. Weinstein, R. Rfid: A technical overview and its application to the enterprise. IT Prof. 2005, 7, 27–33. [Google Scholar] [CrossRef]
  49. Semtech SX1302CxxxGW1; 2021. Available online: https://semtech.my.salesforce.com/sfc/p/#E0000000JelG/a/2R000000HV3G/an5Oh4KfiY7tAO1MO7RiPOj08WUpOTjPHSF57_.NlJ0 (accessed on 9 February 2022).
  50. Kamble, P.A.; Vatti, R.A. Bus tracking and monitoring using rfid. In Proceedings of the 2017 Fourth International Conference on Image Information Processing (ICIIP), Himachal Pradesh, India, 21–23 December 2017; pp. 1–6. [Google Scholar]
Figure 2. Anonymised JSON packet from a NS including gateway RF data and time stamps.
Computers 11 00025 g002
Figure 3. Approximate floor plan for the ground-floor. The middle and top-floors were almost completely open plan. The ground-floor gateway (marked) was in a cupboard. ‘Near’ motes were located near the bottom of the plan, ‘far’ motes located near the top of the plan, except for the ground-floor far mote which was near the light well. The shower mote is marked on the plan.
Computers 11 00025 g003
Figure 4. Interference Measurement Locations in Glasgow.
Computers 11 00025 g004
Figure 5. RSSI (A) and SNR (B) for indoor transmissions from ground-floor shower room monitoring station to 3rd floor gateway.
Computers 11 00025 g005
Figure 6. Relative Plots used to obtain Mean RSSI and Standard Deviation by Gateway in Table 2.
Computers 11 00025 g006
Figure 7. Relative Plots used to obtain Mean SNR and Standard Deviation by Gateway in Table 3.
Computers 11 00025 g007
Figure 8. RSSI (A) and SNR (B) for 868.1 MHz SF12 transmissions across a business district over a seven day period. Hour 12 indicates midday and hour 24 indicates midnight.
Computers 11 00025 g008
Figure 9. Measurements at Glasgow Caledonian University Garden.
Computers 11 00025 g009
Figure 10. Measurements at Glasgow George Square.
Computers 11 00025 g010
Figure 11. Measurements at Kelvingrove Park.
Computers 11 00025 g011
Figure 12. Measurements at Buchanan Bus Station.
Computers 11 00025 g012
Figure 13. Measurements at Rottenrow Garden.
Computers 11 00025 g013
Table 1. Summary of packets sent by sensors to network.
Uplink PacketsLost UplinkLost ACK
Fixed Sensors1772109
Movable Sensors70,30516uknown *
Total Up Packets87,57726uknown
Percent-0.03%0.05%
* Lost ACKs for the movable monitoring stations couldn’t be calculated from packet timing since the resend time interval and the normal send interval was the same.
Table 2. Mote to gateway rssi mean and standard deviation.
MoteTop-Floor GatewayGround-Floor Gateway
Location *RSSI (dBm)Std (dB)RSSI (dBm)Std (dB)
G-N−57.1±4.3 54.7 ±4.6
G-V § ^ −69.4±6.5−37.9±5.2
G-F−76.1±6.0 68.5 ±7.3
M-N−51.7±7.3 66.0 ±6.9
M-F 7 3.3±6.2 70.3 ±6.1
T-N−48.5±5.7−79.3±5.2
T-F−68.1±10.0−72.2±7.3
G-S−92.8±5.7−84.5±6.3
* Location Code. The first character is the floor, G = ground, M = middle, T = top. Second character: N = end near to gateway, F = end far from gateway, V = various, S = showers. § ^ mote was left sitting close to the ground-floor gateway for a period hence the high receive level.
Table 3. Mote to gateway snr mean and standard deviation.
MoteTop-Floor GatewayGround-Floor Gateway
Location *SNR (dB)Std (dB)SNR (dB)Std (dB)
G-N11.1±2.011.4±1.9
G-V § ^ 8.8±1.49±1.2
G-F11.5±1.911.5±1.9
M-N11.5±1.811.1±1.8
M-F10.7±2.011.5±1.8
T-N11.2±1.911.4±1.9
T-F11.3±1.911.5±1.8
G-S3.1±5.210±2.8
* Location Code. The first character is the floor, G = ground, M = middle, T = top. Second character: N = end near to gateway, F = end far from gateway, V = various, S = showers. § ^ mote was left sitting close to the ground-floor gateway for a period hence the high receive level.
Table 4. Analysis of packets * sent by sensor to network.
Uplink PacketsLost UplinkLost ACKFull Success
60881031575828
Percent1.69%2.58%95.7%
* SF9 & SF10 packets transmitted over a weekend.
Table 5. Outdoor rssi & snr by gateway and channel.
Gateway & ChannelMean(RSSI) (dBm)Std(RSSI) ± dBMean(SNR) (dB)Std(SNR) ± dBPackets Received
GW1-0−110.0±4.08−8.05±5.481310
GW1-1−112.7±4.162.98±3.671914
GW1-2−118.3±2.990.39±3.261331
GW2-0−96.6±4.49−8.90±5.171984
GW2-1−107.9±3.424.35±3.201893
GW2-2−110.9±3.625.16±2.001897
Table 6. Deduplication And gateway statistics.
Total Packets Received (from Table 4)5828 + 157 (5985)
gateway_count:24206
gateway_count:11917
Deduplication Errors138
Packets Received by both GW4344
Packets only received by GW1211
Packets only received by GW21430
Backhaul network latency GW1, mean & std209 ms, ±27 ms
Backhaul network latency GW2, mean & std203 ms, ±88 ms
Table 7. The probability of Signal Interference for LoRA Uplink and Downlink Mandatory Channels.
Measurement AreaFigure868.0–868.6 MHz869.4–869.65 MHz
GCU297.3%4.8%
George Square313.2%0%
Kelvingrove Park464.9%49.7%
Buchanan Bus Station50%0%
Rottenrow Garden651%54%
Publisher’s Note: MDPI stays neutral with regard to jurisdictional claims in published maps and institutional affiliations.

