
On the Optimization of Self-Organization and Self-Management Hardware Resource Allocation for Heterogeneous Clouds

 , , and
Abstract
:1. Introduction
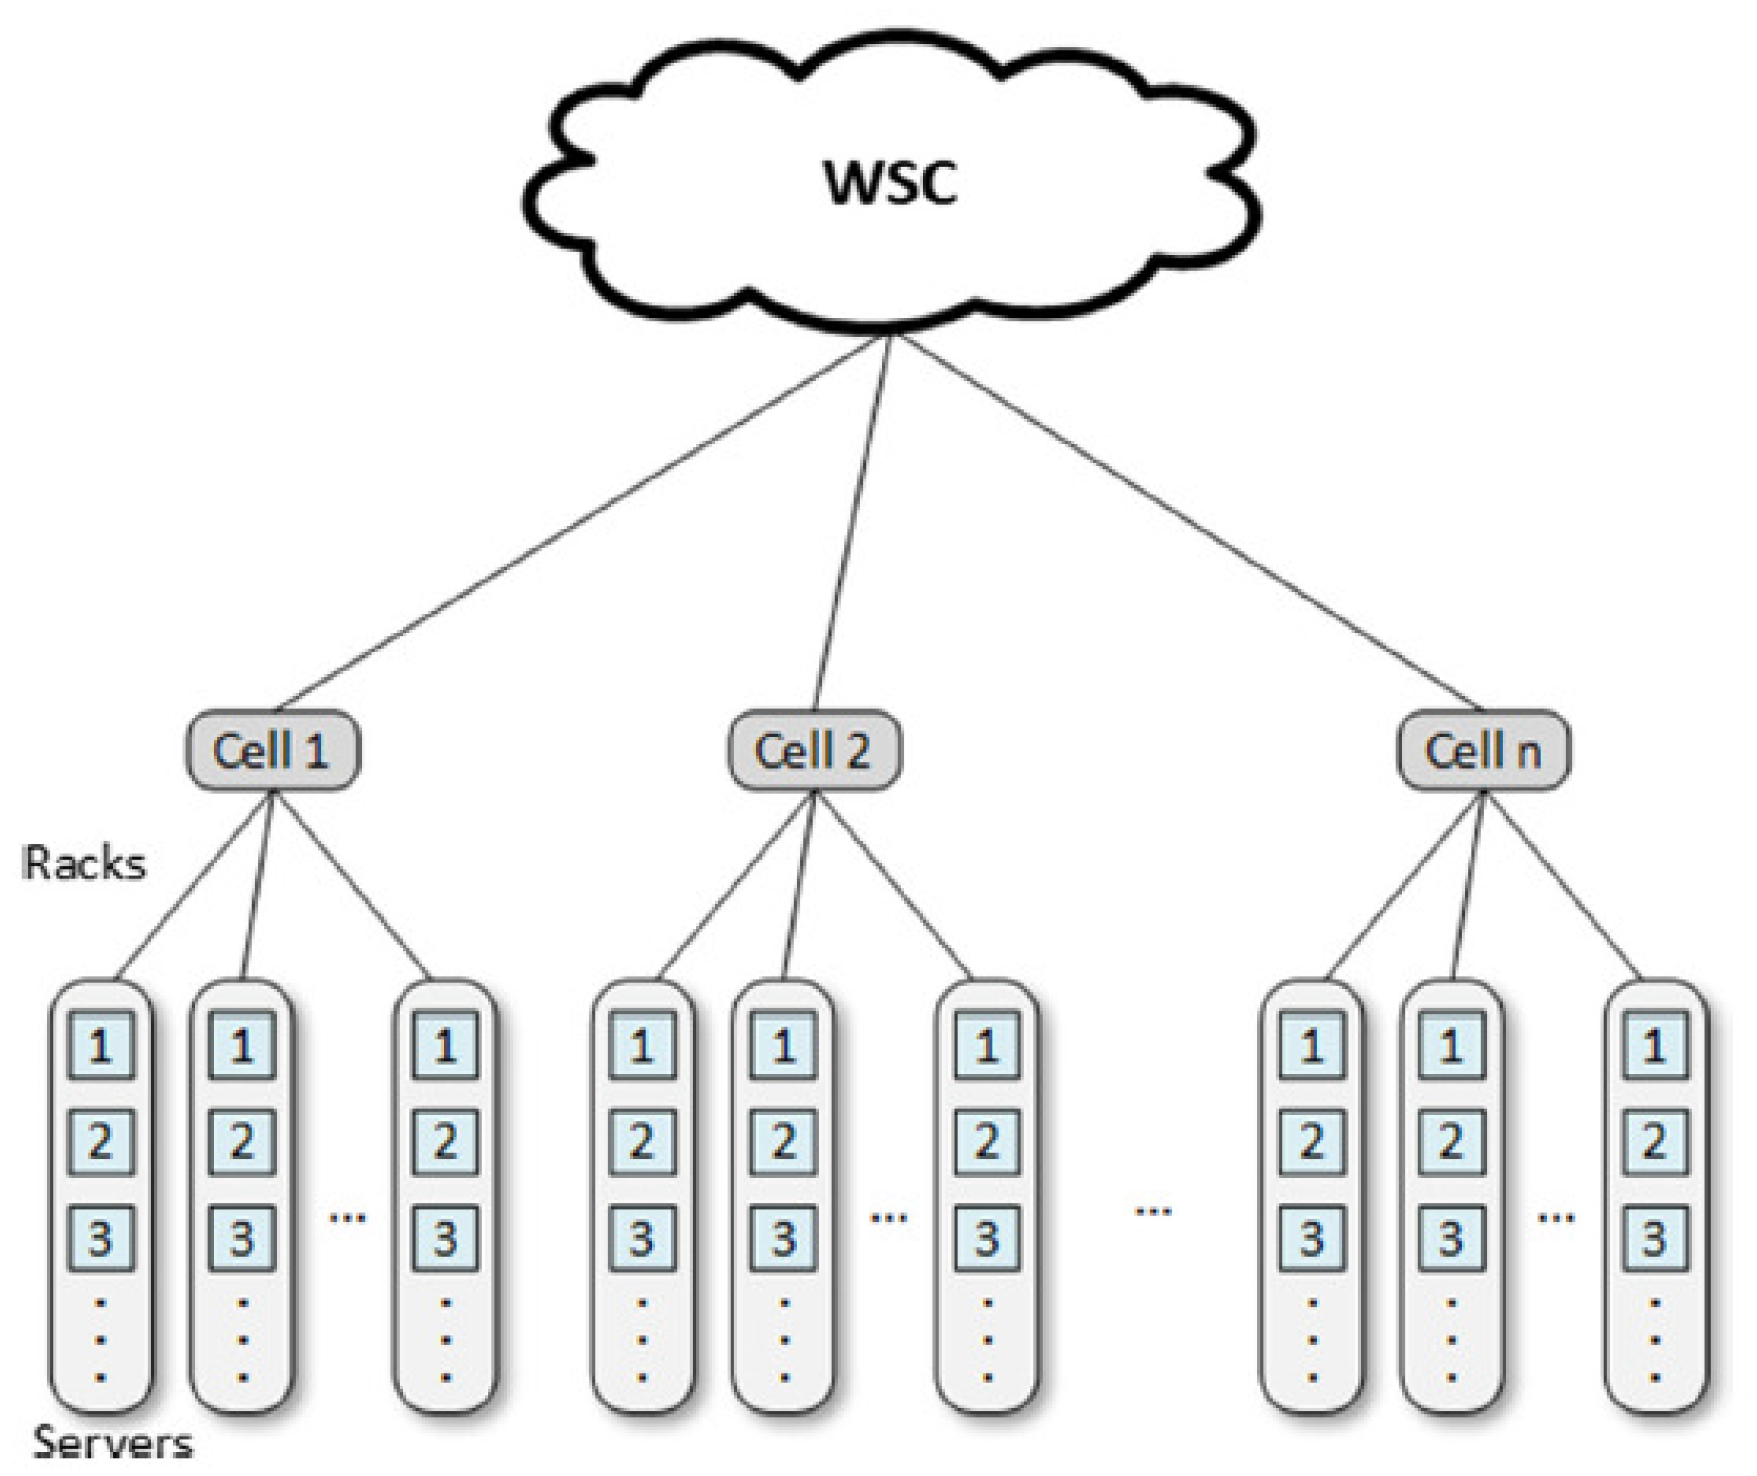
2. Background
2.1. Resource Management in Cloud Computing
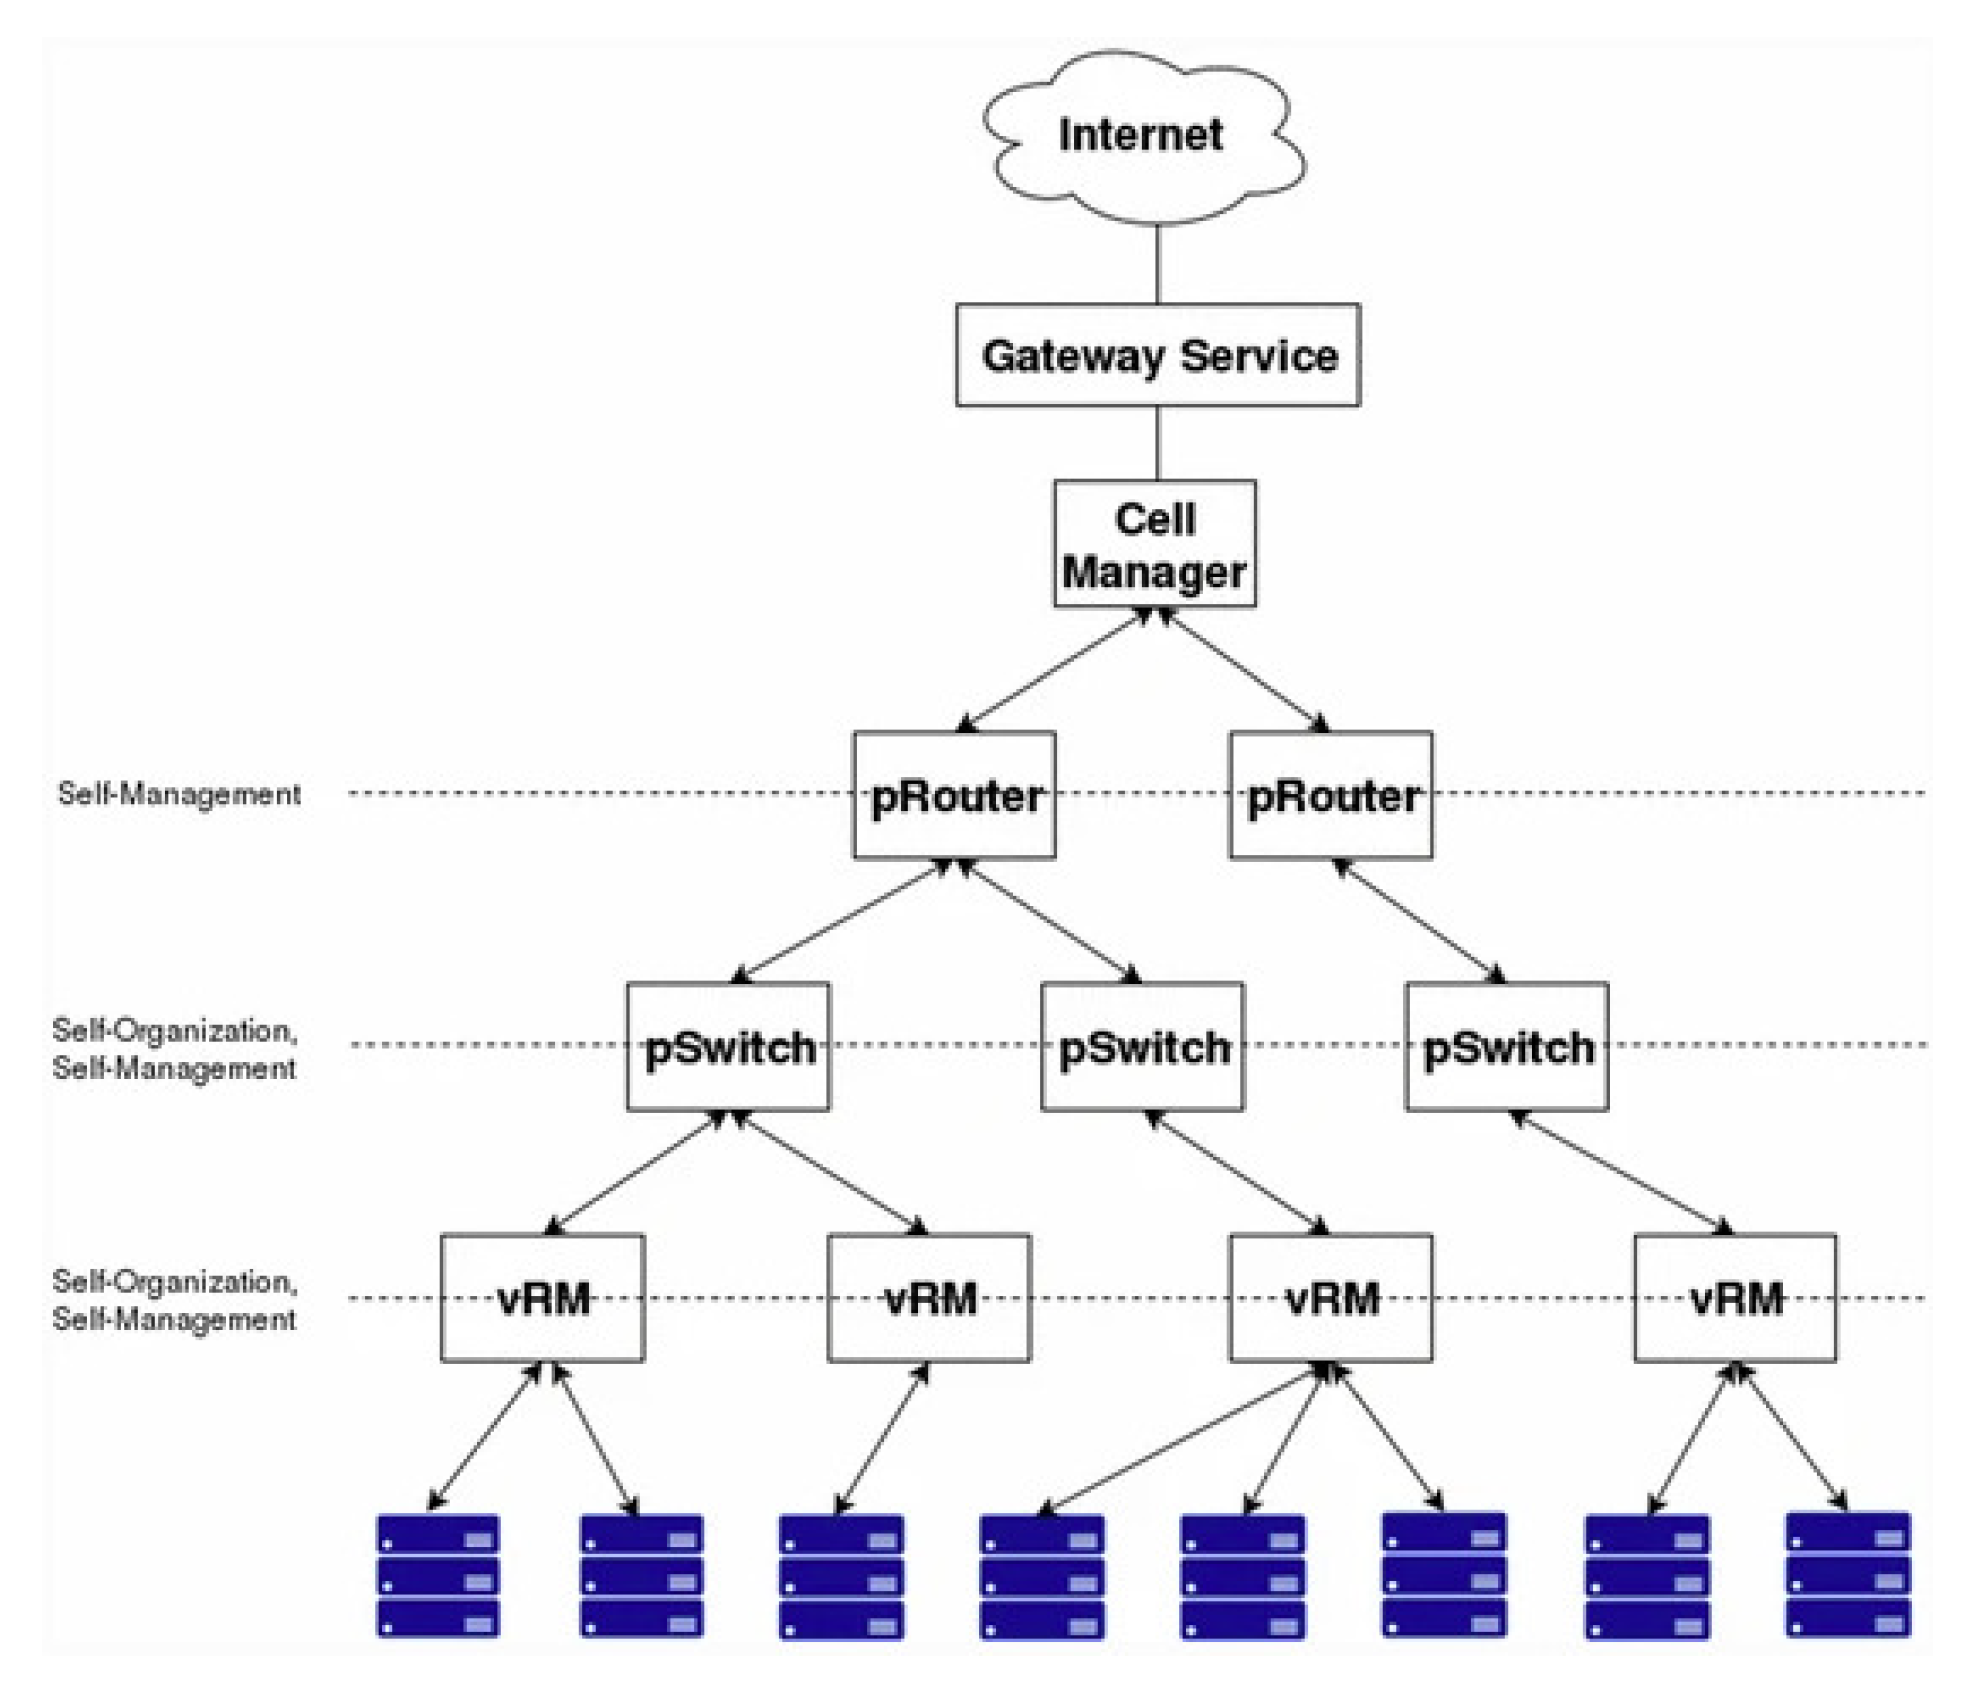
2.2. Resource Management with Self-Organization and Self-Management Strategies
2.3. Simulation Framework
3. Improved Assessment Function and Suitability Index
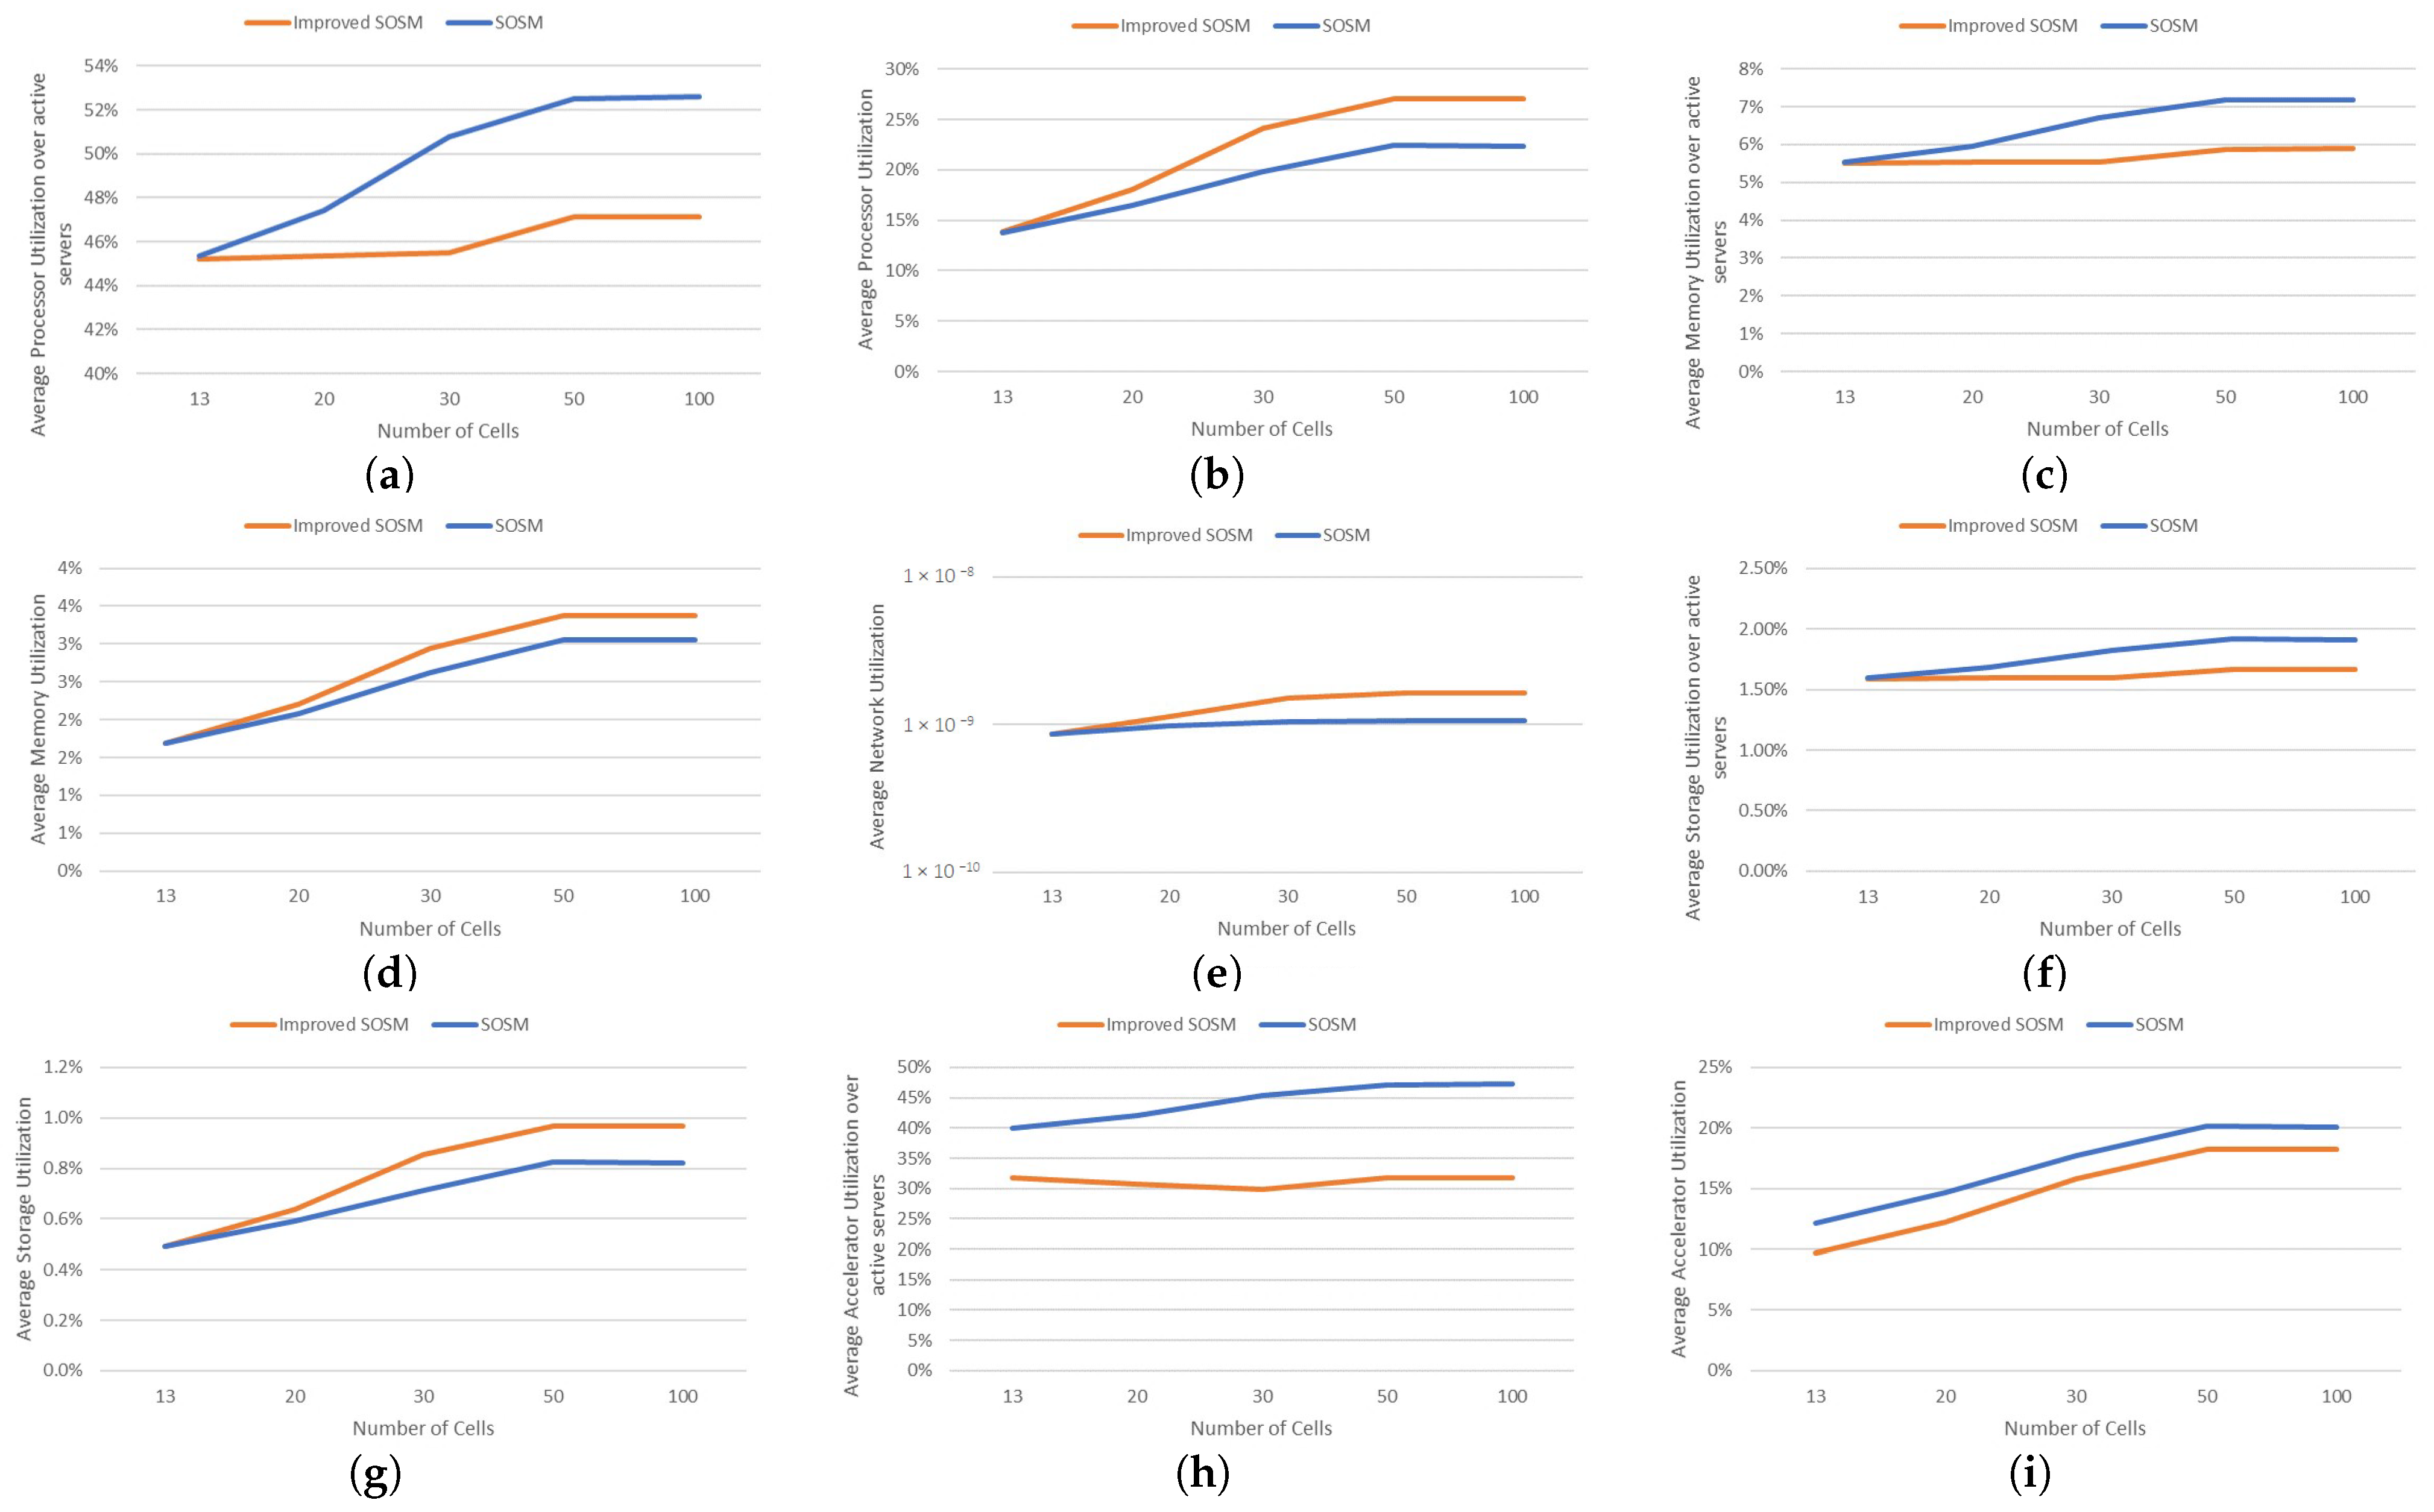
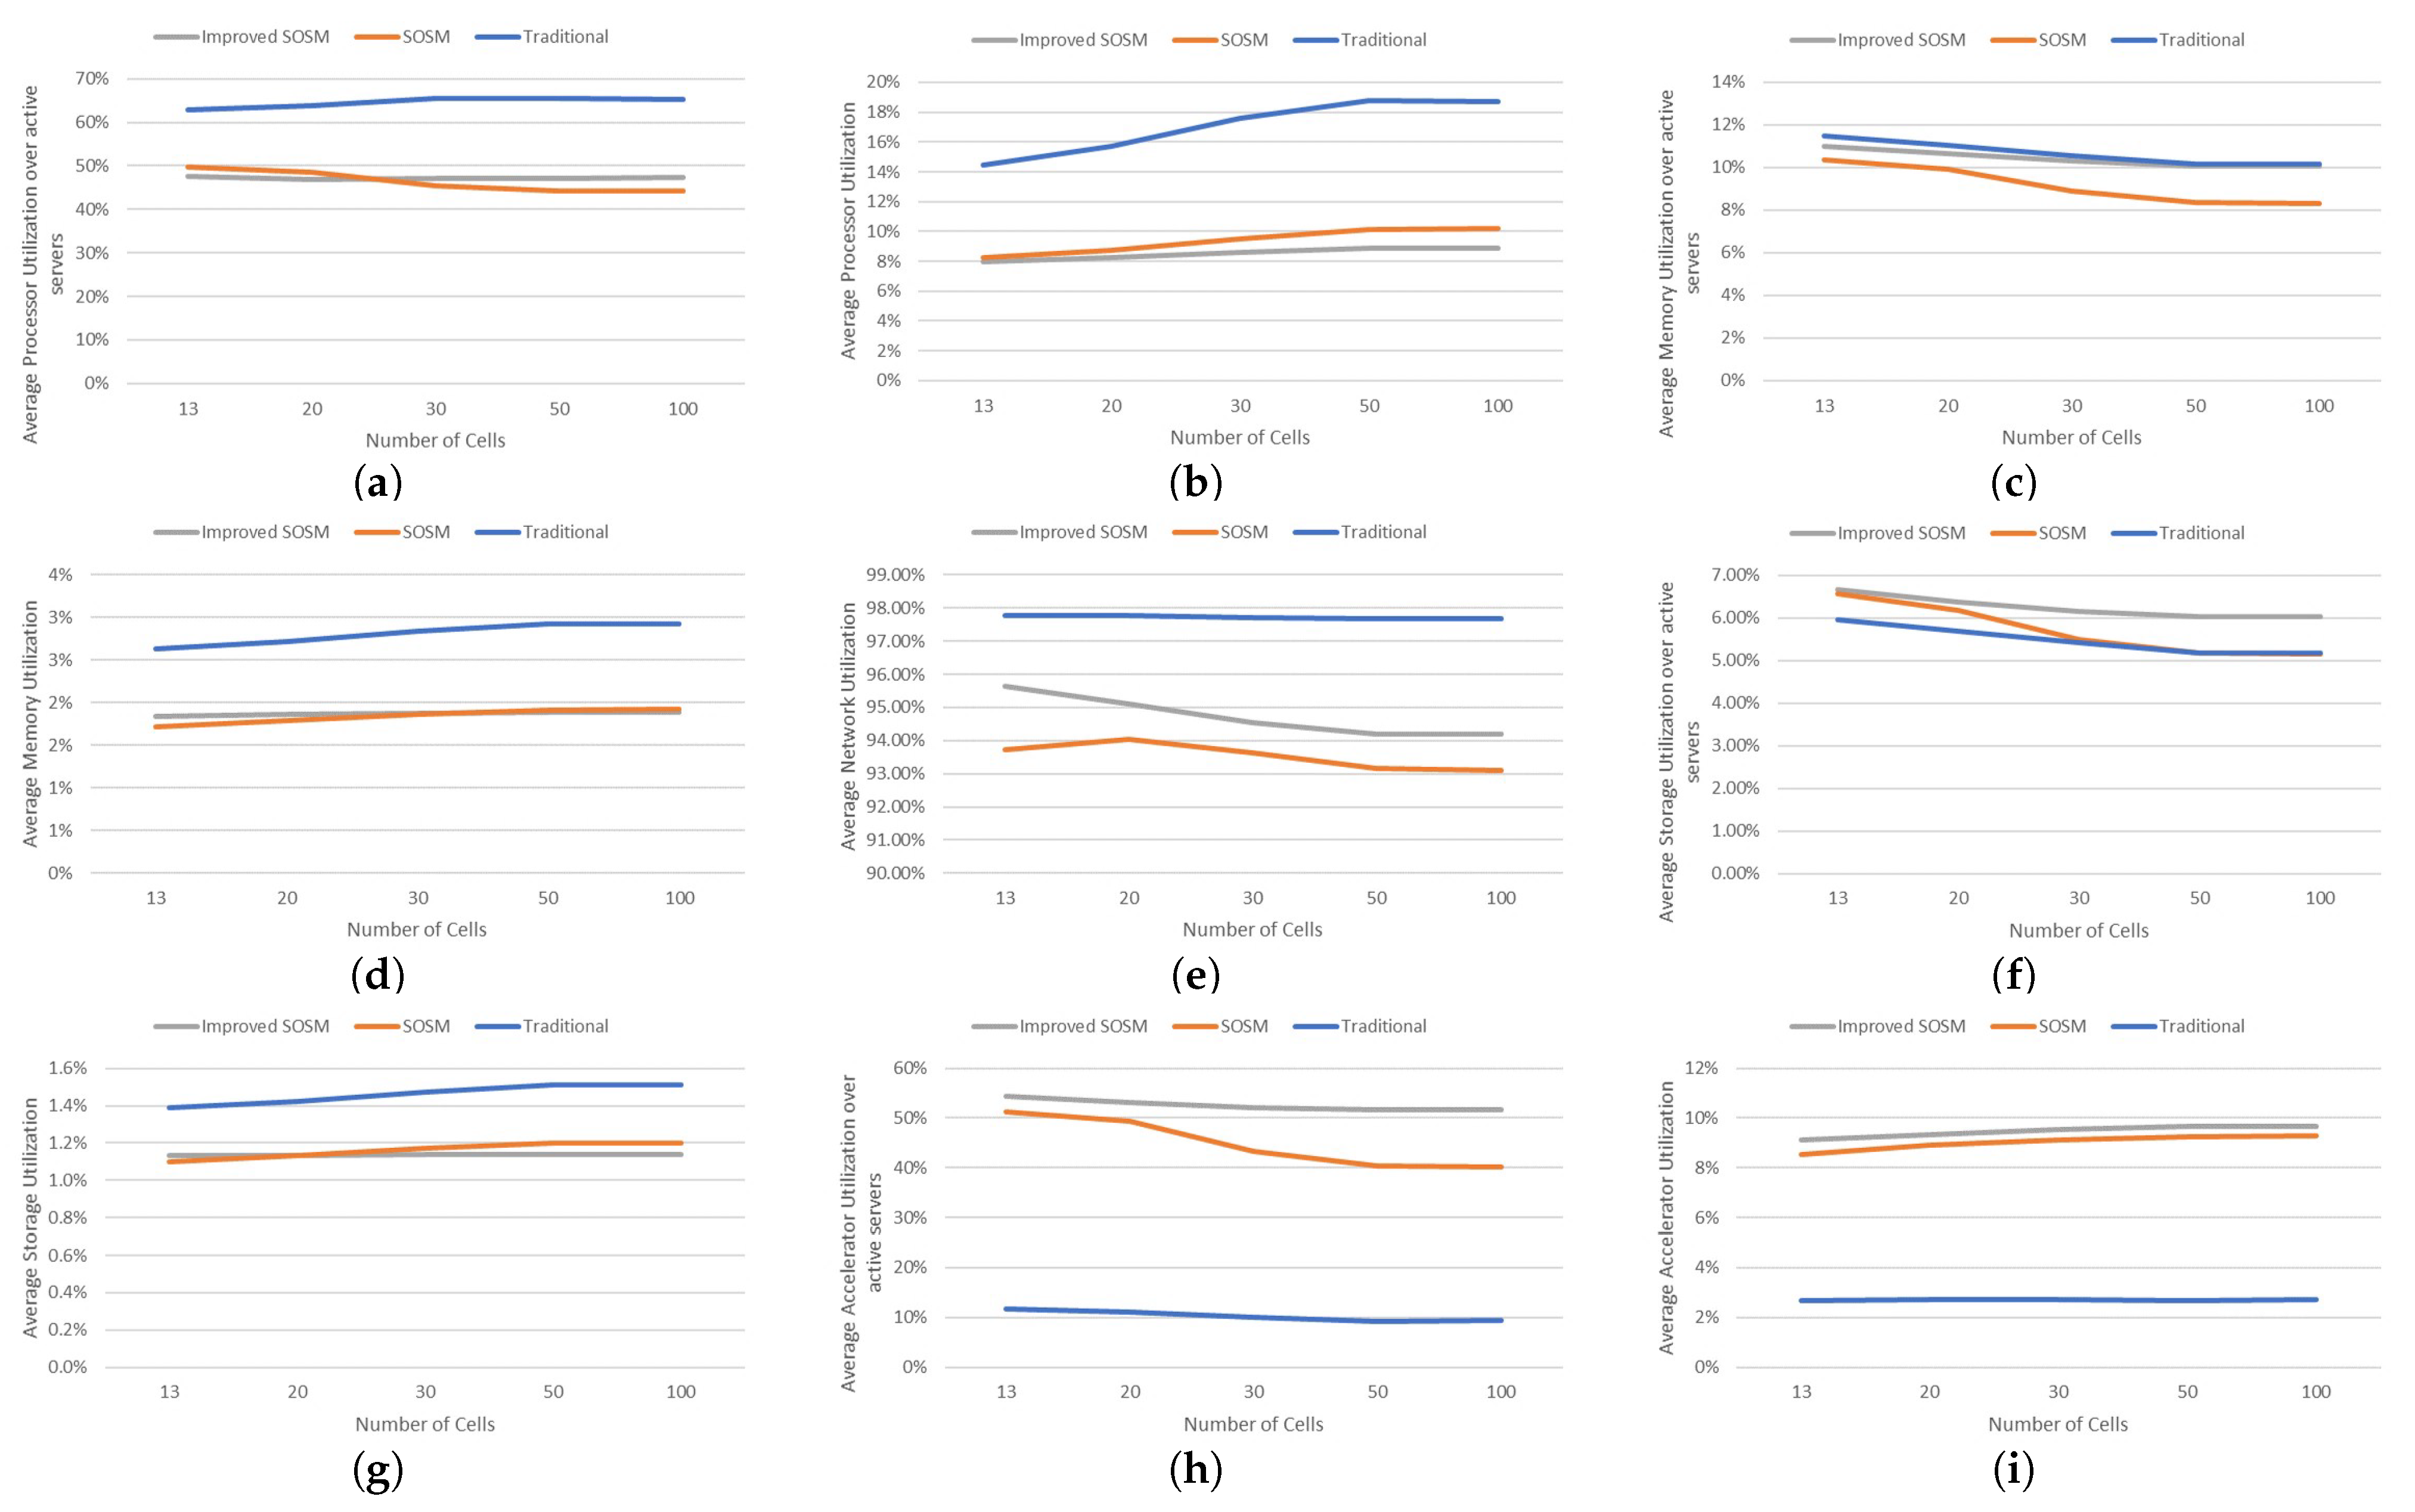
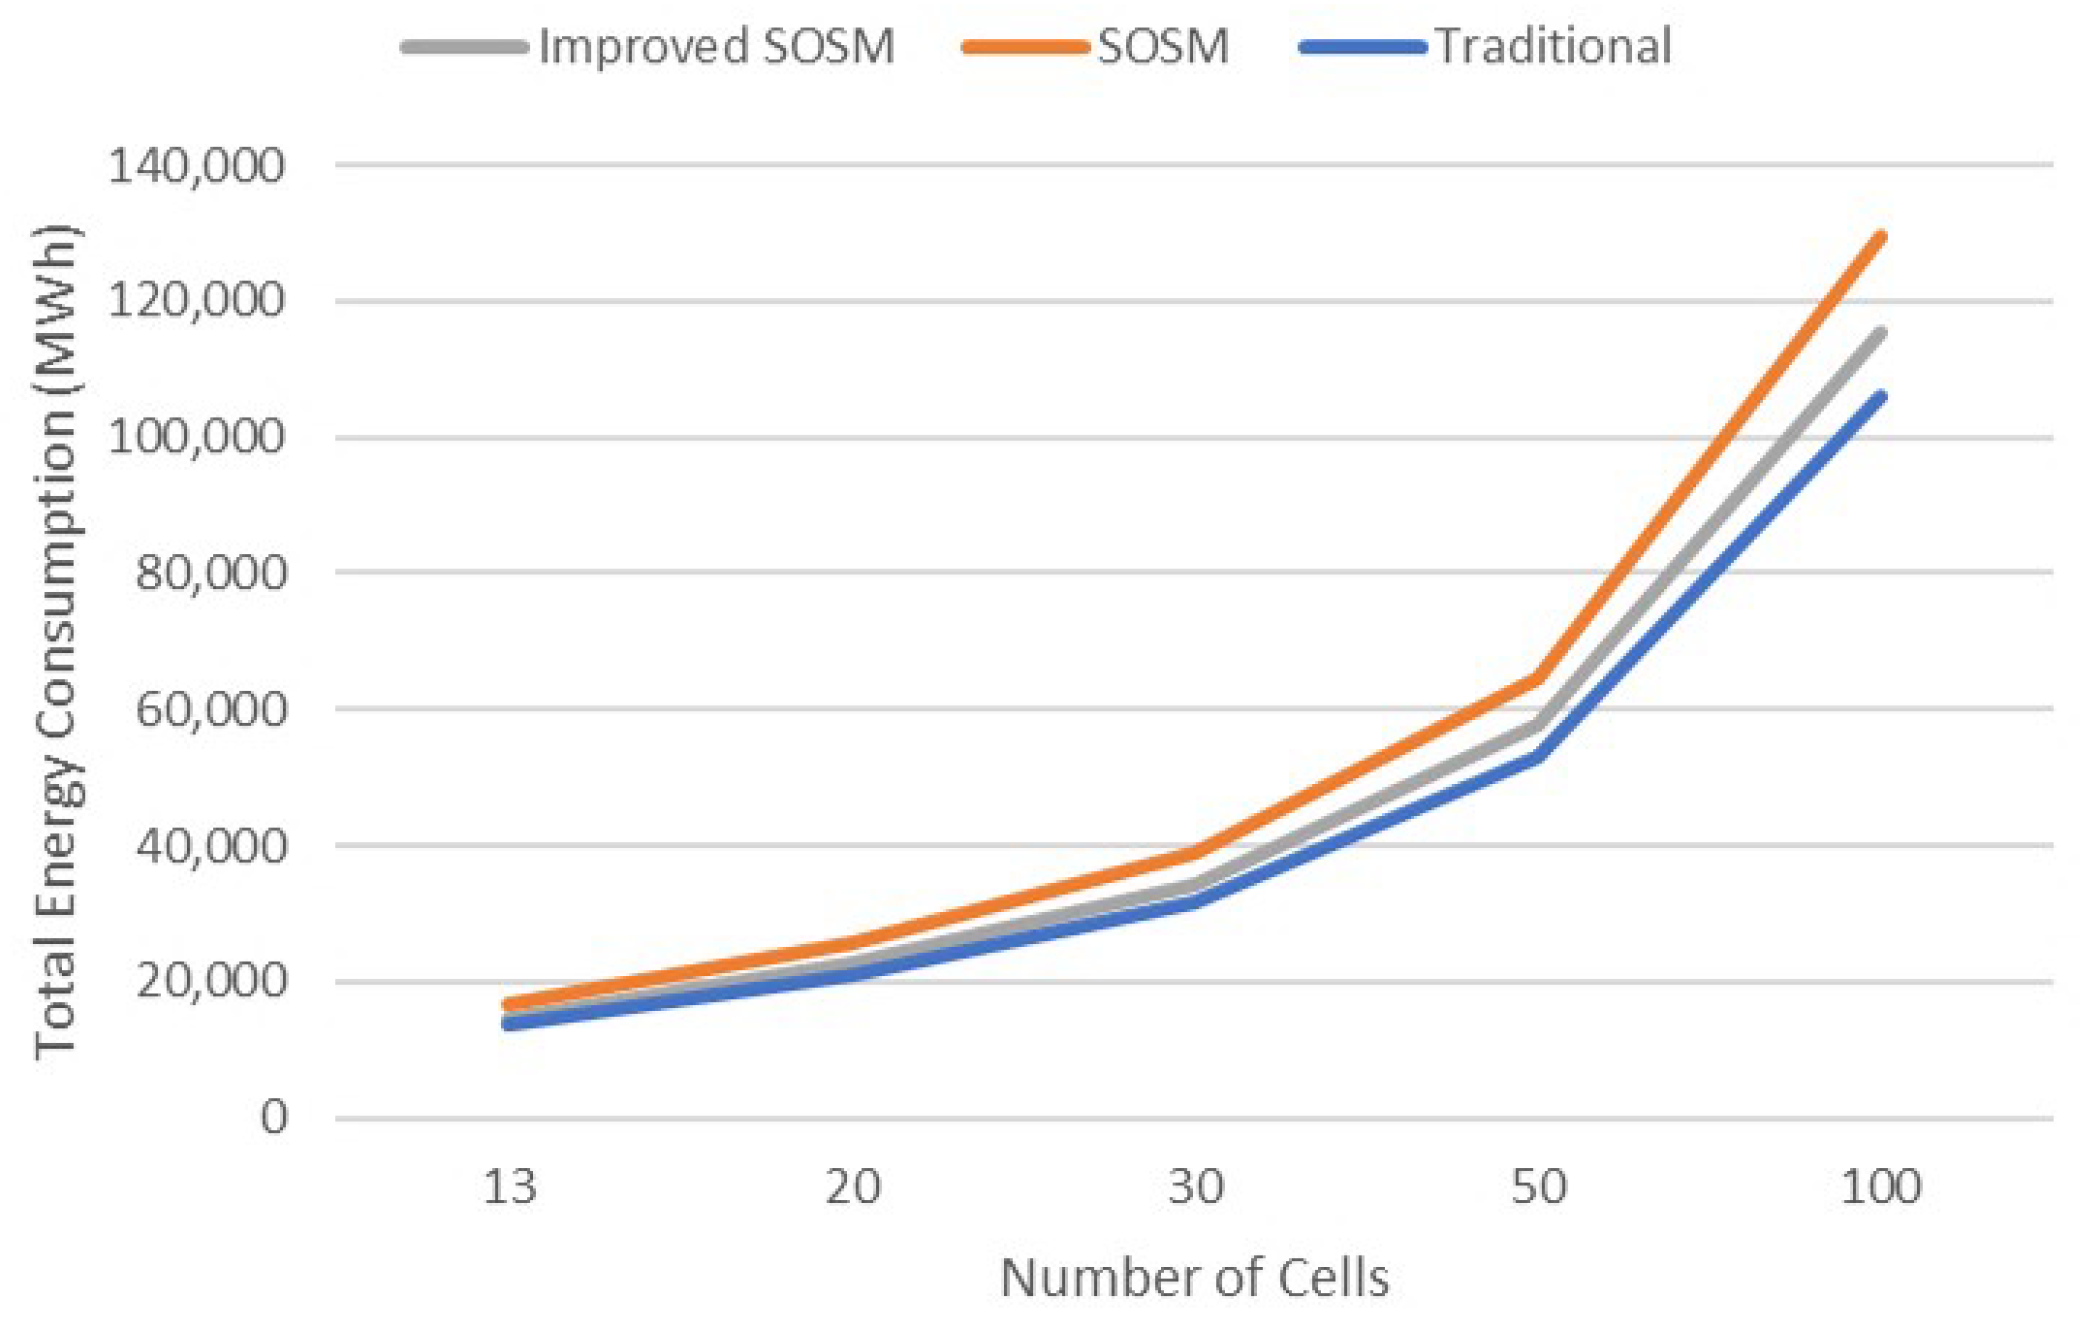
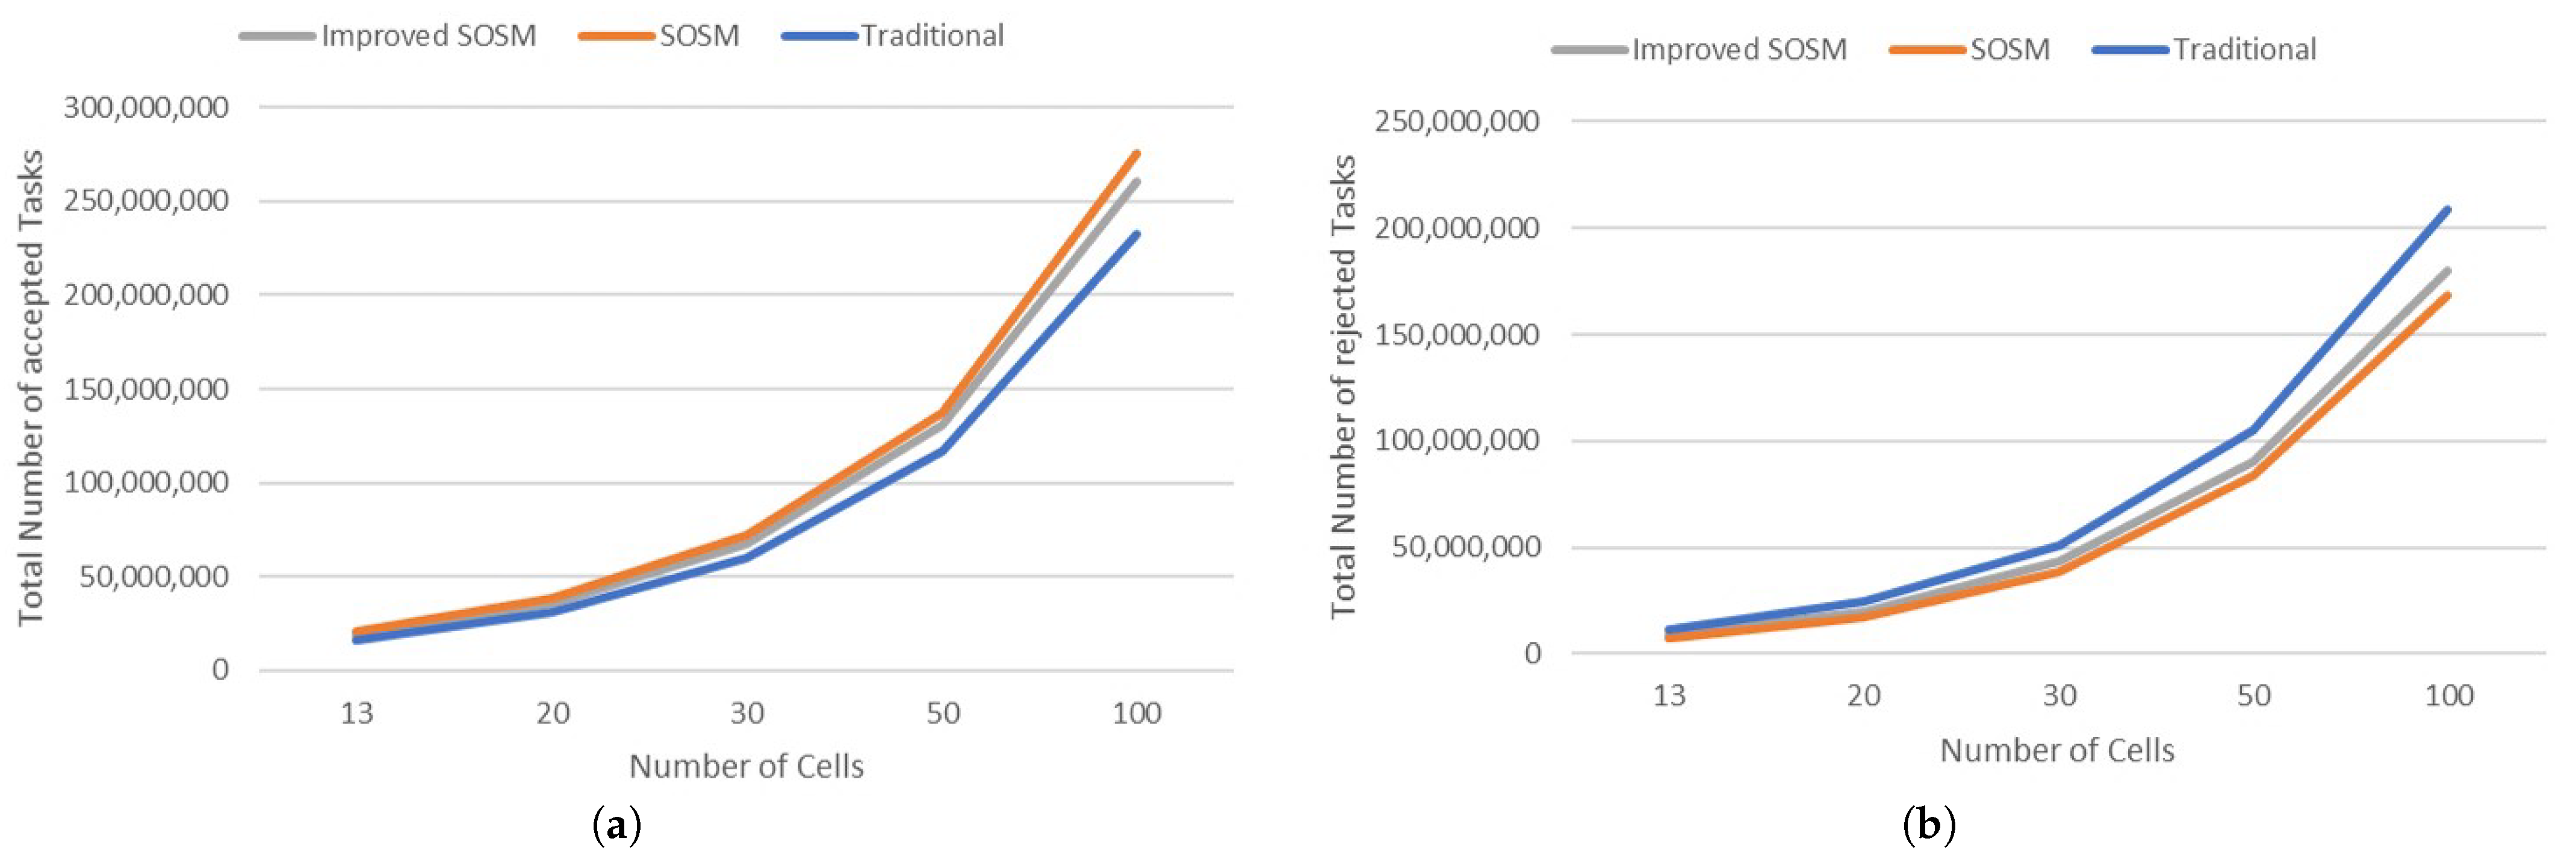
4. Numerical Results
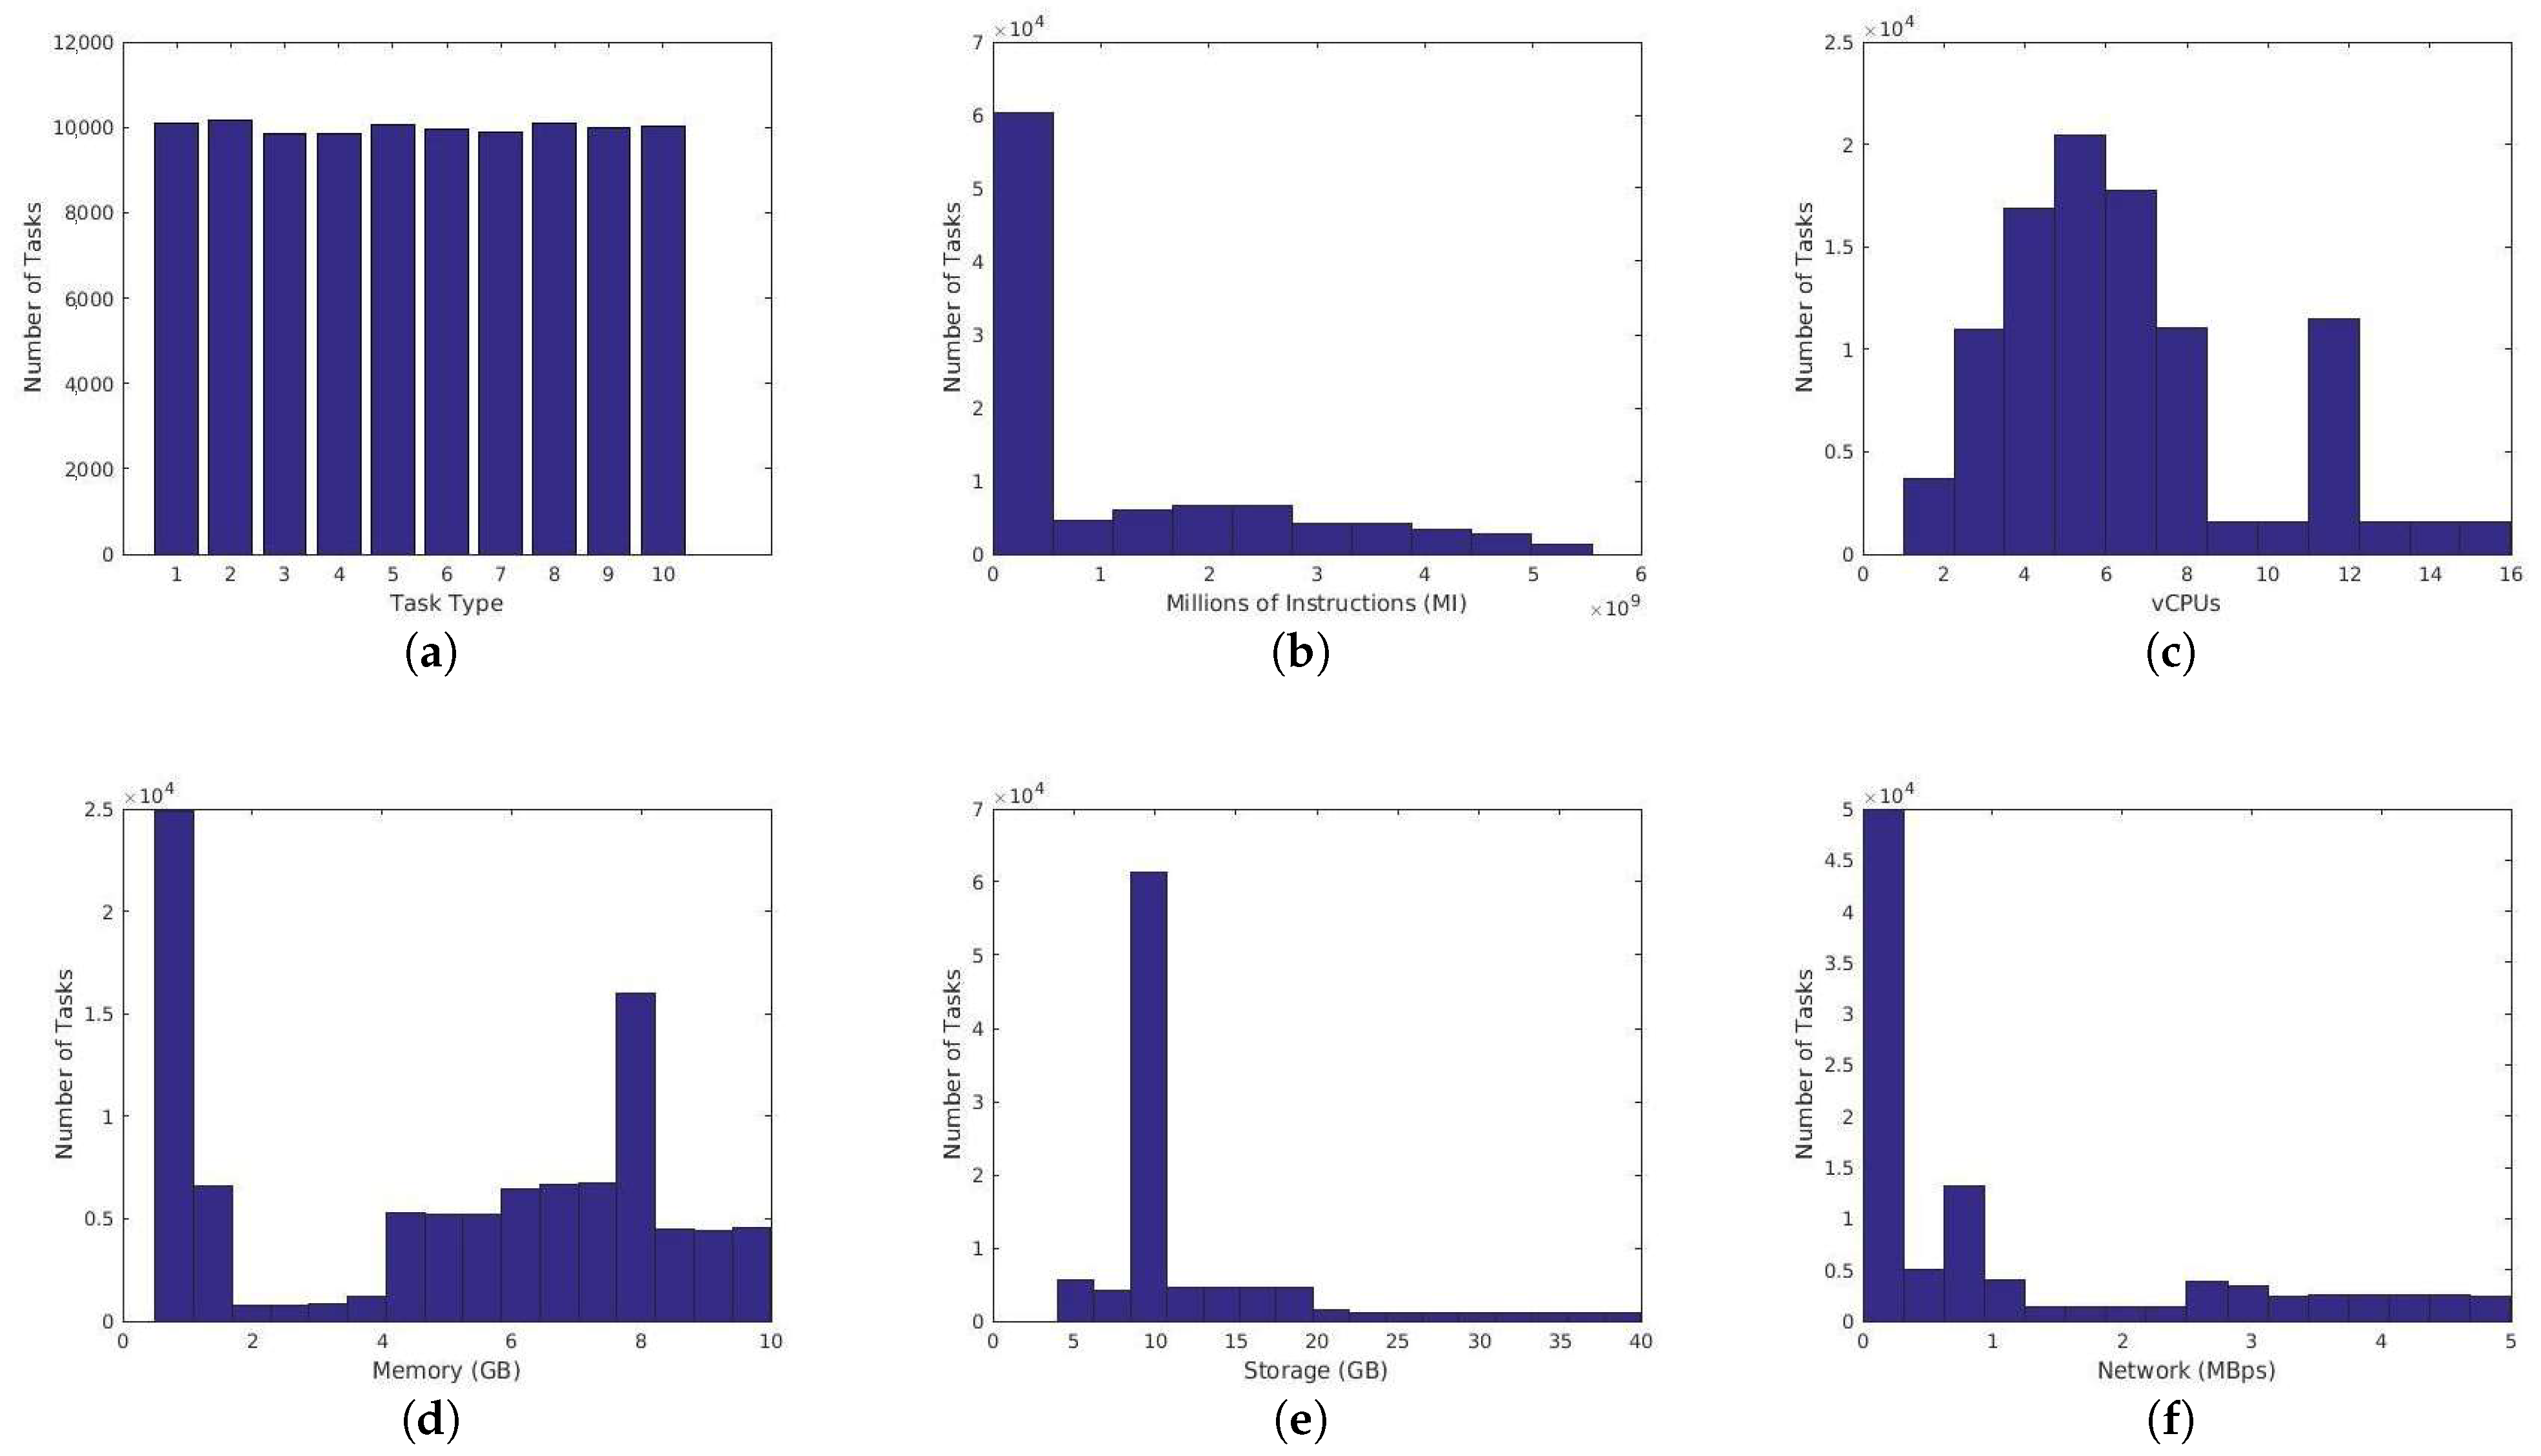
4.1. Evaluation Framework and Setup
4.2. Real-World HPC Applications
4.3. Synthetic Applications
5. Discussion and Conclusions
Author Contributions
Funding
Institutional Review Board Statement
Informed Consent Statement
Data Availability Statement
Acknowledgments
Conflicts of Interest
Abbreviations
| A2LB | Agent Based Load Balancing Algorithm |
| CL | CloudLightning |
| CPU | Central Processing Unit |
| DDPG | Deep Deterministic Policy Gradient |
| DRL | Deep Reinforcement Learning |
| E2C | Edge to Cloud Continuum |
| FPGAs | Field Programmable Gate Arrays |
| GPUs | Graphics Processing Units |
| HPC | High Performance Computing |
| LSTM | Long Short-Term memory |
| MICs | Many Integrated Cores |
| MIPS | Million Instructions per Second |
| MPI | Message Passing Interface |
| QoS | Quality of Service |
| RL | Reinforcement Learning |
| SI | Suitability Index |
| SLA | Service Level Agreement |
| SOSM | Self-Organization and Self-Management |
| WSC | Warehouse Scale Computer |
References
- Bittencourt, L.; Immich, R.; Sakellariou, R.; Fonseca, N.; Madeira, E.; Curado, M.; Villas, L.; DaSilva, L.; Lee, C.; Rana, O. The Internet of Things, Fog and Cloud continuum: Integration and challenges. Internet Things 2018, 3–4, 134–155. [Google Scholar] [CrossRef] [Green Version]
- Feng, C.; Wang, Y.; Chen, Q.; Ding, Y.; Strbac, G.; Kang, C. Smart grid encounters edge computing: Opportunities and applications. Adv. Appl. Energy 2021, 1, 100006. [Google Scholar] [CrossRef]
- Hafeez, T.; Xu, L.; Mcardle, G. Edge Intelligence for Data Handling and Predictive Maintenance in IIOT. IEEE Access 2021, 9, 49355–49371. [Google Scholar] [CrossRef]
- Mahmood, A.; Zhang, W.E.; Sheng, Q.Z. Software-Defined Heterogeneous Vehicular Networking: The Architectural Design and Open Challenges. Future Internet 2019, 11, 70. [Google Scholar] [CrossRef] [Green Version]
- Liu, Y.; Peng, M.; Shou, G.; Chen, Y.; Chen, S. Toward Edge Intelligence: Multiaccess Edge Computing for 5G and Internet of Things. IEEE Internet Things J. 2020, 7, 6722–6747. [Google Scholar] [CrossRef]
- Wu, H.; Zhang, Z.; Guan, C.; Wolter, K.; Xu, M. Collaborate Edge and Cloud Computing with Distributed Deep Learning for Smart City Internet of Things. IEEE Internet Things J. 2020, 7, 8099–8110. [Google Scholar] [CrossRef]
- Wang, J.; Li, D. Adaptive Computing Optimization in Software-Defined Network-Based Industrial Internet of Things with Fog Computing. Sensors 2018, 18, 2509. [Google Scholar] [CrossRef] [PubMed] [Green Version]
- Marinescu, D.C. Complex Systems and Clouds: A Self-Organization and Self-Management Perspective; Morgan Kaufmann: Burlington, MA, USA, 2016. [Google Scholar]
- Puviani, M.; Frei, R. Self-management for cloud computing. In Proceedings of the 2013 Science and Information Conference, London, UK, 7–9 October 2013; pp. 940–946. [Google Scholar]
- Puviani, M.; Cabri, G.; Zambonelli, F. A Taxonomy of Architectural Patterns for Self-Adaptive Systems. In Proceedings of the International C* Conference on Computer Science and Software Engineering, C3S2E ’13, Porto, Portugal, 10–12 July 2013; Association for Computing Machinery: New York, NY, USA, 2013; pp. 77–85. [Google Scholar] [CrossRef]
- Tomar, R.; Khanna, A.; Bansal, A.; Fore, V. An Architectural View Towards Autonomic Cloud Computing. In Data Engineering and Intelligent Computing; Satapathy, S.C., Bhateja, V., Raju, K.S., Janakiramaiah, B., Eds.; Springer: Singapore, 2018; pp. 573–582. [Google Scholar]
- Singh, S.; Chana, I. QoS-Aware Autonomic Resource Management in Cloud Computing: A Systematic Review. ACM Comput. Surv. 2015, 48, 1–46. [Google Scholar] [CrossRef]
- Lynn, T.; Xiong, H.; Dong, D.; Momani, B.; Gravvanis, G.; Filelis-Papadopoulos, C.; Elster, A.; Khan, M.M.Z.M.; Tzovaras, D.; Giannoutakis, K.; et al. CLOUDLIGHTNING: A Framework for a Self-organising and Self-managing Heterogeneous Cloud. In Proceedings of the 6th International Conference on Cloud Computing and Services Science, Rome, Italy, 23–25 April 2016; Volume 1, pp. 333–338. [Google Scholar] [CrossRef]
- Xiong, H.; Filelis-Papadopoulos, C.; Dong, D.; Castañé, G.G.; Meyer, S.; Morrison, J.P. Energy-Efficient Servers and Cloud. In Hardware Accelerators in Data Centers; Springer International Publishing: Cham, Switzerland, 2019; pp. 163–180. [Google Scholar] [CrossRef]
- Madni, S.H.; Latiff, M.S.; Coulibaly, Y.; Abdulhamid, S.M. Recent Advancements in Resource Allocation Techniques for Cloud Computing Environment: A Systematic Review. Clust. Comput. 2017, 20, 2489–2533. [Google Scholar] [CrossRef]
- Singh, S.; Chana, I. A survey on resource scheduling in cloud computing: Issues and challenges. J. Grid Comput. 2016, 14, 217–264. [Google Scholar] [CrossRef]
- Yousafzai, A.; Gani, A.; Noor, R.M.; Sookhak, M.; Talebian, H.; Shiraz, M.; Khan, M.K. Cloud resource allocation schemes: Review, taxonomy, and opportunities. Knowl. Inf. Syst. 2017, 50, 347–381. [Google Scholar] [CrossRef]
- Jung, G.; Sim, K.M. Agent-Based Adaptive Resource Allocation on the Cloud Computing Environment. In Proceedings of the 2011 40th International Conference on Parallel Processing Workshops, Taipei City, Taiwan, 13–16 September 2011; pp. 345–351. [Google Scholar] [CrossRef]
- Singh, A.; Juneja, D.; Malhotra, M. Autonomous Agent Based Load Balancing Algorithm in Cloud Computing. Procedia Comput. Sci. 2015, 45, 832–841. [Google Scholar] [CrossRef] [Green Version]
- Zhang, J.; Xie, N.; Zhang, X.; Yue, K.; Li, W.; Kumar, D. Machine Learning Based Resource Allocation of Cloud Computing in Auction. Comput. Mater. Contin. 2018, 56, 123–135. [Google Scholar] [CrossRef]
- Thein, T.; Myo, M.M.; Parvin, S.; Gawanmeh, A. Reinforcement learning based methodology for energy-efficient resource allocation in cloud data centers. J. King Saud Univ. Comput. Inf. Sci. 2020, 32, 1127–1139. [Google Scholar] [CrossRef]
- Bitsakos, C.; Konstantinou, I.; Koziris, N. DERP: A Deep Reinforcement Learning Cloud System for Elastic Resource Provisioning. In Proceedings of the 2018 IEEE International Conference on Cloud Computing Technology and Science (CloudCom), Nicosia, Cyprus, 10–13 December 2018; pp. 21–29. [Google Scholar] [CrossRef]
- Liu, N.; Li, Z.; Xu, J.; Xu, Z.; Lin, S.; Qiu, Q.; Tang, J.; Wang, Y. A Hierarchical Framework of Cloud Resource Allocation and Power Management Using Deep Reinforcement Learning. In Proceedings of the 2017 IEEE 37th International Conference on Distributed Computing Systems (ICDCS), Atlanta, GA, USA, 5–8 June 2017; pp. 372–382. [Google Scholar] [CrossRef] [Green Version]
- Du, B.; Wu, C.; Huang, Z. Learning Resource Allocation and Pricing for Cloud Profit Maximization. In Proceedings of the Thirty-Third AAAI Conference on Artificial Intelligence (AAAI-19), Honolulu, HI, USA, 27 January–1 February 2019; Volume 33, pp. 7570–7577. [Google Scholar] [CrossRef]
- Miriam, A.J.; Saminathan, R.; Chakaravarthi, S. Non-dominated Sorting Genetic Algorithm (NSGA-III) for effective resource allocation in cloud. Evol. Intell. 2021, 14, 759–765. [Google Scholar] [CrossRef]
- Chandran, R.; Kumar, S.R.; Gayathri, N. Genetic algorithm-based tabu search for optimal energy-aware allocation of data center resources. Soft Comput. 2020, 24, 16705–16718. [Google Scholar] [CrossRef]
- Abrol, P.; Guupta, S.; Singh, S. Nature-inspired metaheuristics in cloud: A review. In ICT Systems and Sustainability; Springer: Singapore, 2020; pp. 13–34. [Google Scholar]
- Xiong, H.; Filelis-Papadopoulos, C.; Castañe, G.G.; Dong, D.; Morrison, J.P. Self-Organising, Self-Managing Frameworks and Strategies. In Heterogeneity, High Performance Computing, Self-Organization and the Cloud; Palgrave Macmillan: Cham, Switzerland, 2018; pp. 63–88. [Google Scholar]
- Barroso, L.A.; Clidaras, J.; Holzle, U. The Datacenter as a Computer: An Introduction to the Design of Warehouse-Scale Machines, Second edition. Synth. Lect. Comput. Archit. 2013, 8, 1–154. [Google Scholar] [CrossRef] [Green Version]
- Filelis-Papadopoulos, C.K.; Giannoutakis, K.M.; Gravvanis, G.A.; Tzovaras, D. Large-scale simulation of a self-organizing self-management cloud computing framework. J. Supercomput. 2018, 74, 530–550. [Google Scholar] [CrossRef]
- Filelis-Papadopoulos, C.; Xiong, H.; Spătaru, A.; Castañé, G.G.; Dong, D.; Gravvanis, G.A.; Morrison, J.P. A Generic Framework Supporting Self-Organisation and Self-Management in Hierarchical Systems. In Proceedings of the 2017 16th International Symposium on Parallel and Distributed Computing (ISPDC), Innsbruck, Austria, 3–6 July 2017; pp. 149–156. [Google Scholar] [CrossRef]
- Giannoutakis, K.M.; Filelis-Papadopoulos, C.K.; Gravvanis, G.A.; Tzovaras, D. Evaluation of self-organizing and self-managing heterogeneous high performance computing clouds through discrete-time simulation. Concurr. Comput. Pract. Exp. 2021, 33, e6326. [Google Scholar] [CrossRef]
- Senyo, P.K.; Addae, E.; Boateng, R. Cloud computing research: A review of research themes, frameworks, methods and future research directions. Int. J. Inf. Manag. 2018, 38, 128–139. [Google Scholar] [CrossRef] [Green Version]
- Lynn, T.; Gourinovitch, A.; Byrne, J.; Byrne, P.J.; Svorobej, S.; Giannoutakis, K.; Kenny, D.; Morrison, J. A Preliminary Systematic Review of Computer Science Literature on Cloud Computing Research using Open Source Simulation Platforms. In Proceedings of the 7th International Conference on Cloud Computing and Services Science—CLOSER, Porto, Portugal, 24–26 April 2017; pp. 565–573. [Google Scholar] [CrossRef]
- Giannoutakis, K.M.; Makaratzis, A.T.; Tzovaras, D.; Filelis-Papadopoulos, C.K.; Gravvanis, G.A. On the Power Consumption Modeling for the Simulation of Heterogeneous HPC Clouds. In Proceedings of the 1st International Workshop on Next Generation of Cloud Architectures, Belgrade, Serbia, 23–26 April 2017; Association for Computing Machinery: New York, NY, USA, 2017. [Google Scholar] [CrossRef]
- Makaratzis, A.T.; Khan, M.M.; Giannoutakis, K.M.; Elster, A.C.; Tzovaras, D. GPU Power Modeling of HPC Applications for the Simulation of Heterogeneous Clouds. In Parallel Processing and Applied Mathematics; Wyrzykowski, R., Dongarra, J., Deelman, E., Karczewski, K., Eds.; Springer International Publishing: Cham, Switzerland, 2018; pp. 91–101. [Google Scholar]
- Khan, M.; Becker, T.; Kuppuudaiyar, P.; Elster, A.C. Container-Based Virtualization for Heterogeneous HPC Clouds: Insights from the EU H2020 CloudLightning Project. In Proceedings of the 2018 IEEE International Conference on Cloud Engineering (IC2E), Orlando, FL, USA, 17–20 April 2018; pp. 392–397. [Google Scholar] [CrossRef]
- Dell PowerEdge C4130 Data Sheet. Available online: https://i.dell.com/sites/doccontent/shared-content/data-sheets/en/Documents/Dell-PowerEdge-C4130-Spec-Sheet.pdf (accessed on 3 November 2021).
- Nvidia Tesla P100 Data Sheet. Available online: https://images.nvidia.com/content/tesla/pdf/nvidia-tesla-p100-PCIe-datasheet.pdf (accessed on 3 November 2021).
- Intel Xeon Phi 5110P Data Sheet. Available online: https://www.intel.com/content/dam/www/public/us/en/documents/datasheets/xeon-phi-coprocessor-datasheet.pdf (accessed on 3 November 2021).
- MPC-X Data Sheet. Available online: https://www.maxeler.com/products/mpc-xseries/ (accessed on 3 November 2021).


| Notation | Description |
|---|---|
| Total MIPS of a pRouter | |
| Computational capability of a computational virtual core in MIPS | |
| Total number of virtual cores of all servers hosted under a pRouter | |
| The computational capability of an accelerator in MIPS | |
| The number of accelerators of all hosted under a pRouter | |
| The power consumption of all servers hosted by a pRouter | |
| The idle power consumption of a virtual core | |
| The maximum power consumption of a virtual core | |
| The idle power consumption of an accelerator | |
| The maximum power consumption of an accelerator | |
| The available virtual cores | |
| The available accelerators | |
| The assessment function describing performance per Watt | |
| The Suitability Index | |
| The number of virtual cores required by an incoming task | |
| The number of accelerators required by an incoming task | |
| The performance of a CPU based implementation | |
| The performance of the accelerator based implementation | |
| The energy consumption of a CPU based implementation | |
| The energy consumption of an accelerator based implementation | |
| The power consumption of the CPU based implementation at time t | |
| The power consumption of the accelerator based implementation at time t | |
| The average power consumption of | |
| The average power consumption of | |
| The benefit on the execution time of application by utilizing accelerators | |
| The total number of requested cores | |
| The total number of requested accelerators |
| Instance No. | Available Implementations | Supported vCPUs | Required Memory (GB) | Required Storage (GB) |
|---|---|---|---|---|
| 1 | CPU/CPU + GPU | 1, 2, 4, 8, 12 | 0.5 | 10 |
| 2 | CPU/CPU + FPGA | 1, 2, 4, 8, 12 | 1.0 | 10 |
| 3 | CPU/CPU + MIC | 1, 2, 4, 8, 12 | 2.0 | 10 |
| 4 | CPU/CPU + MIC | 1, 2, 4, 8, 12 | 4.0 | 10 |
| 5 | CPU/CPU + MIC | 1, 2, 4, 8, 12 | 8.0 | 10 |
| Hardware Type | Model | Characteristics | MIPS |
|---|---|---|---|
| CPU | Dell PowerEdge C4120 [38] | 2 Intel Xeon E5-2630 v4 Processors (20 cores, 40 threads, 2.20 GHz), HT disabled, 128 GB RAM, 1024 GB HDD | 88,000.80 MIPS |
| GPU | Nvidia Tesla P100 [39] | 3584 cores | 587,505.34 MIPS |
| MIC | Intel Xeon Phi 5110P [40] | 4 Xeon Phi cards | 507,494.40 MIPS |
| FPGA | MPC-X [41] | 8 MAX4 cards | 295,959.30 MAOPS (similarly treated to MIPS for simplicity) |
| Maximum Tasks per Second | |||||||
|---|---|---|---|---|---|---|---|
| 20 | 40 | 60 | 80 | 160 | 320 | 640 | |
| Total Energy Consumption (MWh) | 12,702.60 | 12,726.03 | 12,749.24 | 12,772.45 | 12,866.64 | 13,054.60 | 13,429.17 |
| Total Number of submitted Tasks | 864,970 | 1,732,851 | 2,593,975 | 3,448,771 | 6,911,275 | 13,832,798 | 27,650,718 |
| Total Number of accepted Tasks | 864,970 | 1,732,851 | 2,593,975 | 3,448,771 | 6,911,275 | 13,832,798 | 27,650,718 |
| Total Number of rejected Tasks | 0 | 0 | 0 | 0 | 0 | 0 | 0 |
| Average Processor Utilization over active servers | 42% | 43.30% | 43.69% | 43.95% | 44.46% | 44.86% | 45.21% |
| Average Processor Utilization | 4.27 % | 8.57 % | 1.28% | 1.71% | 3.43% | 6.90% | 13.84% |
| Average Memory Utilization over active servers | 5.08% | 5.28% | 5.33% | 5.36% | 5.43% | 5.48% | 5.52% |
| Average Memory Utilization | 5.17 % | 1.05 % | 1.57 % | 2.09 % | 4.20 % | 8.43 % | 1.69% |
| Average Network Utilization | 2.68 % | 5.36 % | 8.03 % | 1.07 % | 2.14 % | 4.30 % | 8.65 % |
| Average Storage Utilization over active servers | 1.47% | 1.53% | 1.54% | 1.55% | 1.57% | 1.58% | 1.59% |
| Average Storage Utilization | 1.50 % | 3.02 % | 4.52 % | 6.02 % | 1.21 % | 2.44 % | 4.90 % |
| Average Accelerator Utilization over active servers | 36.85% | 38.13% | 38.49% | 38.73% | 39.16% | 36.63% | 31.82% |
| Average Accelerator Utilization | 3.74 % | 7.55 % | 1.13% | 1.50% | 3.02% | 5.63% | 9.73% |
| Energy consumption (KWh) over number of accepted tasks | 14.686 | 7.344 | 4.915 | 3.703 | 1.862 | 0.944 | 0.486 |
| Number of Cells | |||||
|---|---|---|---|---|---|
| 13 | 20 | 30 | 50 | 100 | |
| Number of incoming tasks per second | 640 | 1280 | 2560 | 5120 | 10,240 |
| Total Energy Consumption (MWh) | 13,429.17 | 21,006.24 | 32,271.12 | 54,679.52 | 109,369.86 |
| Total Number of submitted Tasks | 27,650,718 | 55,319,241 | 111,095,039 | 221,534,173 | 443,504,461 |
| Total Number of accepted Tasks | 27,650,718 | 55,319,241 | 111,045,068 | 217,671,730 | 435,682,990 |
| Total Number of rejected Tasks | 0 | 0 | 49,971 | 3,862,443 | 7,821,471 |
| Average Processor Utilization over active servers | 45.21% | 45.33% | 45.51% | 47.13% | 47.15% |
| Average Processor Utilization | 13.84% | 18.01% | 24.09% | 27.03% | 27.05% |
| Average Memory Utilization over active servers | 5.52% | 5.53% | 5.55% | 5.88% | 5.89% |
| Average Memory Utilization | 1.69% | 2.20% | 2.94% | 3.38% | 3.38% |
| Average Network Utilization | 8.65 % | 1.13 % | 1.51 % | 1.62 % | 1.62 % |
| Average Storage Utilization over active servers | 1.59% | 1.60% | 1.60% | 1.67% | 1.67% |
| Average Storage Utilization | 4.90 % | 6.39 % | 8.56 % | 9.66 % | 9.67 % |
| Average Accelerator Utilization over active servers | 31.82% | 30.71% | 29.84% | 31.80% | 31.83% |
| Average Accelerator Utilization | 9.73% | 12.19% | 15.78% | 18.23% | 18.25% |
| Number of Cells | |||||
|---|---|---|---|---|---|
| Resource Allocation | 13 | 20 | 30 | 50 | 100 |
| SOSM | 100.000% | 97.922% | 94.655% | 92.563% | 92.604% |
| Improved SOSM | 100.000% | 100.000% | 99.955% | 98.257% | 98.236% |
| Number of Cells | |||||
|---|---|---|---|---|---|
| Resource Allocation | 13 | 20 | 30 | 50 | 100 |
| SOSM | 0.486 | 0.387 | 0.307 | 0.266 | 0.266 |
| Improved SOSM | 0.486 | 0.380 | 0.291 | 0.251 | 0.251 |
| Application | Implementation | Min–Max MIPS | Min–Max VMs | vCPUs per VM | Util. vCPU | Min–Max Mem per VM (GB) | Util. Mem | Min–Max Storage per VM (GB) | Min–Max Network per VM (GBps) | Acc. per VM | |
|---|---|---|---|---|---|---|---|---|---|---|---|
| 1 | CPU | 1,386,228,336.48–5,544,913,345.92 | 1–16 | 4–8 | 1 | 4–8 | 1 | 20–40 | 0.0025–0.005 | 0 | 0 |
| CPU–GPU | 1,386,228,336.48–5,544,913,345.92 | 1–16 | 4–8 | 0.5 | 4–8 | 1 | 20–40 | 0.0025–0.005 | 1 | 0.7 | |
| CPU–MIC | 1,386,228,336.48–5,544,913,345.92 | 1–16 | 4–8 | 0.5 | 4–8 | 1 | 20–40 | 0.0025–0.005 | 1 | 0.7 | |
| 2 | CPU | 462,076,112.16–2,772,456,672.96 | 1–8 | 8–16 | 1 | 6–10 | 1 | 10–20 | 0.0005–0.001 | 0 | 0 |
| CPU–FPGA | 462,076,112.16–2,772,456,672.96 | 1–8 | 8–16 | 0.6 | 6–10 | 1 | 10–20 | 0.0005–0.001 | 1 | 0.8 | |
| CPU–GPU | 462,076,112.16–2,772,456,672.96 | 1–8 | 8–16 | 0.6 | 6–10 | 1 | 10–20 | 0.0005–0.001 | 1 | 0.8 | |
| 3 | CPU | 693,114,168.24–4,158,685,009.44 | 1–4 | 4–8 | 1 | 4–8 | 1 | 4–8 | 0.0025–0.005 | 0 | 0 |
| CPU–FPGA | 693,114,168.24–4,158,685,009.44 | 1–4 | 4–8 | 0.7 | 4–8 | 1 | 4–8 | 0.0025–0.005 | 1 | 0.65 | |
| CPU–MIC | 693,114,168.24–4,158,685,009.44 | 1–4 | 4–8 | 0.7 | 4–8 | 1 | 4–8 | 0.0025–0.005 | 1 | 0.65 | |
| CPU -GPU | 693,114,168.24–4,158,685,009.44 | 1–4 | 4–8 | 0.7 | 4–8 | 1 | 4–8 | 0.0025–0.005 | 1 | 0.65 | |
| 4 | CPU | 2,237,788.20–392,963,271.76 | 1–8 | 12–12 | 1 | 0.5–8 | 0.47 | 10–10 | 0 | 0 | |
| CPU–GPU | 2,237,788.20–392,963,271.76 | 1–8 | 12–12 | 0.51 | 0.5–8 | 0.47 | 10–10 | 1 | 0.8 | ||
| 5 | CPU | 14,878,487.26–119,027,898.08 | 1–8 | 1–8 | 1 | 8–8 | 0.81 | 10–10 | 0 | 0 | 0 |
| CPU–FPGA | 14,878,487.26–119,027,898.08 | 1–8 | 1–8 | 1 | 8–8 | 0.81 | 10–10 | 0 | 1 | 0.85 | |
| 6 | CPU | 2,202,965.68–17,623,725.44 | 1–8 | 2–8 | 1 | 0.5–1 | 0.04 | 10–10 | 0 | 0 | 0 |
| CPU–MIC | 2,202,965.68–17,623,725.44 | 1–8 | 2–8 | 0.046 | 0.5–1 | 0.04 | 10–10 | 0 | 1 | 0.55 | |
| 7 | CPU | 3,125,137.36–25,001,098.88 | 1–8 | 2–8 | 1 | 0.5–1 | 0.4652 | 10–10 | 0 | 0 | 0 |
| CPU–MIC | 3,125,137.36–25,001,098.88 | 1–8 | 2–8 | 0.056 | 0.5–1 | 0.4652 | 10–10 | 0 | 1 | 0.6 | |
| CPU–FPGA | 3,125,137.36–25,001,098.88 | 1–8 | 2–8 | 0.056 | 0.5–1 | 0.4652 | 10–10 | 0 | 1 | 0.6 | |
| 8 | CPU | 18,545,897.12–148,367,176.96 | 1–8 | 2–8 | 1 | 0.8–1.5 | 0.5858 | 10–10 | 0 | 0 | 0 |
| CPU–GPU | 18,545,897.12–148,367,176.96 | 1–8 | 2–8 | 1 | 0.8–1.5 | 0.5858 | 10–10 | 0 | 1 | 0.8 | |
| CPU–FPGA | 18,545,897.12–148,367,176.96 | 1–8 | 2–8 | 1 | 0.8–1.5 | 0.5858 | 10–10 | 0 | 1 | 0.8 | |
| CPU–MIC | 18,545,897.12–148,367,176.96 | 1–8 | 2–8 | 1 | 0.8–1.5 | 0.5858 | 10–10 | 0 | 1 | 0.8 | |
| 9 | CPU | 17,091,794.24–370,917,942.4 | 8–10 | 4–8 | 1 | 8–10 | 0.4 | 10–10 | 0.0008–0.003 | 0 | 0 |
| CPU–MIC | 17,091,794.24–370,917,942.4 | 8–10 | 4–8 | 1 | 8–10 | 0.4 | 10–10 | 0.0008–0.003 | 1 | 0.7 | |
| 10 | CPU | 693,114,168.24–4,990,422,011.32 | 8–12 | 2–6 | 1 | 4–8 | 1 | 10–20 | 0.0005–0.001 | 0 | 0 |
| CPU–GPU | 693,114,168.24–4,990,422,011.32 | 8–12 | 2–6 | 0.6 | 4–8 | 1 | 10–20 | 0.0005–0.001 | 1 | 0.7 | |
| CPU–FPGA | 693,114,168.24–4,990,422,011.32 | 8–12 | 2–6 | 0.6 | 4–8 | 1 | 10–20 | 0.0005–0.001 | 1 | 0.7 |
| Number of Cells | |||||
|---|---|---|---|---|---|
| 13 | 20 | 30 | 50 | 100 | |
| Number of incoming tasks per second | 640 | 1280 | 2560 | 5120 | 10,240 |
| Total Energy Consumption (MWh) | 13,618.62 | 21,036.18 | 31,722.35 | 53,096.19 | 106,198.41 |
| Total Number of submitted Tasks | 27,657,065 | 55,285,417 | 110,788,761 | 222,018,105 | 441,713,374 |
| Total Number of accepted Tasks | 15,819,349 | 30,673,819 | 59,717,240 | 116,985,184 | 232,979,319 |
| Total Number of rejected Tasks | 11,837,716 | 24,611,598 | 51,071,521 | 105,032,921 | 208,734,055 |
| Average Processor Utilization over active servers | 62.92% | 63.83% | 65.48% | 65.43% | 65.32% |
| Average Processor Utilization | 14.42% | 15.71% | 17.57% | 18.78% | 18.73% |
| Average Memory Utilization over active servers | 11.48% | 11.03% | 10.56% | 10.16% | 10.16% |
| Average Memory Utilization | 2.63% | 2.72% | 2.84% | 2.92% | 2.92% |
| Average Network Utilization | 97.76% | 97.78% | 97.71% | 97.68% | 97.69% |
| Average Storage Utilization over active servers | 5.96% | 5.69% | 5.41% | 5.18% | 5.18% |
| Average Storage Utilization | 1.39% | 1.42% | 1.47% | 1.51% | 1.51% |
| Average Accelerator Utilization over active servers | 11.76% | 11.08% | 10% | 9.30% | 9.33% |
| Average Accelerator Utilization | 2.69% | 2.74% | 2.70% | 2.69% | 2.70% |
| Number of Cells | |||||
|---|---|---|---|---|---|
| 13 | 20 | 30 | 50 | 100 | |
| Number of incoming tasks per second | 640 | 1280 | 2560 | 5120 | 10,240 |
| Total Energy Consumption (MWh) | 16,721.63 | 25,748.30 | 39,017.29 | 64,757.92 | 129,530.38 |
| Total Number of submitted Tasks | 27,592,651 | 55,308,306 | 110,558,115 | 221,602,170 | 443,542,128 |
| Total Number of accepted Tasks | 20,351,196 | 38,014,662 | 71,577,179 | 137,561,406 | 275,404,788 |
| Total Number of rejected Tasks | 7,241,455 | 17,293,644 | 38,980,936 | 84,040,764 | 168,137,340 |
| Average Processor Utilization over active servers | 49.70% | 48.53% | 45.42% | 44.29% | 44.22% |
| Average Processor Utilization | 8.25% | 8.75% | 9.53% | 10.16% | 10.20% |
| Average Memory Utilization over active servers | 10.37% | 9.94% | 8.88% | 8.35% | 8.33% |
| Average Memory Utilization | 1.72% | 1.79% | 1.86% | 1.91% | 1.92% |
| Average Network Utilization | 93.73% | 94.05% | 93.62% | 93.16% | 93.11% |
| Average Storage Utilization over active servers | 6.56% | 6.17% | 5.50% | 5.17% | 5.15% |
| Average Storage Utilization | 1.10% | 1.13% | 1.17% | 1.20% | 1.20% |
| Average Accelerator Utilization over active servers | 51.32% | 49.26% | 43.35% | 40.37% | 40.26% |
| Average Accelerator Utilization | 8.53% | 8.89% | 9.10% | 9.26% | 9.28% |
| Number of Cells | |||||
|---|---|---|---|---|---|
| 13 | 20 | 30 | 50 | 100 | |
| Number of incoming tasks per second | 640 | 1280 | 2560 | 5120 | 10,240 |
| Total Energy Consumption (MWh) | 14,712.09 | 22,792.32 | 34,427.73 | 57,691.08 | 115,366.41 |
| Total Number of submitted Tasks | 27,662,402 | 55,364,650 | 110,774,898 | 220,868,089 | 440,603,473 |
| Total Number of accepted Tasks | 18,950,384 | 35,895,402 | 67,665,969 | 130,788,600 | 261,030,054 |
| Total Number of rejected Tasks | 8,712,018 | 19,469,248 | 43,108,929 | 90,079,489 | 179,573,419 |
| Average Processor Utilization over active servers | 47.51% | 46.90% | 47.03% | 47.22% | 47.25% |
| Average Processor Utilization | 7.97% | 8.24% | 8.59% | 8.86% | 8.85% |
| Average Memory Utilization over active servers | 10.98% | 10.65% | 10.30% | 10.06% | 10.07% |
| Average Memory Utilization | 1.84% | 1.87% | 1.88% | 1.89% | 1.89% |
| Average Network Utilization | 95.65% | 95.12% | 94.55% | 94.21% | 94.21% |
| Average Storage Utilization over active servers | 6.65% | 6.38% | 6.16% | 6.02% | 6.03% |
| Average Storage Utilization | 1.13% | 1.13% | 1.14% | 1.14% | 1.14% |
| Average Accelerator Utilization over active servers | 54.31% | 53.05% | 52.14% | 51.59% | 51.64% |
| Average Accelerator Utilization | 9.12% | 9.33% | 9.52% | 9.68% | 9.68% |
| Number of Cells | |||||
|---|---|---|---|---|---|
| Resource Allocation | 13 | 20 | 30 | 50 | 100 |
| Traditional | 57.1982% | 55.4827% | 53.9019% | 52.6917% | 52.7445% |
| SOSM | 73.7559% | 68.7323% | 64.7417% | 62.0758% | 62.0921% |
| Improved SOSM | 68.5059% | 64.8345% | 61.0842% | 59.2157% | 59.2438% |
| Number of Cells | |||||
|---|---|---|---|---|---|
| Resource Allocation | 13 | 20 | 30 | 50 | 100 |
| Traditional | 0.861 | 0.686 | 0.531 | 0.454 | 0.456 |
| SOSM | 0.822 | 0.677 | 0.545 | 0.471 | 0.470 |
| Improved SOSM | 0.776 | 0.635 | 0.509 | 0.441 | 0.442 |
Publisher’s Note: MDPI stays neutral with regard to jurisdictional claims in published maps and institutional affiliations. |
© 2021 by the authors. Licensee MDPI, Basel, Switzerland. This article is an open access article distributed under the terms and conditions of the Creative Commons Attribution (CC BY) license (https://creativecommons.org/licenses/by/4.0/).
Share and Cite
Giannoutakis, K.M.; Filelis-Papadopoulos, C.K.; Gravvanis, G.A.; Tzovaras, D. On the Optimization of Self-Organization and Self-Management Hardware Resource Allocation for Heterogeneous Clouds. Computers 2021, 10, 147. https://doi.org/10.3390/computers10110147
Giannoutakis KM, Filelis-Papadopoulos CK, Gravvanis GA, Tzovaras D. On the Optimization of Self-Organization and Self-Management Hardware Resource Allocation for Heterogeneous Clouds. Computers. 2021; 10(11):147. https://doi.org/10.3390/computers10110147
Chicago/Turabian StyleGiannoutakis, Konstantinos M., Christos K. Filelis-Papadopoulos, George A. Gravvanis, and Dimitrios Tzovaras. 2021. "On the Optimization of Self-Organization and Self-Management Hardware Resource Allocation for Heterogeneous Clouds" Computers 10, no. 11: 147. https://doi.org/10.3390/computers10110147