Article

Efficacy of Lymph Node Location-Number Hybrid Staging System on the Prognosis of Gastric Cancer Patients

Department of Gastroenterological Surgery, Harbin Medical University Cancer Hospital, Harbin Medical University, Harbin 150081, China
*
Author to whom correspondence should be addressed.
These authors contributed equally to this work.
Cancers 2023, 15(9), 2659; https://doi.org/10.3390/cancers15092659
Submission received: 10 March 2023 / Revised: 18 April 2023 / Accepted: 4 May 2023 / Published: 8 May 2023
(This article belongs to the Section Clinical Research of Cancer)

Abstract

:

Simple Summary

Lymph node staging is very important for the prognosis of patients with gastric cancer. Currently, the internationally accepted lymph node staging method is the 8th AJCC staging, which divides lymph nodes into different stages according to the number of positive lymph nodes. This staging method is simple and convenient, but ignores the laterality of lymph nodes. In this paper, we for the first time combined the location and number information of positive lymph nodes to create a novel lymph node staging system for gastric cancer. After training cohort and validation cohort tests, this staging is more accurate in predicting the prognosis of patients than the 8th AJCC staging.

Abstract

Background: Lymph node metastasis location and number significantly affects the prognosis of patients with gastric cancer (GC). This study was designed to examine a new lymph node hybrid staging (hN) system to increase the predictive ability for patients with GC. Methods: This study analyzed the gastrointestinal treatment of GC at the Harbin Medical University Cancer Hospital from January 2011 to December 2016, and selected 2598 patients from 2011 to 2015 as the training cohort (hN) and 756 patients from 2016 as the validation cohort (2016-hN). The study utilized the receiver operating characteristic curve (ROC), c-index, and decision curve analysis (DCA) to compare the prognostic performance of the hN with the 8th edition of AJCC pathological lymph node (pN) staging for GC patients. Results: The ROC verification of the training cohort and validation cohort based on each hN staging and pN staging showed that for each N staging, the hN staging had a training cohort with an AUC of 0.752 (0.733, 0.772) and a validation cohort with an AUC of 0.812 (0.780, 0.845). In the pN staging, the training cohort had an AUC of 0.728 (0.708, 0.749), and the validation cohort had an AUC of 0.784 (0.754, 0.824). c-Index and DCA also showed that hN staging had a higher prognostic ability than pN staging, which was confirmed in the training cohort and the verification cohort, respectively. Conclusion: Lymph node location-number hybrid staging can significantly improve the prognosis of patients with GC.

1. Introduction

According to the World Health Organization (WHO), gastric cancer (GC) was the fifth common global tumor incidence in 2020, and its mortality rate was ranked fourth, as it is responsible for approximately 770,000 deaths per year [1]. Due to the wide distribution of gastric lymph nodes and complex drainage [2], GC becomes a physical tumor with a high tendency to metastasize lymph nodes [3]. In many countries the proportion of lymph node metastasis is between 54–64% [4,5,6,7]. Even if R0 resection combined with D2/D2+ cleaning is performed on patients with lymph node metastasis, their survival period is even worse than those with no lymph node metastasis [7,8,9]. Recently, N staging has been updated to the 8th edition AJCC staging. Compared with the 7th edition, the 8th edition AJCC has a slight adjustment of the N staging; in pathological classification, N3 was further subdivided into N3a (7–15 positive lymph nodes) and N3b (≥16 positive lymph nodes) [10]. In this way, a more accurate prognosis assessment and personalized follow-up treatment for GC patients can be obtained [2,10].
Although the number of positive lymph nodes can predict the prognosis of patients, Daniele et al. [11] found that patients with positive lymph nodes (8p, 12b/p, 13, etc.) in the rear group had a worse prognosis than those with negative lymph nodes. It was also shown that the location of lymph node metastasis significantly impacts the prognosis of patients. The limitation of quantitative staging is that it does not provide anatomical information about lymph nodes and may also lead to inconsistent preoperative and postoperative N staging [12,13]. In order to improve prognostic efficacy, Choi et al. [12] proposed a hybrid lymph node staging. The stomach lymph nodes were divided into three parts (lesser curvature LN groups, greater curvature LN groups, and extra-perigastric LN groups), only focusing on the location of positive lymph nodes, and not the number of positive lymph nodes. This site-specific lymph node staging was demonstrated to have the same predictive performance as the 7th edition AJCC pN staging at low infiltration depth. The simplicity of this staging makes it an alternative to the 7th edition AJCC and helps in improving the consistency of preoperative and postoperative staging in patients with GC [14]. Subsequently, it was further improved in two single-center studies in Taiwan [15] and Italy [16]. Choi et al. [12] determined that hN staging could be used as an alternative to pN staging in the 7th edition. However, the above solutions still ignore the effect of the number of metastatic lymph nodes on the prognosis of patients [17,18,19]. The comparison content at the 7th edition AJCC, and the effect of the 8th edition is still unknown.
This study proposed a new hybrid lymph node staging through retrospective analysis and combined it with the advantages of location and number staging. In addition, the prediction ability and accuracy of the two systems were compared to propose a supplementary standard that can be used as the existing pN staging.

2. Patients and Methods

2.1. Patients

The diagnosis of GC was based on the tissue samples obtained using preoperative gastroscopy and further confirmed via histopathological examination by a professional pathologist. In addition, the patient underwent routine preoperative examinations, including abdominal CT, chest CT, echocardiography, ultrasound of bilateral supraclavicular lymph nodes, electrocardiogram, routine hematology, and tumor marker examination. Every patient had more than 16 lymph node cleanings. Following lymph node removal, each patient was photographed and sent to the pathology lab separately. At least two pathology experts reviewed all pathological results. All staging was conducted in accordance with the 8th edition AJCC.
A total of 4712 surgical patient in the Department of Gastrointestinal Surgery of Harbin Medical University Cancer Hospital from 1 January 2011, to 31 December 2016, were selected for this study. Patients’ clinicopathological data were saved in the GC information management system v1.2 of Harbin Medical University Cancer Hospital (Copyright 2013SR087424, http://www.sgihmu.com, accessed on 10 August 2022). Gender, age, tumor diameter, tumor location, pTNM stage, venous invasion, nerve invasion, and postoperative chemotherapy were included. Patients with negative surgical margins (R0) and standard D2/D2+ surgery were enrolled. The inclusion criteria for our study were as follows: ① patients who underwent radical gastrectomy in the Affiliated Cancer Hospital of Harbin Medical University between 1 January 2011, to 31 December 2016; and ② had regular follow-up for at least 5 years. Exclusion criteria included: ① history of the other malignancies; ② patients with preoperative neoadjuvant chemotherapy; ③ the postoperative pathological report was non-tumor; ④ patients with unclear lymph node metastasis or invasion depth reported by postoperative pathology; and ⑤ patients with a history of gastric surgery. A total of 3354 patients were included after the exclusion. Finally, 2598 patients were chosen as the training cohort (hN) from January 2011 to December 2015, and 756 patients were chosen as the validation cohort (2016-hN) from February 2016 to November 2016.

2.2. Follow Up

All patients were followed up after discharge by telephone, e-mail, or examination at the Affiliated Cancer Hospital of Harbin Medical University outpatient complex through the analysis of hematology, tumor markers, gastroscopy, abdominal ultrasonography, abdominal CT, and PET-CT for some patients according to their condition. Stage I patients were followed up every 12 months, stage II patients every 6 months, and stage III patients every 3–6 months. In addition, chest or abdominal CT was performed for suspected tumor recurrence or elevated tumor marker levels above pathological levels, and a bone scan was performed for suspected bone metastases. The diagnosis of recurrence is confirmed based on imaging or re-surgical pathology.

2.3. Statistics Analysis

Statistical analyses were performed using IBM, SPSS, and R. Chi-square or Fisher’s exact test was used for categorical variables. A Chi-square test was performed to analyze the relationship between recurrence and the clinicopathological characteristics of the patients. Factors with significant differences (p < 0.05) that appeared when using univariate analysis were then entered into multivariate analysis. The optimal cut-off value of the number of positive lymph nodes was calculated using X-tile. The receiver operating characteristic curve (ROC) was used to calculate the accuracy of the recurrence scores in predicting recurrence and the area under the curve (AUC). Harrell Consistency Index (C-index) analysis and DCA test were performed using the survival package in R.

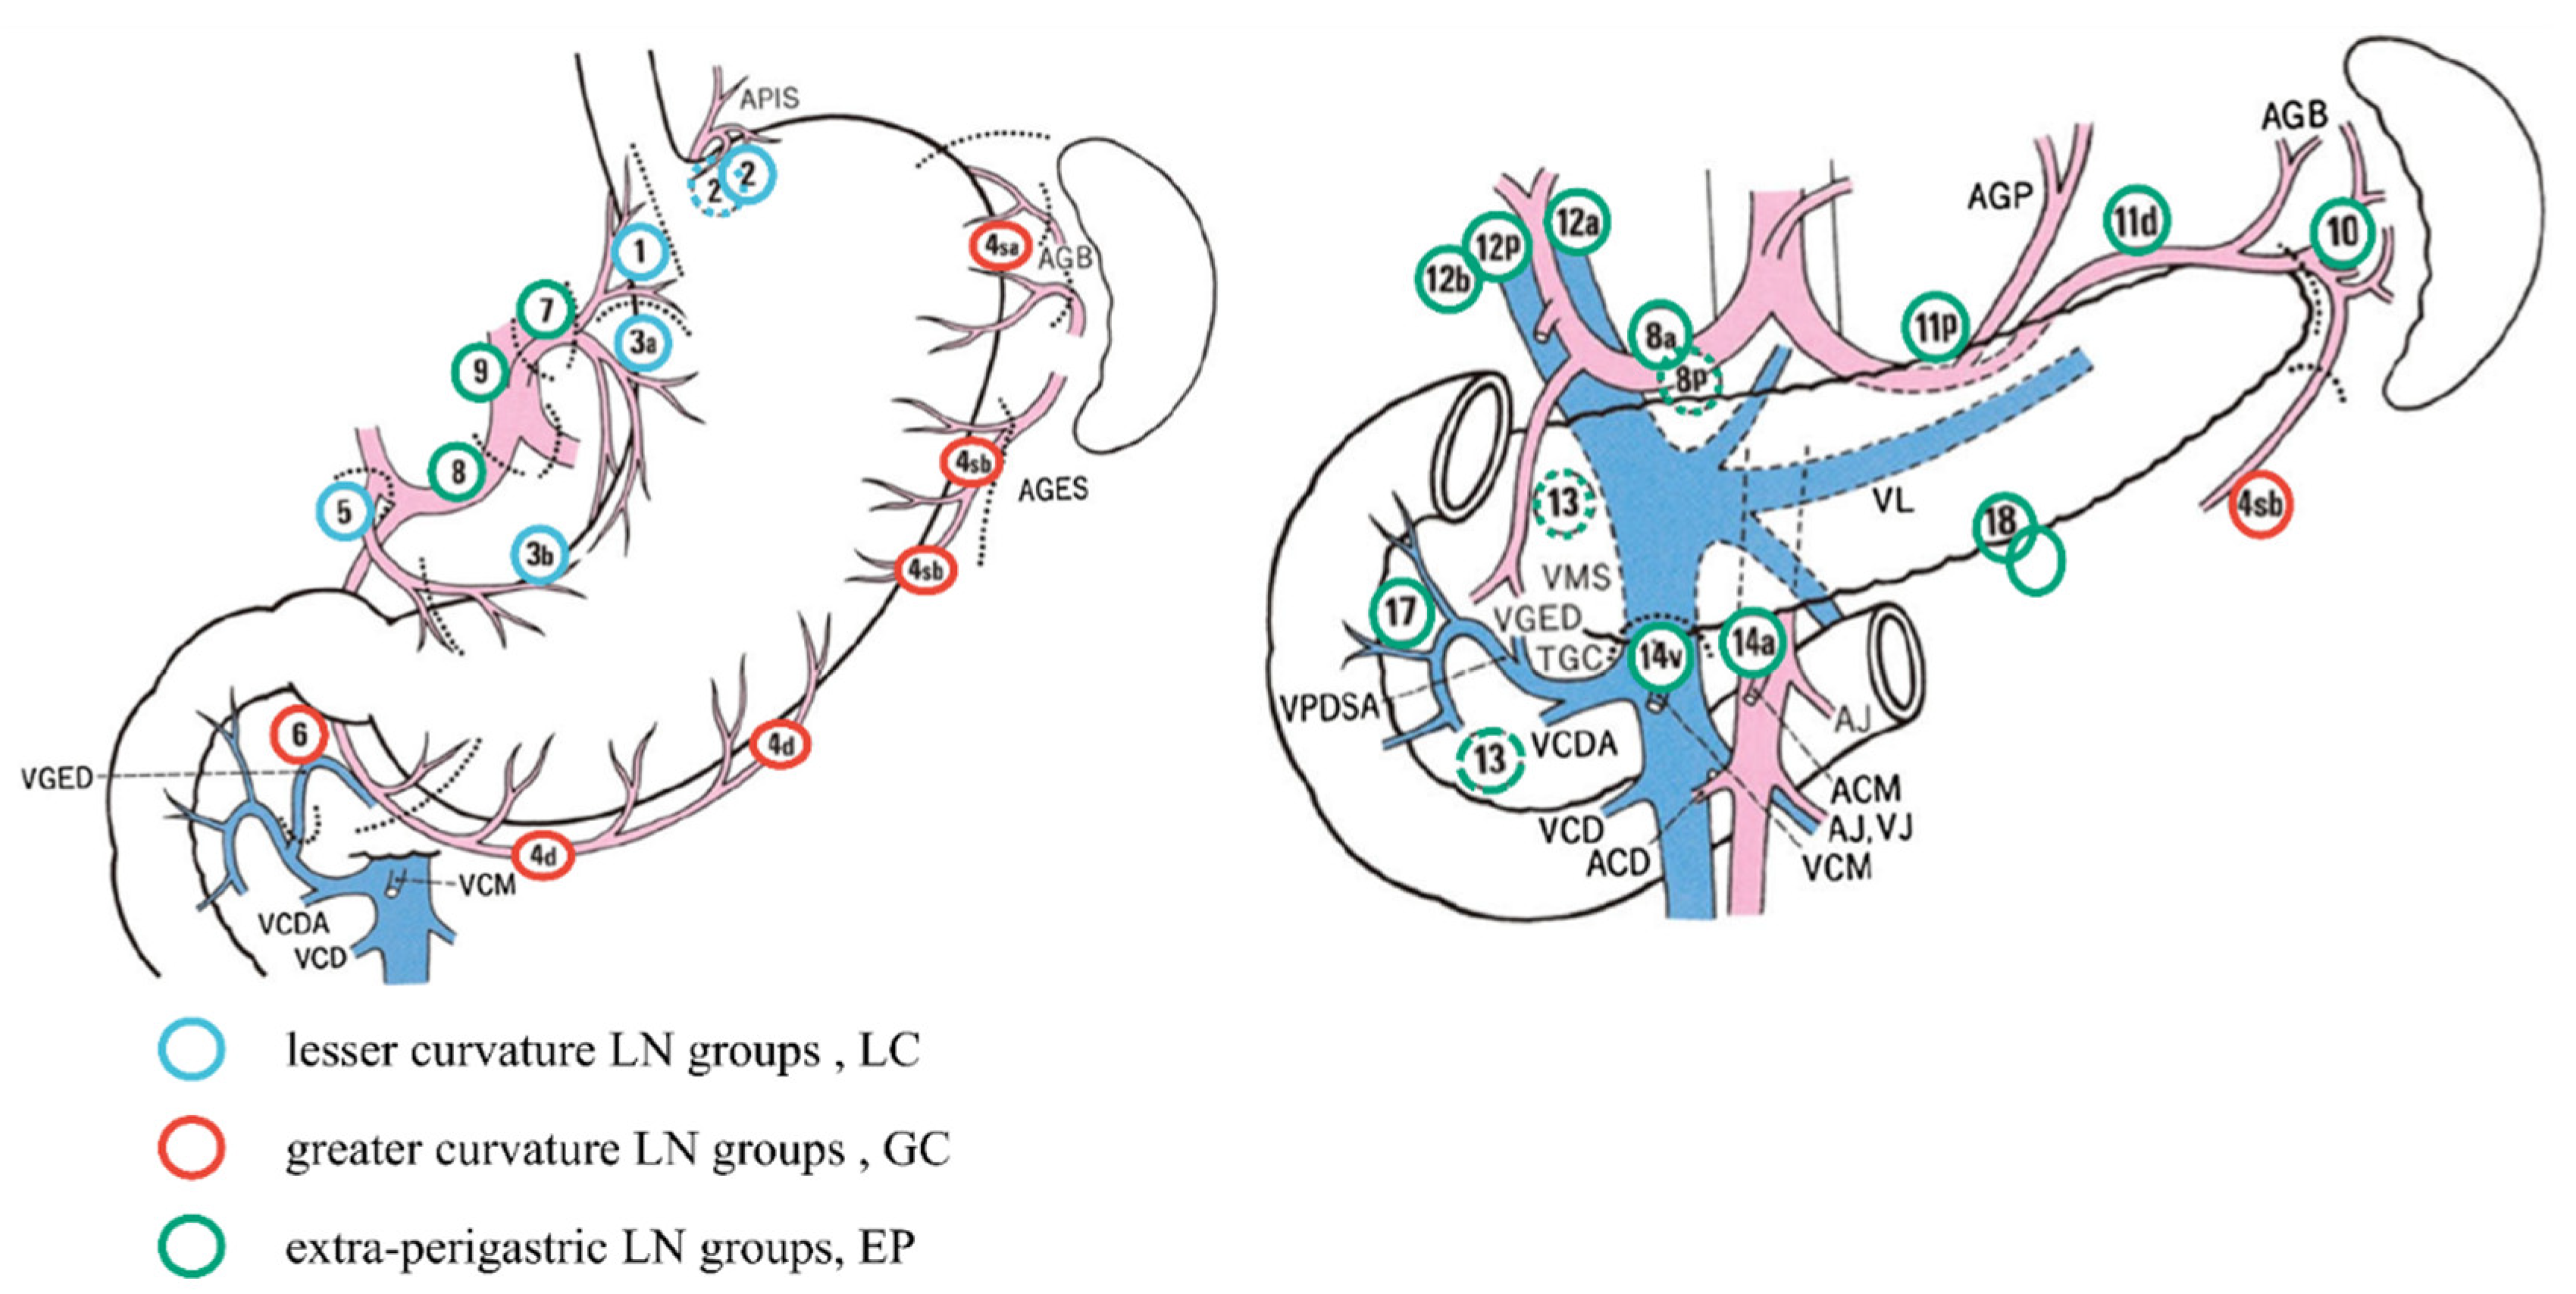
2.4. Lymph Nodes Location-Number Hybrid Staging System Criteria

According to the classification of gastric lymph nodes by Choi et al. [12] (Figure 1), gastric lymph nodes are divided into two groups according to their anatomical positions: Perigastric lymph nodes and extra-perigastric lymph nodes (EP). Of these, perigastric lymph nodes were divided into lesser curvature LN groups (LC, including 1/3/5 groups lymph nodes) and greater curvature LN groups (GC, including 2/4/6 groups lymph nodes). EP included all lymph nodes except those mentioned above and para-aortic lymph nodes. Based on Choi et al. [12], we grouped the positive lymph nodes of the EP group according to the number, calculated the optimal cut-off value of the number of positive lymph nodes through X-tile software to ensure a good layering effect in each staging period and determined the best combination method. The final hN stage was as follows:
  • hN0: No positive lymph nodes.
  • hN1: LC/GC had positive lymph nodes irrespective of the number, or EP had positive lymph nodes, and the number of positive lymph nodes in the EP group was ≤4.
  • hN2: Two groups of LC/GC/EP had positive lymph nodes, regardless of the number. EP had positive lymph nodes, and the number of lymph nodes was >4.
  • hN3a: LC + GC + EP all had positive lymph nodes, and the total number of positive lymph nodes was ≤14.
  • hN3b: LC + GC + EP all had positive lymph nodes, and the total number of positive lymph nodes was >14.

3. Results

3.1. Patient Baseline Characteristics

A total of 3354 patients were included in this study. Table 1 shows the patient characteristics. Here, 1899 patients were ≤60 years old, and 1455 patients were >60 years old. There were 2444 males and 910 females. According to the hN stage, the number of patients with hN0, hN1, hN2, hN3a, and hN3b was 1671 (49.82%), 587 (17.50%), 588 (17.53%), 280 (8.35%), and 228 (6.80%), respectively. According to the hTNM staging, 1154 (34.41%) patients were in stage I, 1029 (30.68%) in stage II, and 1171 (34.91%) in stage III. Compared with the validation cohort, the training cohort had statistically significant differences in the hN stage, pT stage, pathological type, degree of differentiation, HER-2, BMI, CEA, and tumor size. However, there was no significant difference in age, gender, tumor location, hTNM stage, CA-199, lymph node metastatic ratio (LNRs), number of metastatic lymph nodes (MLNs), and the total number of removed lymph nodes (RLNs).
From 2011 to 2015, 2598 patients were included in the training cohort, including hN0 1291 (49.69%), hN1 483 (18.59%), hN2 443 (17.05%), hN3a 223 (8.58%), and hN3b 158 (6.08%). The average age was 57.97 ± 10.05. There were 1909 males (73.48%) and 689 females (26.52%) (p = 0.567). Most tumors were located in the lower part (1890, 72.75%), 403 (15.51%) followed by the middle part, 269 (10.35%), then the upper part, and 36 (1.39%) in the whole stomach. From hN0–hN3b, patients with tumors in the lower part decreased gradually, while patients with tumors in the middle, upper part, and whole stomach increased gradually. The proportion of hN0–hN3b decreased gradually from T1 to T2 and increased gradually from T3 to T4. BMI, CEA, CA-199, RLNs, MLNs, and RLNs showed significant differences under different hN stages (Table 2).
A total of 756 patients in 2016 were included in the validation cohort. According to the hN staging, the proportion of 2016-hN0, 2016-hN1, 2016-hN2, 2016-hN3a, and 2016-hN3b was 380 (50.26%), 104 (13.76%), 145 (19.18%), 57 (7.54%), and 70 (9.26%), respectively. Furthermore, 405 (53.57%) patients were less than 60 years, and 351 (46.43%) patients were more than 60 years old (p = 0.859). With the progress of the hN stage, the proportion of tumors located in the lower part of the stomach gradually decreased, while the proportion of tumors located in the upper part and the whole stomach gradually increased. BMI, CEA, CA-199, RLNs, MLNs, and RLNs showed significant differences under different hN stages (Table 3).

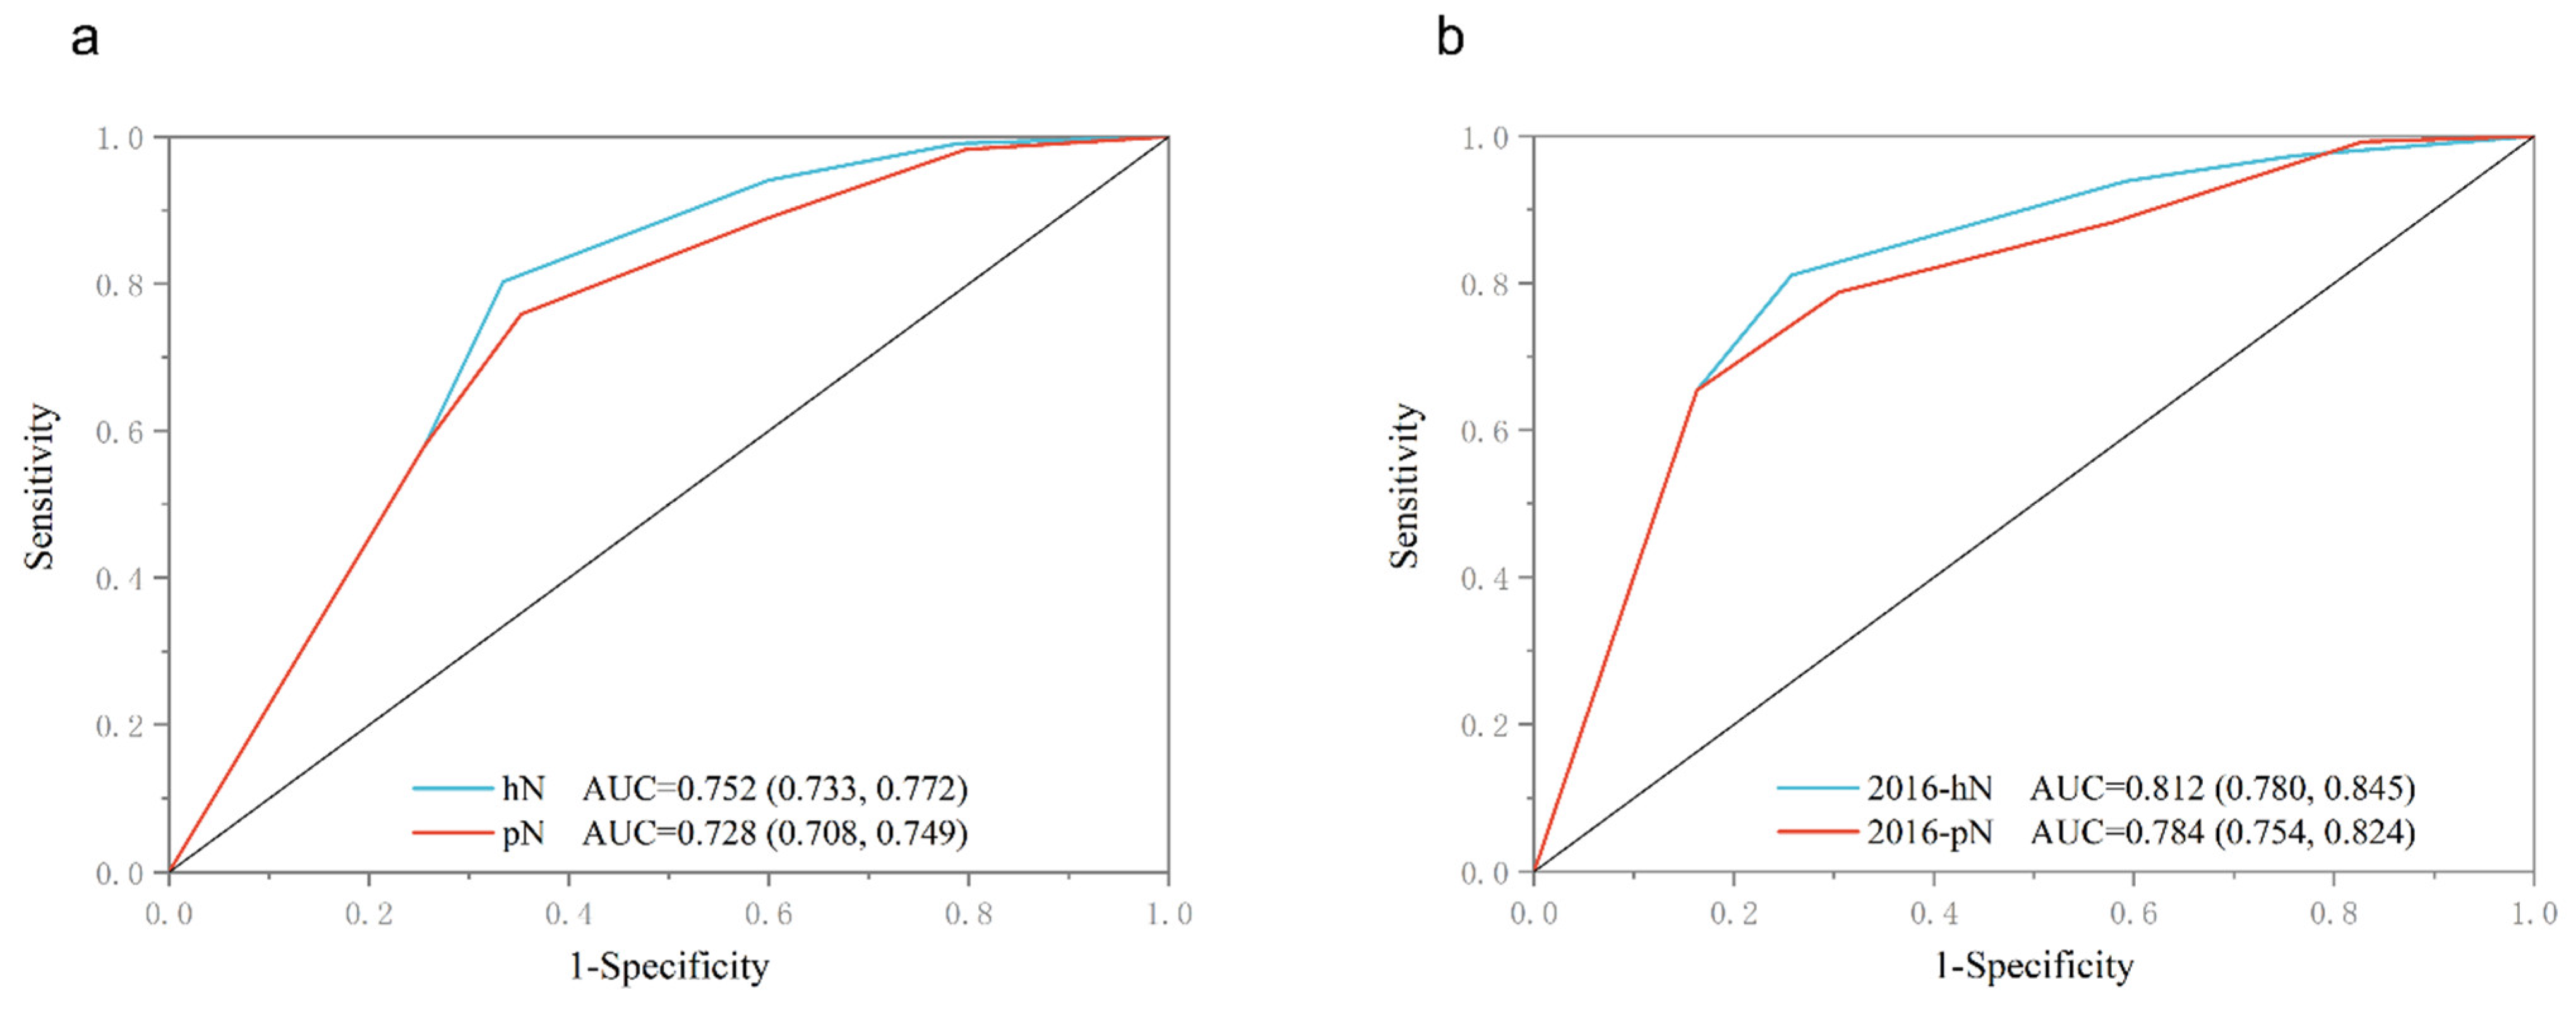
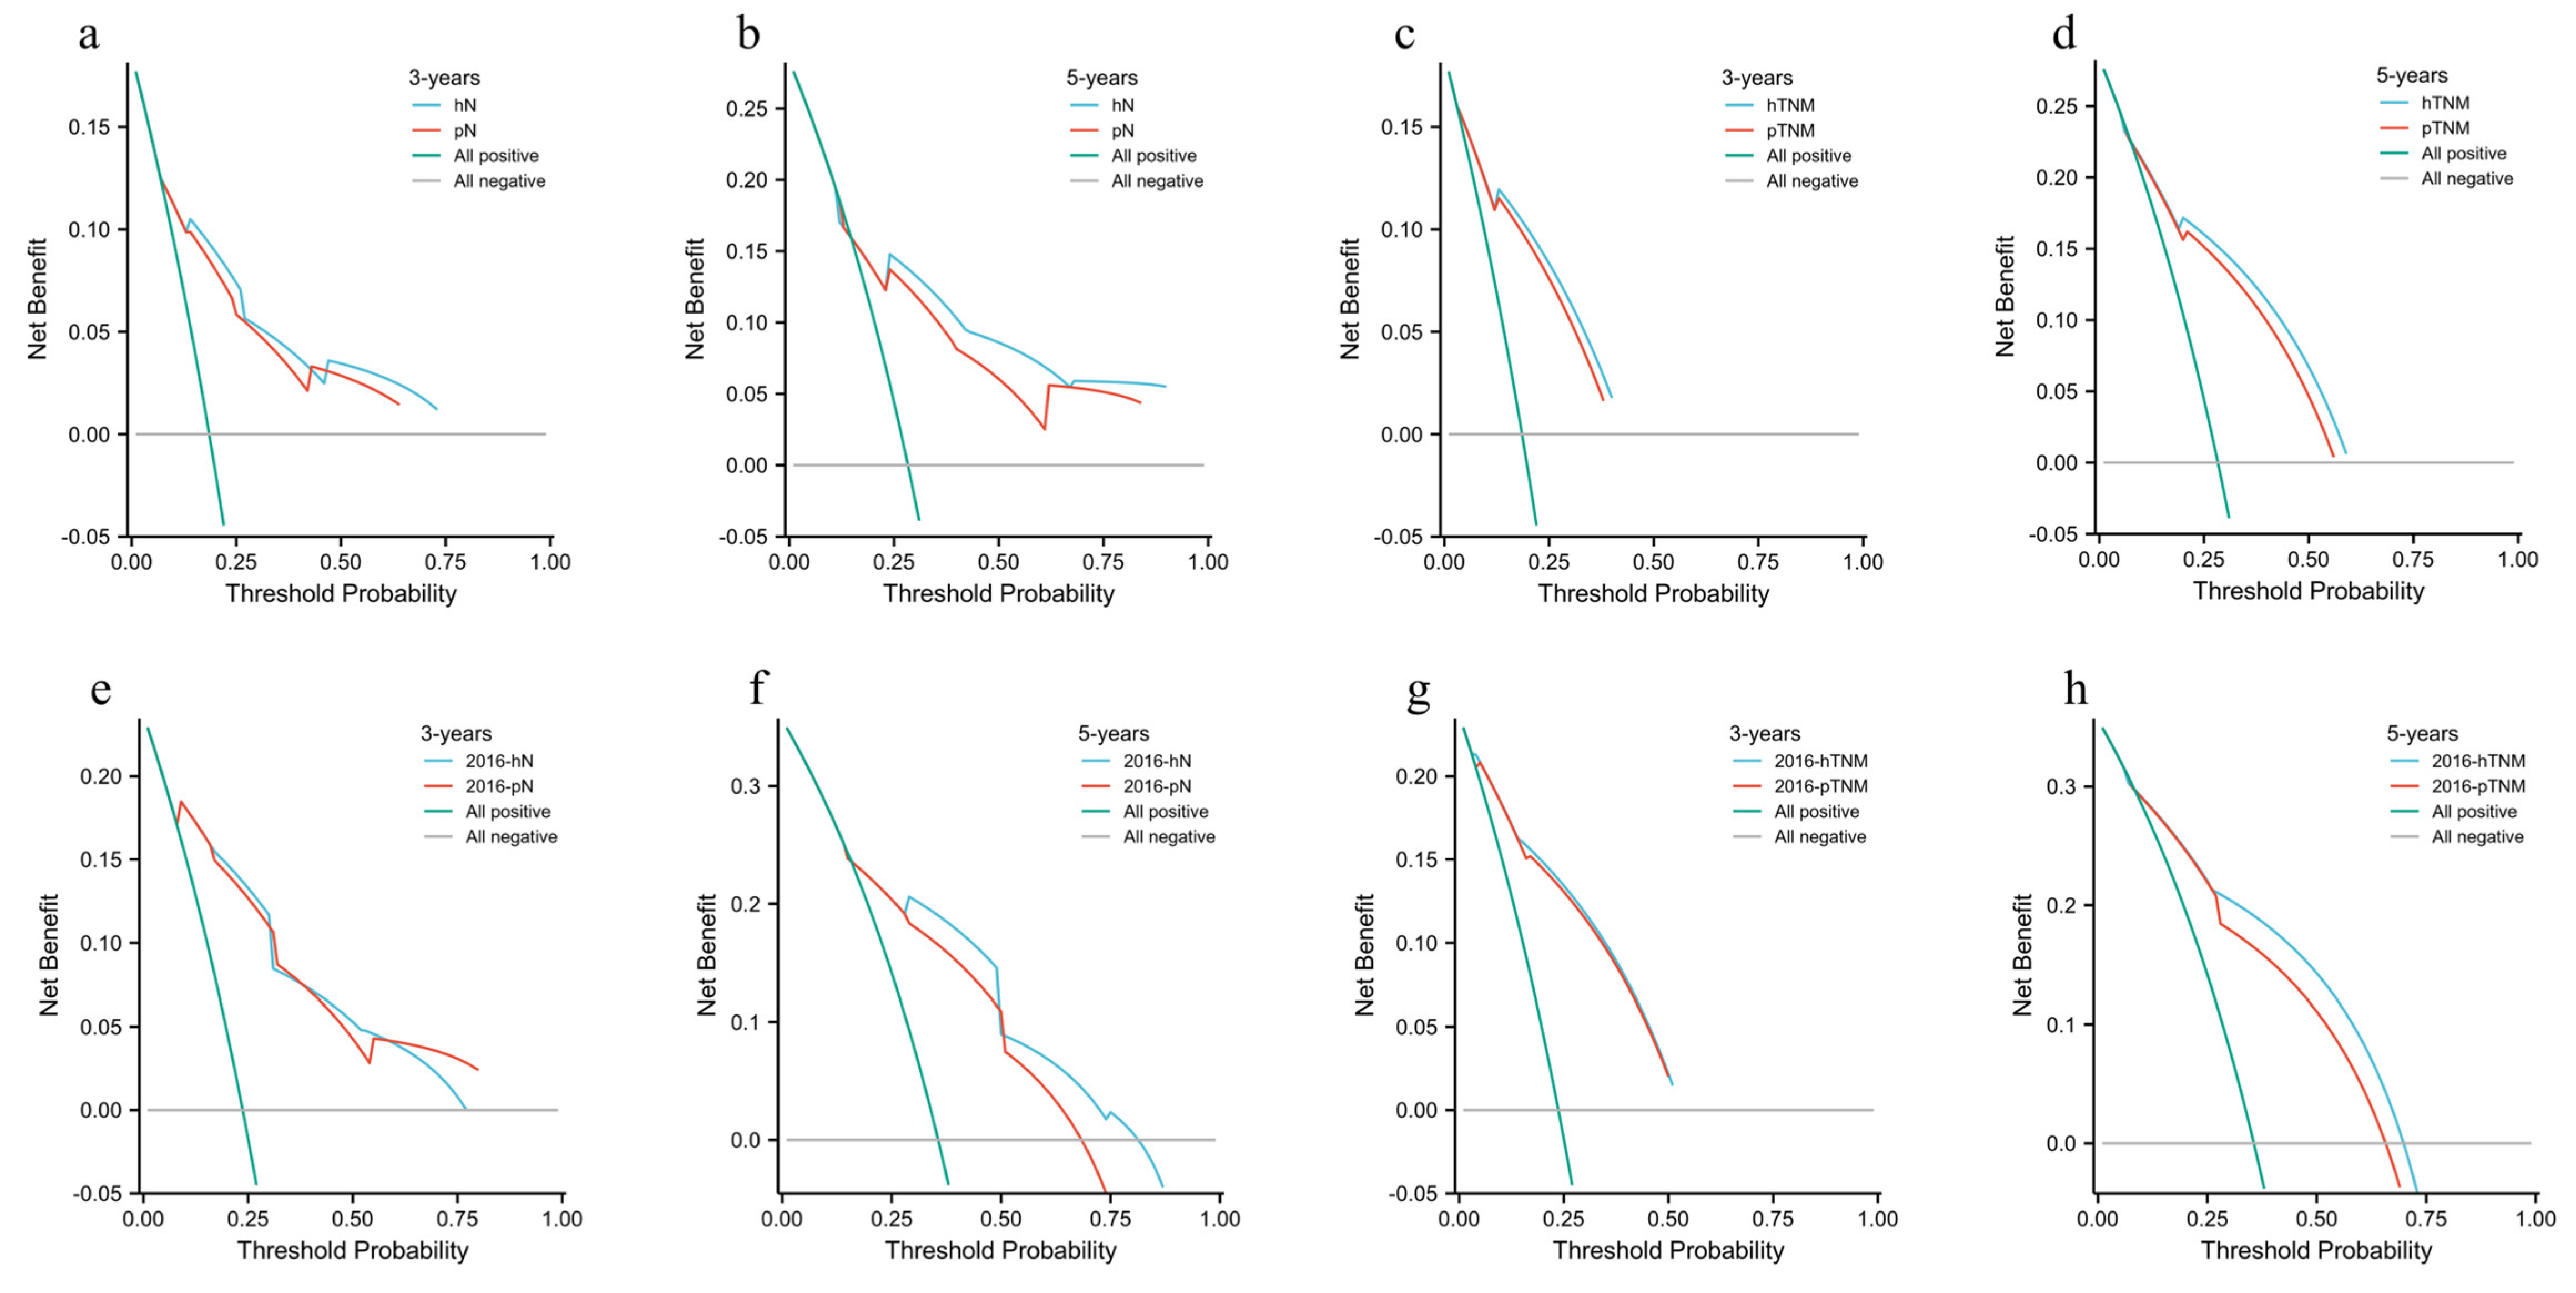
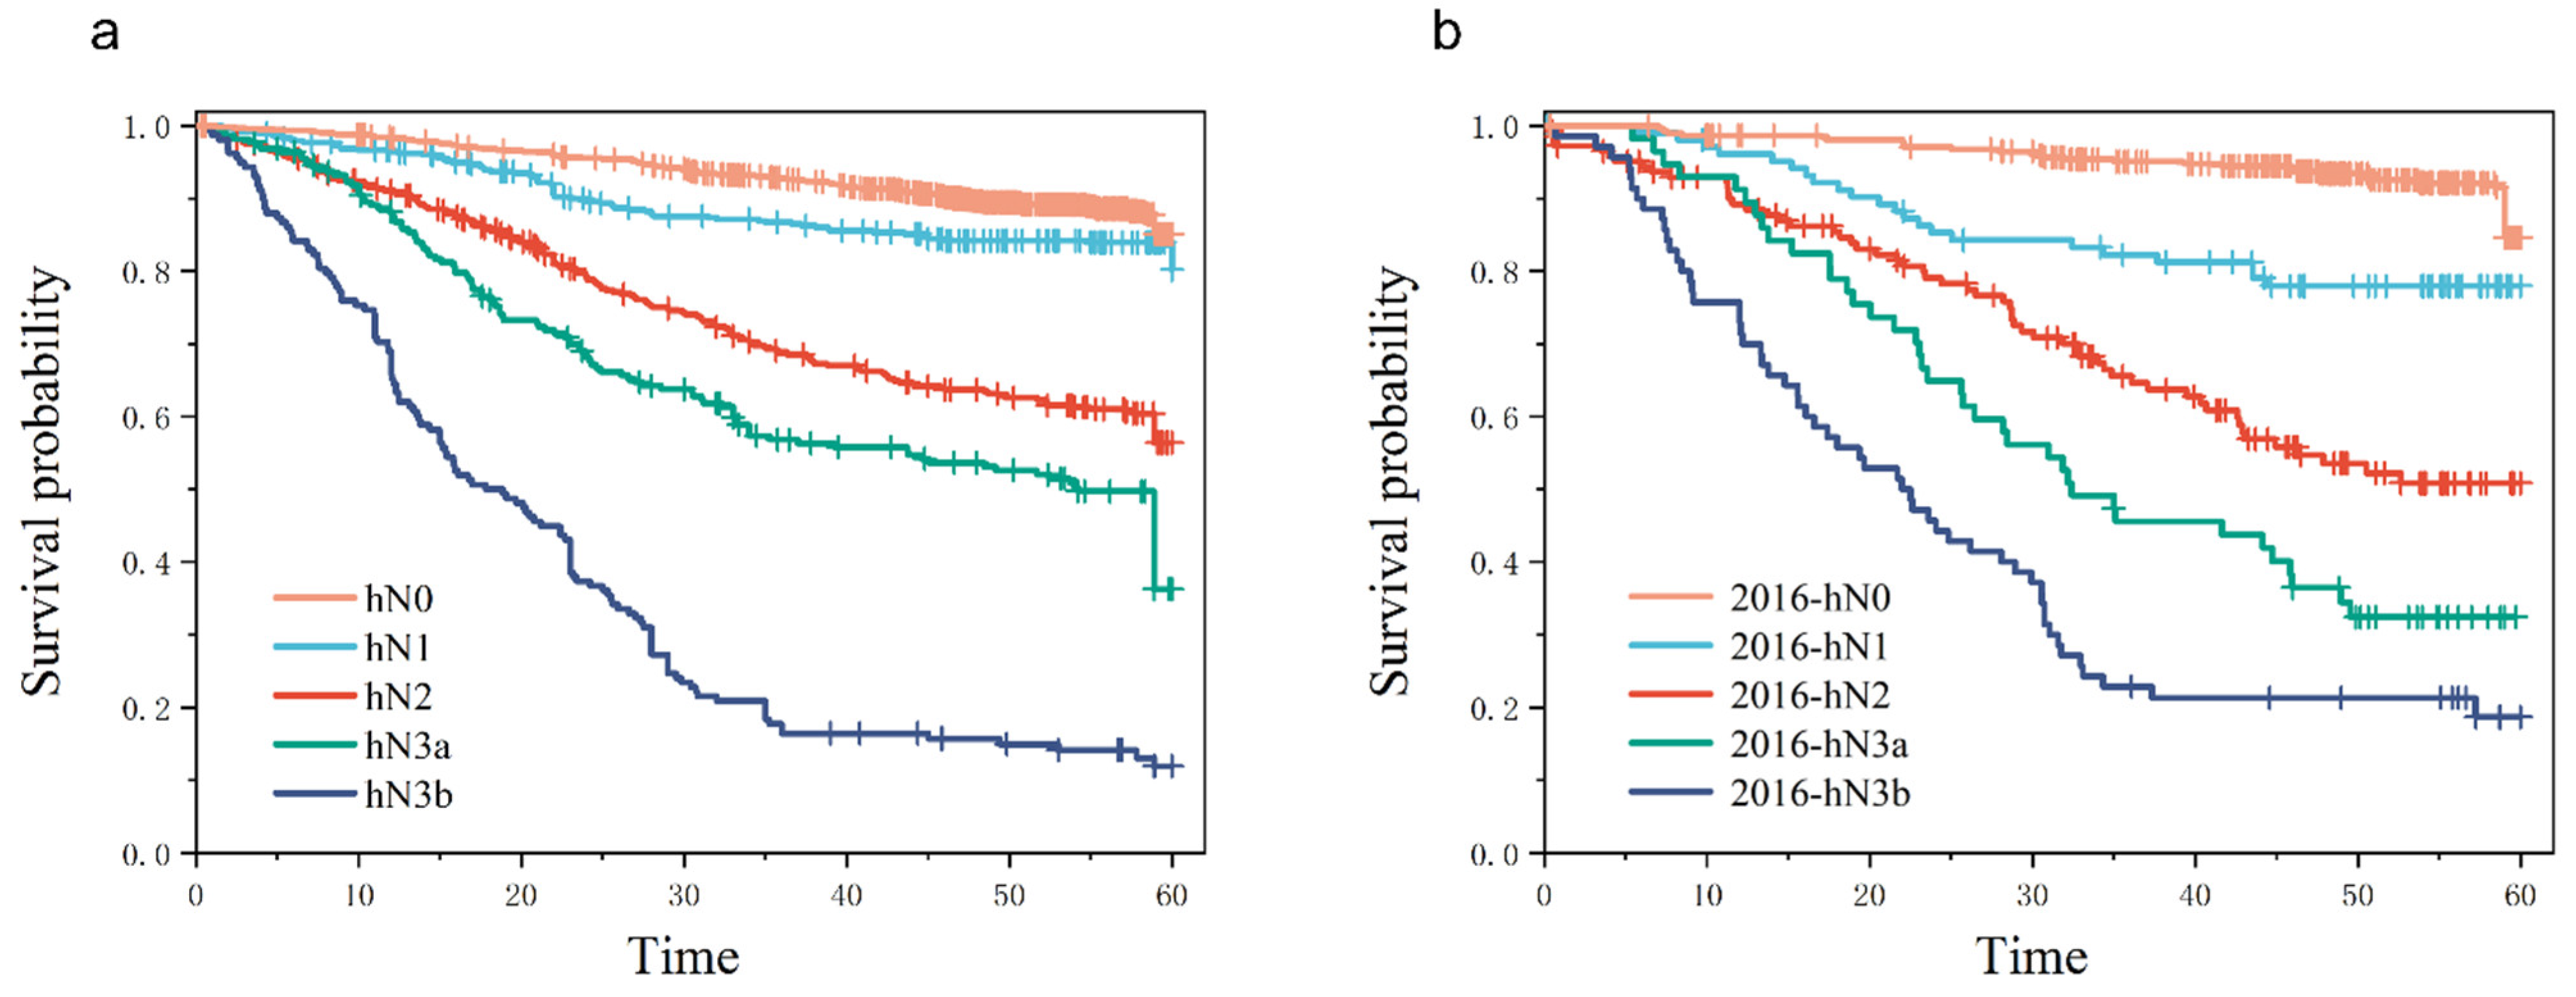
3.2. Evaluation of the Predictive Ability of hN Staging

According to the ROC test, the AUC of hN and pN for the training cohort were 0.752 (95%CI: 0.733–0.772) and 0.728 (95%CI: 0.708–0.749), respectively. Furthermore, the AUC of 2016-hN and 2016-pN for the validation cohort were 0.812 (95%CI: 0.780–0.845) and 0.784 (95%CI: 0.754–0.824), respectively (Figure 2a,b).
For hN and pN, C-index was calculated under the conditions of differentiation degree (Table 4a), T stage (Table 4b), and TNM stage (Table 4c). hN C-index was greater than pN at all differentiation degrees. For example, in G1, G2, and G3, hN C-index was 0.718, 0.683, 0.750, pN C-index was 0.712, 0.671, 0.737, respectively. In the T1-T4 stage, the C-index of hN in T1, T2, T3, and T4 was 0.550, 0.703, 0.742, and 0.674, respectively. The C-index of pN was 0.531, 0.648, 0.689, and 0.660, respectively. For TNM staging, the C-index of hN was the same as that of pN in stage I (0.520). However, for stages II and III, the C-index of hN was significantly different from that of pN. The C-index of hN in stages II and III was 0.623 and 0.621, respectively. The C-index of pN in stages II and III was 0.611 and 0.606, respectively.
DCA results showed that in the validation cohort, hN staging and hTNM staging were better than pN and pTNM in the 3rd and 5th years (Figure 3a–d), with a higher area under the curve. In addition, the results of the training cohort were well verified in the validation cohort (Figure 3e–h).
The Kaplan–Meier curves of the 5-year overall survival (OS) rate of each subgroup under the condition of hN in the training cohort and the validation cohort are shown in Figure 4a,b, with p < 0.01 among each stratum. The hN stage had significant statistical differences under each N stratum, indicating that the hN stage had a good stratification (Figure 4)

3.3. Univariate and Multivariate Analysis of Prognostic Factors in Patients with hN Staging

In order to determine the independent risk factors affecting the prognosis of patients under the hN stage, Cox risk regression model analysis was performed. Univariate analysis showed that BMI, CEA, CA-199, MLNs, RLNs, LNRs, age, tumor location, hN stage, pT stage, hTNM stage, pathological tumor type, degree of differentiation, and tumor size were statistically significant. Multivariate analysis showed that BMI, CEA, CA-199, RLNs, age, tumor location, hN stage, pT stage, hTNM stage, and pathological type were independent risk factors related to the prognosis of patients (Table 5). Based on multivariate regression analysis, a prognostic Nomogram was established according to independent prognostic factors (Figure 5) to show the relationship between each predictor variable in the prediction model.

4. Discussion

Lymph node metastasis is one of the most critical factors affecting the survival of patients with GC, as it can lead to the recurrence of GC [17,18,19]. Therefore, selecting a staging system with good predictive power is essential. In this study, we also considered the location and number of lymph node metastases and constructed hN staging and found that hN staging had better prognostic prediction performance and value than pN staging. In addition, hN staging also allows patients to survive with good discrimination.
Mine et al. [21] found that different tumor locations significantly affect the prognosis and lymph node metastasis of patients with esophageal cancer. In addition, different lymph node metastasis sites also significantly impact the prognosis of patients, which is called tumor laterality. The complexity of the arteries supplying blood to the stomach and the surrounding areas results in severe challenges in adequately identifying the anatomy of the lymphatic system. Therefore, there is no method for staging based on the anatomical location of lymph nodes [2]. We speculate that laterality may have a potential effect on GC, though the effect of tumor location and lymph node metastasis laterality on N staging has not been reported in GC [22]. In addition, GC is a highly heterogeneous malignant tumor, and the same N stage may have different prognosis for GC patients. Therefore, considering the hN staging may further differentiate the prognosis of patients with GC.
In order to solve the above problems, Choi et al. [12] created a new regional lymph node staging system based on the location of positive lymph nodes, which made up for the lack of lymph node laterality in the current staging. They showed that the number of lymph node metastasis was 2.2 ± 1.8, 2.3 ± 2.0, and 2.1 ± 1.8 for simple lesser curvature, greater curvature, and peripheral lymph node metastasis, respectively. In this study, the number of simple lesser curvature, greater curvature, and peripheral lymph node metastasis was 2.4 ± 2.3, 2.1 ± 1.7, and 2.1 ± 2.2, respectively, at p = 0.036. It was found that there was a significant difference in the number of metastatic lymph nodes in different sites. The number of metastatic lymph nodes in the greater curvature was significantly higher than in the lesser curvature and peripheral lymph nodes. Previous studies have shown that the metastatic ability of lymph nodes is related to the distance of the lymph nodes from the tumor. According to the distance from the tumor location to the lymph nodes, the tumor in the greater curvature is more likely to metastasize to the 6 group lymph nodes outside the greater curvature [23], which is more likely to metastasize to the 14v and 16 groups of lymph nodes [24,25]. Moreover, Jung et al. [22] found that the prognosis ability of patients with tumors located at the greater curvature was worse than that at other parts, and it was speculated that the reason was also due to the stronger migration ability of lymph nodes located at the greater curvature. Therefore, staging based solely on positive lymph node location may lead to a decline in the ability to judge the prognosis of the disease. Because the number of positive lymph nodes at different sites leads to different lymph node migration abilities, which significantly impacts the prognosis of patients, we added the number of lymph nodes to control this difference and obtain better predictive ability.
The latest 8th AJCC staging has improved the predictive performance of pTNM staging for the prognosis of different patients [26]. However, there are still differences in conclusions in different countries [27]. The main reason is that the current staging ignores the value of positive lymph node location on the prognosis of patients [11]. In addition, the regional differences in surgical methods also impact the results of different countries. Asian countries, mainly Japan and Korea, recommend D2/D2+ lymph node dissection for patients with advanced GC [28,29,30,31]. Whereas in Europe, D1 dissection is preferred for patients with curable GC [6,32]. In recent years, scholars worldwide have proposed various lymph node staging methods, such as metastatic lymph node ratio [33,34,35] and negative lymph node/T stage log [36], to adjust N staging. However, these two methods have limitations. The primary disadvantage of using metastatic lymph node ratio [33,34,35] as the N staging standard is that its staging range is unclear. There are significant differences in the lymph node metastasis rate staging in different regions, and the definition of different staging critical points is controversial [12], which is why it cannot be used as a universal staging system. The N staging of the logarithm of negative lymph nodes/T stage [36] has not been supported by the literature in other countries. The above two staging methods rely on the number of positive lymph nodes and cannot account for the impact of lymph node location on prognosis.
It was found in this study that the C-index of hN was higher than that of pN except for TNM I patients. In stage I patients, the C-index of hN and pN was the same, which was 0.520, and the C-index was between 0.5–0.6, showing poor predictive ability. The possible reason is that according to the 8th edition AJCC staging criteria [10], pTNM I includes N0-T1, N0-T2, and N1-T1, of which 743 patients were N0-T1, 334 patients were N0-T2, 77 patients were hN1-T1, and 65 patients were pN1-T1. N1-T1 accounted for 5.69–6.67% of the total TNM I, and due to the low number of lymph node metastases in stage I patients, staging based on the location and number of lymph node metastases may not accurately predict the prognosis. However, for patients with N2 and later, the accuracy of hN staging is improved due to the increase in the number of lymph node metastases. Therefore, the C-index of the hN and pN stages was the same at the TNM II stage. The new hN staging showed better prediction accuracy than pN staging in T1–T4, G1–G3, and TNM II–III stages and the prediction precision was higher (Table 4a–c).
In this study, we found that with the gradual progress of the hN stage, the proportion of tumors located in the lower part gradually decreased, while the proportion of tumors located in the gastric body, cardio, and whole stomach gradually increased (Table 1, Table 2 and Table 3). Therefore, Li et al. [37] proposed that the distribution of GC tumors would change over time. According to reports, among Korean GC patients, the proportion of distal lesions gradually decreases during tumor progression [38], which may be due to the anatomical differences in the stomach. Compared with the gastric antrum, the thickness of the gastric wall in the upper part of the stomach is thinner, and the thickness of the submucosa is also thinner. Therefore, GC located in the upper part of the stomach is more likely to cause tumor lymph node metastasis [39]. In addition, the blood supply is more abundant than other sites, so distant lymph node metastasis is more likely to occur. Because the hN staging includes the location of lymph node metastasis in the N staging diagnostic criteria, and the location of the tumor is related to the location of the lymph node metastasis, therefore, the hN staging is related to the tumor’s location.
Verlato et al. [40] found that the metastatic lymph nodes are the most important prognostic factors in patients with GC. However, their prognostic significance often diminishes over time. The mortality peak of GC patients is related to the N stage, and the higher the stage, the more the mortality peak. The peak mortality caused by the N stage generally occurred within 24 months after surgery, and the mortality caused by different N stages tended to be the same after that. After 24 months, the biological characteristics of the tumor, such as Lauren classification, tumor location, and histological type, were more relevant to the prognosis of GC patients. Therefore, tumor site is not an independent prognostic factor for patients with early GC. As time goes by, the influence of the N stage on the tumor site also gradually decreases. This finding explains two problems. First, Verlato et al. [40] found that in the multivariate Cox analysis after 24 months of surgery, compared with N0, the HR value of N1 was less than 1, indicating that more lymph node metastasis had a protective effect on the prognosis of patients, consistent with this study. This indicates that the long-term prediction accuracy of N staging for patients has decreased over time, resulting in a phenomenon that does not meet theoretical expectations. Second, it further explains the advantages of hN staging over pN staging. hN staging incorporates the biological characteristics of the tumor. Therefore, in patients with longer survival time, although the prognostic advantage of N staging is reduced, the prognostic ability of the biological characteristics of the tumor is gradually increased. Hence, hN staging has improved the overall prognostic ability of patients compared with pN staging.
This staging system also has some limitations. Firstly, this is a retrospective study, and the sample recording process may be biased. In addition, this is a single-center study. More patients and testing centers could make this study more accurate and reliable. Secondly, the limitations of the hybrid staging system arise from its complexity. The system requires more preliminary preparation and staging calculation than the 8th AJCC staging system. This can increase the workload for surgeons and pathologists, who need to record the lymph node clearance. The hybrid staging system is also more complex than AJCC N staging, which utilizes only the number of positive lymph nodes. Physicians may require some study and practice to become proficient in its application.

5. Conclusions

Both the number and location of positive lymph nodes significantly impact the prognosis of patients with GC. The lymph nodes location-number hybrid staging system can improve the prognostic value of GC patients and enhance the correlation between the mixed staging and the tumor’s location and biological characteristics to improve the prediction efficiency. It can be used as a new installment instead of the 8th AJCC staging.

Author Contributions

J.W., H.W. and X.Y. designed and conceived the project together, and they made the same contribution to the work. J.W., H.W. and X.Y. interpreted and analyzed the data. Professor Y.X. revised the important key content of the manuscript. J.W., H.W., X.Y., X.W., Y.W., Z.L., J.Z. and Y.Z. participated in patient information collection. All authors have read and agreed to the published version of the manuscript.

Funding

This research was funded by Nn10 Program of Harbin Medical University Cancer Hospital, China, No. Nn10 PY 2017-03. And The APC was funded by Nn10 Program.

Institutional Review Board Statement

The study was approved by the Ethics Committee of the Affiliated Tumor Hospital of Harbin Medical University. The ethic code for our study is 2018-02-R.

Informed Consent Statement

All study participants or their legal guardians provided informed written consent for personal and medical data collection prior to study enrollment.

Data Availability Statement

Due to patient privacy, no Data Availability Statement was provided for this article.

Acknowledgments

This work was supported by Nn10 Program of Harbin Medical University Cancer Hospital, China, No. Nn10 PY 2017-03.

Conflicts of Interest

The authors declare no conflict of interest.

References

  1. Sung, H.; Ferlay, J.; Siegel, R.L.; Laversanne, M.; Soerjomataram, I.; Jemal, A.; Bray, F. Global Cancer Statistics 2020: GLOBOCAN Estimates of Incidence and Mortality Worldwide for 36 Cancers in 185 Countries. CA Cancer J. Clin. 2021, 71, 209–249. [Google Scholar] [CrossRef] [PubMed]
  2. Biondi, A.; Hyung, W.J. Seventh edition of TNM classification for gastric cancer. J. Clin. Oncol. 2011, 29, 4338–4339. [Google Scholar] [CrossRef] [PubMed]
  3. Kutlu, O.C.; Watchell, M.; Dissanaike, S. Metastatic lymph node ratio successfully predicts prognosis in western gastric cancer patients. Surg. Oncol. 2015, 24, 84–88. [Google Scholar] [CrossRef] [PubMed]
  4. Kooby, D.A.; Suriawinata, A.; Klimstra, D.S.; Brennan, M.F.; Karpeh, M.S. Biologic predictors of survival in node-negative gastric cancer. Ann. Surg. 2003, 237, 828–835. [Google Scholar] [CrossRef] [PubMed]
  5. Behrns, K.E.; Dalton, R.R.; van Heerden, J.A.; Sarr, M.G. Extended lymph node dissection for gastric cancer. Is it of value? Surg. Clin. N. Am. 1992, 72, 433–443. [Google Scholar] [CrossRef]
  6. Cuschieri, A.; Weeden, S.; Fielding, J.; Bancewicz, J.; Craven, J.; Joypaul, V.; Sydes, M.; Fayers, P. Patient survival after D1 and D2 resections for gastric cancer: Long-term results of the MRC randomized surgical trial. Surgical Co-operative Group. Br. J. Cancer 1999, 79, 1522–1530. [Google Scholar] [CrossRef]
  7. Siewert, J.R.; Böttcher, K.; Stein, H.J.; Roder, J.D. Relevant prognostic factors in gastric cancer: Ten-year results of the German Gastric Cancer Study. Ann. Surg. 1998, 228, 449–461. [Google Scholar] [CrossRef]
  8. Maruyama, K.; Gunvén, P.; Okabayashi, K.; Sasako, M.; Kinoshita, T. Lymph node metastases of gastric cancer. General pattern in 1931 patients. Ann. Surg. 1989, 210, 596–602. [Google Scholar] [CrossRef]
  9. Martinez-Ramos, D.; Calero, A.; Escrig-Sos, J.; Mingol, F.; Daroca-Jose, J.M.; Sauri, M.; Arroyo, A.; Salvador-Sanchis, J.L.; de Juan, M.; Calpena, R.; et al. Prognosis for gastric carcinomas with an insufficient number of examined negative lymph nodes. Eur. J. Surg. Oncol. 2014, 40, 358–365. [Google Scholar] [CrossRef]
  10. He, X.; Wu, W.; Lin, Z.; Ding, Y.; Si, J.; Sun, L.M. Validation of the American Joint Committee on Cancer (AJCC) 8th edition stage system for gastric cancer patients: A population-based analysis. Gastric Cancer 2018, 21, 391–400. [Google Scholar] [CrossRef]
  11. Marrelli, D.; Ferrara, F.; Giacopuzzi, S.; Morgagni, P.; Di Leo, A.; De Franco, L.; Pedrazzani, C.; Saragoni, L.; De Manzoni, G.; Roviello, F. Incidence and Prognostic Value of Metastases to "Posterior" and Para-aortic Lymph Nodes in Resectable Gastric Cancer. Ann. Surg. Oncol. 2017, 24, 2273–2280. [Google Scholar] [CrossRef]
  12. Choi, Y.Y.; An, J.Y.; Katai, H.; Seto, Y.; Fukagawa, T.; Okumura, Y.; Kim, D.W.; Kim, H.I.; Cheong, J.H.; Hyung, W.J.; et al. A Lymph Node Staging System for Gastric Cancer: A Hybrid Type Based on Topographic and Numeric Systems. PLoS ONE 2016, 11, e0149555. [Google Scholar] [CrossRef]
  13. Rosa, F.; Costamagna, G.; Doglietto, G.B.; Alfieri, S. Classification of nodal stations in gastric cancer. Transl. Gastroenterol. Hepatol. 2017, 2, 2. [Google Scholar] [CrossRef]
  14. Karavokyros, I.; Michalinos, A. Favoring D(2)-Lymphadenectomy in Gastric Cancer. Front. Surg. 2018, 5, 42. [Google Scholar] [CrossRef]
  15. Chen, M.W.; Chan, C.P.; Lin, Y.J.; Yen, H.H. Anatomical location-based nodal staging system is superior to the 7th edition of the American Joint Committee on Cancer staging system among patients with surgically resected, histologically low-grade gastric cancer: A single institutional experience. PLoS ONE 2019, 14, e0211836. [Google Scholar] [CrossRef]
  16. Lauricella, S.; Caricato, M.; Mascianà, G.; Carannante, F.; Carnazza, M.; Bonaccorso, A.; Angeletti, S.; Ciccozzi, M.; Coppola, R.; Capolupo, G.T. Topographic lymph node staging system shows prognostic superiority compared to the 8th edition of AJCC TNM in gastric cancer. A western monocentric experience. Surg. Oncol. 2020, 34, 223–233. [Google Scholar] [CrossRef]
  17. Sano, T.; Coit, D.G.; Kim, H.H.; Roviello, F.; Kassab, P.; Wittekind, C.; Yamamoto, Y.; Ohashi, Y. Proposal of a new stage grouping of gastric cancer for TNM classification: International Gastric Cancer Association staging project. Gastric Cancer 2017, 20, 217–225. [Google Scholar] [CrossRef]
  18. Abdel-Rahman, O. Validation of the 8th AJCC staging system for gastric cancer in a population-based setting. Expert Rev. Gastroenterol. Hepatol. 2018, 12, 525–530. [Google Scholar] [CrossRef]
  19. Huang, S.F.; Chien, T.H.; Fang, W.L.; Wang, F.; Tsai, C.Y.; Hsu, J.T.; Yeh, C.N.; Chen, T.C.; Wu, R.C.; Chiu, C.T.; et al. The 8th edition American Joint Committee on gastric cancer pathological staging classification performs well in a population with high proportion of locally advanced disease. Eur. J. Surg. Oncol. 2018, 44, 1634–1639. [Google Scholar] [CrossRef]
  20. Japanese Gastric Cancer Association. Japanese classification of gastric carcinoma: 3rd English edition. Gastric Cancer 2011, 14, 101–112. [Google Scholar] [CrossRef]
  21. Mine, S.; Yamada, K.; Grabsch, H.; Sano, T.; Ishiyama, A.; Hirasawa, T.; Yamamoto, N.; Hiki, N.; Yamaguchi, T. The prognostic significance of tumor laterality in patients with esophageal squamous cell carcinoma. J. Surg. Oncol. 2012, 105, 66–70. [Google Scholar] [CrossRef] [PubMed]
  22. Jung, Y.J.; Seo, H.S.; Kim, J.H.; Park, C.H.; Lee, H.H. Cross-Sectional Location of Gastric Cancer Affects the Long-Term Survival of Patients as Tumor Invasion Deepens. Ann. Surg. Oncol. 2017, 24, 3947–3953. [Google Scholar] [CrossRef] [PubMed]
  23. Shida, A.; Mitsumori, N.; Fujioka, S.; Takano, Y.; Fujisaki, M.; Hashizume, R.; Takahashi, N.; Ishibashi, Y.; Yanaga, K. Sentinel Node Navigation Surgery for Early Gastric Cancer: Analysis of Factors Which Affect Direction of Lymphatic Drainage. World J. Surg. 2018, 42, 766–772. [Google Scholar] [CrossRef] [PubMed]
  24. Yu, P.; Du, Y.; Xu, Z.; Huang, L.; Cheng, X. Comparison of D2 and D2 plus radical surgery for advanced distal gastric cancer: A randomized controlled study. World J. Surg. Oncol. 2019, 17, 28. [Google Scholar] [CrossRef]
  25. Han, W.H.; Joo, J.; Eom, B.W.; Ryu, K.W.; Kim, Y.W.; Kook, M.C.; Yoon, H.M. Factors associated with metastasis in superior mesenteric vein lymph node in subtotal gastrectomy for gastric cancer: Retrospective case control study. Chin. J. Cancer Res. 2020, 32, 43–50. [Google Scholar] [CrossRef]
  26. Hayashi, H.; Ochiai, T.; Suzuki, T.; Shimada, H.; Hori, S.; Takeda, A.; Miyazawa, Y. Superiority of a new UICC-TNM staging system for gastric carcinoma. Surgery 2000, 127, 129–135. [Google Scholar] [CrossRef]
  27. Lu, J.; Zheng, C.H.; Cao, L.L.; Li, P.; Xie, J.W.; Wang, J.B.; Lin, J.X.; Chen, Q.Y.; Lin, M.; Tu, R.H.; et al. Comparison of the 7th and 8th editions of the American joint committee on cancer TNM classification for patients with stage III gastric cancer. Oncotarget 2017, 8, 83555–83562. [Google Scholar] [CrossRef]
  28. Wu, C.W.; Hsiung, C.A.; Lo, S.S.; Hsieh, M.C.; Chen, J.H.; Li, A.F.; Lui, W.Y.; Whang-Peng, J. Nodal dissection for patients with gastric cancer: A randomised controlled trial. Lancet Oncol. 2006, 7, 309–315. [Google Scholar] [CrossRef]
  29. Kim, E.Y.; Song, K.Y.; Lee, J. Does Hospital Volume Really Affect the Surgical and Oncological Outcomes of Gastric Cancer in Korea? J. Gastric Cancer 2017, 17, 246–254. [Google Scholar] [CrossRef]
  30. Maruyama, K.; Katai, H. Surgical treatment of gastric cancer in Japan, trend from standardization to individualization. Chirurgia 2014, 109, 722–730. [Google Scholar]
  31. Katai, H.; Ishikawa, T.; Akazawa, K.; Isobe, Y.; Miyashiro, I.; Oda, I.; Tsujitani, S.; Ono, H.; Tanabe, S.; Fukagawa, T.; et al. Five-year survival analysis of surgically resected gastric cancer cases in Japan: A retrospective analysis of more than 100,000 patients from the nationwide registry of the Japanese Gastric Cancer Association (2001–2007). Gastric Cancer 2018, 21, 144–154. [Google Scholar] [CrossRef]
  32. Faiz, Z.; Hayashi, T.; Yoshikawa, T. Lymph node dissection for gastric cancer: Establishment of D2 and the current position of splenectomy in Europe and Japan. Eur. J. Surg. Oncol. 2021, 47, 2233–2236. [Google Scholar] [CrossRef]
  33. Wen, J.; Yang, Y.; Liu, P.; Ye, F.; Tang, H.; Huang, X.; Zhong, S.; Xie, X. Development and validation of a nomogram for predicting survival on the base of modified lymph node ratio in breast cancer patients. Breast 2017, 33, 14–22. [Google Scholar] [CrossRef]
  34. Wang, J.; Dang, P.; Raut, C.P.; Pandalai, P.K.; Maduekwe, U.N.; Rattner, D.W.; Lauwers, G.Y.; Yoon, S.S. Comparison of a lymph node ratio-based staging system with the 7th AJCC system for gastric cancer: Analysis of 18,043 patients from the SEER database. Ann. Surg. 2012, 255, 478–485. [Google Scholar] [CrossRef]
  35. Marchet, A.; Mocellin, S.; Ambrosi, A.; Morgagni, P.; Garcea, D.; Marrelli, D.; Roviello, F.; de Manzoni, G.; Minicozzi, A.; Natalini, G.; et al. The ratio between metastatic and examined lymph nodes (N ratio) is an independent prognostic factor in gastric cancer regardless of the type of lymphadenectomy: Results from an Italian multicentric study in 1853 patients. Ann. Surg. 2007, 245, 543–552. [Google Scholar] [CrossRef]
  36. Xie, J.; Pang, Y.; Li, X.; Wu, X. The log odds of negative lymph nodes/T stage: A new prognostic and predictive tool for resected gastric cancer patients. J. Cancer Res. Clin. Oncol. 2021, 147, 2259–2269. [Google Scholar] [CrossRef]
  37. Li, G.C.; Jia, X.C.; Zhao, Q.C.; Zhang, H.W.; Yang, P.; Xu, L.L.; Pang, F.N.; Sun, J.B. The expression of epidermal growth factor receptor 1 and human epidermal growth factor receptor 2 based on tumor location affect survival in gastric cancer. Medicine 2020, 99, e20460. [Google Scholar] [CrossRef]
  38. Eom, B.W.; Jung, K.W.; Won, Y.J.; Yang, H.; Kim, Y.W. Trends in Gastric Cancer Incidence According to the Clinicopathological Characteristics in Korea, 1999–2014. Cancer Res. Treat. 2018, 50, 1343–1350. [Google Scholar] [CrossRef]
  39. Yao, K.; Uedo, N.; Kamada, T.; Hirasawa, T.; Nagahama, T.; Yoshinaga, S.; Oka, M.; Inoue, K.; Mabe, K.; Yao, T.; et al. Guidelines for endoscopic diagnosis of early gastric cancer. Dig. Endosc. 2020, 32, 663–698. [Google Scholar] [CrossRef]
  40. Verlato, G.; Marrelli, D.; Accordini, S.; Bencivenga, M.; Di Leo, A.; Marchet, A.; Petrioli, R.; Zoppini, G.; Muggeo, M.; Roviello, F.; et al. Short-term and long-term risk factors in gastric cancer. World J. Gastroenterol. 2015, 21, 6434–6443. [Google Scholar] [CrossRef]
Figure 1. Extra-perigastric lymph node groups (EP), lesser curvature lymph node groups (LC), and greater curvature lymph node groups (GC) around the stomach. Figure source: Japanese Gastric Cancer Association (JGCA) [20].
Cancers 15 02659 g001
Figure 2. Comparison of AUC of hN and pN under N stage for training cohort and validation cohort, respectively. (a) AUC of training cohort, hN AUC = 0.752 (0.733, 0.772), pN AUC = 0.728 (0.708, 0.749). (b) AUC of validation cohort, 2016-hN AUC = 0.812 (0.780, 0.845), 2016-pN AUC = 0.784 (0.754, 0.824).
Cancers 15 02659 g002
Figure 3. Comparison of DCA under N stage and TNM stage between the 3-year and 5-year hN staging and the 8th edition AJCC pathological staging in the training cohort. (a) Comparison of hN and pN DCA at 3 years in the training cohort. (b) Comparison of hN and pN DCA at 5 years in the training cohort. (c) Comparison of hTNM versus pTNM DCA at 3 years in the training cohort. (d) Comparison of hTNM versus pTNM DCA at 5 years in the training cohort. (e) Comparison of 2016-hN and 2016-pN DCA at 3 years in the validation cohort. (f) Comparison of 2016-hN and 2016-pN DCA at 5 years in the validation cohort. (g) Comparison of 2016-hTNM and 2016-pTNM DCA at 3 years in the validation cohort. (h) Comparison of 2016-hTNM and 2016-pTNM DCA at 5 years in the validation cohort.
Cancers 15 02659 g003
Figure 4. Kaplan–Meier curves of 5-year overall survival (OS) rates comparing subgroups according to the stage. (a) Survival curves of patients in each subgroup under the hN of the training cohort, with p < 0.001 between the subgroups. (b) Survival curves of patients in each subgroup under hN in the validation cohort, with p < 0.001 between the subgroups.
Cancers 15 02659 g004
Figure 5. The prognostic Nomogram was established according to the independent prognostic factors, showing the relationship between the predictive variables in the prediction model.
Cancers 15 02659 g005
Table 1. Patient baseline characteristics.
CharacteristicsTotal (%)Training Cohort hNValidation Cohort hNp
n33542598756
Age, n (%) 0.060
≤601899 (56.62%)1494 (44.5%)405 (12.1%)
>601455 (43.38%)1104 (32.9%)351 (10.5%)
Gender, n (%) 0.153
Male2444 (72.87%)1909 (56.9%)535 (16%)
Female910 (27.13%)689 (20.5%)221 (6.6%)
Tumor location, n (%) 0.383
L2419 (72.13%)1890 (56.4%)529 (15.8%)
M530 (15.80%)403 (12%)127 (3.8%)
U354 (10.55%)269 (8%)85 (2.5%)
LMU51 (1.52%)36 (1.1%)15 (0.4%)
hN, n (%) <0.001
hN01671 (49.82%)1291 (38.5%)380 (11.3%)
hN1587 (17.50%)483 (14.4%)104 (3.1%)
hN2588 (17.53%)443 (13.2%)145 (4.3%)
hN3a280 (8.35%)223 (6.6%)57 (1.7%)
hN3b228 (6.80%)158 (4.7%)70 (2.1%)
pT stage, n (%) <0.001
T1854 (25.47%)656 (19.6%)198 (5.9%)
T2527 (15.71%)417 (12.4%)110 (3.3%)
T31218 (36.31%)901 (26.9%)317 (9.5%)
T4755 (22.51%)624 (18.6%)131 (3.9%)
hTNM, n (%) 0.316
1154 (34.41%)885 (26.4%)269 (8%)
1029 (30.68%)814 (24.3%)215 (6.4%)
1171 (34.91%)899 (26.8%)272 (8.1%)
Histological type, n (%) 0.037
Adenocarcinoma2679 (79.87%)2090 (62.3%)589 (17.6%)
Low adhesion adenocarcinoma460 (13.71%)347 (10.3%)113 (3.4%)
mucoid adenocarcinoma151 (4.50%)120 (3.6%)31 (0.9%)
Signet-ring cell carcinoma64 (1.92%)41 (1.2%)23 (0.7%)
Differentiation degree, n (%) 0.031
G1298 (8.88%)221 (6.6%)77 (2.3%)
G21736 (51.76%)1325 (39.5%)411 (12.3%)
G31320 (39.36%)1052 (31.4%)268 (8%)
HER-2, n (%) <0.001
01772 (52.83%)1303 (38.8%)469 (14%)
1+926 (27.61%)758 (22.6%)168 (5%)
2+434 (12.94%)356 (10.6%)78 (2.3%)
3+222 (6.62%)181 (5.4%)41 (1.2%)
BMI, median (IQR) 22.59 (20.42, 24.8)23.04 (20.76, 25.09)0.029
CEA, median (IQR) 2.03 (1.2, 3.3)1.89 (1.07, 3.04)0.005
CA-199, median (IQR) 9.09 (5.6, 16.89)10.02 (6, 16.89)0.183
MLNs, median (IQR) 1 (0, 4)0 (0, 5)0.653
RLNs, median (IQR) 27 (20, 35)27 (21, 34)0.995
LNRS, median (IQR) 0.02 (0, 0.17)0 (0, 0.19)0.556
Tumor size, median (IQR) 40 (30, 60)45 (30, 60)0.042
Table 2. Baseline table of patients in the training cohort from 2011 to 2015.
CharacteristicsPatients,
n (%)
hN0,
n (%)
hN1,
n (%)
hN2,
n (%)
hN3a,
n (%)
hN3b,
n (%)
p
n25981291 (49.69%)483 (18.59%)443 (17.05%)223 (8.58%)158 (6.08%)
Age, Mean ± SD57.97 ± 10.0557.61 ± 9.9359.43 ± 10.0257.79 ± 10.9157.67 ± 9.2357.42 ± 9.400.009
BMI, Mean ± SD22.75 ± 3.2223.12 ± 3.2122.59 ± 3.1522.37 ± 3.1722.18 ± 3.1922.18 ± 3.42<0.001
CEA, Mean ± SD6.64 ± 39.563.63 ± 14.936.45 ± 46.378.87 ± 42.587.45 ± 20.9724.36 ± 106.42<0.001
CA-199, Mean ± SD30.78 ± 102.6317.47 ± 58.8826.04 ± 82.7738.62 ± 113.7655.37 ± 151.2197.39 ± 225.42<0.001
RLNs, Mean ± SD28.21 ± 11.8825.65 ± 10.8327.84 ± 11.9631.47 ± 12.4729.73 ± 10.9638.96 ± 11.04<0.001
MLNs, Mean ± SD3.62 ± 6.6802.21 ± 2.086.87 ± 6.167.47 ± 2.7722.97 ± 8.03<0.001
LNRs, Mean ± SD0.12 ± 0.1900.09 ± 0.080.24 ± 0.200.28 ± 0.140.61 ± 0.18<0.001
Age, n (%) 0.087
≤601494 (57.51%)766 (59.33%)254 (52.59%)246 (55.53%)134 (60.09%)94 (59.49%)
>601104 (42.49%)525 (40.67%)229 (47.41%)197 (44.47%)89 (39.91%)64 (40.51%)
Gender, n (%) 0.567
Male1909 (73.48%)943 (73.04%)362 (74.95%)316 (71.33%)166 (74.44%)122 (77.22%)
Female689 (26.52%)348 (26.96%)121 (25.05%)127 (28.67%)57 (25.56%)36 (22.78%)
Tumor location,
n (%)
<0.001
L1890 (72.75%)974 (75.45%)367 (75.98%)311 (70.20%)146 (65.47%)92 (58.23%)
M403 (15.51%)185 (14.33%)60 (12.42%)74 (16.70%)50 (22.42%)34 (21.52%)
U269 (10.35%)123 (9.53%)53 (10.97%)45 (10.17%)24 (10.76%)24 (15.19%)
LMU36 (1.39%)9 (0.70%)3 (0.62%)13 (2.93%)3 (1.34%)8 (5.07%)
T stage, n (%) <0.001
T1656 (25.25%)570 (44.15%)61 (12.63%)22 (4.97%)3 (1.35%)0 (0%)
T2417 (16.05%)254 (19.67%)85 (17.60%)52 (11.74%)21 (9.42%)5 (3.16%)
T3901 (34.68%)326 (25.25%)197 (40.79%)212 (47.86%)104 (46.64%)62 (39.24%)
T4624 (24.02%)141 (10.92%)140 (28.98%)157 (35.43%)95 (42.59%)91 (57.60%)
TNM stage, n (%) <0.001
I885 (34.06%)824 (63.83%)61 (12.63%)0 (0%)0 (0%)0 (0%)
II814 (31.33%)453 (35.09%)282 (58.39%)76 (17.16%)3 (1.35%)0 (0%)
III899 (34.61%)14 (1.08%)140 (29.98%)367 (82.84%)220 (98.65%)158 (100%)
Histological type,
n (%)
<0.001
Adenocarcinoma2090 (80.45%)1051 (81.41%)396 (81.99%)358 (80.81%)170 (76.23%)115 (72.78%)
Low adhesion adenocarcinoma347 (13.36%)187 (14.48%)51 (10.56%)50 (11.51%)32 (14.35%)27 (17.09%)
Mucoid adenocarcinoma120 (4.62%)50 (3.87%)21 (4.35%)24 (5.42%)16 (7.17%)9 (5.70%)
Signet-ring cell carcinoma41 (1.57%)3 (0.24%)15 (3.10%)11 (2.48%)5 (2.24%)7 (4.43%)
Differentiation degree, n (%) <0.001
G1221 (8.51%)144 (11.15%)37 (7.66%)23 (5.19%)11 (4.93%)6 (3.80%)
G21325 (51.00%)740 (57.32%)223 (46.17%)212 (47.86%)101 (45.29%)49 (31.01%)
G31052 (40.49%)407 (31.53%)223 (46.17%)208 (46.95%)111 (49.78%)103 (65.19%)
HER-2, n (%) 0.028
01303 (50.15%)686 (53.14%)241 (49.90%)197 (44.47%)109 (48.88%)70 (44.30%)
1+758 (29.18%)364 (28.20%)136 (28.16%)136 (30.70%)67 (30.04%)55 (34.81%)
2+356 (13.70%)172 (13.32%)71 (14.70%)67 (15.12%)28 (12.56%)18 (11.39%)
3+181 (6.97%)69 (5.34%)35 (7.24%)43 (9.71%)19 (8.52%)15 (9.50%)
Table 3. Baseline table of patients in the validation cohort in 2016.
CharacteristicsPatients,
n (%)
2016-hN0,
n (%)
2016-hN1,
n (%)
2016-hN2,
n (%)
2016-hN3a,
n (%)
2016-hN3b,
n (%)
p
n756380 (50.26%)104 (13.76%)145 (19.18%)57 (7.54%)70 (9.26%)
Age, Mean ± SD59.10 ± 9.8258.53 ± 9.9960.34 ± 9.9059.23 ± 9.8160.46 ± 9.0958.93 ± 9.400.398
BMI, Mean ± SD23.01 ± 3.2722.24 ± 3.0623.36 ± 3.8822.79 ± 3.2723.18 ± 3.0921.57 ± 3.170.001
CEA, Mean ± SD4.80 ± 15.493.53 ± 12.363.66 ± 7.915.84 ± 11.785.54 ± 17.0210.62 ± 33.420.022
CA-199, Mean ± SD32.31 ± 112.9618.65 ± 68.4212.90 ± 54.0545.01 ± 148.1253.48 ± 147.1675.23 ± 205.810.021
RLNs, Mean ± SD28.10 ± 11.3026.43 ± 11.1527.40 ± 11.3828.92 ± 10.3228.75 ± 11.2636.00 ± 10.73<0.001
MLNs, Mean ± SD3.63 ± 6.0201.96 ± 1.546.05 ± 3.987.02 ± 1.9118.01 ± 7.00<0.001
LNRs, Mean ± SD0.12 ± 0.1900.09 ± 0.080.22 ± 0.150.27 ± 0.110.52 ± 0.17<0.001
Age, n (%) 0.859
≤60405 (53.57%)208 (54.74%)55 (52.88%)76 (52.41%)27 (47.37%)39 (55.71%)
>60351 (46.43%)172 (45.26%)49 (47.12%)69 (47.59%)30 (52.63%)31 (44.29%)
Gender, n (%) 0.325
Male535 (70.77%)268 (70.53%)74 (71.15%)98 (67.59%)47 (82.46%)48 (68.57%)
Female221 (29.23%)112 (29.47%)30 (28.85%)47 (32.41%)10 (17.54%)22 (31.43%)
Tumor location,
n (%)
<0.001
L529 (69.97%)280 (73.68%)75 (72.12%)103 (71.03%)39 (68.42%)32 (45.71%)
M127 (16.80%)64 (16.84%)16 (15.38%)22 (15.17%)8 (14.04%)17 (24.29%)
U85 (11.24%)35 (9.21%)13 (12.50%)15 (10.35%)10 (17.54%)12 (17.14%)
LMU15 (1.99%)1 (0.27%)0 (0%)5 (3.45%)0 (0%)9 (12.86%)
T stage, n (%) <0.001
T1198 (26.19%)173 (45.53%)16 (15.38%)7 (4.83%)1 (1.75%)1 (1.43%)
T2110 (14.55%)80 (21.05%)11 (10.58%)13 (8.97%)5 (8.77%)1 (1.43%)
T3317 (41.93%)93 (24.47%)60 (57.69%)87 (60.00%)35 (61.40%)42 (60.00%)
T4131 (17.33%)34 (8.95%)17 (16.35%)38 (26.20%)16 (27.08%)26 (37.14%)
TNM stage, n (%) <0.001
I269 (35.58%)253 (66.58%)16 (15.38%)0 (%)0 (0%)0 (0%)
II215 (28.44%)123 (32.37%)71 (68.27%)20 (13.79%)1 (1.75%)0 (0%)
III272 (35.98%)4 (1.05%)17 (16.35%)125 (86.21%)56 (98.25%)70 (100%)
Histological type,
n (%)
0.045
Adenocarcinoma589 (77.91%)310 (81.58%)82 (78.85%)111 (76.55%)42 (73.68%)44 (62.86%)
Low adhesion adenocarcinoma113 (14.95%)48 (12.63%)15 (14.42%)21(14.48%)9 (15.79%)20 (28.57%)
Mucoid adenocarcinoma31 (4.10%)14 (3.68%)4 (3.85%)8 (5.52%)4 (7.02%)1 (1.43%)
Signet-ring cell carcinoma23 (3.04%)8 (2.11%)3 (2.88%)5 (3.45%)2 (3.51%)5 (7.14%)
Differentiation degree, n (%) <0.001
G177 (10.19%)60 (15.79%)9 (8.65%)6 (4.14%)1 (1.75%)1 (1.43%)
G2411 (54.37%)212 (55.79%)44 (42.31%)96 (66.21%)26 (45.61%)33 (47.14%)
G3268 (35.44%)108 (28.42%)51 (49.04%)43 (29.65%)30 (52.64%)36 (51.43%)
HER-2, n (%) 0.384
0469 (62.04%)242 (63.68%)61 (58.65%)86 (59.31%)33 (57.89%)47 (67.14%)
1+168 (22.22%)87 (22.89%)24 (23.08%)33 (22.76%)10 (17.54%)14 (20.00%)
2+78 (10.32%)36 (9.47%)9 (8.65%)16 (11.03%)11 (19.30%)6 (8.57%)
3+41 (5.42%)15 (3.96%)10 (9.62%)10 (6.90%)3 (5.27%)3 (4.29%)
Table 4. Comparison of C-index of hN and pN under different differentiation degrees, T stage, and TNM stage. (a) Comparison of C-index between hN and pN with different differentiation degrees. G1: highly differentiated. G2: moderately differentiated. G3: Poorly differentiated. (b) Comparison of C-index between hN and pN at different T stages. (c) Comparison of C-index between hN and pN in different TNM stages.
(a)
NG1G2G3
hN0.7180.6830.750
pN0.7120.6710.737
(b)
NT1T2T3T4
hN0.5500.7030.7420.674
pN0.5310.6480.6890.660
(c)
NIIIIII
hN0.5200.6230.621
pN0.5200.6110.606
Table 5. Results of univariate and multivariate analyses using Cox proportional hazards model.
CharacteristicsTotal (N)Univariate AnalysisMultivariate Analysis
Hazard Ratio (95%CI)p ValueHazard Ratio (95%CI)p Value
BMI33540.934 (0.915–0.954)<0.0010.971 (0.950–0.991)0.006
CEA33541.003 (1.002–1.004)<0.0011.002 (1.001–1.003)0.002
CA-19933541.002 (1.002–1.002)<0.0011.001 (1.000–1.001)<0.001
MLNs33541.075 (1.070–1.080)<0.0011.017 (0.994–1.041)0.149
RLNs33541.018 (1.013–1.023)<0.0010.991 (0.982–0.999)0.030
LNRS335413.647 (11.711–15.902)<0.0010.907 (0.388–2.122)0.822
Tumor size33541.019 (1.017–1.021)<0.0011.002 (0.999–1.005)0.131
Age3354
≤601899Reference
>6014551.714 (1.505–1.952)<0.0011.195 (1.002–1.425)0.048
Gender3354
Male2444Reference
Female9100.868 (0.747–1.009)0.0651.000 (0.857–1.166)0.998
Tumor location3354
L2419Reference
M5301.266 (1.063–1.507)0.0081.081 (0.901–1.296)0.402
U3541.464 (1.205–1.780)<0.0011.320 (1.078–1.615)0.007
LMU513.554 (2.447–5.162)<0.0010.945 (0.617–1.447)0.794
hN3354
hN01671Reference
hN15871.359 (1.067–1.731)0.0130.612 (0.443–0.846)0.003
hN25884.516 (3.759–5.426)<0.0011.402 (0.945–2.078)0.093
hN3a2806.890 (5.615–8.453)<0.0011.854 (1.210–2.843)0.005
hN3b22816.234 (13.295–19.823)<0.0013.400 (2.051–5.637)<0.001
pT stage3354
T1854Reference
T25272.822 (1.922–4.146)<0.0012.055 (1.339–3.153)<0.001
T312187.811 (5.658–10.784)<0.0012.619 (1.509–4.546)<0.001
T475516.426 (11.921–22.633)<0.0014.643 (2.635–8.179)<0.001
hTNM3354
I1154Reference
II10292.958 (2.255–3.881)<0.0011.285 (0.783–2.107)0.321
III117113.411 (10.526–17.085)<0.0012.483 (1.249–4.935)0.009
Histological type3354
Adenocarcinoma2679Reference
Low adhesion adenocarcinoma4601.367 (1.144–1.633)<0.0011.547 (1.283–1.866)<0.001
mucoid adenocarcinoma1511.598 (1.220–2.094)<0.0011.176 (0.892–1.548)0.250
Signet-ring cell carcinoma642.610 (1.840–3.701)<0.0011.565 (1.094–2.239)0.014
Differentiation3354
G1298Reference
G217361.546 (1.151–2.078)0.0040.890 (0.659–1.202)0.448
G313202.223 (1.655–2.987)<0.0011.009 (0.744–1.369)0.953
HER-23354
01772Reference
1+9261.002 (0.859–1.168)0.981
2+4341.042 (0.854–1.271)0.688
3+2221.274 (0.996–1.630)0.054
Disclaimer/Publisher’s Note: The statements, opinions and data contained in all publications are solely those of the individual author(s) and contributor(s) and not of MDPI and/or the editor(s). MDPI and/or the editor(s) disclaim responsibility for any injury to people or property resulting from any ideas, methods, instructions or products referred to in the content.

