
Advanced Cell Culture Models Illuminate the Interplay between Mammary Tumor Cells and Activated Fibroblasts

 , , , , ,
  and
and 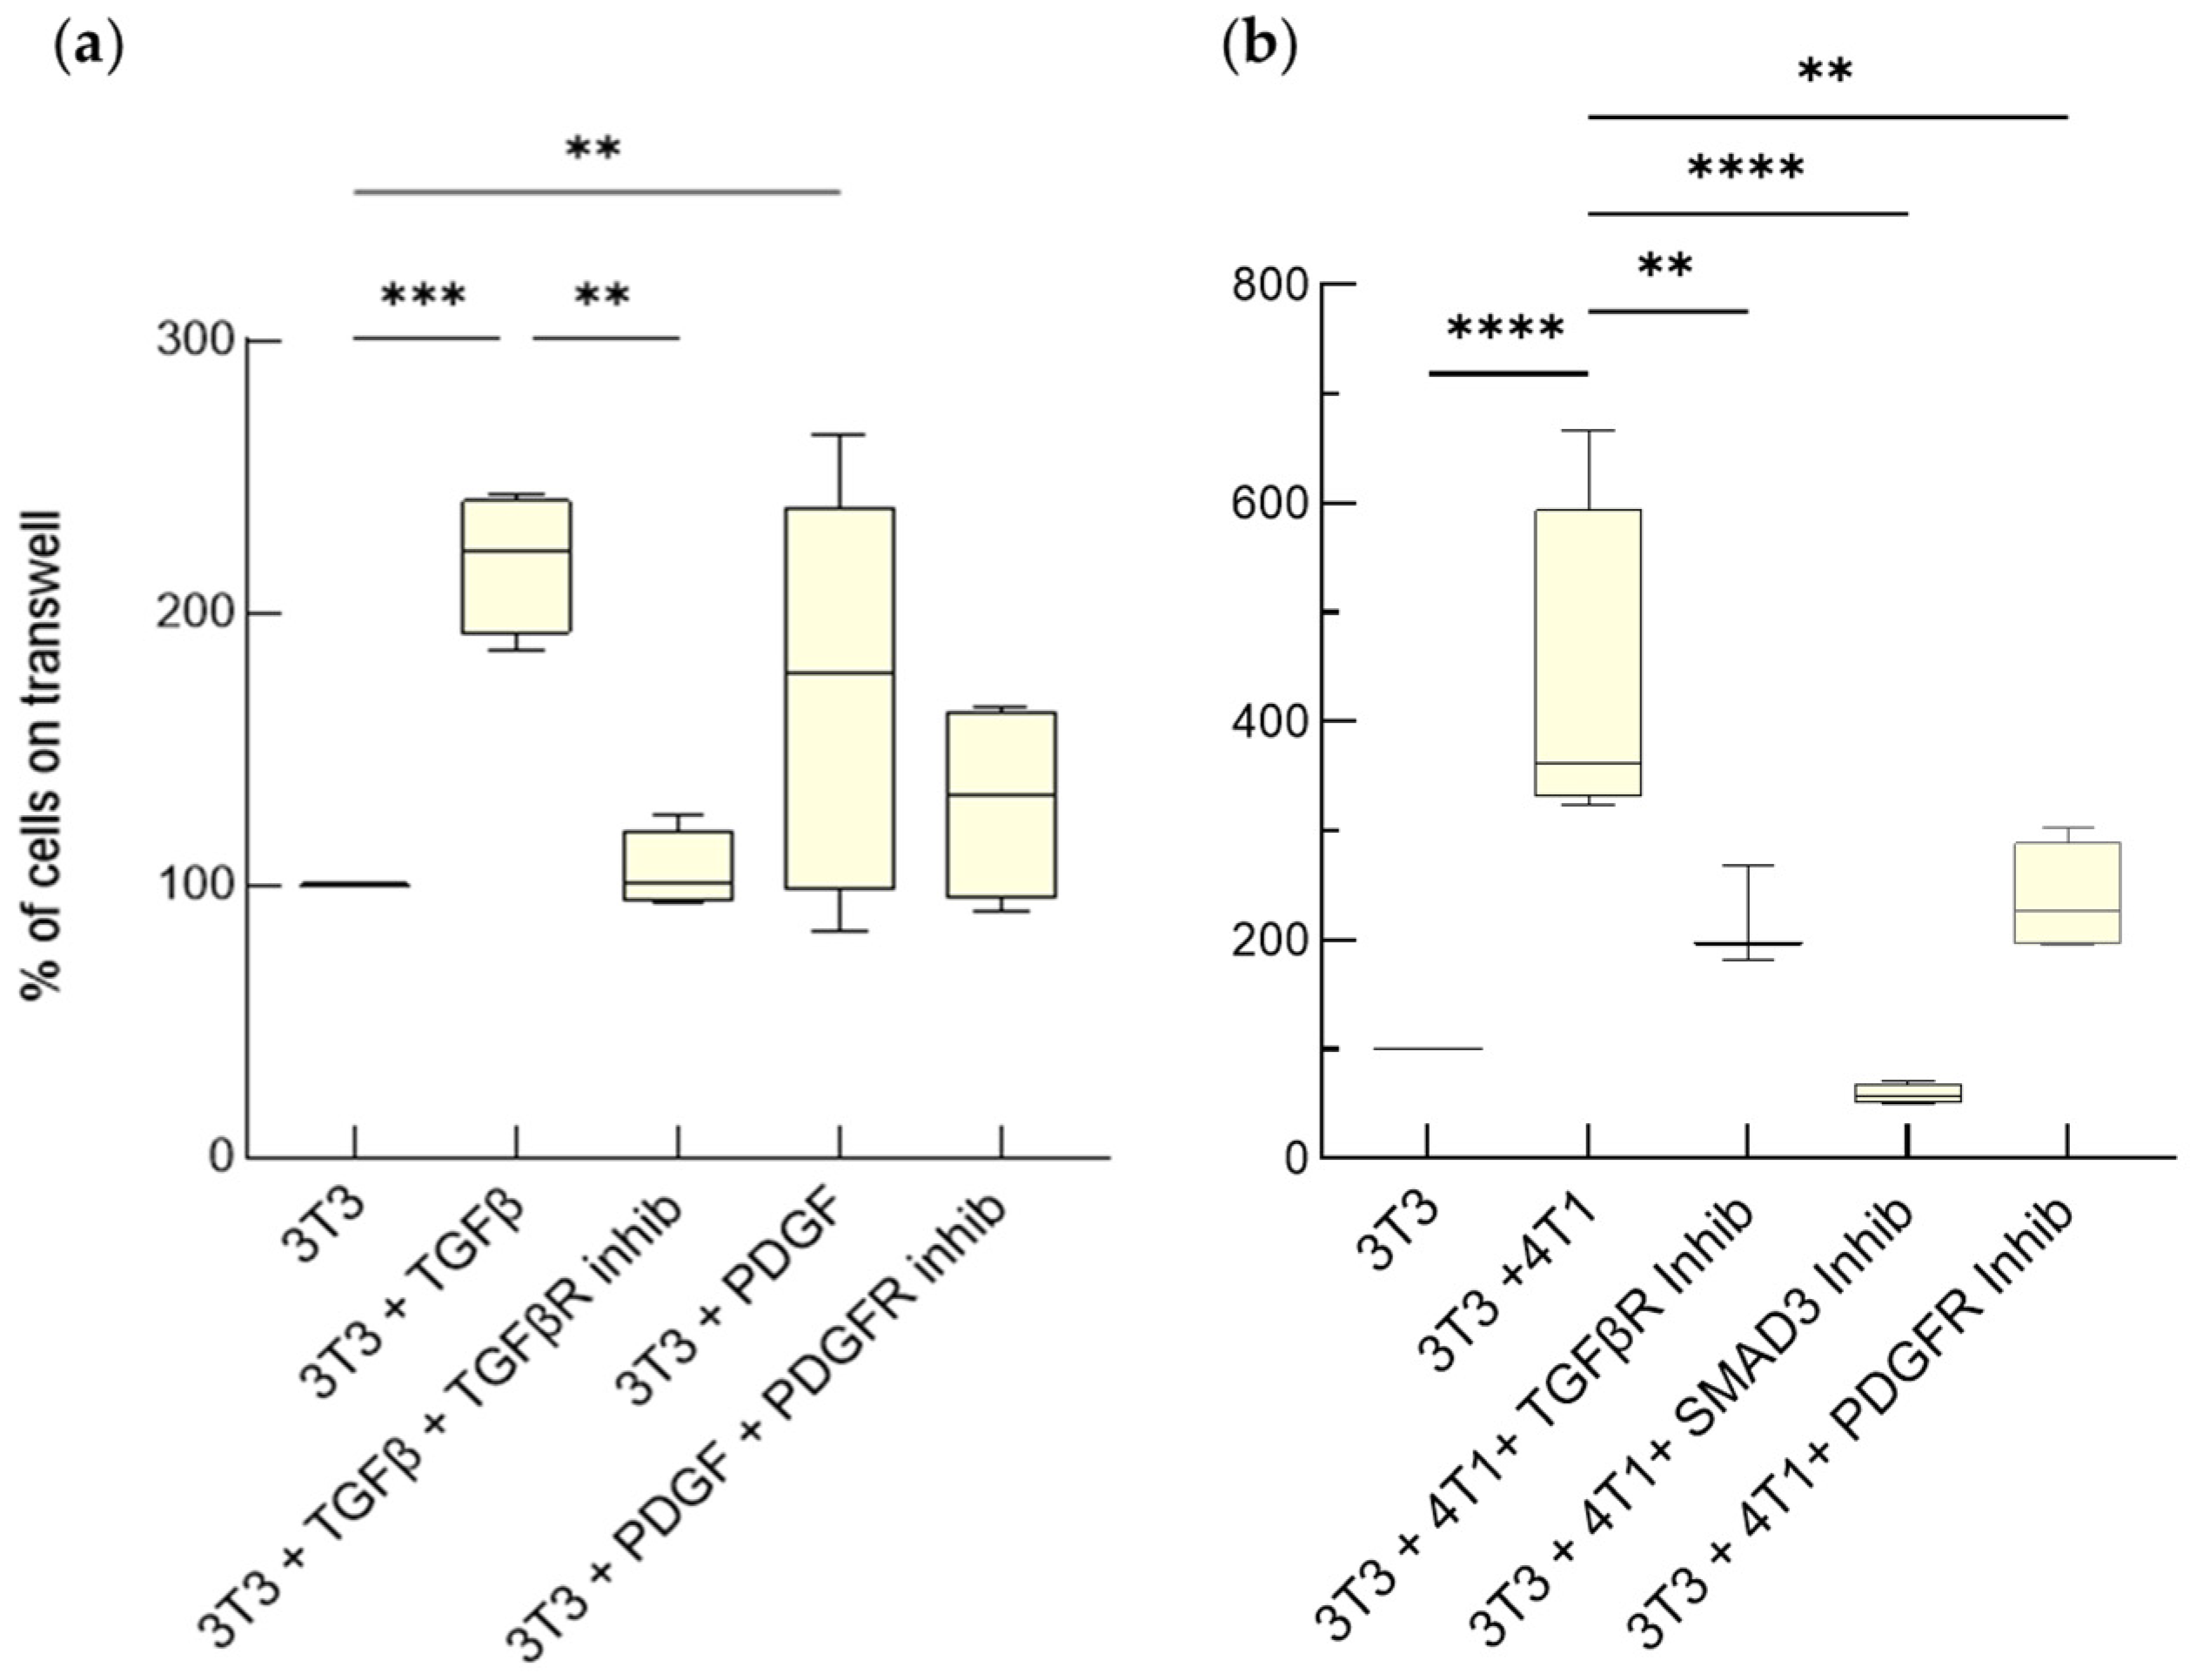
Abstract
:Simple Summary
Abstract
1. Introduction
2. Materials and Methods
2.1. Cell Culture
2.2. Reagents for Cell Treatment
2.3. Transwell Mono- and Co-Cultures
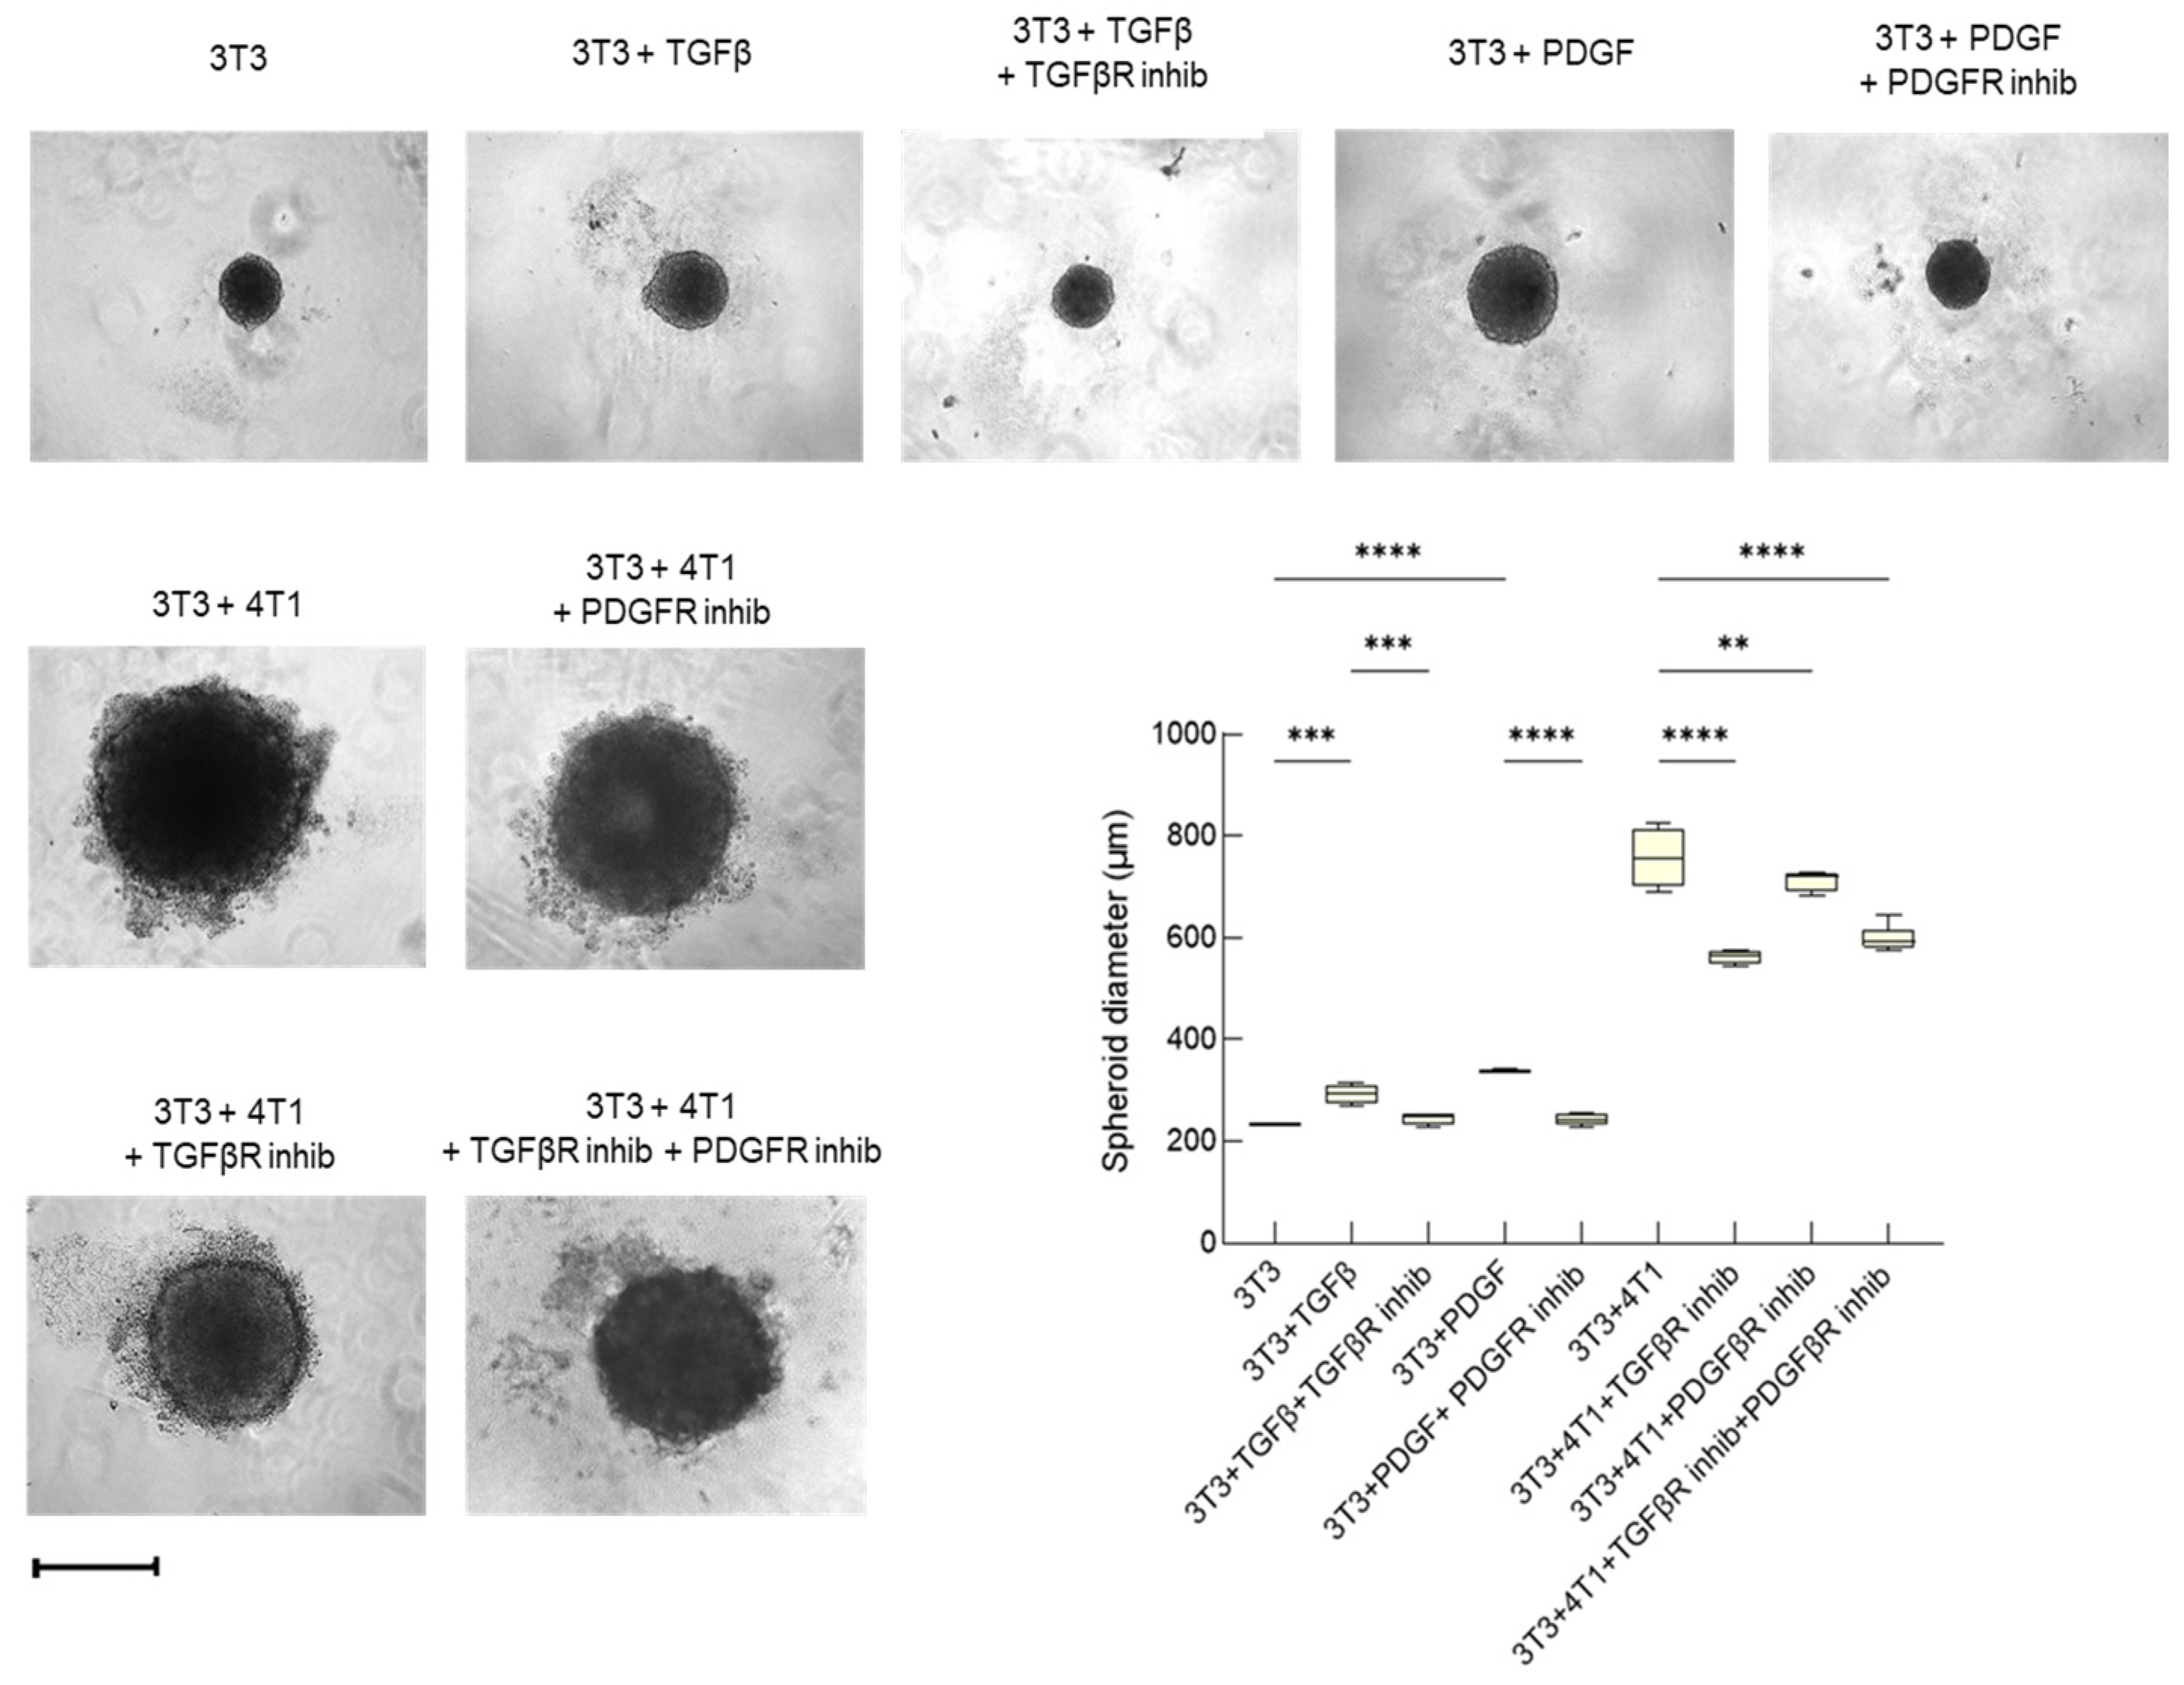
2.4. Monospheroids and Heterospheroids, and Paula Imaging
2.5. Cell Proliferation Assays
2.6. Quantification of IL-6 Released by Activated Fibroblasts
2.7. Viability Assays
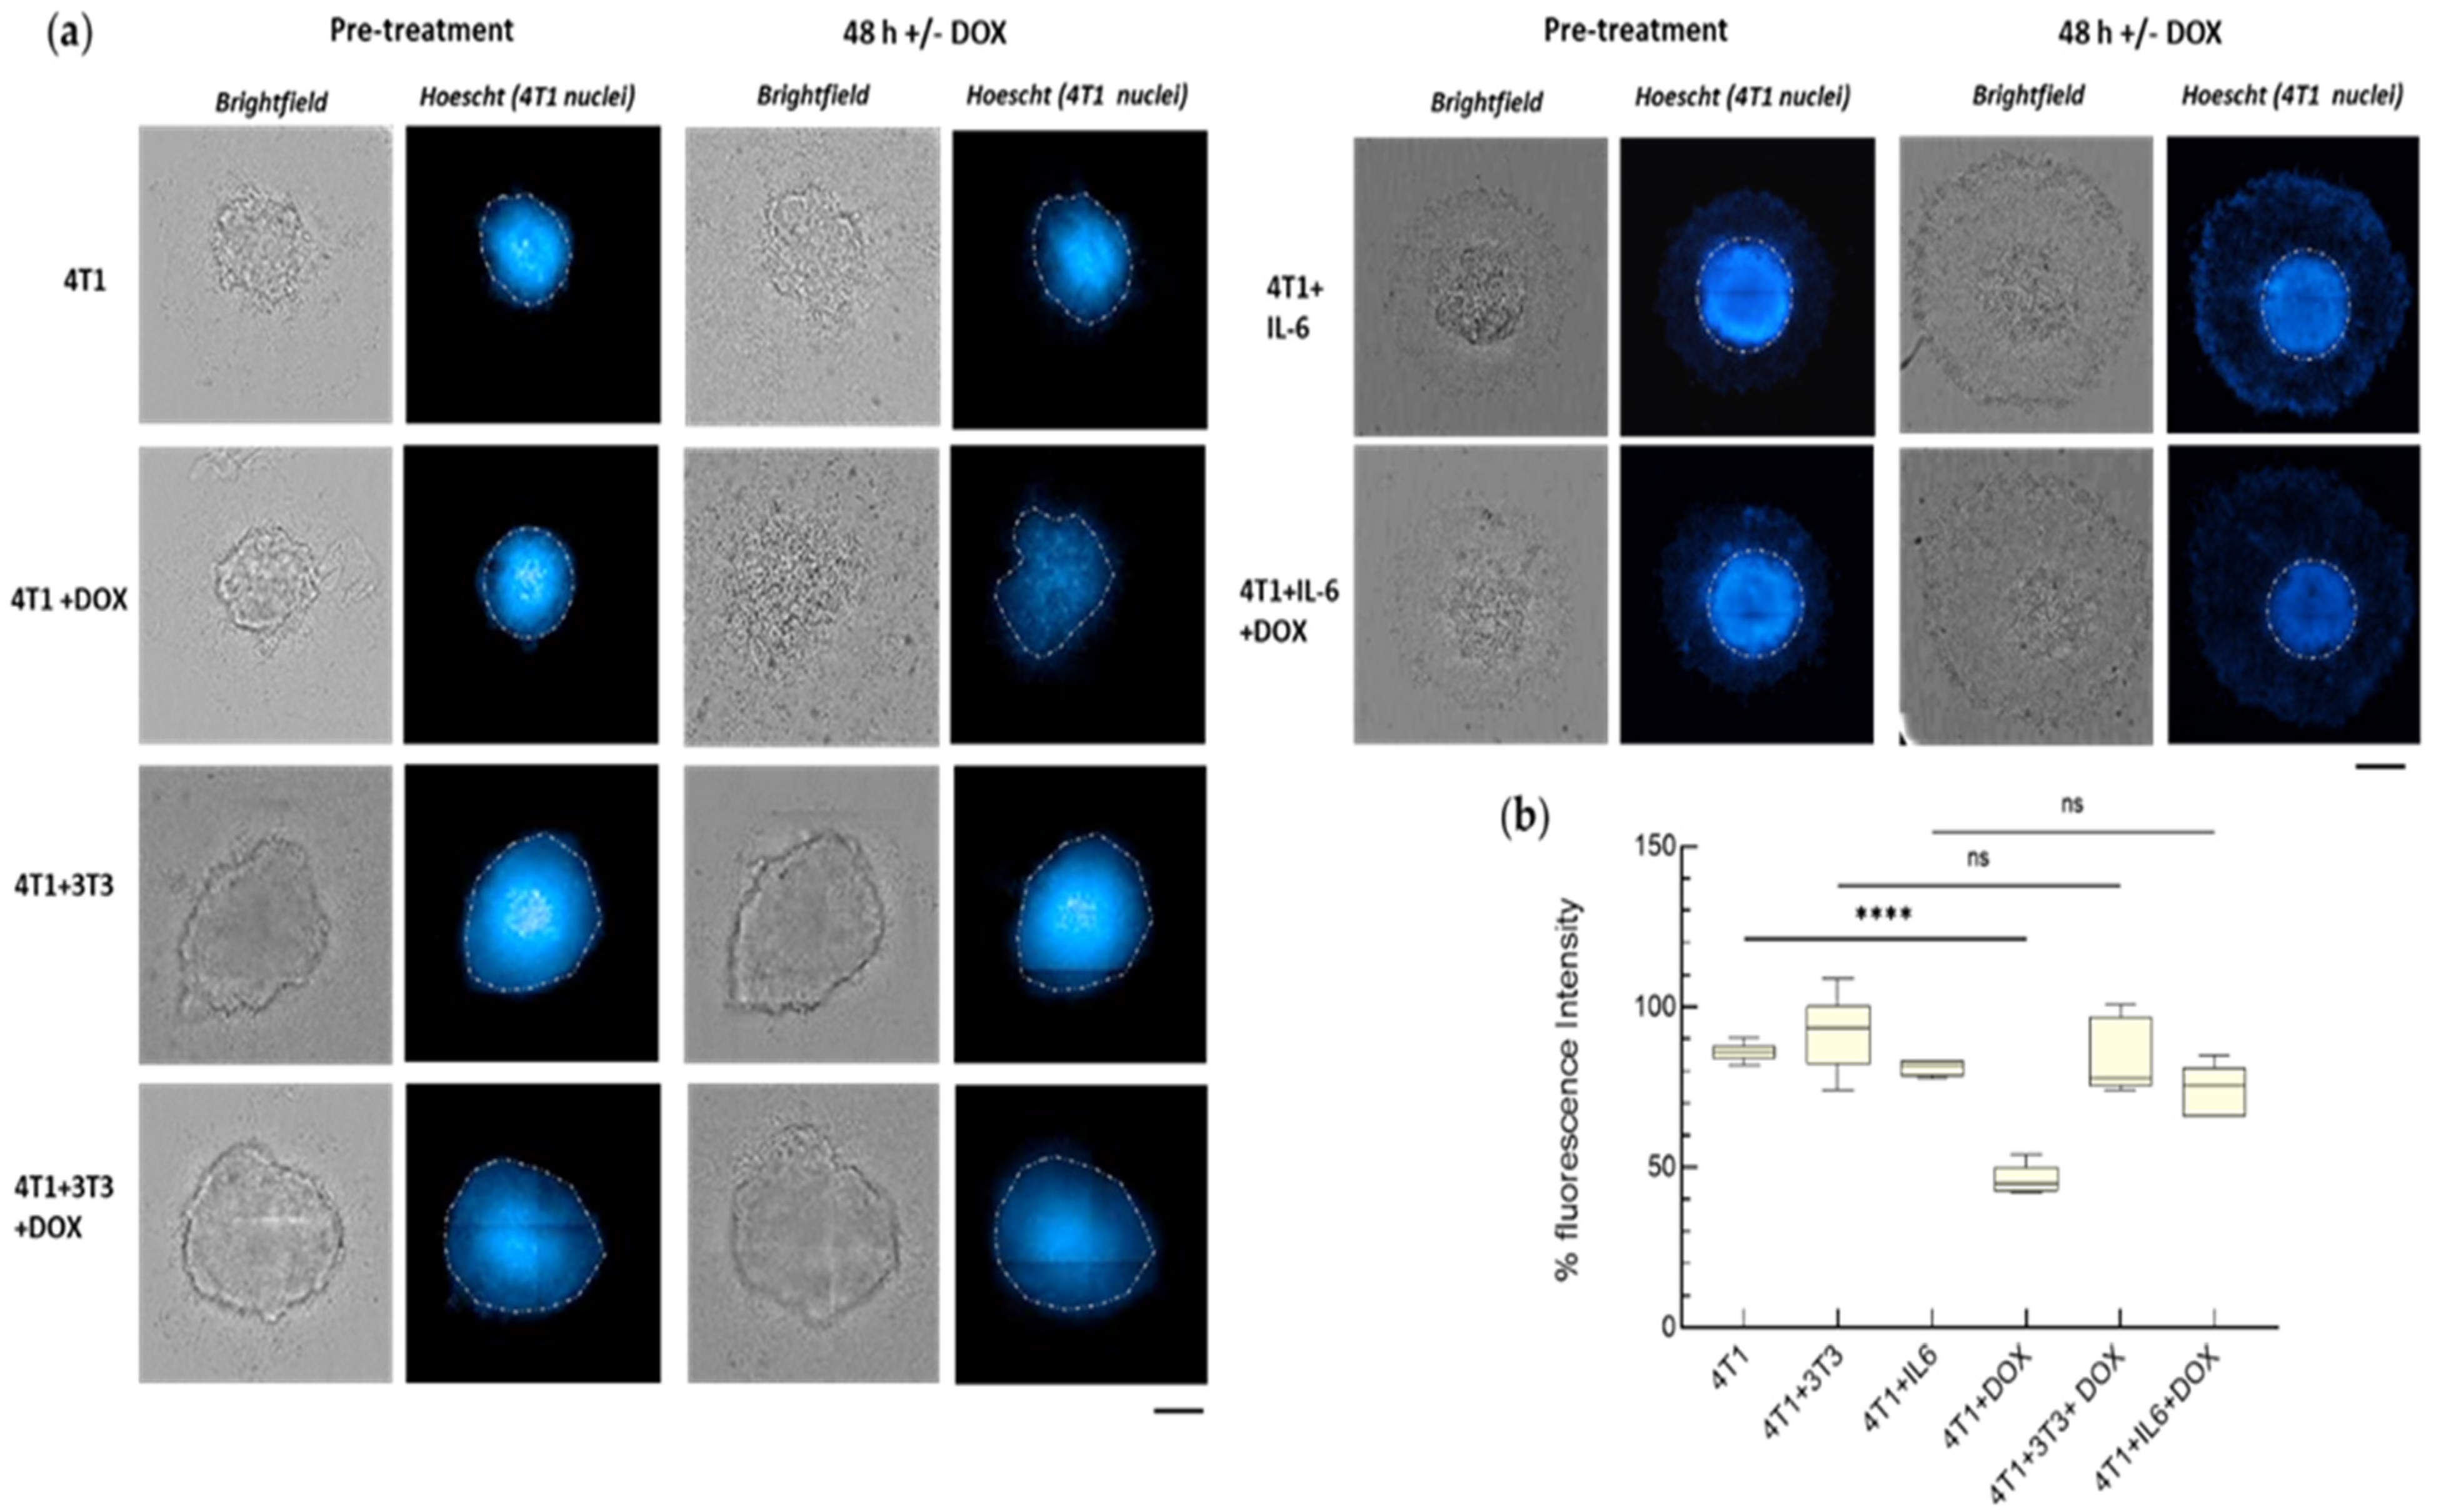
2.8. Analysis of Fluorescence in the Spheroids
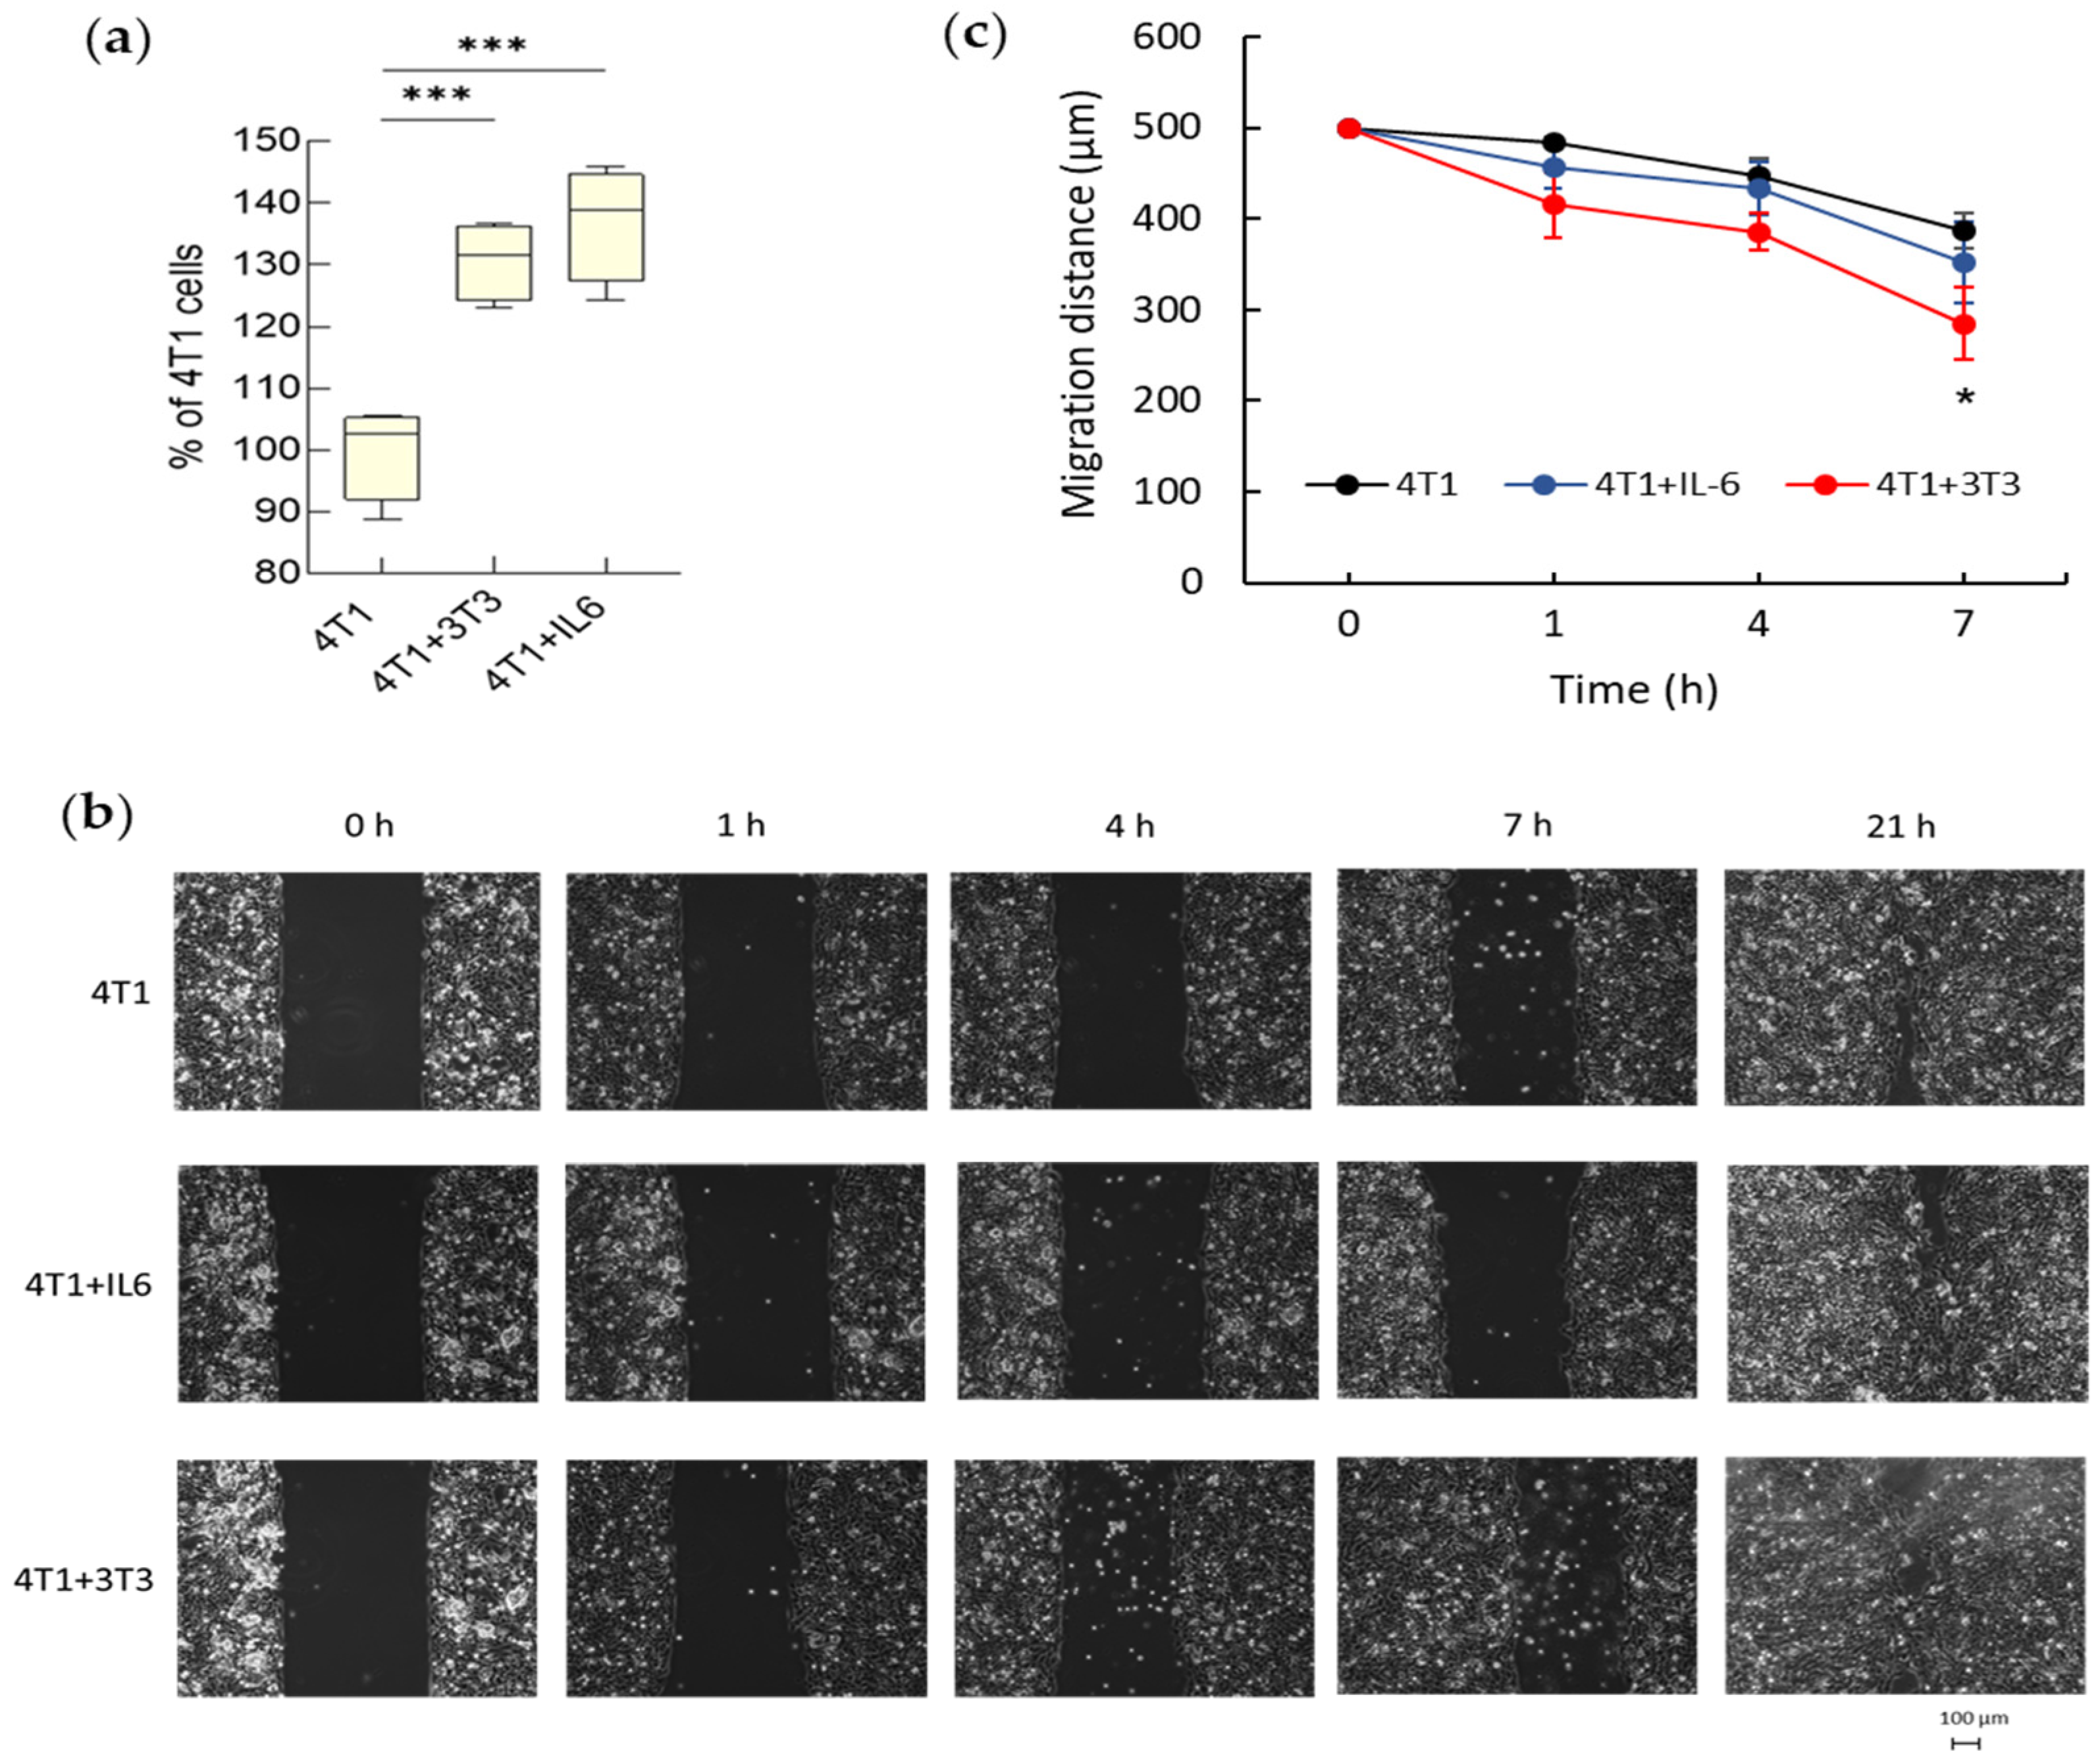
2.9. Wound Healing and Migration Assays
2.10. Statistical Analysis
3. Results and Discussion
3.1. Tumor Cells Promote Activation of Normal Fibroblasts through Paracrine Signaling
3.1.1. Hyperproliferation of Activated Fibroblasts
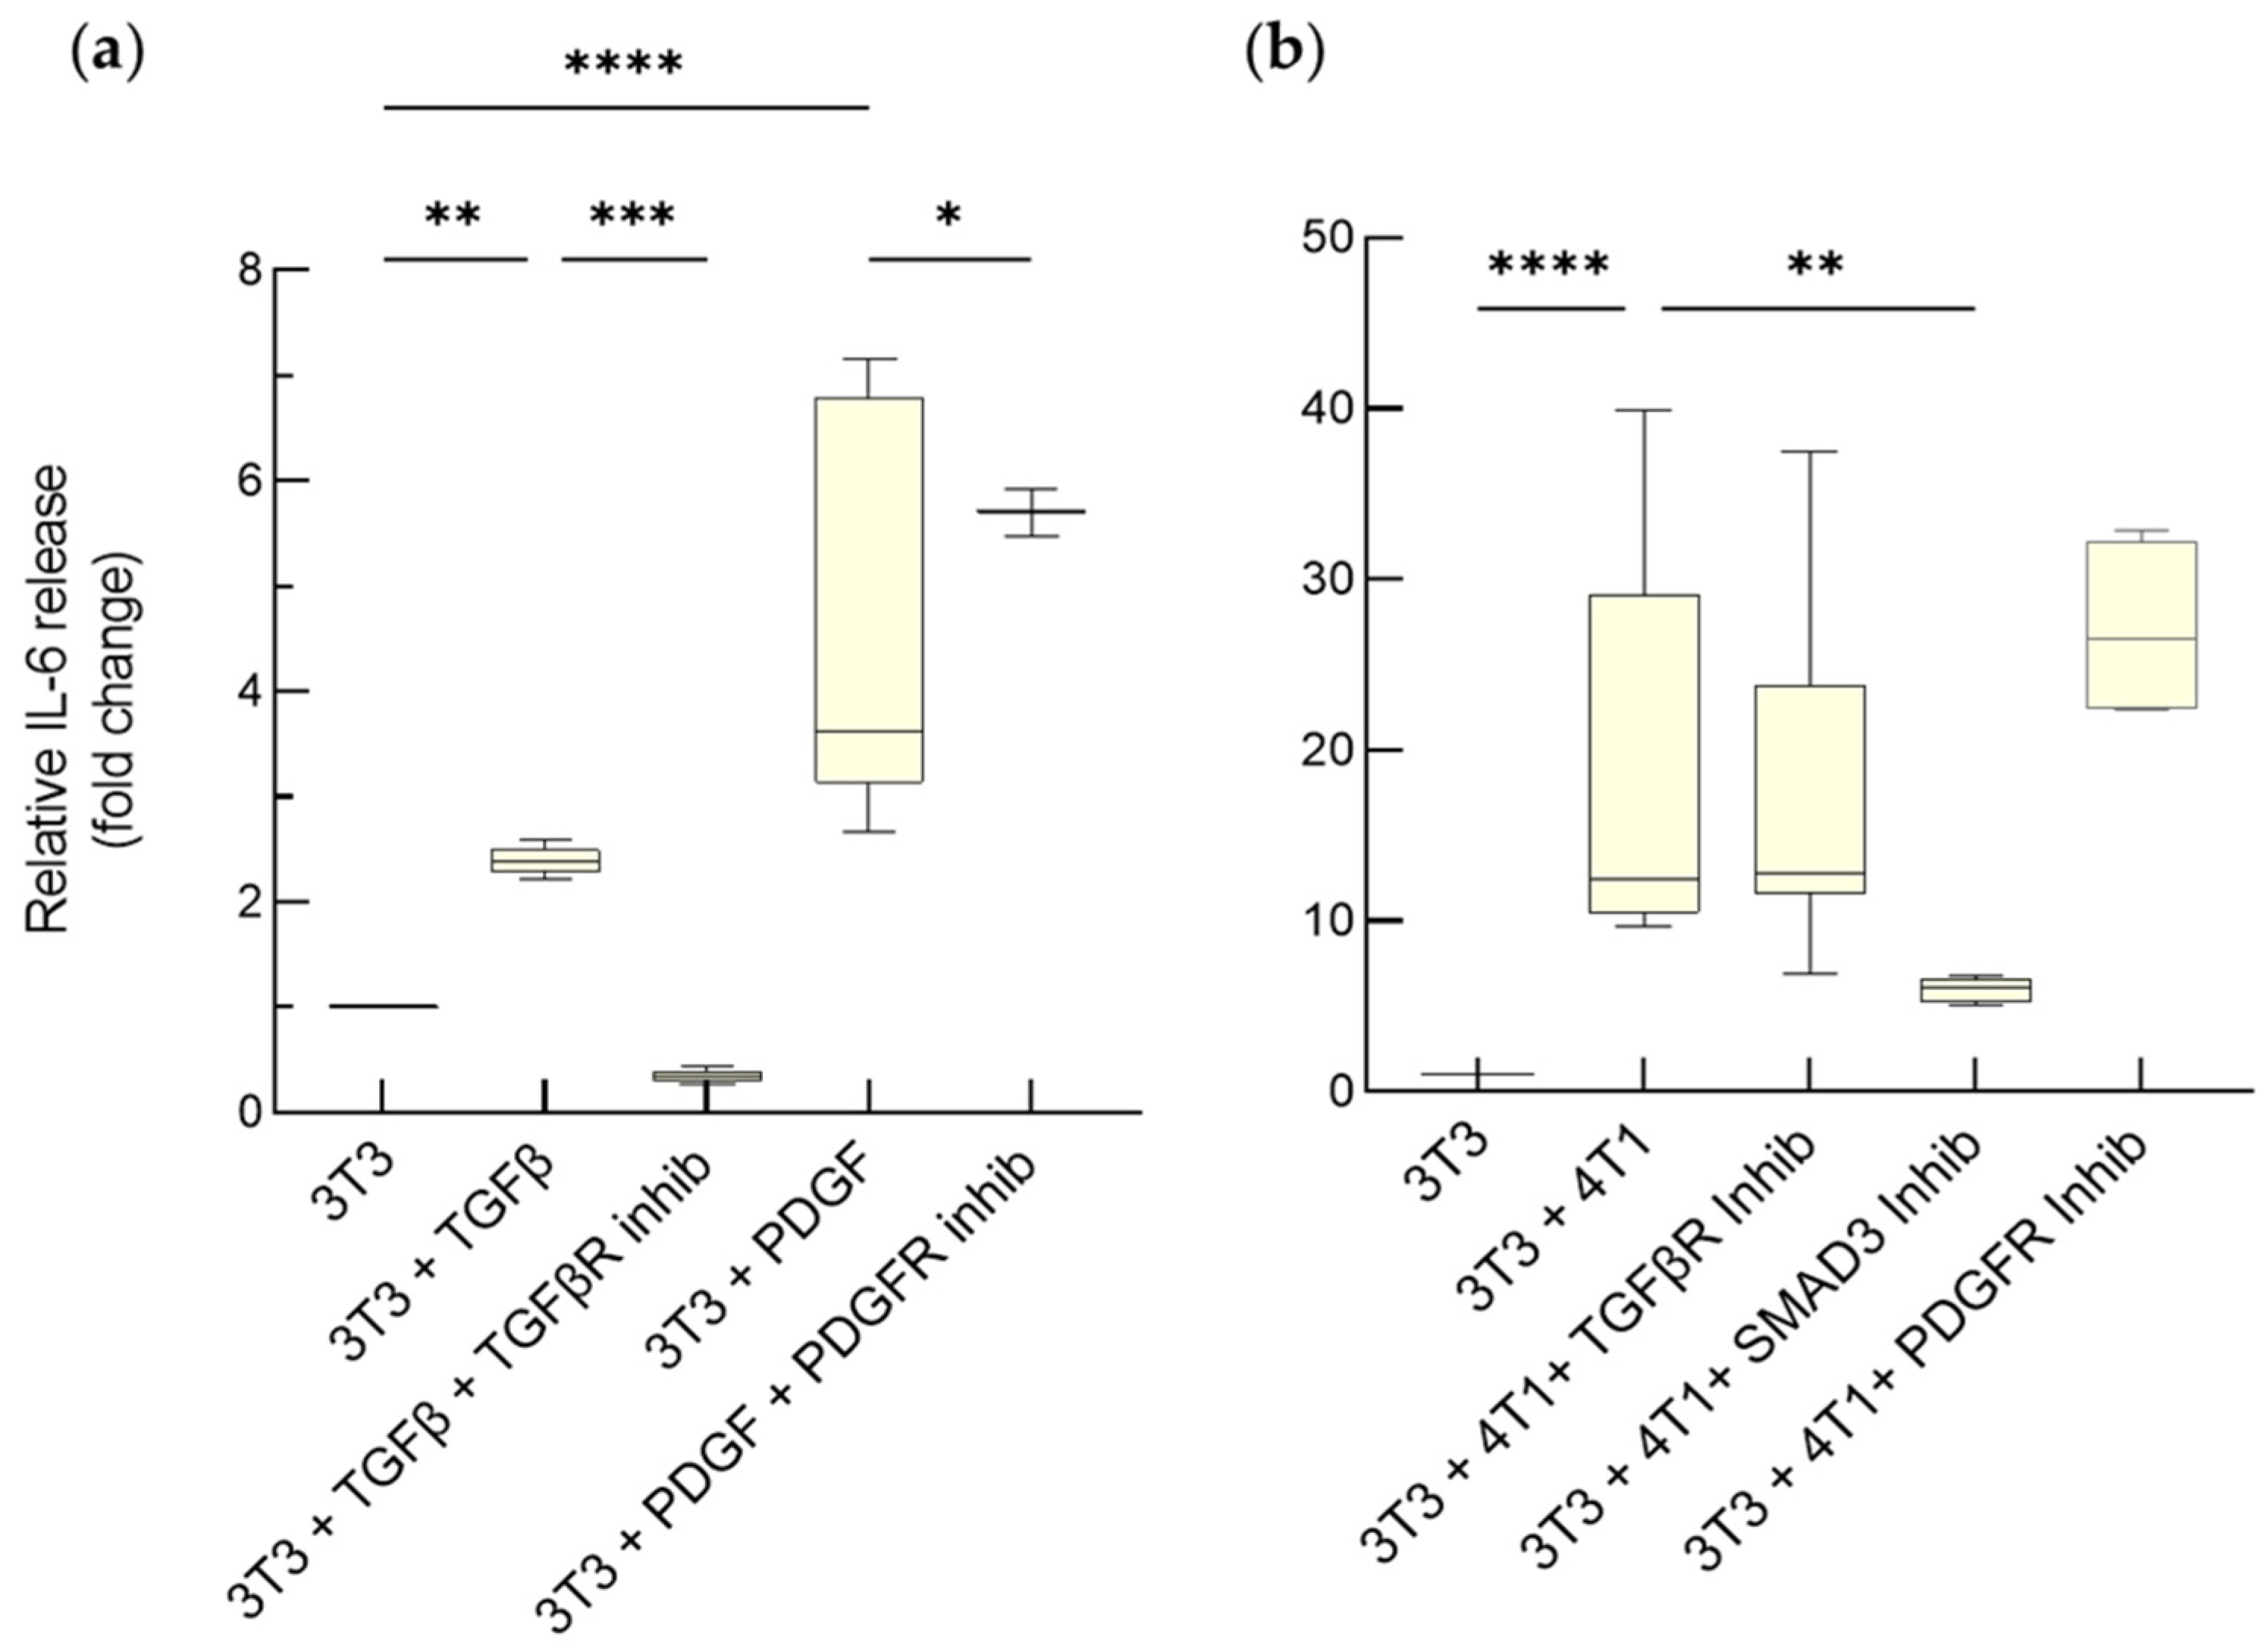
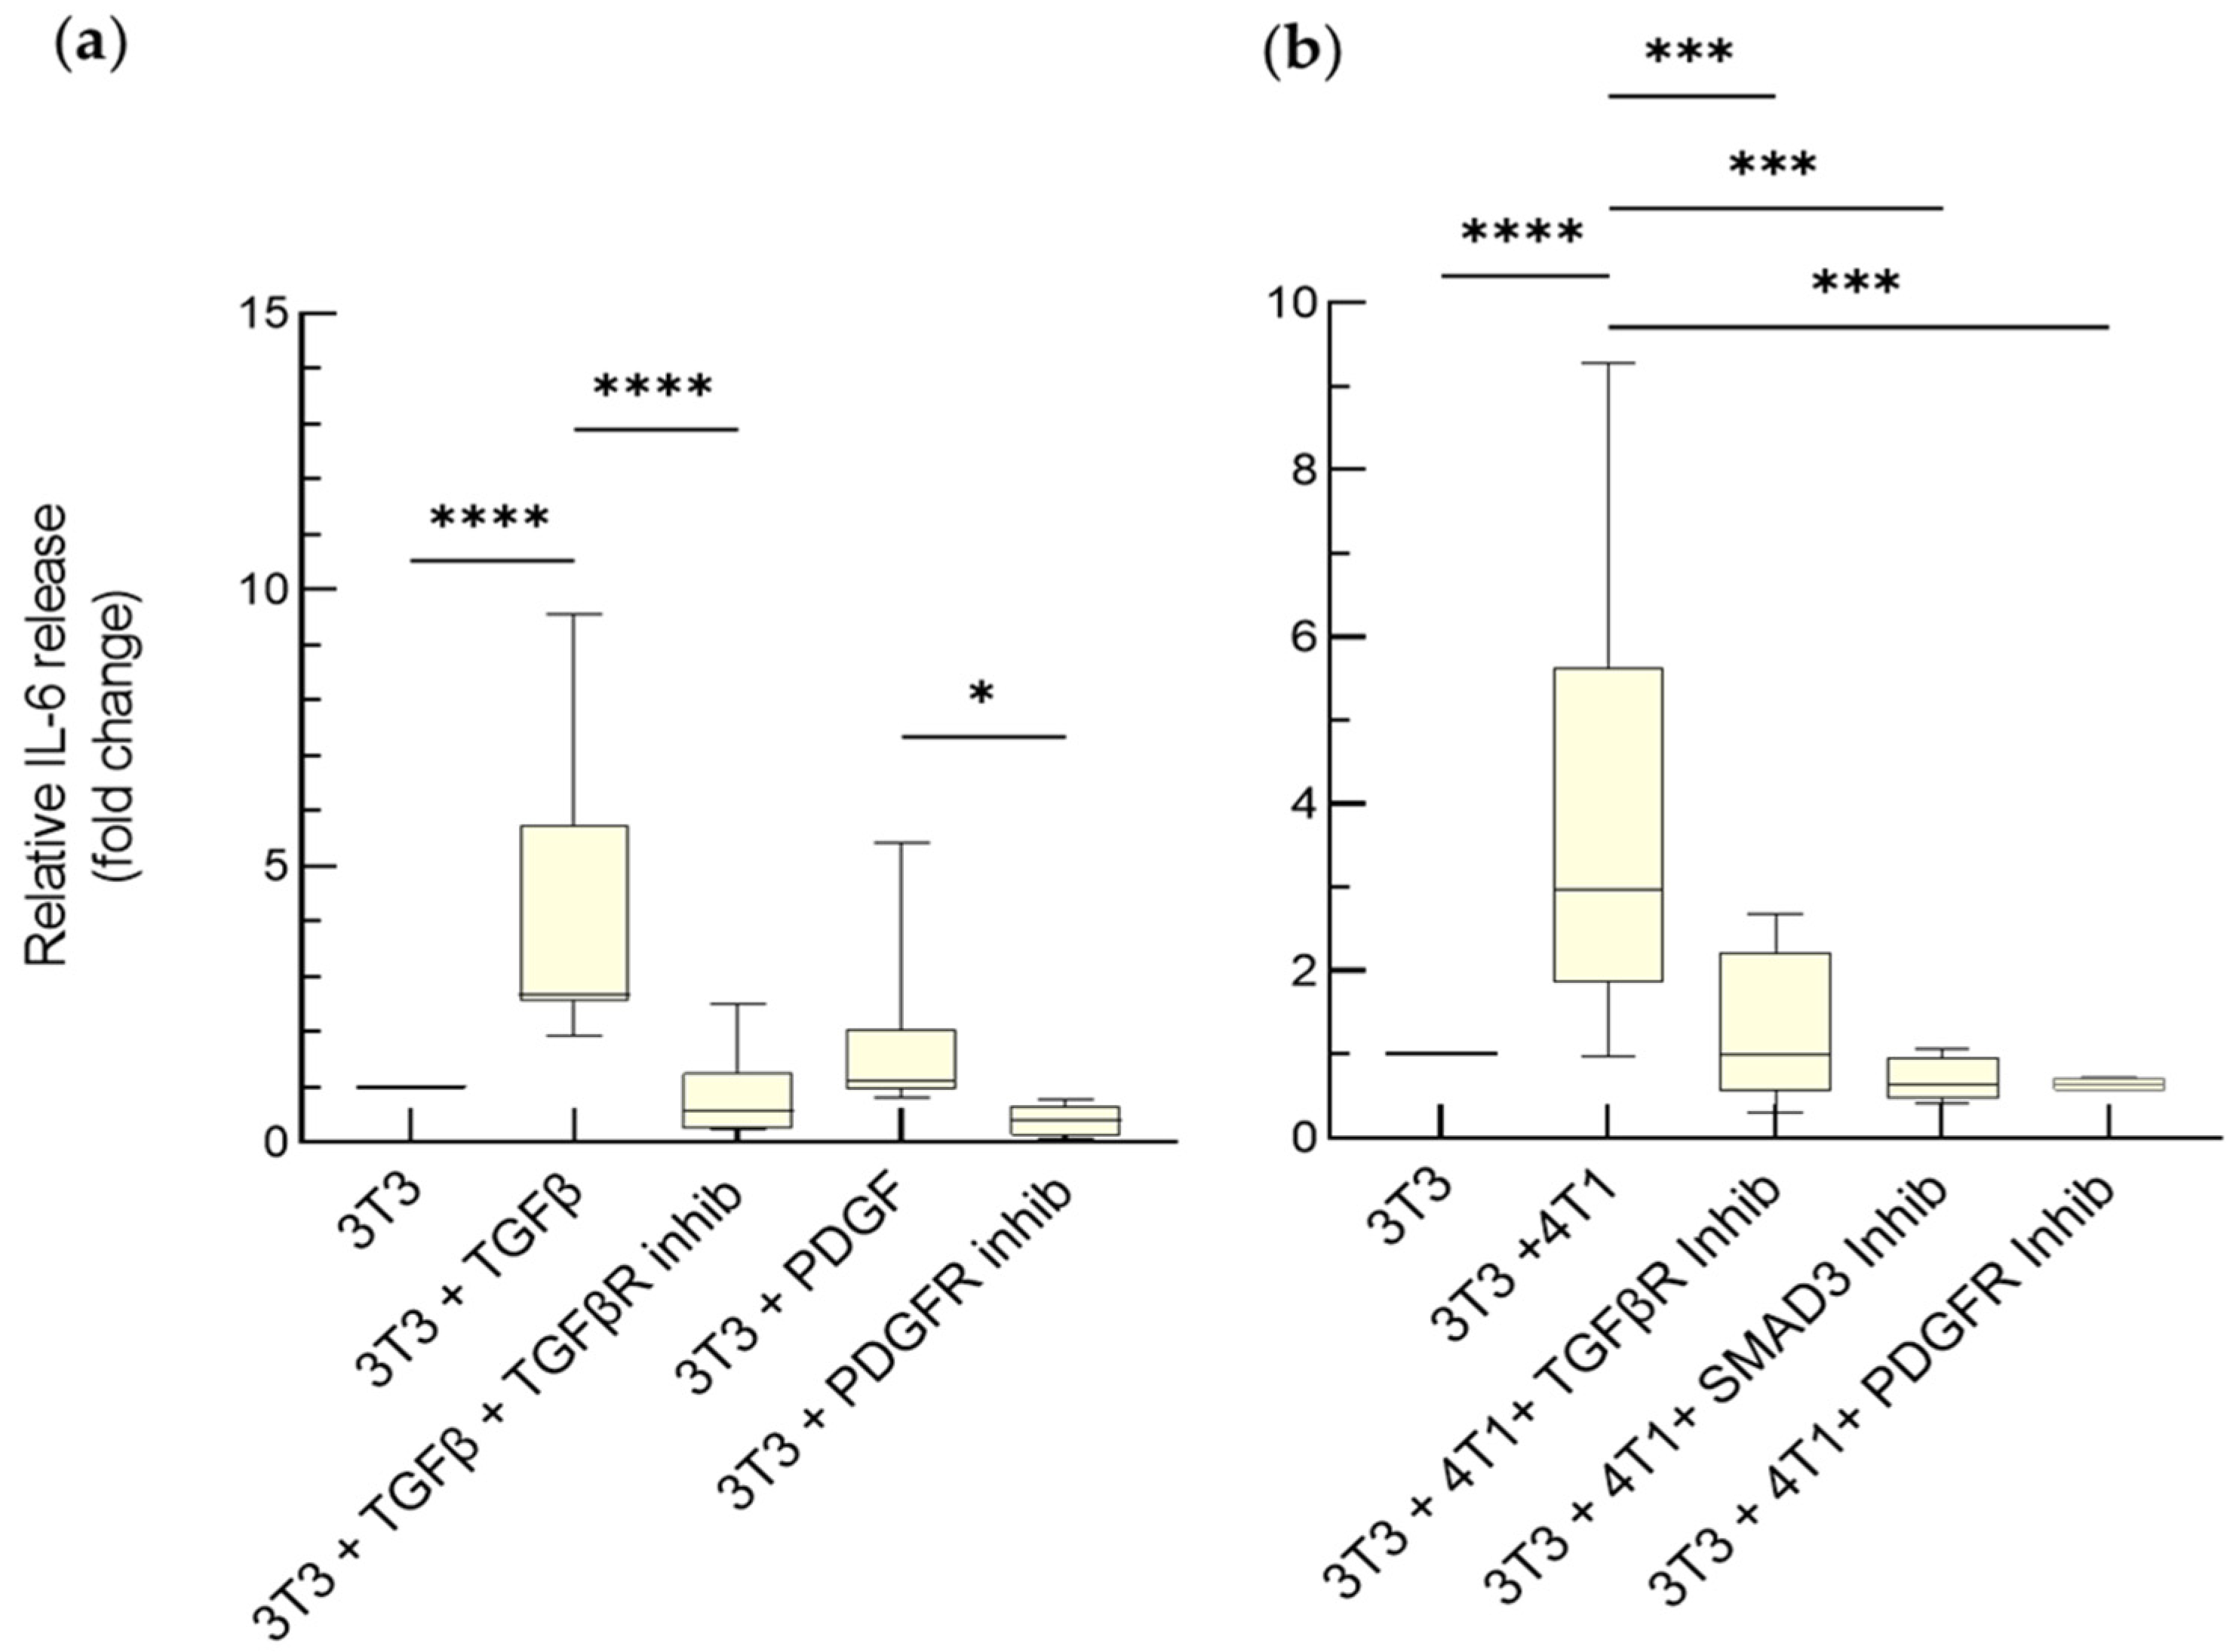
3.1.2. Enhanced Release of IL-6 by Activated Fibroblasts
3.2. Activated Fibroblasts Induce Aggressive Phenotypes in 4T1 Cells
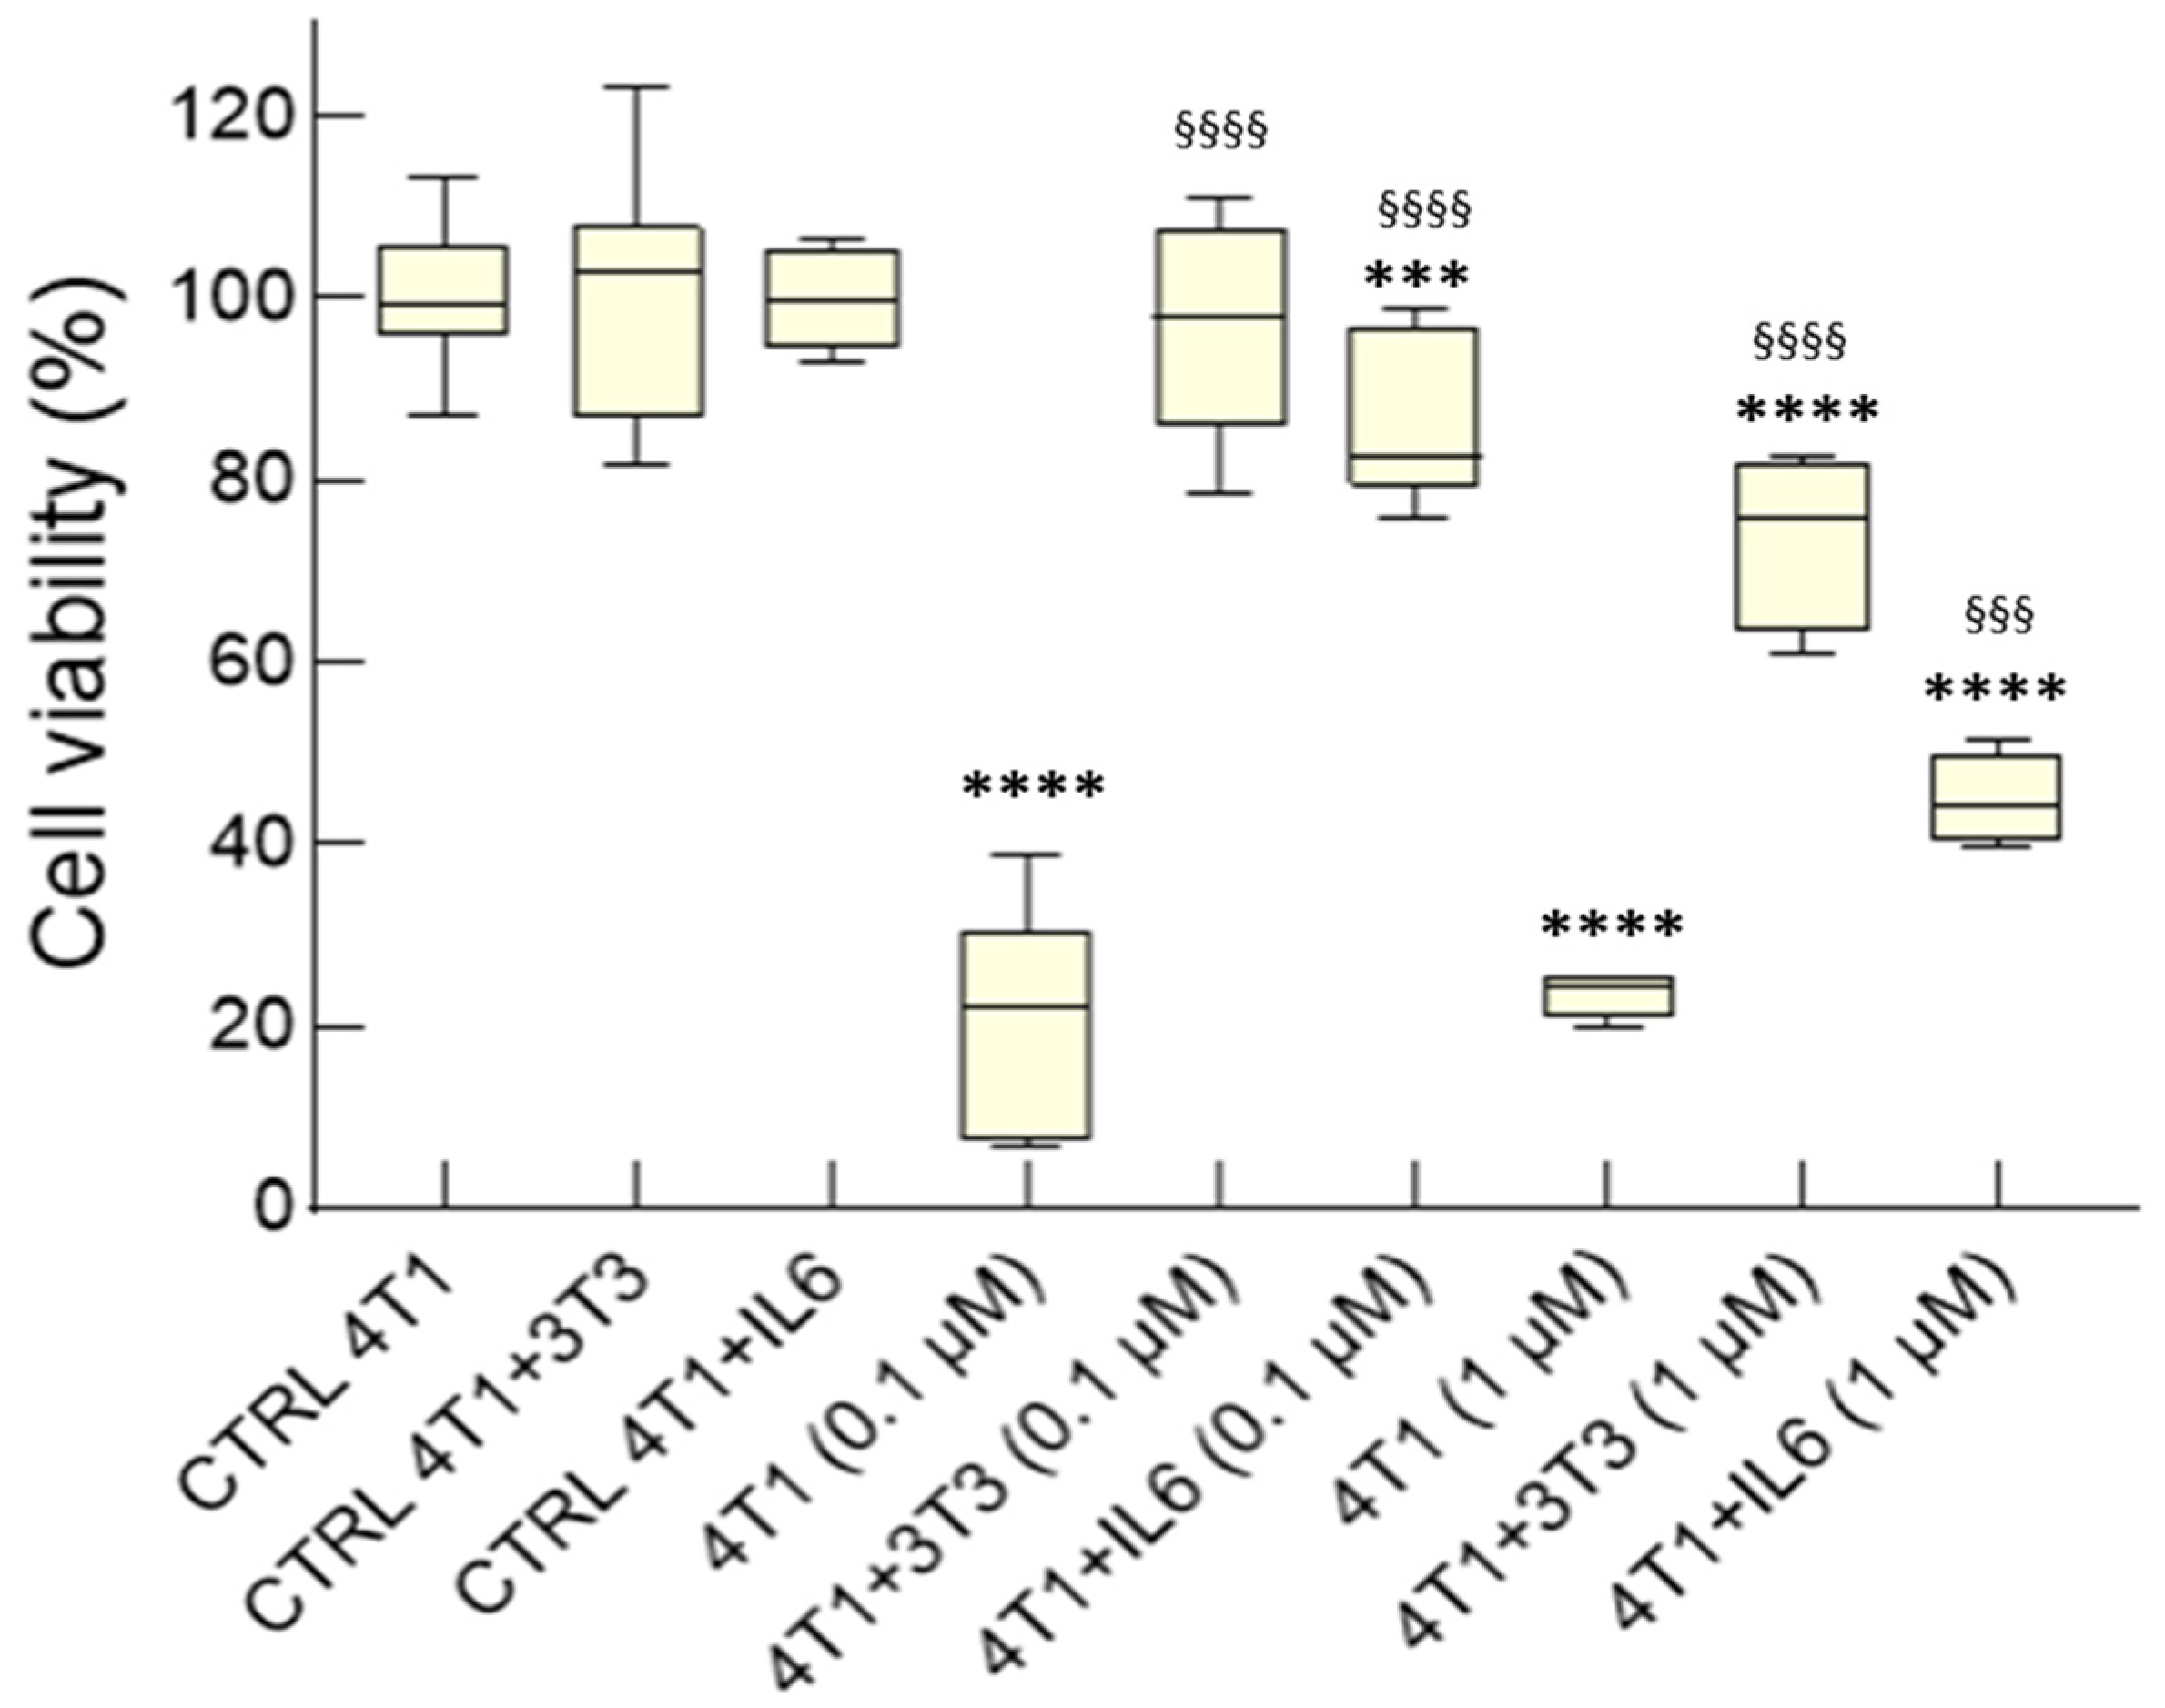
3.2.1. IL-6-Mediated Chemoresistance
3.2.2. Tumor Invasiveness
4. Conclusions
Supplementary Materials
Author Contributions
Funding
Conflicts of Interest
References
- Erdogan, B.; Webb, D.J. Cancer-associated fibroblasts modulate growth factor signaling and extracellular matrix remodeling to regulate tumor metastasis. Biochem. Soc. Trans. 2017, 45, 229–236. [Google Scholar] [CrossRef] [PubMed]
- Jia, C.; Wang, G.; Wang, T.; Fu, B.; Zhang, Y.; Huang, L.; Deng, Y.; Chen, G.; Wu, X.; Chen, J.; et al. Cancer-associated fibroblasts induce epithelial-mesenchymal transition via the transglutaminase 2-dependent il-6/il6r/stat3 axis in hepatocellular carcinoma. Int. J. Biol. Sci. 2020, 16, 2542–2558. [Google Scholar] [CrossRef] [PubMed]
- Yu, Y.; Xiao, C.H.; Tan, L.D.; Wang, Q.S.; Li, X.Q.; Feng, Y.M. Cancer-associated fibroblasts induce epithelial-mesenchymal transition of breast cancer cells through paracrine TGF-β signalling. Br. J. Cancer 2014, 110, 724–732. [Google Scholar] [CrossRef] [PubMed]
- Dudas, J.; Ladanyi, A.; Ingruber, J.; Steinbichler, T.B.; Riechelmann, H. Epithelial to Mesenchymal Transition: A Mechanism that Fuels Cancer Radio/Chemoresistance. Cells 2020, 9, 428. [Google Scholar] [CrossRef] [PubMed]
- Feng, B.; Wu, J.; Shen, B.; Jiang, F.; Feng, J. Cancer-associated fibroblasts and resistance to anticancer therapies: Status, mechanisms, and countermeasures. Cancer Cell Int. 2022, 22, 166. [Google Scholar] [CrossRef]
- Öhlund, D.; Elyada, E.; Tuveson, D. Fibroblast heterogeneity in the cancer wound. J. Exp. Med. 2014, 211, 1503–1523. [Google Scholar] [CrossRef]
- Jang, I.; Beningo, K.A. Integrins, CAFs and mechanical forces in the progression of cancer. Cancers 2019, 11, 721. [Google Scholar] [CrossRef]
- Sahai, E.; Astsaturov, I.; Cukierman, E.; DeNardo, D.G.; Egeblad, M.; Evans, R.M.; Fearon, D.; Greten, F.R.; Hingorani, S.R.; Hunter, T.; et al. A framework for advancing our understanding of cancer-associated fibroblasts. Nat. Rev. Cancer 2020, 20, 174–186. [Google Scholar] [CrossRef]
- Kalluri, R. The biology and function of fibroblasts in cancer. Nat. Rev. Cancer 2016, 16, 582–598. [Google Scholar] [CrossRef]
- Hawinkels, L.J.A.C.; Paauwe, M.; Verspaget, H.W.; Wiercinska, E.; Van Der Zon, J.M.; Van Der Ploeg, K.; Koelink, P.J.; Lindeman, J.H.N.; Mesker, W.; Ten Dijke, P.; et al. Interaction with colon cancer cells hyperactivates TGF-β signaling in cancer-associated fibroblasts. Oncogene 2014, 33, 97–107. [Google Scholar] [CrossRef]
- Evans, R.A.; Tian, Y.C.; Steadman, R.; Phillips, A.O. TGF-beta1-mediated fibro-blast-myofibroblast terminal differentia-tion-the role of Smad proteins. Exp. Cell Res. 2003, 282, 90–100. [Google Scholar] [CrossRef]
- Shao, Z.M.; Nguyen, M.; Barsky, S.H. Human breast carcinoma desmoplasia is PDGF initiated. Oncogene 2000, 19, 4337–4345. [Google Scholar] [CrossRef] [PubMed]
- Pietras, K.; Pahler, J.; Bergers, G.; Hanahan, D. Functions of paracrine PDGF signaling in the proangiogenic tumor stroma revealed by pharmacological targeting. PLoS Med. 2008, 5, e19. [Google Scholar] [CrossRef]
- Ren, X.; Li, L.; Wu, J.; Lin, K.; He, Y.; Bian, L. PDGF-BB regulates the transformation of fibroblasts into cancer-associated fibroblasts via the lncRNA LURAP1L-AS1/LURAP1L/IKK/IκB/NF-κB signaling pathway. Oncol. Lett. 2021, 22, 537. [Google Scholar] [CrossRef] [PubMed]
- Wei, L.; Lin, Q.; Lu, Y.; Li, G.; Huang, L.; Fu, Z.; Chen, R.; Zhou, Q. Cancer-associated fibroblasts-mediated ATF4 expression promotes malignancy and gemcitabine resistance in pancreatic cancer via the TGF-β1/SMAD2/3 pathway and ABCC1 transactivation. Cell Death Dis. 2021, 12, 334. [Google Scholar] [CrossRef] [PubMed]
- Wei, L.; Ye, H.; Li, G.; Lu, Y.; Zhou, Q.; Zheng, S.; Lin, Q.; Liu, Y.; Li, Z.; Chen, R. Cancer-associated fibroblasts promote progression and gemcitabine resistance via the SDF-1/SATB-1 pathway in pancreatic cancer. Cell Death Dis. 2018, 9, 1065. [Google Scholar] [CrossRef]
- Malik, S.; Westcott, J.M.; Brekken, R.A.; Burrows, F.J. CXCL12 in pancreatic cancer: Its function and potential as a therapeutic drug target. Cancers 2022, 14, 86. [Google Scholar] [CrossRef] [PubMed]
- Wu, X.; Tao, P.; Zhou, Q.; Li, J.; Yu, Z.; Wang, X.; Li, J.; Li, C.; Yan, M.; Zhu, Z.; et al. IL-6 secreted by cancer-associated fibroblasts promotes epithelial-mesenchymal transition and metastasis of gastric cancer via JAK2/STAT3 signaling pathway. Oncotarget 2017, 8, 20741–20750. [Google Scholar] [CrossRef]
- Wang, L.; Cao, L.; Wang, H.; Liu, B.; Zhang, Q.; Meng, Z.; Wu, X.; Zhou, Q.; Xu, K. Cancer-associated fibroblasts enhance metastatic potential of lung cancer cells through IL-6/STAT3 signaling pathway. Oncotarget 2017, 8, 76116. [Google Scholar] [CrossRef]
- Shintani, Y.; Fujiwara, A.; Kimura, T.; Kawamura, T.; Funaki, S.; Minami, M.; Okumura, M. IL-6 secreted from Cancer-Associated fibroblasts mediates chemoresistance in NSCLC by increasing epithelial-mesenchymal transition signaling. J. Thorac. Oncol. 2016, 11, 1482–1492. [Google Scholar] [CrossRef]
- Cheteh, E.H.; Sarne, V.; Ceder, S.; Bianchi, J.; Augsten, M.; Rundqvist, H.; Egevad, L.; Östman, A.; Wiman, K.G. Interleukin-6 derived from cancer-associated fibroblasts attenuates the p53 response to doxorubicin in prostate cancer cells. Cell Death Discov. 2020, 6, 42. [Google Scholar] [CrossRef] [PubMed]
- Sun, X.; Mao, Y.; Wang, J.; Zu, L.; Hao, M.; Cheng, G.; Qu, Q.; Cui, D.; Keller, E.T.; Chen, X.; et al. IL-6 secreted by cancer-associated fibroblasts induces tamoxifen resistance in luminal breast cancer. Oncogene 2014, 33, 4450. [Google Scholar] [CrossRef]
- Manore, S.G.; Doheny, D.L.; Wong, G.L.; Lo, H.W. IL-6/JAK/STAT3 Signaling in Breast Cancer Metastasis: Biology and Treatment. Front. Oncol. 2022, 12, 866014. [Google Scholar] [CrossRef]
- Hu, D.; Li, Z.; Zheng, B.; Lin, X.; Pan, Y.; Gong, P.; Zhuo, W.; Hu, Y.; Chen, C.; Chen, L.; et al. Cancer-associated fibroblasts in breast cancer: Challenges and opportunities. Cancer Commun. 2022, 42, 401–434. [Google Scholar] [CrossRef] [PubMed]
- Yu, T.; Di, G. Role of tumor microenvironment in triple-negative breast cancer and its prognostic significance. Chin. J. Cancer Res. 2017, 29, 237. [Google Scholar] [CrossRef] [PubMed]
- Tyan, S.W.; Kuo, W.H.; Huang, C.K.; Pan, C.C.; Shew, J.Y.; Chang, K.J.; Lee, E.Y.H.P.; Lee, W.H. Breast cancer cells induce cancer-associated fibroblasts to secrete hepatocyte growth factor to enhance breast tumorigenesis. PLoS ONE 2011, 6, e15313. [Google Scholar] [CrossRef] [PubMed]
- Orimo, A.; Gupta, P.B.; Sgroi, D.C.; Arenzana-Seisdedos, F.; Delaunay, T.; Naeem, R.; Carey, V.J.; Richardson, A.L.; Weinberg, R.A. Stromal fibroblasts present in invasive human breast carcinomas promote tumor growth and angiogenesis through elevated SDF-1/CXCL12 secretion. Cell 2005, 121, 335–348. [Google Scholar] [CrossRef]
- Felcher, C.M.; Bogni, E.S.; Kordon, E.C. IL-6 Cytokine Family: A Putative Target for Breast Cancer Prevention and Treatment. Int. J. Mol. Sci. 2022, 23, 1809. [Google Scholar] [CrossRef]
- Peng, D.; Fu, M.; Wang, M.; Wei, Y.; Wei, X. Targeting TGF-β signal transduction for fibrosis and cancer therapy. Mol. Cancer 2022, 21, 104. [Google Scholar] [CrossRef] [PubMed]
- Wu, F.; Yang, J.; Liu, J.; Wang, Y.; Mu, J.; Zeng, Q.; Deng, S.; Zhou, H. Signaling pathways in cancer-associated fibroblasts and targeted therapy for cancer. Signal Transduct. Target. Ther. 2021, 6, 218. [Google Scholar] [CrossRef]
- Zhang, D.; Wang, Y.; Shi, Z.; Liu, J.; Sun, P.; Hou, X.; Zhang, J.; Zhao, S.; Zhou, B.P.; Mi, J. Metabolic Reprogramming of Cancer-Associated Fibroblasts by IDH3α Downregulation. Cell Rep. 2015, 10, 1335–1348. [Google Scholar] [CrossRef]
- Calon, A.; Tauriello, D.V.F.; Batlle, E. TGF-beta in CAF-mediated tumor growth and metastasis. Semin. Cancer Biol. 2014, 25, 15–22. [Google Scholar] [CrossRef] [PubMed]
- Mansoori, B.; Mohammadi, A.; Davudian, S.; Shirjang, S.; Baradaran, B. The different mechanisms of cancer drug resistance: A brief review. Adv. Pharm. Bull. 2017, 7, 339–348. [Google Scholar] [CrossRef] [PubMed]
- Rašková, M.; Lacina, L.; Kejík, Z.; Venhauerová, A.; Skaličková, M.; Kolář, M.; Jakubek, M.; Rosel, D.; Smetana, K.; Brábek, J. The Role of IL-6 in Cancer Cell Invasiveness and Metastasis—Overview and Therapeutic Opportunities. Cells 2022, 11, 3698. [Google Scholar] [CrossRef] [PubMed]
- Zhang, Y.; Cong, X.; Li, Z.; Xue, Y. Estrogen facilitates gastric cancer cell proliferation and invasion through promoting the secretion of interleukin-6 by cancer-associated fibroblasts. Int. Immunopharmacol. 2020, 78, 105937. [Google Scholar] [CrossRef]
- Goulet, C.R.; Champagne, A.; Bernard, G.; Vandal, D.; Chabaud, S.; Pouliot, F.; Bolduc, S. Cancer-associated fibroblasts induce epithelial-mesenchymal transition of bladder cancer cells through paracrine IL-6 signalling. BMC Cancer 2019, 19, 137. [Google Scholar] [CrossRef] [PubMed]
- Kim, H.S.; Jung, M.; Choi, S.K.; Woo, J.; Piao, Y.J.; Hwang, E.H.; Kim, H.; Kim, S.J.; Moon, W.K. IL-6-mediated cross-talk between human preadipocytes and ductal carcinoma in situ in breast cancer progression. J. Exp. Clin. Cancer Res. 2018, 37, 200. [Google Scholar] [CrossRef]
- Hoek, K.S.; Eichhoff, O.M.; Schlegel, N.C.; Döbbeling, U.; Kobert, N.; Schaerer, L.; Hemmi, S.; Dummer, R. In vivo switching of human melanoma cells between proliferative and invasive states. Cancer Res. 2008, 68, 650–656. [Google Scholar] [CrossRef]
- Hsu, H.C.; Liu, L.C.; Wang, H.Y.; Hung, C.M.; Lin, Y.C.; Ho, C.T.; Way, T. Der Stromal fibroblasts from the interface zone of triple negative breast carcinomas induced epithelial-mesenchymal transition and its inhibition by emodin. PLoS ONE 2017, 12, e0164661. [Google Scholar] [CrossRef]
- Jayatilaka, H.; Tyle, P.; Chen, J.J.; Kwak, M.; Ju, J.; Kim, H.J.; Lee, J.S.H.; Wu, P.H.; Gilkes, D.M.; Fan, R.; et al. Synergistic IL-6 and IL-8 paracrine signalling pathway infers a strategy to inhibit tumour cell migration. Nat. Commun. 2017, 8, 15584. [Google Scholar] [CrossRef]
- Jubelin, C.; Muñoz-Garcia, J.; Griscom, L.; Cochonneau, D.; Ollivier, E.; Heymann, M.F.; Vallette, F.M.; Oliver, L.; Heymann, D. Three-dimensional in vitro culture models in oncology research. Cell Biosci. 2022, 12, 155. [Google Scholar] [CrossRef] [PubMed]
- Barbosa, M.A.G.; Xavier, C.P.R.; Pereira, R.F.; Petrikaitė, V.; Vasconcelos, M.H. 3D Cell Culture Models as Recapitulators of the Tumor Microenvironment for the Screening of Anti-Cancer Drugs. Cancers 2022, 14, 190. [Google Scholar] [CrossRef] [PubMed]
- Kim, S.J.; Kim, E.M.; Yamamoto, M.; Park, H.; Shin, H. Engineering Multi-Cellular Spheroids for Tissue Engineering and Regenerative Medicine. Adv. Healthc. Mater. 2020, 9, 2000608. [Google Scholar] [CrossRef] [PubMed]


Disclaimer/Publisher’s Note: The statements, opinions and data contained in all publications are solely those of the individual author(s) and contributor(s) and not of MDPI and/or the editor(s). MDPI and/or the editor(s) disclaim responsibility for any injury to people or property resulting from any ideas, methods, instructions or products referred to in the content. |
© 2023 by the authors. Licensee MDPI, Basel, Switzerland. This article is an open access article distributed under the terms and conditions of the Creative Commons Attribution (CC BY) license (https://creativecommons.org/licenses/by/4.0/).
Share and Cite
Del Nero, M.; Colombo, A.; Garbujo, S.; Baioni, C.; Barbieri, L.; Innocenti, M.; Prosperi, D.; Colombo, M.; Fiandra, L. Advanced Cell Culture Models Illuminate the Interplay between Mammary Tumor Cells and Activated Fibroblasts. Cancers 2023, 15, 2498. https://doi.org/10.3390/cancers15092498
Del Nero M, Colombo A, Garbujo S, Baioni C, Barbieri L, Innocenti M, Prosperi D, Colombo M, Fiandra L. Advanced Cell Culture Models Illuminate the Interplay between Mammary Tumor Cells and Activated Fibroblasts. Cancers. 2023; 15(9):2498. https://doi.org/10.3390/cancers15092498
Chicago/Turabian StyleDel Nero, Martina, Alessandro Colombo, Stefania Garbujo, Chiara Baioni, Linda Barbieri, Metello Innocenti, Davide Prosperi, Miriam Colombo, and Luisa Fiandra. 2023. "Advanced Cell Culture Models Illuminate the Interplay between Mammary Tumor Cells and Activated Fibroblasts" Cancers 15, no. 9: 2498. https://doi.org/10.3390/cancers15092498