Article

Chemo-Radio-Immunotherapy for NSCLC III: ESR/ATS Thresholds for DLCO Correlate with Radiation Dosimetry and Pneumonitis Rate

1
Department of Radiation Oncology, Paracelsus Medical University, 5020 Salzburg, Austria
2
Institute of Pathology, Paracelsus Medical University, 5020 Salzburg, Austria
3
Department of Pulmonology, Paracelsus Medical University, 5020 Salzburg, Austria
*
Author to whom correspondence should be addressed.
Cancers 2023, 15(7), 1966; https://doi.org/10.3390/cancers15071966
Submission received: 3 February 2023 / Revised: 21 March 2023 / Accepted: 23 March 2023 / Published: 25 March 2023
(This article belongs to the Special Issue World Lung Cancer Awareness Month)

Abstract

:

Simple Summary

Since the approval of durvalumab for the treatment of unresectable non-small-cell lung cancer UICC stage III, the 5-year overall survival rates have risen from below 20% to 50%. Although the validity of lung function testing has been questioned, for long-term survivors, residual pulmonary capacity after treatment is very important in terms of quality of life. The clinically most widely used lung function parameters are forced expiratory volume in one second (FEV1) and carbon monoxide diffusing capacity (DLCO). As the latter represents the alveolar compartment, it seems more suitable in the radiotherapy context. In the current analysis, we can show that DLCO correlates with radiation dosimetry and the incidence of pneumonitis. Hence, from a clinical point of view, peri-treatment lung function testing is indispensable as it helps to optimize radiation treatment planning and predicts pulmonary toxicity.

Abstract

Introduction: Durvalumab following chemoradiotherapy (CRT) for non-small cell lung cancer stage III has become the standard of care (SoC) in the past few years. With this regimen, 5-year overall survival (OS) has risen to 43%. Therefore, adequate pulmonary function (PF) after treatment is paramount in long-term survivors. In this respect, carbon monoxide diffusing capacity (DLCO), which represents the alveolar compartment, seems to be a suitable measure for residual lung capacity. The aim of the current analysis was to correlate DLCO with pneumonitis and radiation dose. Patients and methods: One hundred and twelve patients with histologically confirmed NSCLC III treated between 2015/10 and 2022/03 were eligible for this study. Patients received two cycles of platinum-based induction chemotherapy followed by high-dose radiotherapy (RT). As of 2017/09, durvalumab maintenance therapy was administered for one year. The clinical endpoints were based on the thresholds jointly published by the European Respiratory Society (ERS) and the American Thoracic Society (ATS). Pre-treatment DLCO of 60% was correlated to the incidence of pneumonitis, whereas the post-treatment DLCO decline of 10% was related to radiation dose. Results: Patients with a pre-treatment DLCO < 60% had a higher probability of pneumonitis (n = 98; r = 0.175; p-value 0.042), which could be reproduced in the subgroup of patients who did not receive durvalumab (n = 40; r = 0.288; p-value 0.036). In these individuals, the decline in DLCO ≥ 10% depended significantly on the size of the lung volume receiving between 45% and 65% (V65–45%) of the total radiation dose (r = 0.354; p-value = 0.020) and V20 Total Lung (r = 0.466; corrected p-value = 0.042). Conclusions: The current analysis revealed that DLCO is a predictor for clinically relevant pneumonitis and a monitoring tool for post-treatment lung function as it correlates with radiation dose. This underlines the importance of peri-treatment lung function testing.

1. Introduction

Lung cancer is still one of the most prominent causes of cancer death worldwide [1]. The proportion of non-small cell histologies is around 80%, with about one-third of the patients presenting with UICC stage III disease. Locally advanced non-small cell lung cancer (LA-NSCLC) is a heterogeneous disease entity, which can be treated by surgery, radiotherapy (RT), chemotherapy, targeted drugs, and immunotherapy.
With the publication of the PACIFIC data in 2017 and its follow-up during the past five years [2,3,4], durvalumab after chemoradiation has become the standard of care (SoC) for NSCLC stage III patients [5]. The 5-year overall survival (OS) was 43% for all patients treated with durvalumab compared to 33% in the control arm [4]. This is a substantial improvement in long-term survival rates from below 20% during the last decades [6,7]. Integrating 18F-FDG-PET-CT in treatment planning and dose delivery by highly conformal radiation techniques such as intensity-modulated radiotherapy (IMRT) and volumetric arc therapy (VMAT) combined with immune checkpoint inhibition (ICI) with durvalumab are similarly responsible for this progress. Durvalumab is a high-affinity human IgG1 monoclonal antibody that prohibits binding between the programmed death receptor and its ligand. This allows T-cells to better recognize tumor cells, which leads to an enhanced immune response [3]. Like other ICIs, durvalumab may cause inflammation in general [8,9,10], leading to higher rates of pulmonary toxicity, i.e., pneumonitis. Although two recent publications on high-dose radiation together with durvalumab showed that the combination is safe [11,12], caution is still warranted. It is noteworthy that ICI maintenance therapy for one year after completion of chemoradiotherapy (CRT) increased the rate of any grade pulmonary toxicity to roughly 46.1% compared to the 31.2% in the placebo group [2,3].
In this context, post-treatment pulmonary function (PF) is especially important for long-term survivors. It has been argued that carbon monoxide diffusing capacity (DLCO) may be a better parameter for these lung function changes after RT than forced expiratory volume in one second (FEV1) as it represents the alveolar compartment [13]. In order to maintain a reasonable quality of life after thoracic chemo-radio-immunotherapy, post-treatment DLCO should be at least 50% of the predicted reference value [14]. The European Respiratory Society (ERS), together with the American Thoracic Society (ATS), published a seminal paper on the cutoffs that allows distinguishing between normal and impaired lung function in clinical practice. According to this ESR/ATS guideline, a DLCO < 60% and a decrease >10% compared to baseline can be regarded as clinically significant [15].
In order to properly assess pulmonary toxicity, it is relevant to know how far lung function correlates with CT morphology changes after treatment. In a previous publication by our group, we established a correlation between irradiated volumes and PF dynamics after high-dose radiation therapy. The volume receiving between 45% and 65% of the prescribed total radiation dose (V65–45%) was shown to be most prominently correlated with a DLCO decline [16]. This is in line with the notion that radiation therapy may cause pulmonary fibrosis, which secondarily leads to PF impairment. At the same time, the widespread administration of ICI in lung cancer may complicate the predictability of post-treatment lung function based on radiation dosimetric parameters alone since durvalumab itself may cause pneumonitis [8,9,10].
Combining these previous results with the ERS/ATS thresholds, the current analysis pursues a two-fold purpose. First, we want to correlate pre-treatment PF with clinically relevant pneumonitis. Secondly, we intend to model post-treatment PF in dependence on radiation dose within a defined lung volume.

2. Methods

2.1. Patients

In the current analysis, 112 patients treated for inoperable NSCLC stage III with curative intent between 2015/10 and 2022/03 were included (approval by the ethics committee of the Federal State of Salzburg No. 415-E/1915/12-2015). All patients provided informed consent. The detailed selection criteria were described elsewhere [16]. In brief, patients with a suitable performance score (ECOG 0-1) were obligatorily staged with 18F-FDG-PET-CT and cranial MRI. They were followed up with thoracic contrast-enhanced CT and PF tests every three months for the first two years after completion of therapy and twice a year thereafter. For the current analysis, patients who had a minimum follow-up of one year were stratified according to whether or not they had received immunotherapy.

2.2. Sequential Chemo-Radio(-Immuno)Therapy

Following two cycles of platinum-based induction chemotherapy, all patients received sequential high-dose RT [17]. Two high-dose radiation treatment concepts were applied. Between 2015/10 and 2017/08, dose differentiated accelerated radiotherapy (DART) with two daily fractions of 1.8 Gy and total doses between 73.8 and 90.0 Gy in dependence on increasing tumor size was used [18]. As of 2017/09, an accelerated hypofractionated schedule with 3 Gy to the tumor up to a total dose of 66 Gy was implemented. This corresponds to the lowest dose level in the DART concept, with the biologically equivalent dose in 2 Gy fractions (EQD2) calculated according to the following formalism (D = total physical dose, d = single dose per fraction, α/β = 10 for tumor tissue).
E Q D 2 = D d + α / β 2 + α / β
The dose constraints to the organs at risk were applied according to international standards [19]: the maximum dose (Dmax) to the spinal cord was 45 Gy. The limits for the mean esophageal dose (MED) and the volume of the heart receiving 25 Gy or more (V25 Heart) were set at 34 Gy and 10%, respectively [19]. The mean lung dose (MLD) had to be below 20 Gy, and the volume of both lungs receiving 20 Gy or more (V20 Total Lung) was below 40% [19]. As of September 2017, patients received durvalumab maintenance therapy for one year at a dose of 10 mg/kg within the Austrian early access program.

2.3. Clinical Endpoints

With the current SoC treatment for NSCLC UICC III, 5-year OS rates of 43% can be achieved [2,3,4]. In this context, both the probability of pulmonary toxicity after sequential high-dose CRT and lung function as a quality-of-life surrogate have become increasingly important. Hence the current study has two endpoints: clinically relevant pneumonitis, i.e., grade 2 or higher, and DLCO decline of 10% or more.

2.3.1. Pneumonitis

Pneumonitis scoring was based on CTCAE v5.0, comprised of respiratory symptoms such as cough and dyspnea, sometimes associated with fever as well as simultaneous radiological alterations in the follow-up CT scan and a reduced lung function compared to the latest PF test. The focus was placed on clinically relevant pulmonary toxicity starting from grade 2, which entails the administration of cortisone. Grade 1 was not assessed since most patients have asymptomatic radiographic changes in the lungs after high-dose sCRT.

2.3.2. DLCO Thresholds

PF tests included whole-body plethysmography, blood gas analysis, and DLCO. In general, FEV1 and DLCO are the most frequently used parameters to assess PF after chemo-radio-immunotherapy, with the latter being a surrogate marker for the alveolar compartment.

Pre-Treatment DLCO Threshold of 60%

In 2005, the ATS/ERS task force for the standardization of lung function testing published a seminal paper on thresholds for PF to distinguish normal from pathologic lung function. As for DLCO, values between 75% and 140% are regarded as normal, while decreases to 60–74%, 40–59%, and <40% are defined as mild, moderate, and severe, respectively.

Post-Treatment DLCO Decline ≥10%

Respiratory medicine literature describes a DLCO decline of 10% as clinically relevant [20,21,22] as far as it may have an impact on the patients’ quality of life. Therefore, we chose this cutoff as the clinical endpoint for modeling the correlation between radiation dose volumes and PF.

2.4. Modeling DLCO as a Function of V65–45%

Based on the assumption that the anatomical substrate of CT density increase is fibrotic lung tissue that does not participate in gas exchange, we correlated DLCO and CT morphology changes in a previous analysis [16]. Dose volumes with reference to the PTV were delineated on the planning CT in 10% decrements from V105%, which is the volume receiving at least 105% of the prescription dose, to V5%. This was the basis for creating differential volumes, e.g., V105%-95% (=volume that received between 105% and 95% of the prescription dose). Lung density alterations in these differential volumes were related to DLCO. As a result, the most significant correlation was found with V65–45%. In the current paper, we intended to model the clinically relevant DLCO decline > 10% as a function of the relative V65–45% size. Hence, a binary data set for DLCO decline after RT with a cutoff value of 10% was plotted against the relative size of V65–45%. The cumulative distribution function (CDF) was used for a probit fit to check whether V65–45% could differentiate between a decline in DLCO either below or above the 10% threshold using the minimum chi-square method. Assuming a normal distribution, the CDF can be described by the following formalism:
C D F V r e l = 1 2 1 + e r f V r e l V C u t o f f σ 2
Vrel is the percentage of V65–45% with respect to total lung volume (Vrel = V65–45%/VLungs × 100), VCutoff is the relative cutoff volume for the probability of developing a DLCO decline ≥ 10%, σ is the standard deviation, and erf the error function. For significant differences in PF decline, a one-sided t-test was used, as we assumed that an improvement in DLCO would be unexpected.

2.5. Statistics

OS and progression-free survival (PFS) were calculated with the Kaplan–Meier method. The comparison between subgroups of patients with or without ICI was performed with the logrank test. The correlation between DLCO, dosimetric, and clinical parameters was performed with the Pearson test with Bonferroni correction to adjust for multiple testing.

3. Results

3.1. Patients

With a median follow-up of 20.4 months (range: 5.9–66.5 months), 29/112 (26%) patients had died. The median age at baseline was 66 years (range: 29–85). The majority of the patients were male (67%), and almost all of them (96%) had a suitable performance score (ECOG 0–1). Although 63/112 (56%) patients had quit smoking. Still, about 1/3 were current smokers. Fifty-four patients (48%) had COPD but still a sufficient lung function to undergo sCRT with or without ICI (Table 1). The subgroups of patients stratified by immunotherapy did not differ significantly in baseline characteristics (Table A1).

3.2. Sequential Chemo-Radio(-Immuno)-Therapy

All patients received two cycles of platinum-based induction chemotherapy combined with either gemcitabine or pemetrexed, depending on histology. After completion of RT, 64/112 patients (57%) received durvalumab maintenance therapy for one year (Table 2). The median gross tumor volume (GTV) was 29.4 mL (0.2–408 mL), with a median EQD2 to the tumor of 72.3 Gy (39–88.2). The median MLD was 12.0 Gy (4.0–18.0 Gy). By the end of 2018, VMAT was generally used as the technique of choice rather than step-and-shoot IMRT at our institute. In the wake of introducing durvalumab into clinical practice as of 2017/09, the radiation dose concept was modified to a moderate hypofractionation scheme with a median EQD2Tumor of 71.3 Gy (range: 60.0–77.6 Gy) instead of the previous fierce dose escalation (EQD2Tumor of 77.6; range: 58.3–88.2). This switch was based on the assumption that the trimodal treatment approach with durvalumab might be more effective as well as potentially more toxic. Hence, some of the technical treatment parameters differed significantly between subgroups (Table A2).

3.3. Clinical Outcome and Pulmonary Toxicity

The median follow-up was 20.4 months (range: 5.9–66.5). The Kaplan–Meier estimates for median OS and PFS were 57.9 months (95% CI: 44.5–71.3) and 33.9 months (95% CI: 15.0–52.8), respectively. While no difference between subgroups could be seen in terms of OS (Figure A1, logrank p-value = 0.357), PFS was significantly better for patients with ICI (Figure A2, 13.1 vs. 33.9 months, logrank p-value = 0.003). Sixteen cases (14%) of grade 2 or 3 pneumonitis occurred without clinically significant differences between subgroups (Table 3, Mann–Whitney U test p-value 0.691).

3.4. Baseline DLCO < 60% Predicts Pneumonitis

A total of 98 of the 112 patients (88%) had a DLCO measurement before treatment. The median was 67% of the predicted reference value (range: 16–103%). Forty-one patients had a DLCO below the 60% threshold, which is generally regarded as the cutoff between normal and mildly impaired DLCO [15]. Of these, 9 patients (22%) developed pneumonitis, which is twice as high as in the 6/56 (11%) patients with baseline DLCO > 60% (Table 4). We could establish a correlation between pre-therapeutic DLCO (patients labeled according to whether their DLCO was above or below the threshold) and the occurrence of pneumonitis (n = 98, one-sided Pearson correlation coefficient 0.175, p-value 0.042; Figure 1). While in the subgroup of patients without ICI, this correlation also reached statistical significance (n = 40, one-sided Pearson correlation coefficient 0.288; p-value 0.036), in those receiving ICI, it did not (n = 58, one-sided Pearson correlation coefficient 0.092, p-value 0.245)

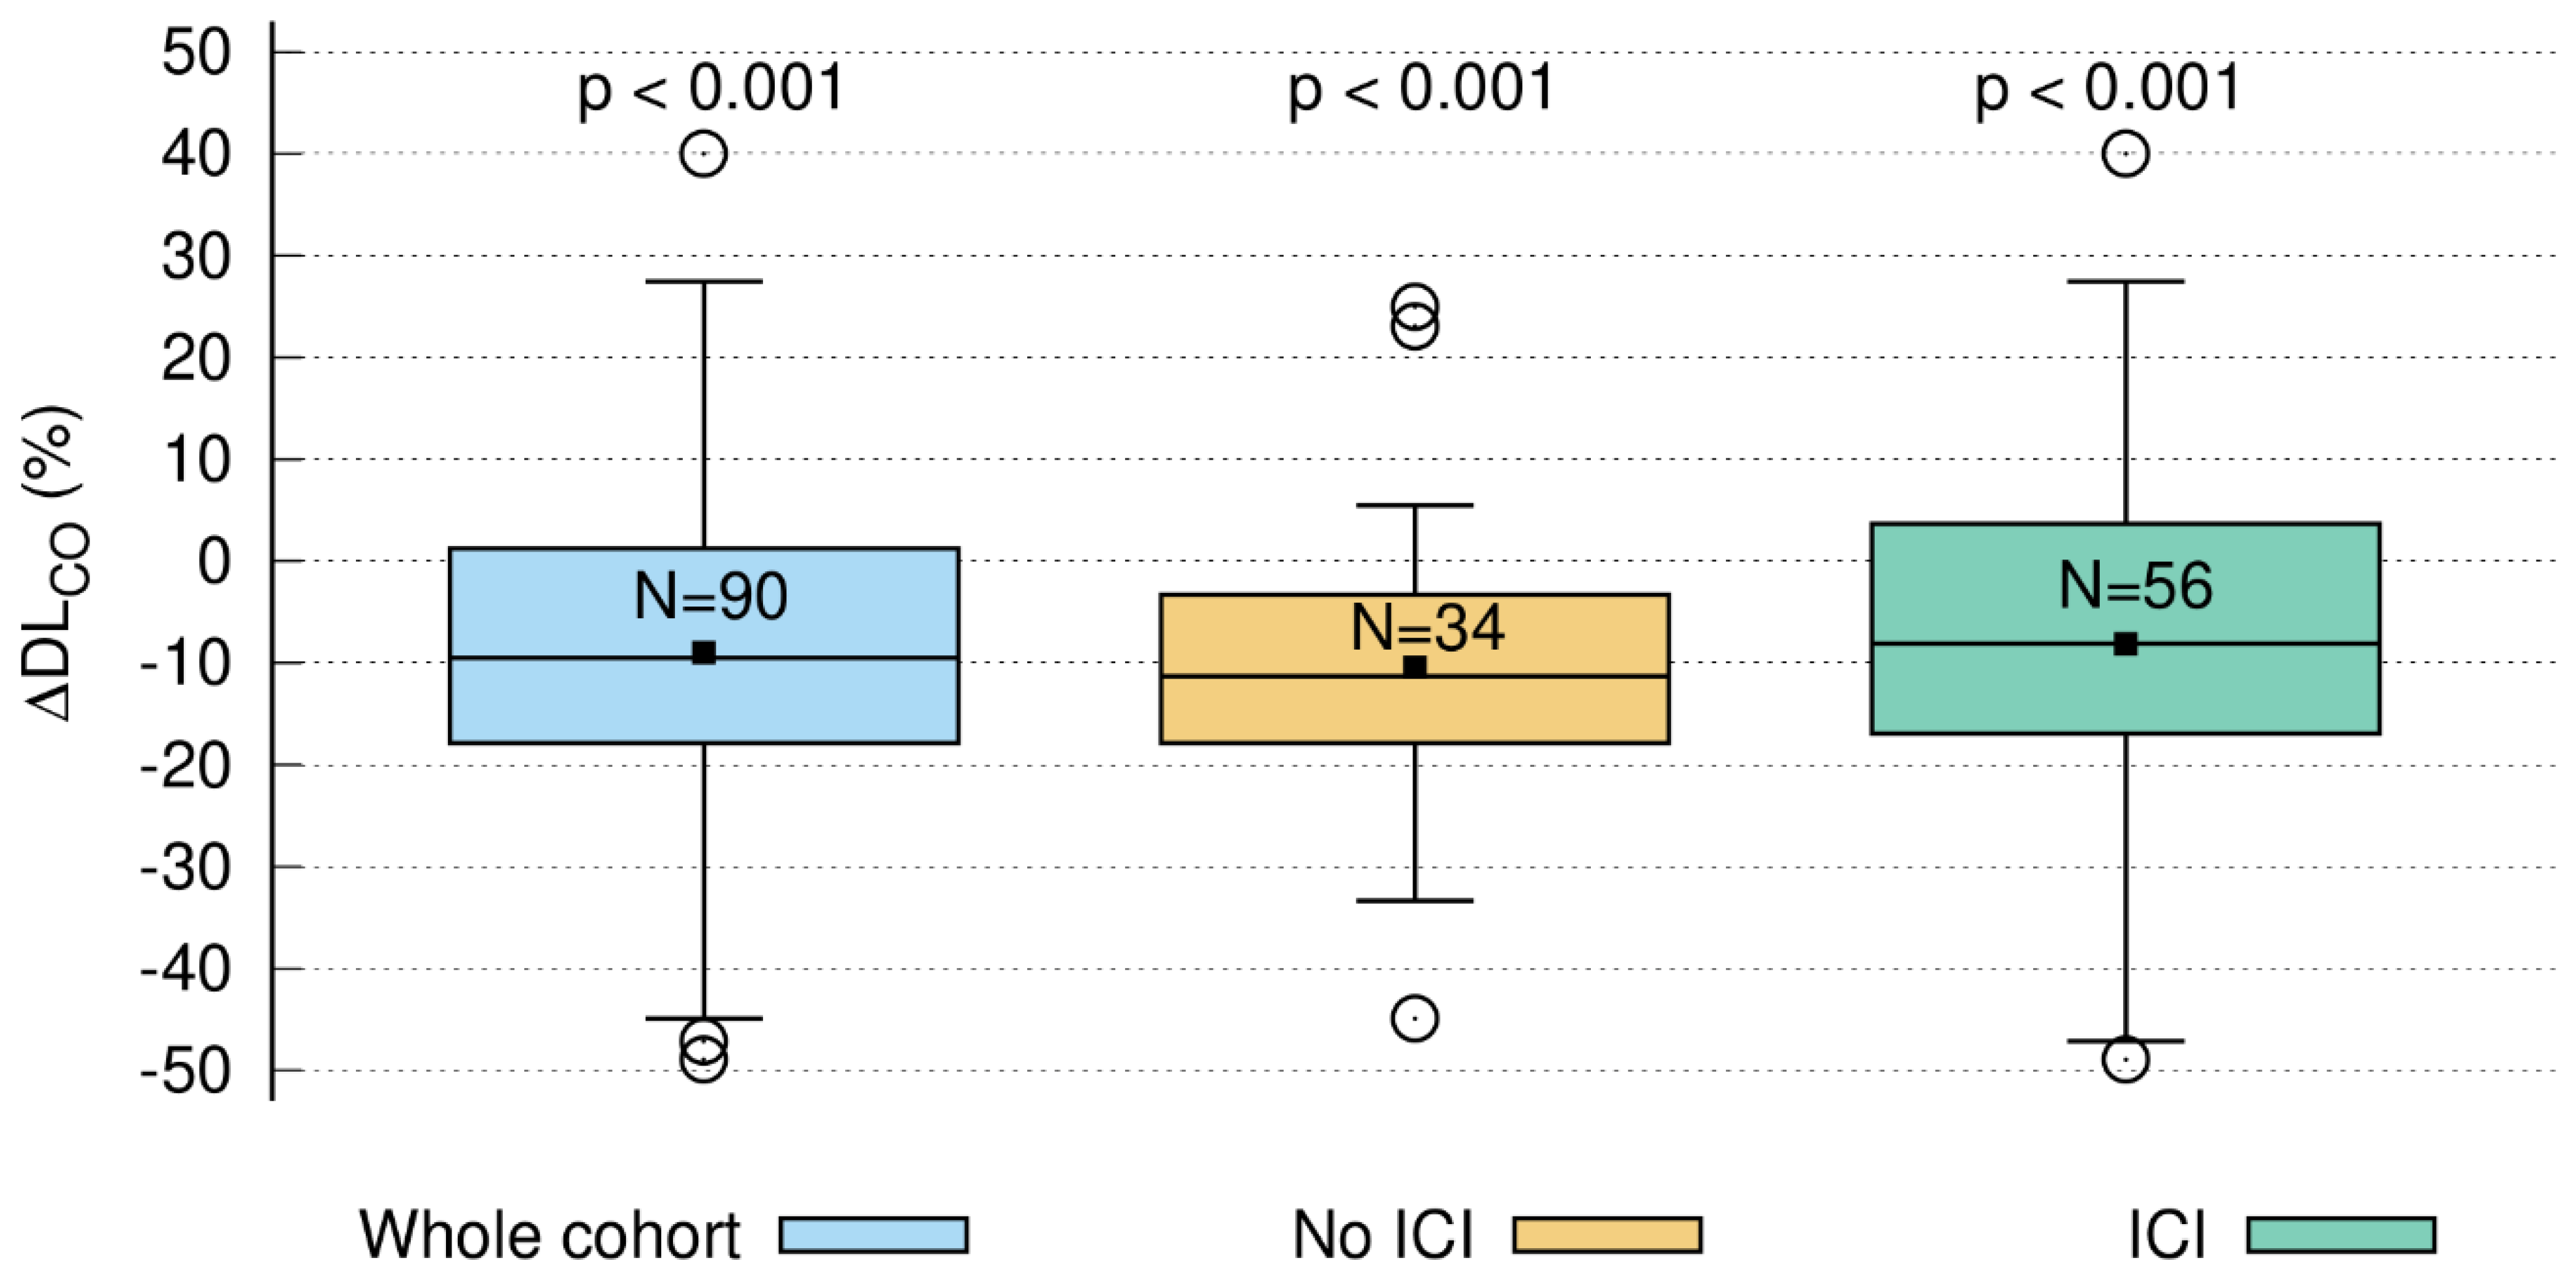
3.5. Short-Term DLCO Decline > 10%

3.5.1. Time Course of DLCO Decline

Of the 112 patients (64 vs. 48 with and without ICI, respectively), 90 patients (56 vs. 34) had paired DLCO measurements prior to as well as three months after RT. The median DLCO decline was 9.5% (Q1 = 1.3%, Q3 = 17.5%) at three months compared to baseline, which was statistically significant (one-sided t-test p < 0.001). Of note, a “negative decline” is, in fact, an increase in DLCO. A decline larger than 10% was observed in 43/90 (47.8%) patients (Figure 2). In the subgroup of patients without ICI, the median decline was 11.3% (Q1 = 3.4%, Q3 = 17.5%, one-sided t-test, p < 0.001), with 18/34 patients (52.9%) above the threshold. Patients with ICI had a significant median decline of 8.1% (Q1 = −3.5%, Q3 = 16.2%, one-sided t-test, p < 0.001). A decline above 10% was observed in 25/56 (44.6%) patients.

3.5.2. DLCO Decline ≥ 10% Correlates with V65–45% > 5.1%

While in a previous study, we correlated CT morphology changes with DLCO dynamics after RT [16], the current study shows that a clinically relevant DLCO decline > 10% is significantly correlated with a higher percentage of the differential volume V65–45%. Figure 3 visualizes the relation between V65–45% and a DLCO decline > 10% three months after RT (one-sided Pearson correlation coefficient = 0.143, p-value = 0.089) with the cutoff point at 5.1%. This trend became significant in the subgroup of patients without ICI (Figure 4, one-sided Pearson correlation coefficient of 0.354, p-value = 0.020) but not for patients with ICI (Figure 5, one-sided Pearson correlation coefficient = −0.001, p-value = 0.498). As shown in Figure 4, V65–45% above 5.1% entails a significantly higher probability for DLCO decline ≥ 10%. The correlation between the size of V65–45% and DLCO decline > 10% in the patient subgroup that received two fractions per day was not significant (one-sided Pearson correlation coefficient = 0.205, p-value = 0.077). Therefore the influence of RT practice changes as a confounding factor seems to be weak.

3.5.3. DLCO Decline Is Related to V20 Total Lung

Additionally, PF can be influenced by clinical and general therapeutic parameters. Hence, we correlated the following variables to DLCO decline at three months both in the whole cohort and the subgroups separately: age at diagnosis, sex, pre-therapeutic weight loss, ECOG, smoking status, histology, UICC stage, COPD grade, GTV, tumor location, RT technique, the addition of immunotherapy, MLD, V20 Total Lung, EQD2Tumor, EQD2Lymphnodes, and V65–45%. The only parameter that retained significance after Bonferroni correction was V20 Total Lung in the non-ICI group. Patients with a higher V20 Total Lung had a significantly higher probability for a DLCO decline ≥ 10% (Table A3 and Figure A3: one-sided Pearson correlation coefficient = 0.466, corrected p-value = 0.042).

4. Discussion

The current analysis is based on internationally accepted DLCO thresholds published by the ATS/ERS in 2005 [15]. In our cohort, the baseline DLCO threshold of 60% predicts pneumonitis, and the DLCO decline >10% correlates with dosimetric parameters such as the partial volume receiving 45% to 65% of the total dose (V65–45%) and the commonly used V20 Total Lung. Our findings corroborate previous investigations by our group, which revealed a strong correlation between CT morphology changes and the temporal dynamics of DLCO after sCRT [16]. This underlines the clinical importance of PF tests as a prediction tool for toxicity as well as a monitoring parameter in clinical follow-up. Of note, in the subgroup of patients who received durvalumab, no such correlations could be found.
The patient population in the current analysis was comparable to prospective studies conducted in the field of NSCLC UICC III for the past two decades [2,3,4,6,7,23,24,25]. While the median PFS of 33.9 months in our cohort fits perfectly well into the current notion of improved disease control for patients receiving ICI [2,3,4], follow-up was not long enough to soundly judge OS. In accordance with the literature [2,3,4], it can be said that PFS is significantly longer for ICI patients (p-value = 0.003; Figure A2), and a trend toward better OS can be seen for this subcohort (p-value = 0.357; Figure A1). As for toxicity, the 14% pneumonitis observed in our cohort is substantially lower than in the 32% vs. 24% in the experimental and standard arms of the PACIFIC trial, respectively [2,3]. However, these crude numbers are not entirely comparable since we assessed clinically relevant pneumonitis requiring therapeutic intervention only.
As the 5-year survival rate for patients receiving durvalumab was 43% in the PACIFIC trial, CRT plus immunotherapy has become SoC [5]. For these long-term survivors, toxicity and lung function after treatment play a crucial role. This aspect is of even greater interest since, in the current analysis, sequential high-dose RT was combined with durvalumab, which potentially harbors an enhanced risk for pneumonitis. However, according to recent publications, it seems [11,12,26] that durvalumab can be safely applied together with sequential high-dose CRT without excess pulmonary toxicity [12]. Similarly, it has been shown that pulmonary toxicity after sequential high-dose CRT is in the range of cCRT with a 60 Gy total dose in 2 Gy fractions [18,27,28].
As mentioned above, patients with a DLCO < 60% prior to RT had an increased probability of pneumonitis (Figure 1). While this difference became significant in the subgroup of patients without ICI, it was not seen in patients who had received durvalumab (Figure 1). Studies on DLCO as a surrogate marker for lung function date back to the early 20th century [29]. Nowadays, according to ATS/ERS, a DLCO between 75% and 140% represents normal global lung function, whereas 60–74% and 40–59% are mild and moderate decreases, respectively [15]. A decrease of 40% or below is considered severe [15]. From surgical [13,14,30,31] and radiation therapy studies [32,33,34], it is known that a pre-therapy DLCO < 60% is associated with inferior outcomes.
In a cohort of 98 patients, 60 of whom had UICC III, Brennan et al. found a sigmoid dose–response relationship between radiographic parameters, i.e., 4DCT ventilation data and PF. In this study, a cutoff >/<70% FEV1 was used to differentiate between normal and abnormal lung function [32]. Although Brennan et al. modeled a different PF parameter, we agree with the authors’ conclusion that advanced radiation treatment planning with VMAT/IMRT and online image guidance by cone-beam CT, together with PF monitoring, allow for the sparing of normal tissue in general and fibrotic areas specifically.
In analogy to Brennan and colleagues, we also used a CT morphology parameter, i.e., V65–45%, to establish a sigmoid correlation with a PF test variable, i.e., DLCO decline ≥ 10% (Figure 2), based on the ATS/ESR recommendations [15,20,22,35]. The median overall post-treatment decline in DLCO of 10.5% is in the same range as in published reports [36]. Furthermore, in a previous investigation by our group, we could demonstrate a correlation between the temporal development of radiographic post-treatment changes and the dynamics of DLCO in general. While in the above-mentioned investigation by our group, we could demonstrate a correlation between the temporal development of radiographic post-treatment changes and the dynamics of DLCO [16], the current analysis revealed that V65–45% higher than 5.1% is associated with a significantly increased probability in DLCO decline of 10% or more. This finding could contribute to optimized radiotherapy planning by keeping V65–45% below the 5% threshold in order to avoid PF loss after RT. The discrepancy between the statistically significant decrease in DLCO in the subgroup of patients without ICI (Figure 4) but not in the durvalumab group (Figure 5) might be explained by the fact that ICI itself causes radiographic changes, i.e., fibrosis, which cannot be quantified by a model based on radiation dosimetry parameters only. Similar observations were reported by Borst et al., who also found a short-term decline in DLCO three months after the end of RT in 34 patients. The decline persisted in the eight patients who were assessable 36 months after the end of RT, which might be important for long-term survivors [35]. The patient number, however, is very small, which precludes firm conclusions from this study. As for comparability with our data, it also has to be emphasized that the radiation techniques 20 years ago were different from current approaches to spare normal tissue. Moreover, patients did not receive ICI then.
In addition, Ma et al. also mentioned clinical and non-radiation-related treatment factors that may confound the correlation between CT morphology changes and PFTs [34]. For example, in central tumors, the shrinkage of the tumor leads to better lung ventilation, so there is the possibility of an inverse correlation between post-treatment PF tests and radiographic changes [34]. Furthermore, systemic treatments such as ICI may lead to pulmonary fibrosis [8,12], which is in line with the fact that we did not find a clear-cut correlation between radiation dosimetry and DLCO decline in the subgroup of patients treated with durvalumab. Of note, in the non-immunotherapy group, this relation was highly significant, with a raw p-value of 0.003 (Bonferroni correction: 0.042) for V20 Total Lung and DLCO. As this lung function parameter represents the alveolar compartment and is, therefore, a measure for gas exchange [13], it can be assumed that radiation-induced damage in the alveolar compartment reduces carbon monoxide diffusion across the alveolar-capillary membrane. Hence a larger V65–45% or V20 Total Lung entails a higher likelihood for DLCO decline. In this context, it also has to be mentioned that V65–45% and MLD were significant before Bonferroni correction for multiple testing. This means that these variables also have a certain predictive power, which is, however, markedly weaker compared to V20 Total Lung (Table A3). Our findings corroborate a long-term study on 108 breast cancer patients, which revealed a highly significant correlation between V20 Total Lung and DLCO [37]. Although these long-term data are not entirely comparable to our study, the reported reduction of 14% is in the same range as in our analysis (Figure 1).
The current paper is limited by its retrospective nature, although the patients were collected in a prospective institutional registry. In spite of being one of the largest NSCLC UICC III cohorts in the field, we are aware that the number of patients is still too small to draw firm conclusions. A major limitation of the current study is the lack of patient-reported outcome data, which could be integrated with the objective PF results to gain a more precise notion of what a 10% DLCO decline means in terms of daily quality of life. Finally, PF, in general, depends on a reproducible technical setup and patient compliance. The measurements for our study were conducted by the same team consisting of three technicians at the in-house pulmonology department. Inconsistencies due to patient positioning, as described by Katz [20], can be ruled out since the measurements were performed in a standardized sitting position.

5. Conclusions

In summary, we demonstrated that DLCO is a predictor for pulmonary toxicity and a monitoring tool for post-treatment lung function, which corroborates the usefulness of peri-treatment lung function testing and helps to optimize radiation treatment planning. In the future, prospective studies in larger cohorts should integrate the pre-treatment DLCO threshold of 60% as a parameter for patient selection in order to avoid pulmonary toxicity in patients with reduced pulmonary reserve. Additionally, V65–45% may complement the range of dosimetric parameters that predict lung function after therapy.

Author Contributions

Conceptualization, F.Z.; Methodology, E.R., B.Z. and F.Z.; Software, M.S. (Markus Stana), I.G., C.G., E.R. and B.Z.; Validation, G.F.; Formal analysis, I.G., E.R. and R.M.; Investigation, M.S. (Markus Stana), B.G., J.K., I.G. and F.Z.; Resources, C.G., R.M., M.S. (Michael Studnicka), G.F. and F.S.; Data curation, B.G., J.K. and C.G.; Writing—original draft, M.S. (Markus Stana), B.Z. and F.Z.; Writing—review & editing, B.G., J.K., R.M., M.S. (Michael Studnicka) and F.S.; Visualization, M.S. (Markus Stana); Supervision, M.S. (Michael Studnicka), F.S. and F.Z.; Project administration, G.F. and F.Z. All authors have read and agreed to the published version of the manuscript.

Funding

This research received no external funding.

Institutional Review Board Statement

The study was conducted in accordance with the Declaration of Helsinki, and approved by the Ethics Committee of the Federal State of Salzburg (approval number 415-E/1915/12-2015; date of approval: 15 December 2015).

Informed Consent Statement

Informed consent was obtained from all subjects involved in the study.

Data Availability Statement

The data presented in this study are available in this article.

Conflicts of Interest

The authors declare no conflict of interest.

Abbreviations

ATSAmerican Thoracic Society
CDFcumulative distribution function
CRTchemoradiotherapy
cCRTconcomitant chemoradiotherapy
DARTdose differentiated accelerated radiotherapy
DLCOcarbon monoxide diffusing capacity
Dmaxmaximum dose
EQD2biologically equivalent dose in 2 Gy fractions
ERSEuropean Respiratory Society
FEV1forced expiratory volume in one second
GTVgross tumor volume
ICIimmune checkpoint inhibitor
IMRTintensity-modulated radiotherapy
LA-NSCLClocally advanced non-small cell lung cancer
MEDmean esophageal dose
MLDmean lung dose
OSoverall survival
PFpulmonary function
PFSprogression-free survival
RTradiotherapy
SoCstandard of care
sCRTsequential chemoradiotherapy
V25 Heartheart volume receiving 25 Gy or more
V20 Total Lunglung volume receiving 20 Gy or more
V65–45%volume receiving between 45% and 65% of the prescribed total radiation dose
VMATvolumetric arc therapy

Appendix A

Table A1. Patients stratified by immunotherapy (sCRT = sequential chemoradiotherapy, ICI = immune checkpoint inhibitor, n.a. = not assessed). The comparison between subgroups was calculated using the Mann–Whitney U test.
Patients n = 112
sCRT
(n = 48)
sCRT + ICI
(n = 64)
p-Value
AgeMedian65.568.00.147
Range46–8229–88.5
SexMale34 (71%)41 (64%)0.453
Female14 (29%)23 (36%)
Weight loss<5%42 (88%)60 (94%)0.253
>5%6 (13%)4 (6%)
ECOG0–146 (96%)62 (97%)0.474
22 (4%)2 (3%)
Smoking statusEx28 (58%)35 (55%)0.888
Current15 (31%)21 (33%)
Never5 (10%)6 (9%)
Unknown0 (0%)2 (3%)
HistologyNSCLC48 (100%)64 (100%)n.a.
Unknown0 (0%)0 (0%)
UICC stage III48 (100%)64 (100%)n.a.
Unknown0 (0%)0 (0%)
COPD grade027 (56%)31 (49%)0.709
14 (8%)6 (9%)
26 (13%)18 (28%)
39 (19%)6 (9%)
42 (4%)3 (5%)
Table A2. Patients stratified by immunotherapy (sCRT = sequential chemoradiotherapy, GTV = gross tumor volume, RT = radiotherapy, ICI = immune checkpoint inhibitor, MLD = mean lung dose, IMRT = intensity-modulated radiotherapy, VMAT = volumetric arc therapy, V20 Total Lung = lung volume receiving 20 Gy or more, EQD2 = biologically equivalent dose in 2 Gy fractions, n.a. = not assessed). The comparison between subgroups was calculated using the Mann–Whitney U test.
Treatment n = 112
sCRT
(n = 48)
sCRT + ICI (n = 64)p-Value
GTV (mL)Median15.143.00.023
Range1.0–132.00.2–408.5
Tumor location (n)Peripheral28 (58%)25 (39%)0.044
Central20 (42%)39 (61%)
RT technique (n)IMRT43 (90%)9 (14%)<0.001
VMAT5 (10%)55 (86%)
ICI 0 (0%)64 (100%)n.a.
MLD (Gy)Median12.112.00.130
Range7–17.94.0–14.8
V20 total lung (%)Median21200.052
Range11.0-37.05.5–29.0
EQD2 tumor (Gy)Median77.671.5<0.001
Range58.3–88.239–77.6
EQD2 lymph nodes (Gy)Median6057.30.003
Range0–60.00–60.0
Table A3. Correlation of DLCO decline > 10% with clinical and treatment-related parameters (GTV = gross tumor volume, ICI = immune checkpoint inhibitor, MLD = mean lung dose, V20 Total Lung = lung volume receiving 20 Gy or more, EQD2 = biologically equivalent dose in 2 Gy fractions), V65–45% (lung volume receiving between 45% and 65% of the prescribed dose). Bonferroni correction was performed to account for multiple testing.
Pearson Correlation CoefficientRaw p-ValueCorrected p-Value
Age0.0990.290n.s.
Sex0.0220.450n.s.
Weight loss−0.2740.058n.s.
ECOG−0.2040.123n.s.
Smoking status0.0380.416n.s.
Histologyn.a.
UICC stagen.a.
COPD0.0380.415n.s.
GTV0.0600.367n.s.
Tumor location−0.1740.163n.s.
Radiation technique−0.1220.246n.s.
ICIn.a.
MLD0.3940.010n.s.
V20 total lung0.4660.0030.042
EQD2 tumor0.2240.102n.s.
EQD2 lymph nodes0.2570.071n.s.
V65–45%0.3540.020n.s.
Figure A1. Overall survival did not differ significantly between the subgroups of patients with or without immunotherapy (logrank p-value = 0.357).
Cancers 15 01966 g0a1
Figure A2. The comparison between subgroups revealed a significantly better progression-free survival for patients with immunotherapy (logrank p-value = 0.003).
Cancers 15 01966 g0a2
Figure A3. In the non-immunotherapy subgroup (brown), patients with a DLCO decline of 10% or more after the end of RT had a significantly higher V20 total lung. The Bonferroni correction was applied to adjust for multiple testing: n = 34, Pearson correlation coefficient = 0.466 (corrected p-value 0.039). In the whole cohort (blue) and the immunotherapy subgroup (green), this difference was not significant after correction for multiple testing. Median and mean are represented by horizontal lines and crosses, respectively.
Cancers 15 01966 g0a3

References

  1. Malvezzi, M.; Carioli, G.; Bertuccio, P.; Boffetta, P.; Levi, F.; La Vecchia, C.; Negri, E. European cancer mortality predictions for the year 2017, with focus on lung cancer. Ann. Oncol. 2017, 28, 1117–1123. [Google Scholar] [CrossRef] [PubMed]
  2. Antonia, S.J.; Villegas, A.; Daniel, D.; Vicente, D.; Murakami, S.; Hui, R.; Kurata, T.; Chiappori, A.; Lee, K.H.; De Wit, M.; et al. Overall Survival with Durvalumab after Chemoradiotherapy in Stage III NSCLC. N. Engl. J. Med. 2018, 379, 2342–2350. [Google Scholar] [CrossRef]
  3. Antonia, S.J.; Villegas, A.; Daniel, D.; Vicente, D.; Murakami, S.; Hui, R.; Yokoi, T.; Chiappori, A.; Lee, K.H.; De Wit, M.; et al. Durvalumab after Chemoradiotherapy in Stage III Non-Small-Cell Lung Cancer. N. Engl. J. Med. 2017, 377, 1919–1929. [Google Scholar] [CrossRef] [Green Version]
  4. Spigel, D.R.; Faivre-Finn, C.; Gray, J.E.; Vicente, D.; Planchard, D.; Paz-Ares, L.; Vansteenkiste, J.F.; Garassino, M.C.; Hui, R.; Quantin, X.; et al. Five-Year Survival Outcomes from the PACIFIC Trial: Durvalumab After Chemoradiotherapy in Stage III Non-Small-Cell Lung Cancer. J. Clin. Oncol. 2022, 40, 1301–1311. [Google Scholar] [CrossRef] [PubMed]
  5. Ettinger, D.S.; Wood, D.E.; Aisner, D.L.; Akerley, W.; Bauman, J.R.; Bharat, A.; Bruno, D.S.; Chang, J.Y.; Chirieac, L.R.; D'Amico, T.A.; et al. Non-Small Cell Lung Cancer, Version 2.2021 Featured Updates to the NCCN Guidelines. J. Natl. Compr. Cancer Netw. 2021, 19, 254–266. [Google Scholar] [CrossRef] [PubMed]
  6. Furuse, K.; Fukuoka, M.; Kawahara, M.; Nishikawa, H.; Takada, Y.; Kudoh, S.; Katagami, N.; Ariyoshi, Y. Phase III study of concurrent versus sequential thoracic radiotherapy in combination with mitomycin, vindesine, and cisplatin in unresectable stage III non-small-cell lung cancer. J. Clin. Oncol. 1999, 17, 2692–2699. [Google Scholar] [CrossRef]
  7. Curran, W.J.; Paulus, R.; Langer, C.J.; Komaki, R.; Lee, J.S.; Hauser, S.; Movsas, B.; Wasserman, T.; Rosenthal, S.A.; Gore, E.; et al. Sequential vs. concurrent chemoradiation for stage III non-small cell lung cancer: Randomized phase III trial RTOG 9410. J. Natl. Cancer Inst. 2011, 103, 1452–1460. [Google Scholar] [CrossRef] [Green Version]
  8. Nishino, M.; Giobbie-Hurder, A.; Hatabu, H.; Ramaiya, N.H.; Hodi, S. Incidence of Programmed Cell Death 1 Inhibitor-Related Pneumonitis in Patients with Advanced Cancer: A Systematic Review and Meta-analysis. JAMA Oncol. 2016, 2, 1607–1616. [Google Scholar] [CrossRef] [Green Version]
  9. Suresh, K.; Voong, K.R.; Shankar, B.; Forde, P.M.; Ettinger, D.S.; Marrone, K.A.; Kelly, R.J.; Hann, C.L.; Levy, B.; Feliciano, J.L.; et al. Pneumonitis in Non-Small Cell Lung Cancer Patients Receiving Immune Checkpoint Immunotherapy: Incidence and Risk Factors. J. Thorac. Oncol. 2018, 13, 1930–1939. [Google Scholar] [CrossRef] [Green Version]
  10. Fukihara, J.; Sakamoto, K.; Koyama, J.; Ito, T.; Iwano, S.; Morise, M.; Ogawa, M.; Kondoh, Y.; Kimura, T.; Hashimoto, N.; et al. Prognostic Impact and Risk Factors of Immune-Related Pneumonitis in Patients with Non-Small-Cell Lung Cancer Who Received Programmed Death 1 Inhibitors. Clin. Lung Cancer 2019, 20, 442–450.e4. [Google Scholar] [CrossRef]
  11. Landman, Y.; Jacobi, O.; Kurman, N.; Yariv, O.; Peretz, I.; Rotem, O.; Dudnik, E.; Zer, A.; Allen, A.M. Durvalumab after concurrent chemotherapy and high-dose radiotherapy for locally advanced non-small cell lung cancer. Oncoimmunology 2021, 10, 1959979. [Google Scholar] [CrossRef]
  12. Wass, R.; Hochmair, M.; Kaiser, B.; Grambozov, B.; Feurstein, P.; Weiß, G.; Moosbrugger, R.; Sedlmayer, F.; Lamprecht, B.; Studnicka, M.; et al. Durvalumab after Sequential High Dose Chemoradiotherapy versus Standard of Care (SoC) for Stage III NSCLC: A Bi-Centric Trospective Comparison Focusing on Pulmonary Toxicity. Cancers 2022, 14, 3226. [Google Scholar] [CrossRef]
  13. Liptay, M.J.; Basu, S.; Hoaglin, M.C.; Freedman, N.; Faber, L.P.; Warren, W.H.; Hammoud, Z.T.; Kim, A.W. Diffusion Lung Capacity for Carbon Monoxide (DLCO) Is an Independent Prognostic Factor for Long-Term Survival After Curative Lung Resection for Cancer. J. Surg. Oncol. 2009, 100, 703–707. [Google Scholar] [CrossRef]
  14. Ferguson, M.K.; Reeder, L.B.; Mick, R. Optimizing Selection of Patients for Major Lung Resection. J. Thorac. Cardiov. Sur. 1995, 109, 275–283. [Google Scholar] [CrossRef] [Green Version]
  15. Pellegrino, R.; Viegi, G.; Brusasco, V.; Crapo, R.O.; Burgos, F.; Casaburi, R.; Coates, A.; Van Der Grinten, C.P.M.; Gustafsson, P.; Hankinson, J.; et al. Interpretative strategies for lung function tests. Eur. Respir. J. 2005, 26, 948–968. [Google Scholar] [CrossRef] [Green Version]
  16. Stana, M.; Grambozov, B.; Gaisberger, C.; Karner, J.; Ruznic, E.; Berchtold, J.; Zellinger, B.; Moosbrugger, R.; Studnicka, M.; Fastner, G.; et al. Carbon Monoxide Diffusing Capacity (DLCO) Correlates with CT Morphology after Chemo-Radio-Immunotherapy for Non-Small Cell Lung Cancer Stage III. Diagnostics 2022, 12, 1027. [Google Scholar] [CrossRef] [PubMed]
  17. Grambozov, B.; Wolf, F.; Kaiser, J.; Wass, R.; Fastner, G.; Gaisberger, C.; Rettenbacher, L.; Studnicka, M.; Pirich, C.; Sedlmayer, F.; et al. Pulmonary function decreases moderately after accelerated high-dose irradiation for stage III non-small cell lung cancer. Thorac. Cancer 2020, 11, 369–378. [Google Scholar] [CrossRef]
  18. Wurstbauer, K.; Deutschmann, H.; Dagn, K.; Kopp, P.; Zehentmayr, F.; Lamprecht, B.; Porsch, P.; Wegleitner, B.; Studnicka, M.; Sedlmayer, F. DART-bid (Dose-differentiated accelerated radiation therapy, 1.8 Gy twice daily)—A novel approach for non-resected NSCLC: Final results of a prospective study, correlating radiation dose to tumor volume. Radiat. Oncol. 2013, 8, 49. [Google Scholar] [CrossRef] [Green Version]
  19. Marks, L.B.; Bentzen, S.M.; Deasy, J.O.; Kong, F.-M.; Bradley, J.D.; Vogelius, I.S.; El Naqa, I.; Hubbs, J.L.; Lebesque, J.V.; Timmerman, R.D.; et al. Radiation dose-volume effects in the lung. Int. J. Radiat. Oncol. Biol. Phys. 2010, 76, S70–S76. [Google Scholar] [CrossRef] [PubMed] [Green Version]
  20. Katz, S.; Arish, N.; Rokach, A.; Zaltzman, Y.; Marcus, E.L. The effect of body position on pulmonary function: A systematic review. BMC Pulm. Med. 2018, 18, 1–16. [Google Scholar] [CrossRef] [PubMed]
  21. Graham, B.L.; Brusasco, V.; Burgos, F.; Cooper, B.G.; Jensen, R.; Kendrick, A.; MacIntyre, N.R.; Thompson, B.R.; Wanger, J. Executive Summary: 2017 ERS/ATS standards for single-breath carbon monoxide uptake in the lung. Eur. Respir. J. 2017, 49, 16E0016. [Google Scholar] [CrossRef] [PubMed] [Green Version]
  22. Hathaway, E.H.; Tashkin, D.P.; Simmons, M.S. Intraindividual Variability in Serial Measurements of Dlco and Alveolar Volume over One Year in 8 Healthy-Subjects Using 3 Independent Measuring Systems. Am. Rev. Respir. Dis. 1989, 140, 1818–1822. [Google Scholar] [CrossRef]
  23. Fournel, P.; Robinet, G.; Thomas, P.; Souquet, P.J.; Léna, H.; Vergnenégre, A.; Delhoume, J.Y.; Le Treut, J.; Silvani, J.A.; Dansin, E.; et al. Randomized phase III trial of sequential chemoradiotherapy compared with concurrent chemoradiotherapy in locally advanced non-small-cell lung cancer: Groupe Lyon-Saint-Etienne d'Oncologie Thoracique-Groupe Francais de Pneumo-Cancerologie NPC 95-01 Study. J. Clin. Oncol. 2005, 23, 5910–5917. [Google Scholar] [CrossRef]
  24. Zatloukal, P.; Petruzelka, L.; Zemanova, M.; Havel, L.; Janku, F.; Judas, L.; Kubik, A.; Krepela, E.; Fiala, P.; Pecen, L. Concurrent versus sequential chemoradiotherapy with cisplatin and vinorelbine in locally advanced non-small cell lung cancer: A randomized study. Lung Cancer 2004, 46, 87–98. [Google Scholar] [CrossRef] [PubMed]
  25. Bradley, J.D.; Paulus, R.; Komaki, R.; Masters, G.; Blumenschein, G.; Schild, S.; Bogart, J.; Hu, C.; Forster, K.; Magliocco, A.; et al. Standard-dose versus high-dose conformal radiotherapy with concurrent and consolidation carboplatin plus paclitaxel with or without cetuximab for patients with stage IIIA or IIIB non-small-cell lung cancer (RTOG 0617): A randomised, two-by-two factorial phase 3 study. Lancet Oncol. 2015, 16, 187–199. [Google Scholar] [PubMed] [Green Version]
  26. Garassino, M.; Mazieres, J.; Reck, M.; Chouaid, C.; Bischoff, H.; Reinmuth, N.; Cove-Smith, L.; Mansy, T.; Cortinovis, D.; Migliorino, M.; et al. Safety and efficacy outcomes with durvalumab after sequential chemoradiotherapy (sCRT) in stage III, unresectable NSCLC (PACIFIC-6). Ann. Oncol. 2022, 33, S81–S82. [Google Scholar] [CrossRef]
  27. Aupérin, A.; Le Péchoux, C.; Rolland, E.; Curran, W.J.; Furuse, K.; Fournel, P.; Belderbos, J.; Clamon, G.; Ulutin, H.C.; Paulus, R.; et al. Meta-analysis of concomitant versus sequential radiochemotherapy in locally advanced non-small-cell lung cancer. J. Clin. Oncol. 2010, 28, 2181–2190. [Google Scholar] [CrossRef] [Green Version]
  28. Kuang, Y.; Pierce, C.M.; Chang, H.C.; Sosinsky, A.Z.; Deitz, A.C.; Keller, S.M.; Samkari, A.; Uyei, J. Chemoradiation-induced pneumonitis in patients with unresectable stage III non-small cell lung cancer: A systematic literature review and meta-analysis. Lung Cancer 2022, 174, 174–185. [Google Scholar] [CrossRef]
  29. Hughes, J.M.B.; Bates, D.V. Historical review: The carbon monoxide diffusing capacity (DLCO) and its membrane (D-M) and red cell (Theta center dot Vc) components. Resp. Physiol. Neurobi. 2003, 138, 115–142. [Google Scholar] [CrossRef]
  30. Wang, J.; Olak, J.; Ferguson, M.K. Diffusing capacity predicts operative mortality but not long-term survival after resection for lung cancer. J. Thorac. Cardiov. Sur. 1999, 117, 581–587. [Google Scholar] [CrossRef] [Green Version]
  31. Celli, B.; MacNee, W.; Agusti, A.; Anzueto, A.; Berg, B.; Buist, A.; Calverley, P.; Chavannes, N.; Dillard, T.; Fahy, B.; et al. Standards for the diagnosis and treatment of patients with COPD: A summary of the ATS/ERS position paper. Eur. Respir. J. 2004, 23, 932–946. [Google Scholar] [CrossRef] [Green Version]
  32. Brennan, D.; Schubert, L.; Diot, Q.; Castillo, R.; Castillo, E.; Guerrero, T.; Martel, M.K.; Linderman, D.; Gaspar, L.E.; Miften, M.; et al. Clinical Validation of 4-Dimensional Computed Tomography Ventilation with Pulmonary Function Test Data. Int. J. Radiat. Oncol. 2015, 92, 423–429. [Google Scholar] [CrossRef] [Green Version]
  33. Videtic, G.M.; Stitt, L.W.; Ash, R.B.; Truong, P.T.; Dar, A.; Yu, E.W.; Whiston, F. Impaired diffusion capacity predicts for decreased treatment tolerance and survival in limited stage small cell lung cancer patients treated with concurrent chemoradiation. Lung Cancer 2004, 43, 159–166. [Google Scholar] [CrossRef] [PubMed]
  34. Ma, J.; Zhang, J.; Zhou, S.; Hubbs, J.L.; Foltz, R.J.; Hollis, D.R.; Light, K.L.; Wong, T.Z.; Kelsey, C.R.; Marks, L.B. Association between RT-induced changes in lung tissue density and global lung function. Int. J. Radiat. Oncol. Biol. Phys. 2009, 74, 781–789. [Google Scholar] [CrossRef] [Green Version]
  35. Borst, G.R.; De Jaeger, K.; Belderbos, J.S.; Burgers, S.A.; Lebesque, J.V. Pulmonary function changes after radiotherapy in non-small-cell lung cancer patients with long-term disease-free survival. Int. J. Radiat. Oncol. Biol. Phys. 2005, 62, 639–644. [Google Scholar] [CrossRef] [PubMed]
  36. Enache, I.; Noel, G.; Jeung, M.Y.; Meyer, N.; Oswald-Mammosser, M.; Pistea, C.; Jung, G.-M.; Mennecier, B.; Quoix, E.; Charloux, A. Impact of 3D conformal radiotherapy on lung function of patients with lung cancer: A prospective study. Respiration 2013, 86, 100–108. [Google Scholar] [CrossRef]
  37. Verbanck, S.; Van Parijs, H.; Schuermans, D.; Vinh-Hung, V.; Storme, G.; Fontaine, C.; De Ridder, M.; Verellen, D.; Vanderhelst, E.; Hanon, S. Lung Restriction in Patients with Breast Cancer After Hypofractionated and Conventional Radiation Therapy: A 10-Year Follow-up. Int. J. Radiat. Oncol. 2022, 113, 561–569. [Google Scholar] [CrossRef] [PubMed]
Figure 1. Pre-treatment DLCO (=carbon monoxide diffusing capacity) predicts the occurrence of clinically relevant pneumonitis, which was significant in the whole cohort (blue: n = 98; one-sided Pearson correlation coefficient 0.175; p-value = 0.042) and in the subcohort without ICI (= immune checkpoint inhibitor) shown in the brown boxplot (n = 40; one-sided Pearson correlation coefficient 0.288; p-value = 0.036). In patients with ICI (green), no such correlation could be found (n = 58; one-sided Pearson correlation coefficient 0.092; p-value = 0.245).
Cancers 15 01966 g001
Figure 2. Relative decline in DLCO three months after radiotherapy compared to baseline (ΔDLCO): whole cohort (blue; n = 90), patients without ICI (=immune checkpoint inhibitor; brown; n = 34), and patients with ICI (green; n = 56). The decrease in DLCO (ΔDLCO) was significant for all three groups.
Cancers 15 01966 g002
Figure 3. Whole cohort. The probability of DLCO decrease ≥ 10% after the end of RT (y-axis) is plotted as a function of the relative size of V65–45% with respect to total lung volume (Vrel, x-axis). The sigmoid shape of the cumulative distribution function (CDF) shows that a larger V65–45% entails a higher probability for DLCO decline. All patients had paired measurements before and three months after radiotherapy (n = 90; Pearson correlation coefficient = 0.143; p-value = 0.089). The cutoff for Vrel was 5.4%. Patients with a DLCO decrease of ≥10% and <10% are represented by circles and squares, respectively.
Cancers 15 01966 g003
Figure 4. Patients without ICI (=immune checkpoint inhibitor). The probability of DLCO decrease ≥ 10% after the end of RT (y-axis) is plotted as a function of the relative size of V65–45% with respect to the total lung volume (Vrel, x-axis). The sigmoid shape of the cumulative distribution function (CDF) shows that a larger V65–45% entails a higher probability for DLCO decline. Patients had paired measurements before and three months after radiotherapy (n = 34, Pearson correlation coefficient of 0.354, p-value = 0.020). The cutoff for Vrel was 5.1%. Patients with a DLCO decrease of ≥10% and <10% are represented by circles and squares, respectively.
Cancers 15 01966 g004
Figure 5. Patients with ICI (=immune checkpoint inhibitor). The probability of DLCO decrease ≥ 10% after the end of RT (y-axis) is plotted as a function of the relative size of V65–45% with respect to the total lung volume (Vrel, x-axis). The cumulative distribution function (CDF) does not reveal a significant correlation. Patients had paired measurements before and three months after radiotherapy (n = 56, Pearson correlation coefficient = −0.001, p-value = 0.498). Patients with a DLCO decrease of ≥10% and <10% are represented by circles and squares, respectively.
Cancers 15 01966 g005
Table 1. Patient characteristics (NSCLC = non-small-cell lung cancer).
Patients n = 112
Age (years)Median66
Range29–85
SexMale 75 (67%)
Female37 (33%)
Weight loss (%)>5%9 (8%)
<5%103 (92%)
ECOG 0–1108 (96%)
24 (4%)
Smoking statusEx63 (56%)
Current36 (32%)
Never11 (10%)
Unknown2 (2%)
HistologyNSCLC112 (100%)
Unknown0 (0%)
UICCIII112 (100%)
COPD grade 058 (52%)
110 (9%)
224 (21%)
315 (13%)
45 (5%)
Unknown0 (0%)
Table 2. Treatment (GTV = gross tumor volume, RT = radiotherapy, ICI = immune checkpoint inhibitor, MLD = mean lung dose, IMRT = intensity-modulated radiotherapy, VMAT = volumetric arc therapy, V20 Total Lung = lung volume receiving 20 Gy or more, EQD2 = biologically equivalent dose in 2 Gy fractions).
Treatment n = 112
GTV (mL)Median29.4
Range0.3–408
Tumor location (n)Peripheral53 (47%)
Central59 (53%)
RT technique (n)IMRT52 (46%)
VMAT60 (54%)
ICIYes64 (57%)
No48 (43%)
MLD (Gy)Median12.0
Range4.0–18.0
V20 Total lung (%)Median20.0
Range5.3–37.0
EQD2 Tumor (Gy)Median72.3
Range39.0–88.2
EQD2 Lymphnodes (Gy)Median57.3
Range0–60.0
Table 3. The occurrence of clinically relevant pneumonitis, i.e., grades 2 to 5, did not differ significantly between subgroups with or without ICI (=immune checkpoint inhibitor; Mann–Whitney U test, p-value = 0.691).
Pneumonitis
Grade 2Grade 3Grade 4Grade 5p-Value
Whole cohort (n = 112)13 (12%)3 (3%)0 (0%)0 (0%)n.a.
No ICI (n = 48)4 (8%)2 (4%)0 (0%)0 (0%)0.691
ICI (n = 64)9 (14%)1 (2%)0 (0%)0 (0%)
Table 4. Clinically relevant pneumonitis in dependence of baseline DLCO. If baseline DLCO was <60%, the probability of clinically relevant pneumonitis was approximately twice as high as in patients with DLCO above this threshold (n.a. = not assessable).
Pneumonitis in Dependence of Baseline DLCO
Baseline DLCO
<60%>60%n.a.
Pneumonitis cases9 (22%)6 (11%)1
Disclaimer/Publisher’s Note: The statements, opinions and data contained in all publications are solely those of the individual author(s) and contributor(s) and not of MDPI and/or the editor(s). MDPI and/or the editor(s) disclaim responsibility for any injury to people or property resulting from any ideas, methods, instructions or products referred to in the content.

