

From Head and Neck Tumour and Lymph Node Segmentation to Survival Prediction on PET/CT: An End-to-End Framework Featuring Uncertainty, Fairness, and Multi-Region Multi-Modal Radiomics
 , and
, and 
Abstract
:Simple Summary
Abstract
1. Introduction
- We evaluated a 3D segmentation framework for primary tumour and lymph node segmentation.
- We implemented a method for uncertainty estimation to calculate the model confidence for the primary tumour and lymph nodes segmentation to minimise the risk of the model failing silently. We applied the uncertainty score for the false positive reduction in lymph nodes and tumours.
- We extracted handcrafted radiomics features both from the primary tumour and lymph nodes, separately from CT and PET images, and investigated their prognostic potential. We explored different combinations of these regions of interest in these two modalities to guide future research.
- We evaluated the performances of the segmentation model and the radiomics model for fairness with respect to relevant clinical characteristics such as age, gender, HPV status, and chemotherapy status, as well as lesion size.
2. Materials and Methods
2.1. Dataset
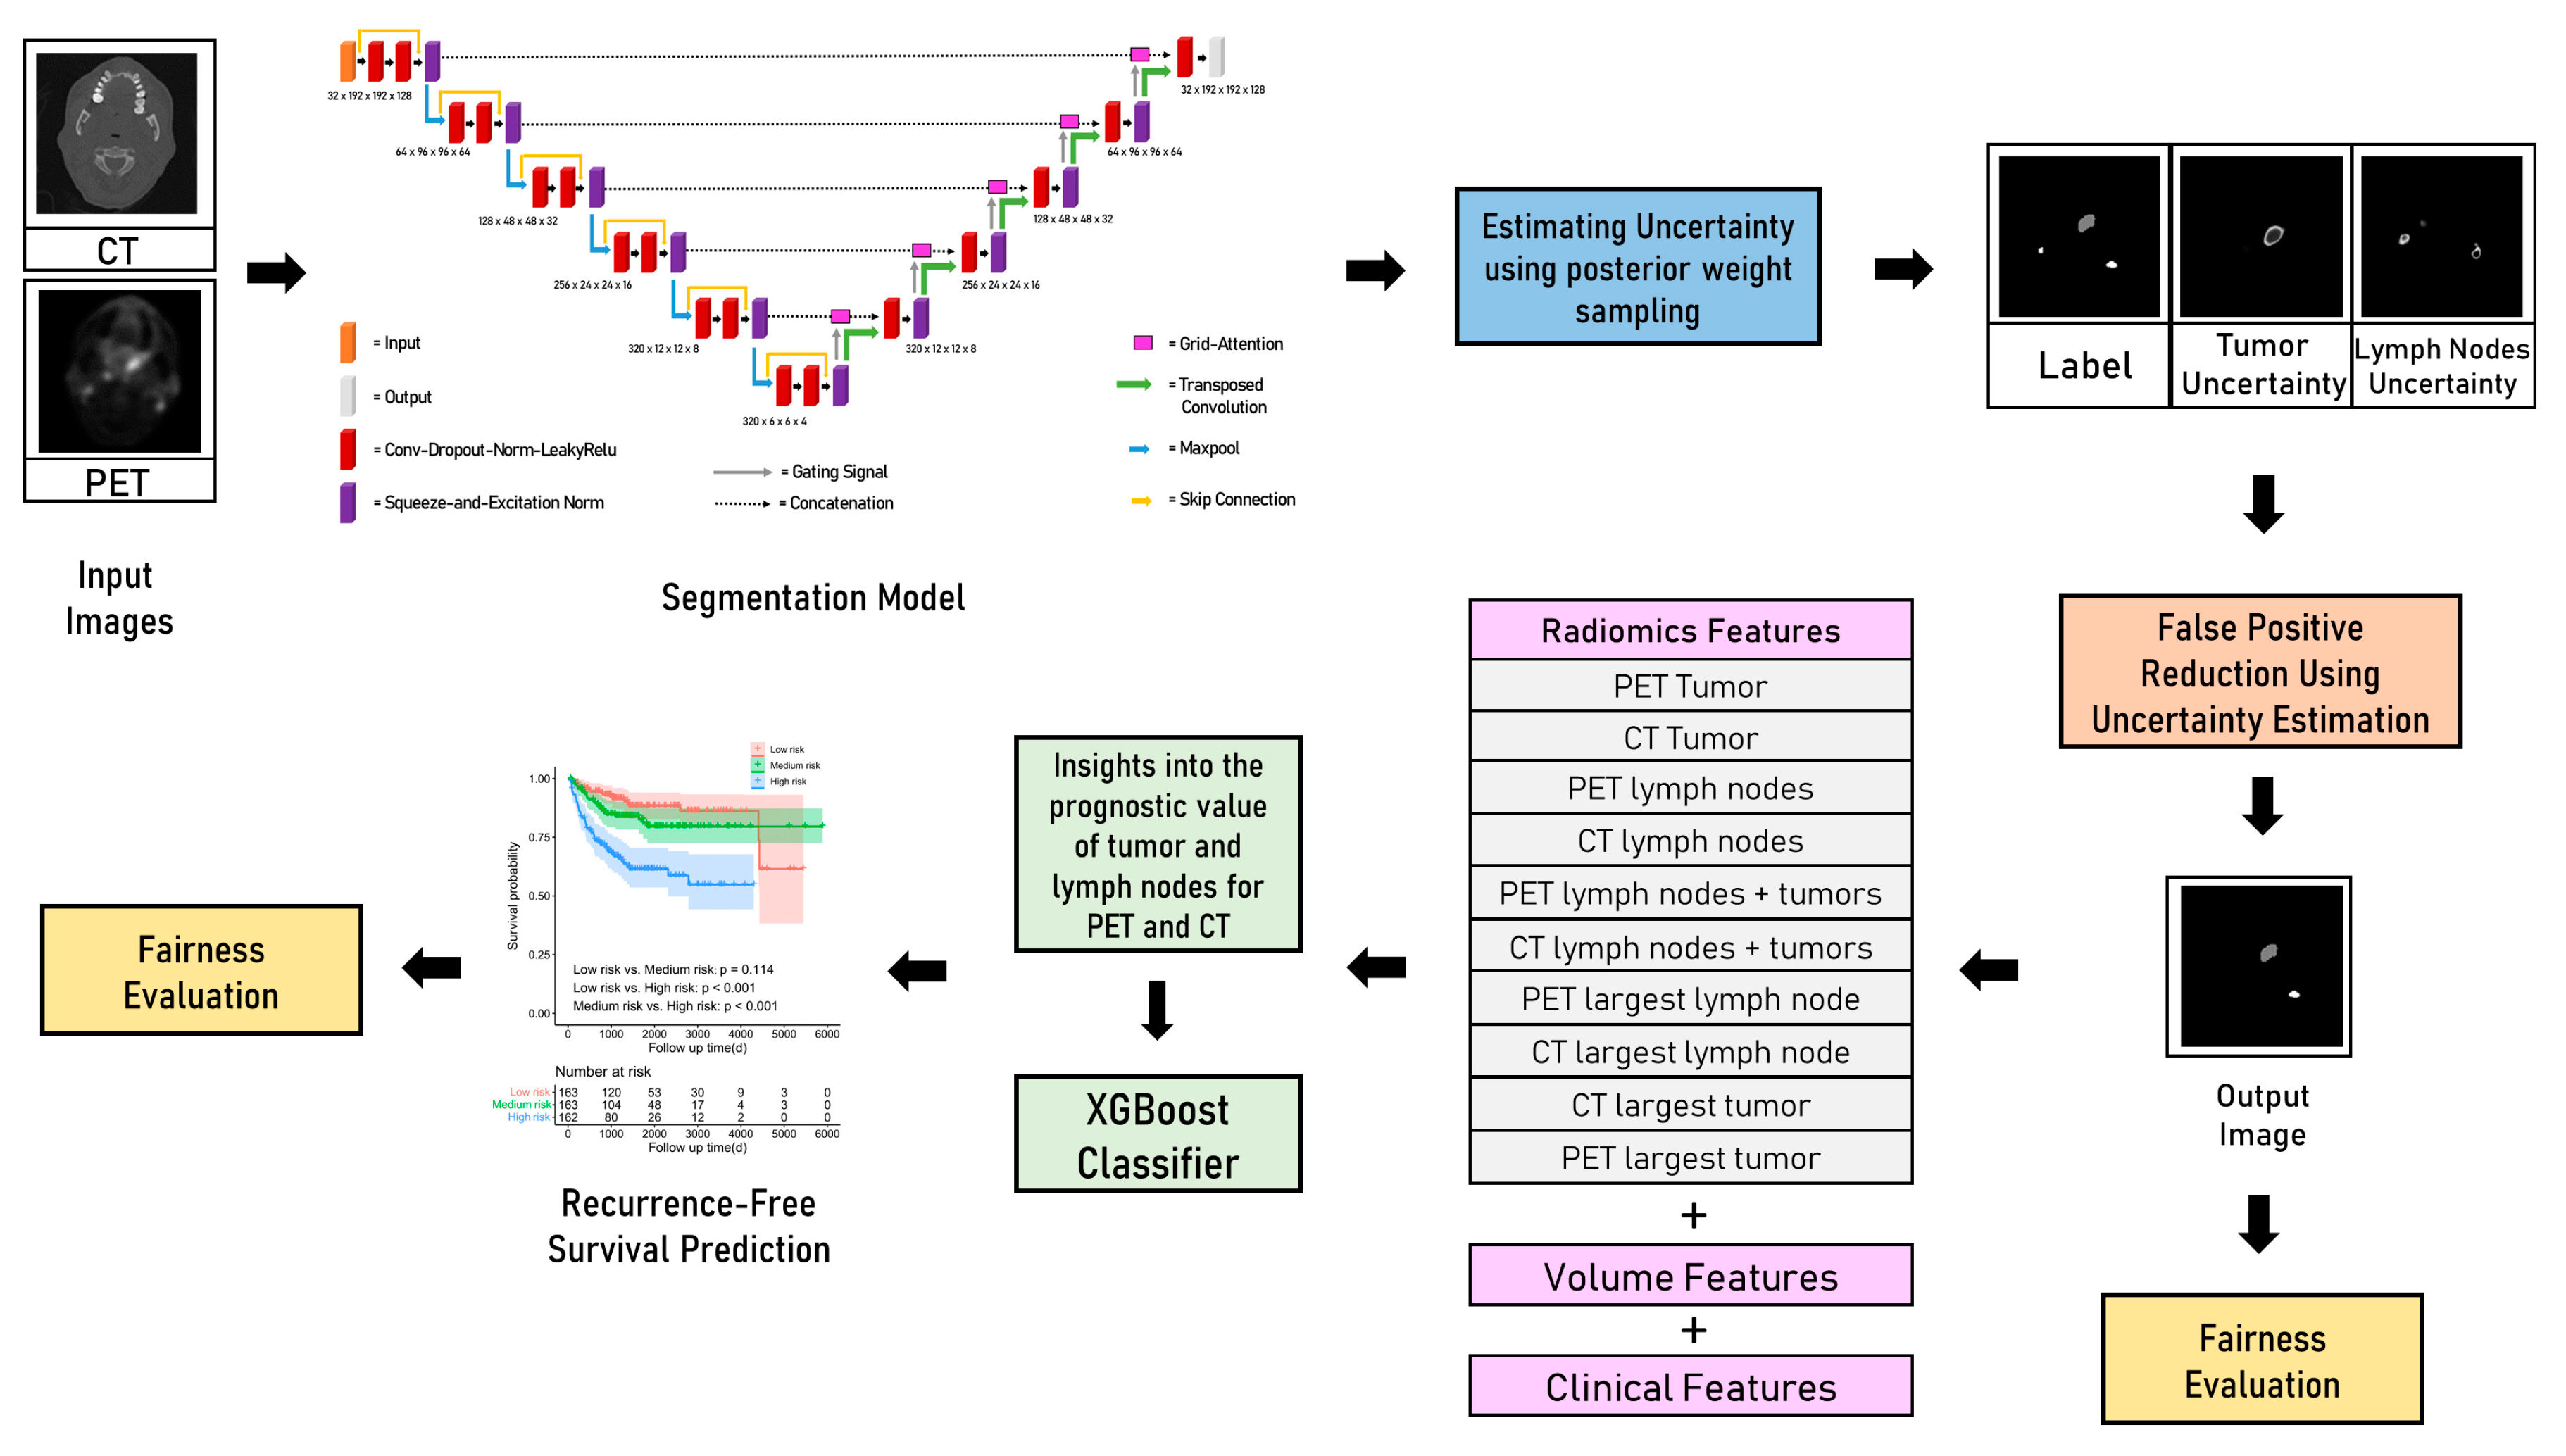
2.2. Segmentation
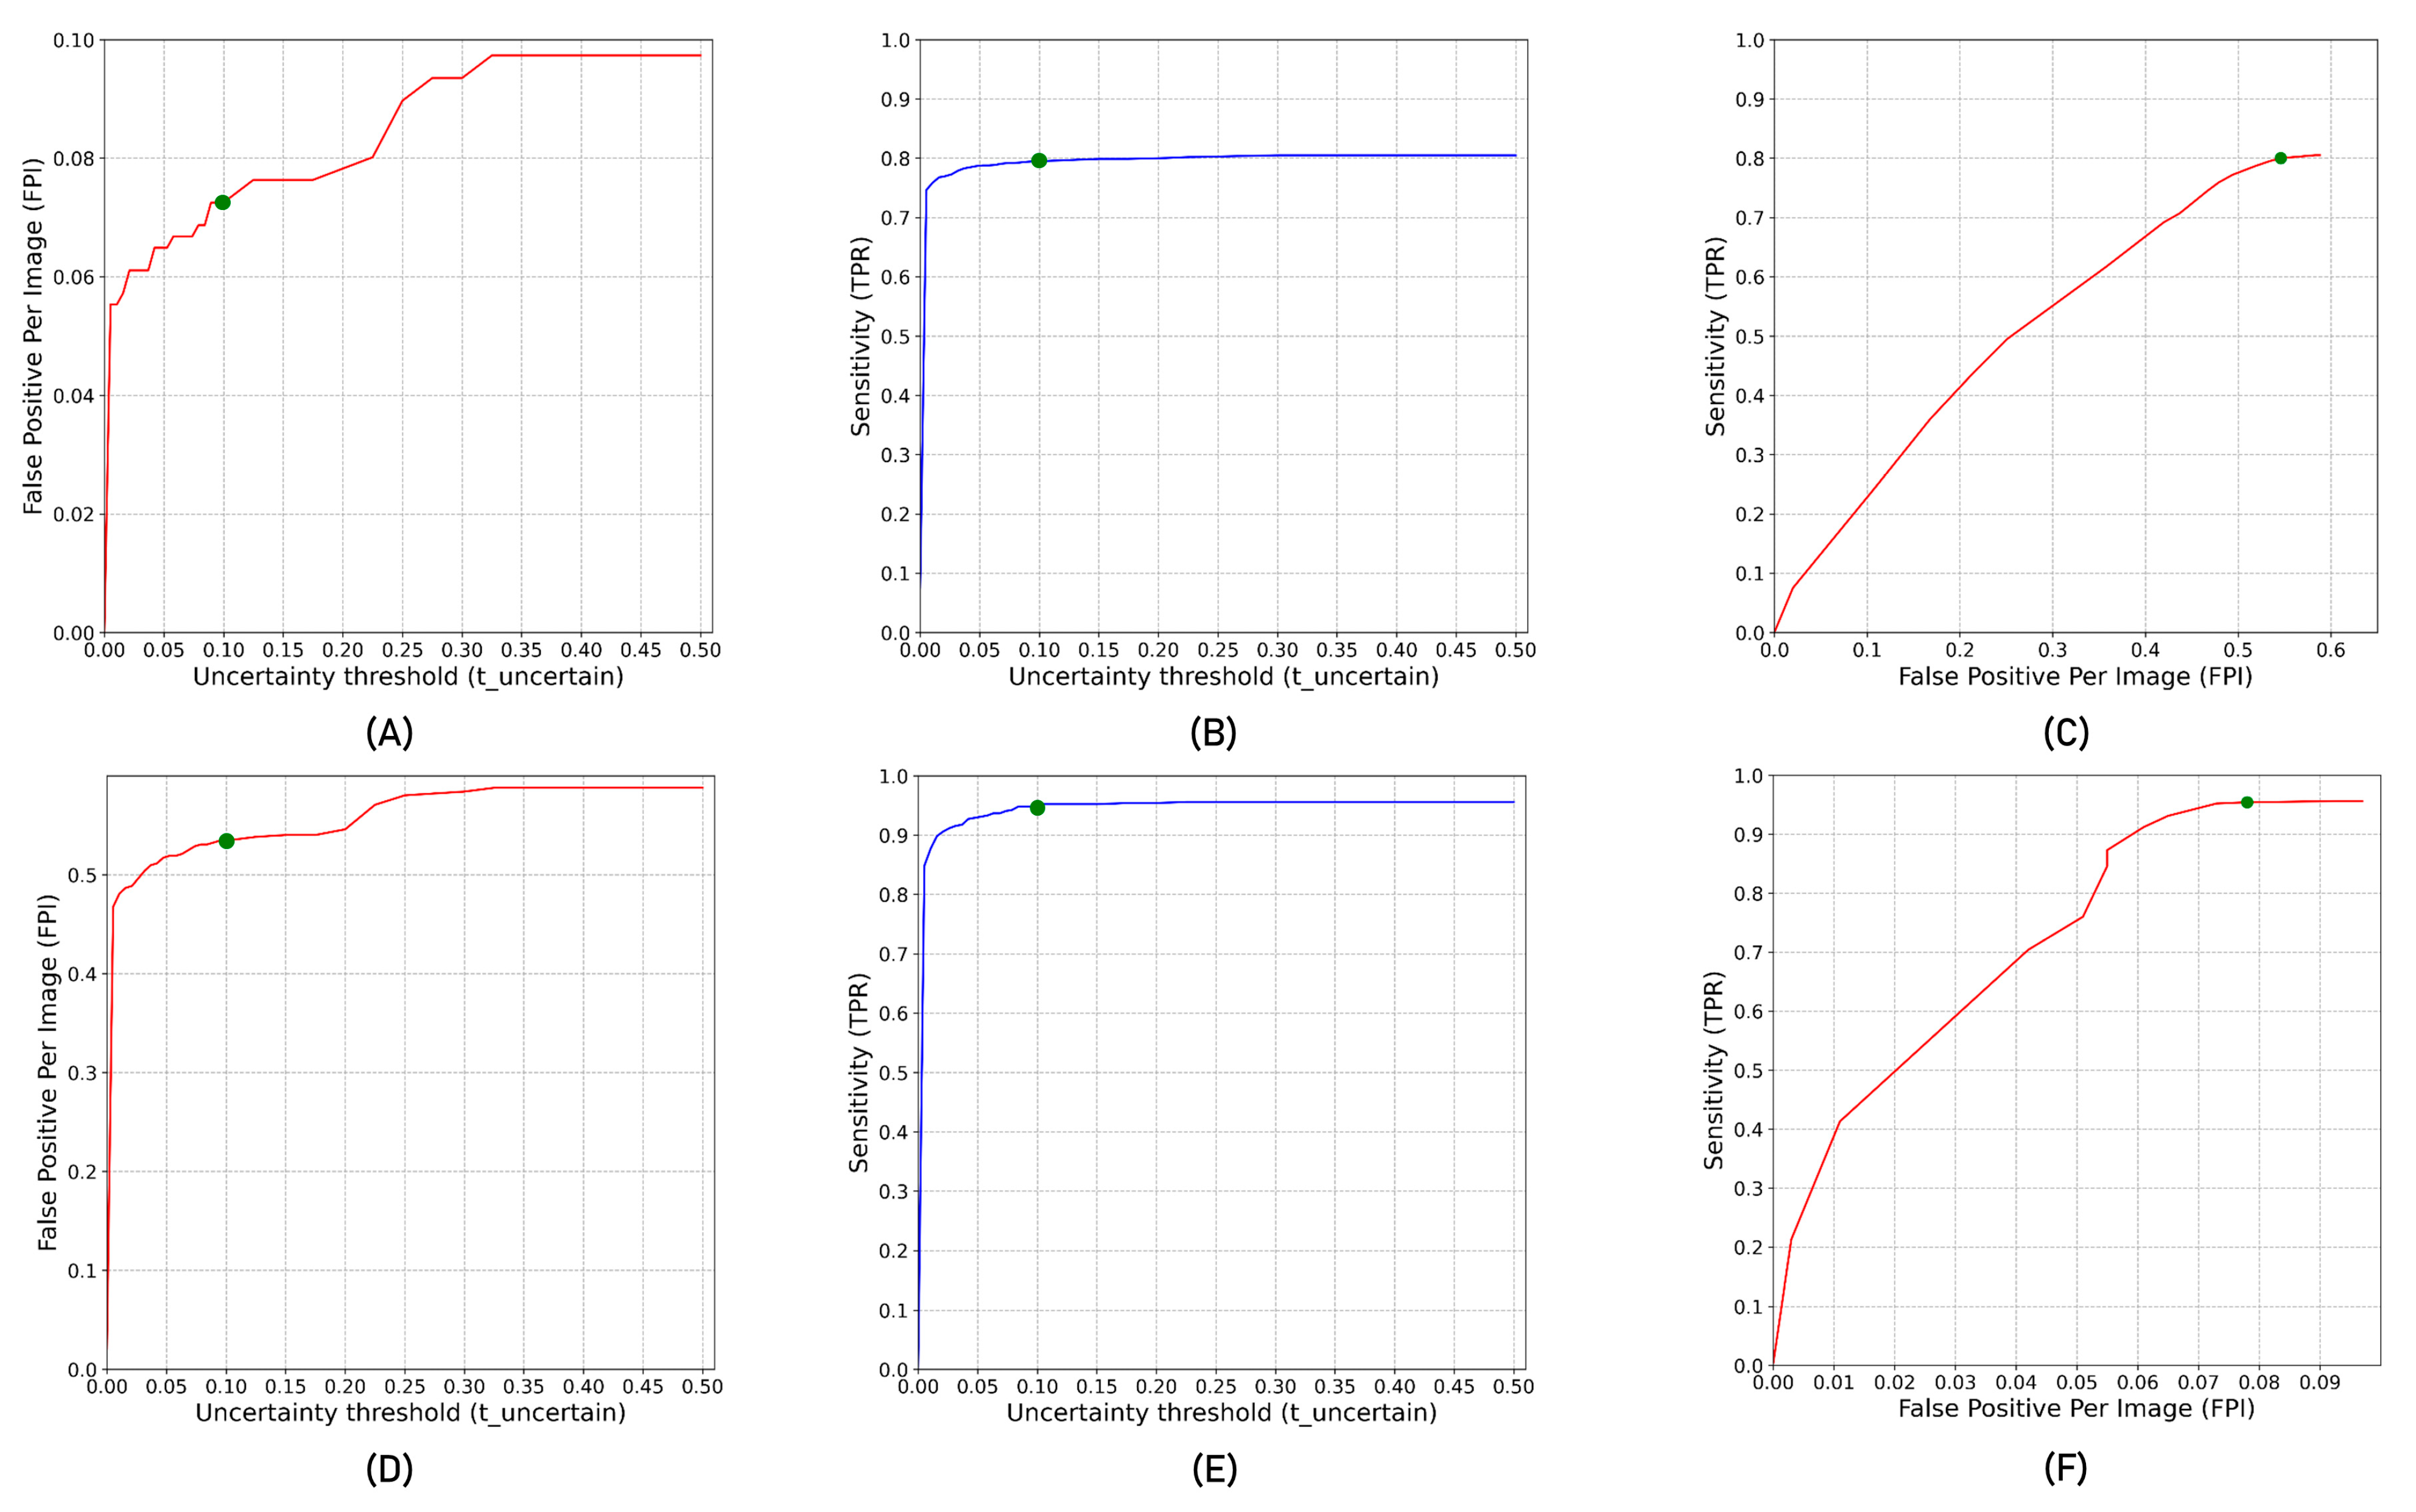
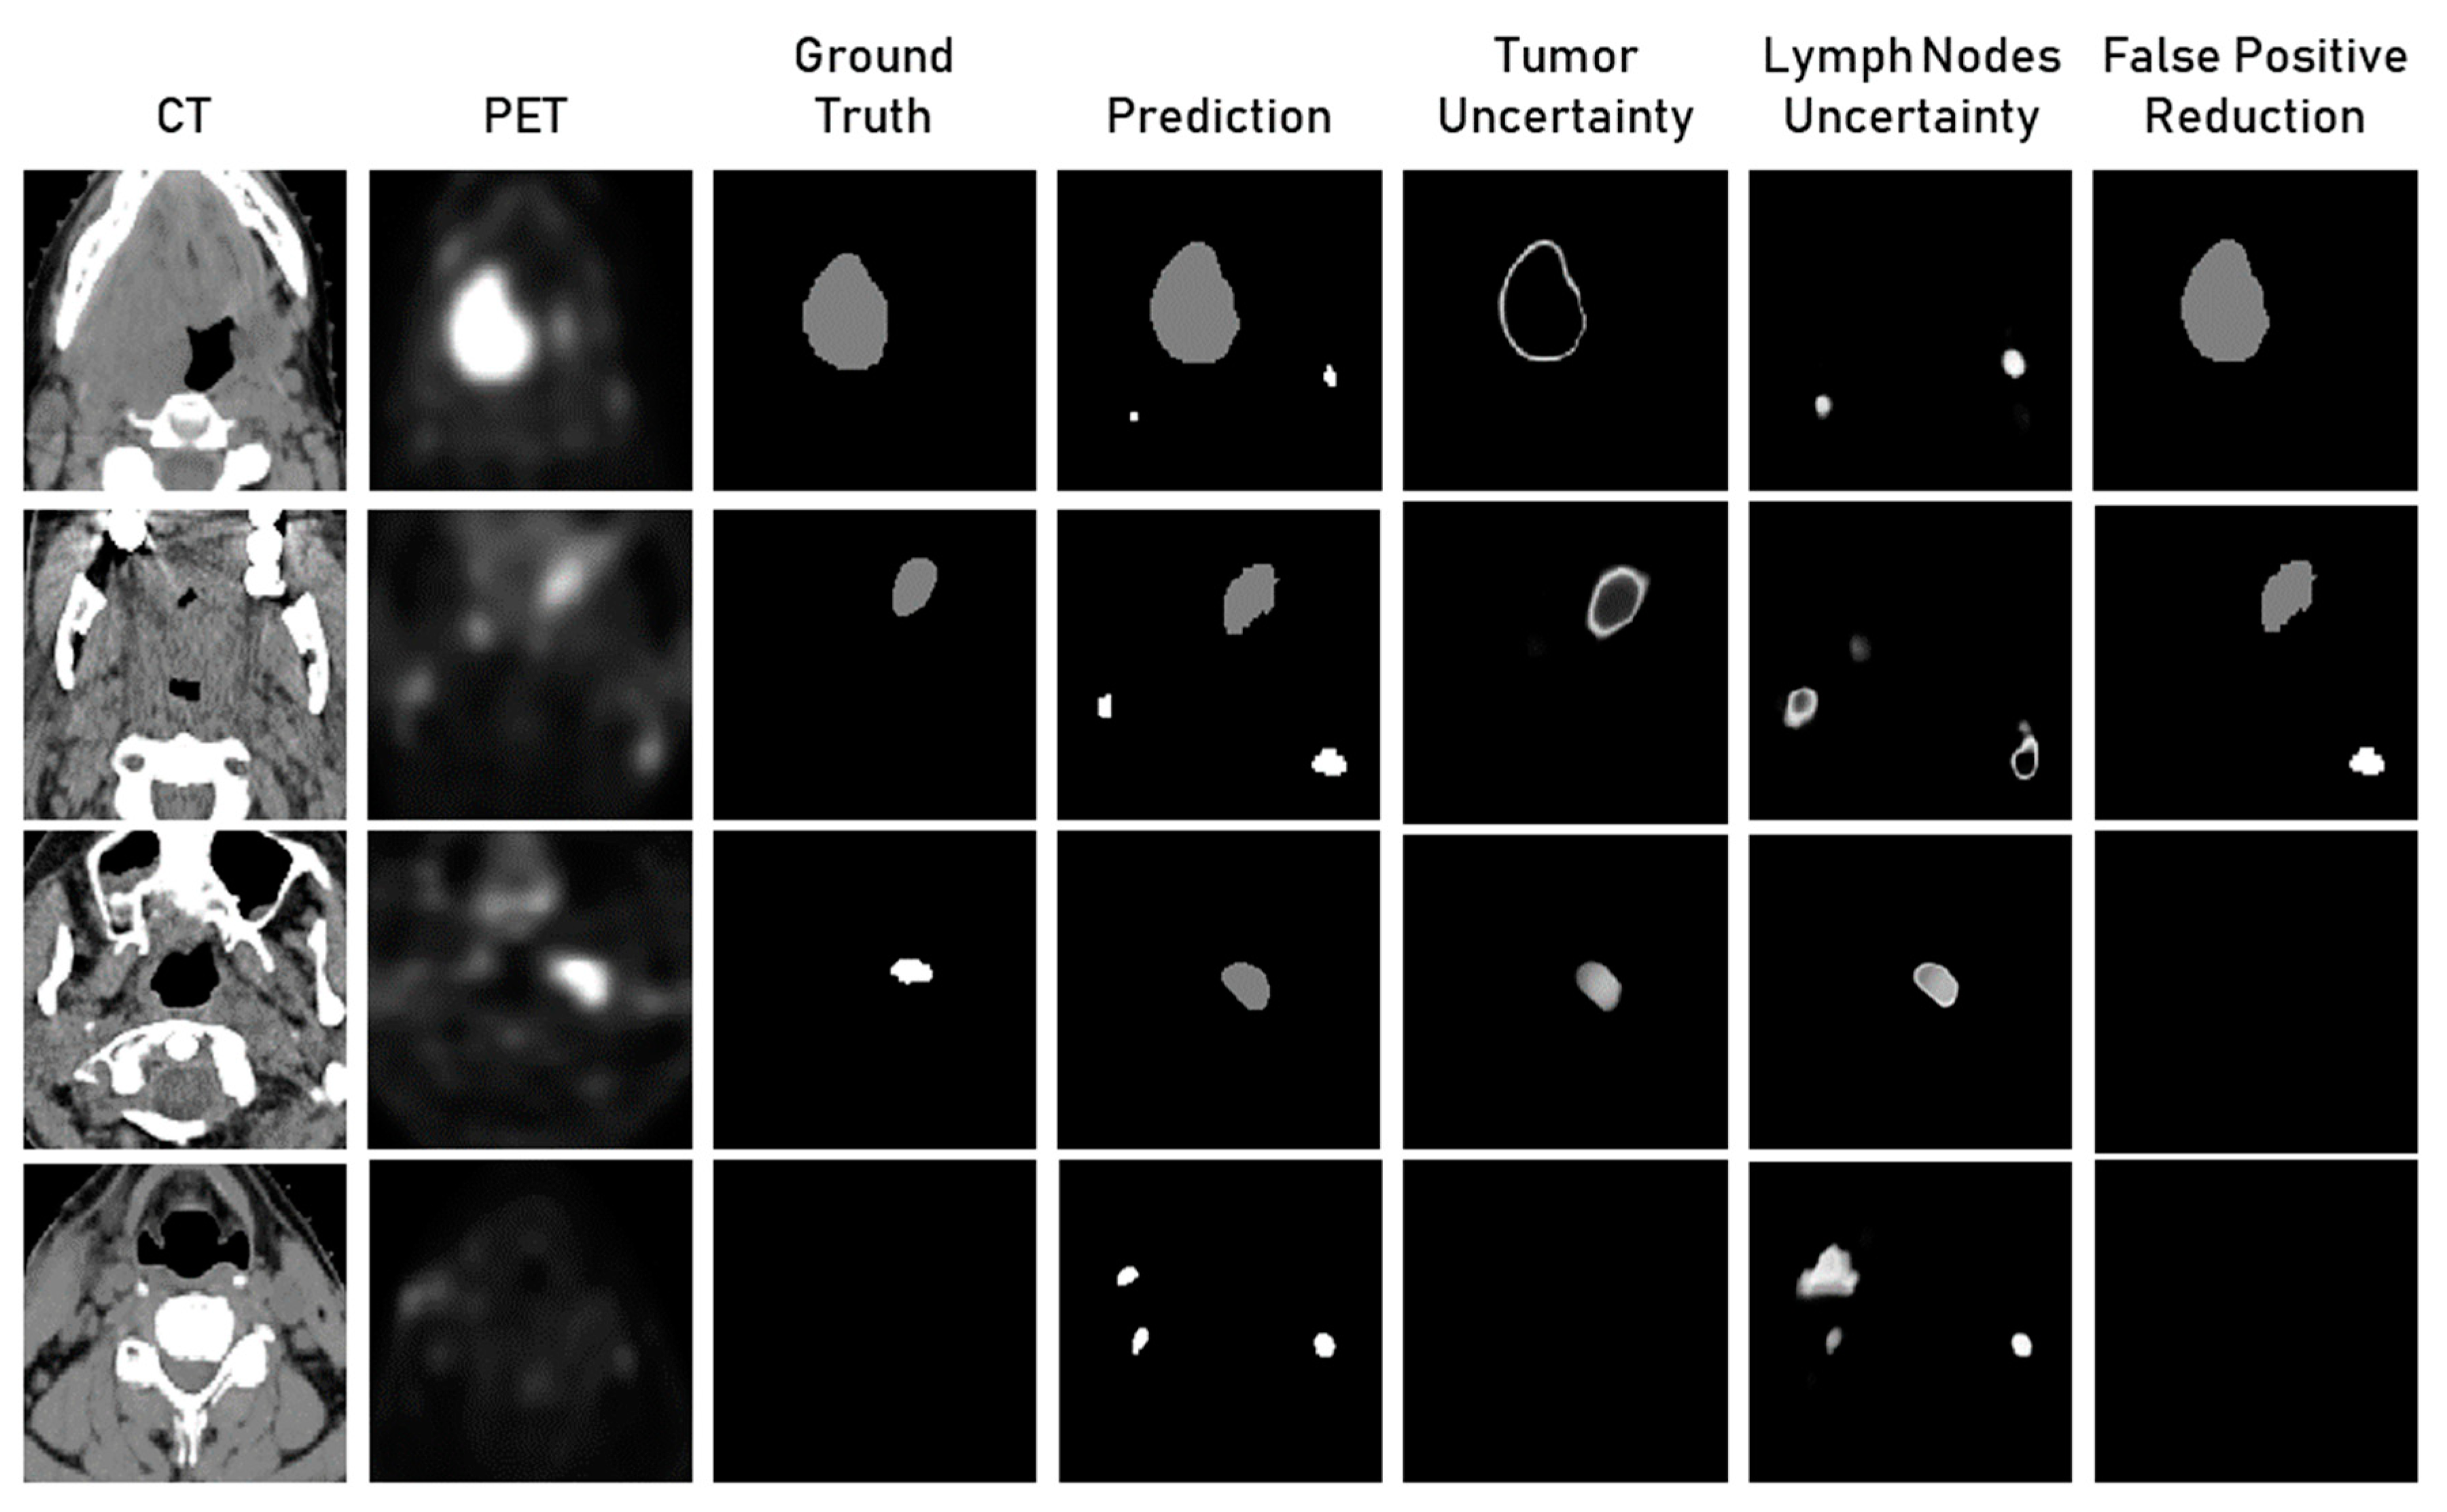
2.3. Uncertainty Estimation
2.4. Handcrafted Radiomics
2.5. Fairness
2.6. Evaluation Metrics
2.6.1. Dice Coefficient
2.6.2. Aggregated Dice
2.6.3. Sensitivity
2.6.4. C-Index
2.7. Statistical Tests
3. Results
3.1. Patient Characteristics
3.2. Segmentation
3.3. Uncertainty Estimation
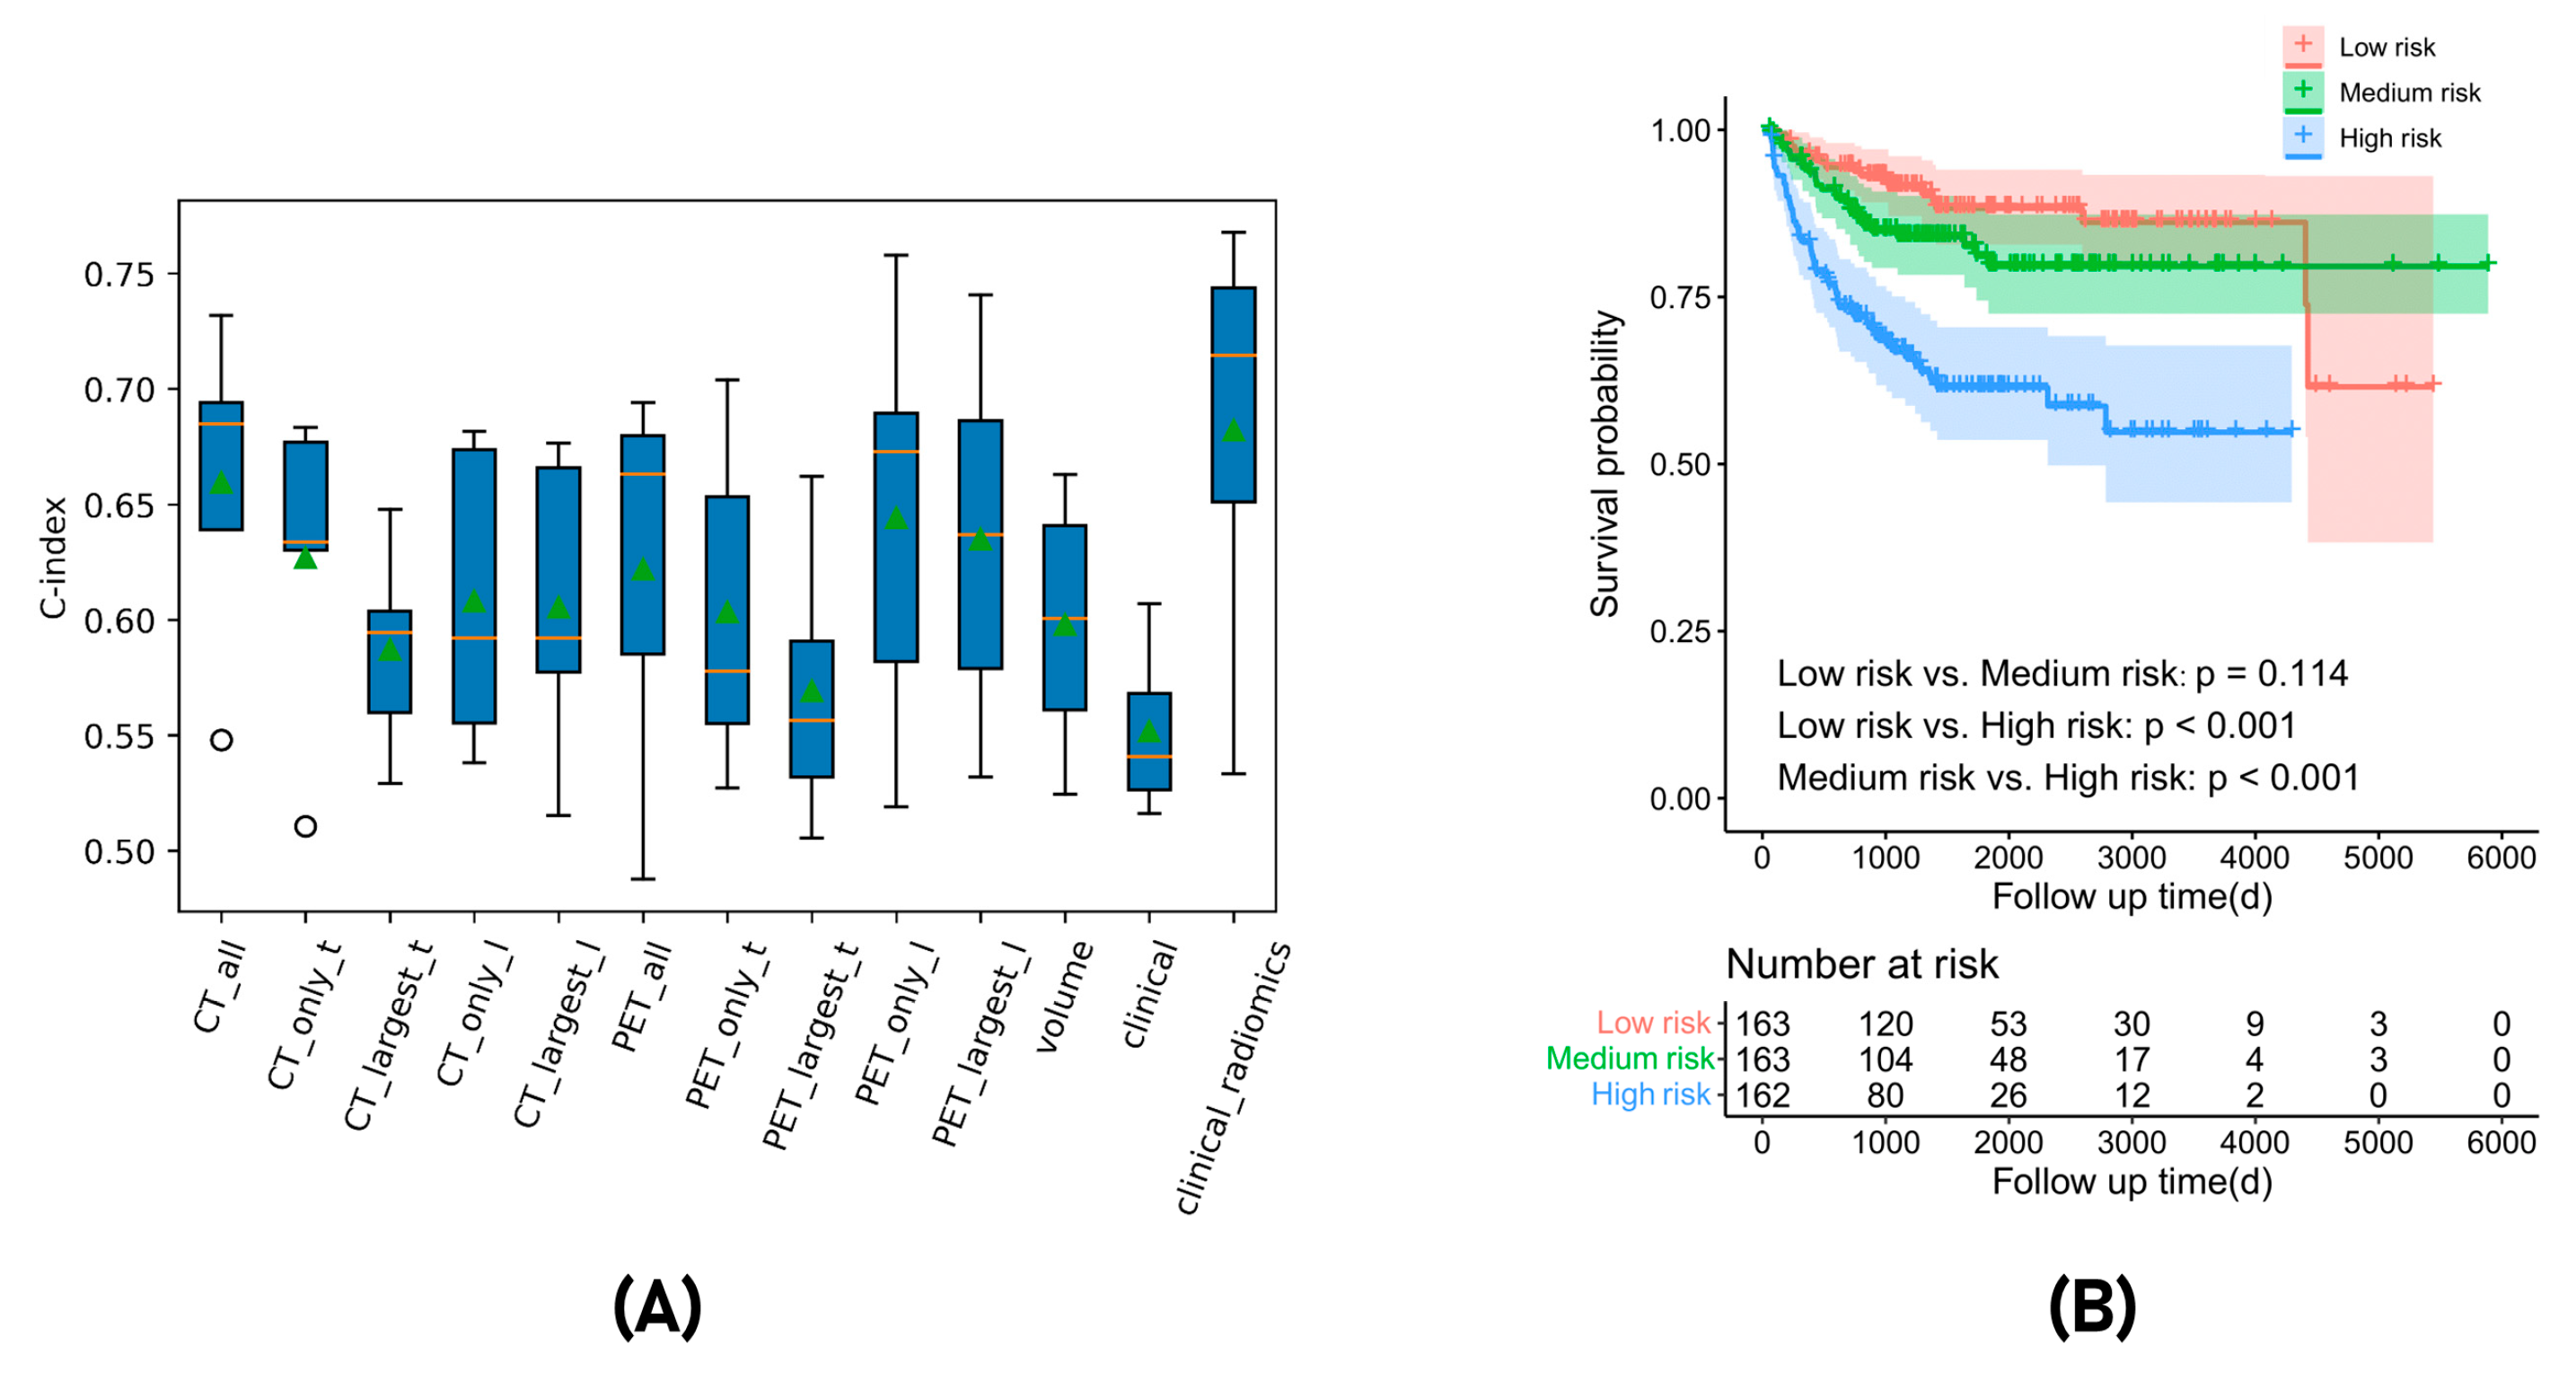
3.4. Recurrence-Free Survival Prediction
4. Discussion
5. Conclusions
Author Contributions
Funding
Institutional Review Board Statement
Informed Consent Statement
Data Availability Statement
Conflicts of Interest
Appendix A

| Radiomics Feature | Description |
|---|---|
| Gray level co-occurrence matrix (GLCM) | Gray level co-occurrence matrix features describe the second order joint probability function of the voxel intensities. These features include measures such as contrast, correlation, energy, and homogeneity. In this study, 24 GLCM features were extracted using PyRadiomics. |
| Gray level difference matrix (GLDM) | Gray level difference matrix features describe the distribution of gray level differences within the ROI. These features include measures such as coarseness, contrast, and busyness. In this study, 14 GLDM features were extracted using PyRadiomics. |
| Gray level run length matrix (GLRLM) | Gray level run length matrix features describe the length of runs of consecutive voxels with the same gray level. These features include measures such as short-run emphasis, long-run emphasis, and run percentage. In this study, 16 GLRLM features were extracted using PyRadiomics. |
| Gray level size zone matrix (GLSZM) | Gray level size zone matrix features describe the size of zones of consecutive voxels with the same gray level. These features include measures such as zone size, zone percentage, and zone entropy. In this study, 16 GLSZM features were extracted using PyRadiomics. |
| Neighbouring gray tone difference matrix (NGTDM) | Neighbouring gray tone difference matrix features describe the distribution of voxel-level texture primitive patterns. These features include measures such as coarseness and contrast. In this study, 5 NGTDM features were extracted using PyRadiomics. |
| First order statistics | First order statistics describe the distribution of voxel intensities within the ROI. These features include measures such as mean, median, skewness, and kurtosis. In this study, 18 first order features were extracted using PyRadiomics. |
| Shape-based (3D) | Shape features describe the shape and size of the ROI. These features include measures such as volume, surface area, sphericity, and compactness. In this study, 14 shape features were extracted using PyRadiomics. |
| Class | Radiomics Feature | Definition |
|---|---|---|
| First order: First order statistics describe the distribution of voxel intensities within the image region defined by the mask through commonly used and basic metrics. | Original_firstorder_Range | The range of first order value in the ROI |
| Original_firstorder_10Percentile | The 10th percentile of first order value. | |
| Original_firstorder_ TotalEnergy | Total Energy is the value of the Energy feature scaled by the volume of the voxel in cubic mm | |
| Original_firstorder_ InterquartileRange | The different value 25th and 75th percentile of the first order value. | |
| GLSZM: A gray level size Zone (GLSZM) quantifies gray level zones in an image | original_glszm_ grayLevelNonUniformity | GrayLevelNonUniformity measures the variability of gray-level intensity values in the GLSZM array. |
| Original_glszm_ LargeAreaLowGrayLevelEmphasis | It measures the proportion in the image of the joint distribution of larger size zones with lower gray level values | |
| Original_glszm_ SizeZoneNonUniformity | It measures the variability of size zone volumes throughout the GLSZM array, with a lower value indicating more homogeneity among zone size volumes in the GLSZM array. | |
| Original_glszm_ ZoneEntropy | It measures the uncertainty/randomness in the distribution of zone sizes and GLSZM levels | |
| GLRLM: A gray level run length matrix (GLRLM) quantifies gray level runs, which are defined as the length in number of pixels, of consecutive pixels that have the same gray level value. | Original_glrlm_ GrayLevelNonUniformity | It measures the similarity of gray level intensity values in the GLRLM array. |
| Original_glrlm_ RunLengthNonUniformity | It measures the similarity of run lengths throughout the GLRLM array, with a lower value indicating more homogeneity among run lengths in the GLRLM array | |
| GLDM: A gray level dependence matrix (GLDM) quantifies gray level dependencies in an image | Original_gldm_ SmallDependenceEmphasis | A measure of the distribution of large dependencies, with a greater value indicative of larger dependence and more homogeneous textures. |
References
- Gormley, M.; Creaney, G.; Schache, A.; Ingarfield, K.; Conway, D.I. Reviewing the Epidemiology of Head and Neck Cancer: Definitions, Trends and Risk Factors. Br. Dent. J. 2022, 233, 780–786. [Google Scholar] [CrossRef] [PubMed]
- Warnakulasuriya, S. Global Epidemiology of Oral and Oropharyngeal Cancer. Oral Oncol. 2009, 45, 309–316. [Google Scholar] [CrossRef] [PubMed]
- Marcus, C.; Sheikhbahaei, S.; Shivamurthy, V.K.N.; Avey, G.; Subramaniam, R.M. PET Imaging for Head and Neck Cancers. Radiol. Clin. N. Am. 2021, 59, 773–788. [Google Scholar] [CrossRef] [PubMed]
- Rygalski, C.J.; Zhao, S.; Eskander, A.; Zhan, K.Y.; Mroz, E.A.; Brock, G.; Silverman, D.A.; Blakaj, D.; Bonomi, M.R.; Carrau, R.L.; et al. Time to Surgery and Survival in Head and Neck Cancer. Ann. Surg. Oncol. 2021, 28, 877–885. [Google Scholar] [CrossRef] [PubMed]
- Mehanna, H.; Wong, W.-L.; McConkey, C.C.; Rahman, J.K.; Robinson, M.; Hartley, A.G.J.; Nutting, C.; Powell, N.; Al-Booz, H.; Robinson, M.; et al. PET-CT Surveillance versus Neck Dissection in Advanced Head and Neck Cancer. N. Engl. J. Med. 2016, 374, 1444–1454. [Google Scholar] [CrossRef]
- Escott, E.J. Role of Positron Emission Tomography/Computed Tomography (PET/CT) in Head and Neck Cancer. Radiol. Clin. N. Am. 2013, 51, 881–893. [Google Scholar] [CrossRef]
- Lonneux, M.; Hamoir, M.; Reychler, H.; Maingon, P.; Duvillard, C.; Calais, G.; Bridji, B.; Digue, L.; Toubeau, M.; Grégoire, V. Positron Emission Tomography with [18F]fluorodeoxyglucose Improves Staging and Patient Management in Patients with Head and Neck Squamous Cell Carcinoma: A Multicenter Prospective Study. J. Clin. Oncol. 2010, 28, 1190–1195. [Google Scholar] [CrossRef]
- van der Veen, J.; Gulyban, A.; Nuyts, S. Interobserver Variability in Delineation of Target Volumes in Head and Neck Cancer. Radiother. Oncol. 2019, 137, 9–15. [Google Scholar] [CrossRef]
- Du, G.; Cao, X.; Liang, J.; Chen, X.; Zhan, Y. Medical Image Segmentation Based on U-Net: A Review. J. Imaging Sci. Technol. 2020, 64, 020508-1–020508-12. [Google Scholar] [CrossRef]
- Siddique, N.; Paheding, S.; Elkin, C.P.; Devabhaktuni, V. U-Net and Its Variants for Medical Image Segmentation: A Review of Theory and Applications. IEEE Access 2021, 9, 82031–82057. [Google Scholar] [CrossRef]
- Çiçek, Ö.; Abdulkadir, A.; Lienkamp, S.S.; Brox, T.; Ronneberger, O. 3D U-Net: Learning Dense Volumetric Segmentation from Sparse Annotation. In Proceedings of the Medical Image Computing and Computer-Assisted Intervention—MICCAI 2016, Athens, Greece, 17–21 October 2016; pp. 424–432. [Google Scholar]
- Iantsen, A.; Visvikis, D.; Hatt, M. Squeeze-and-Excitation Normalization for Automated Delineation of Head and Neck Primary Tumors in Combined PET and CT Images. In Head and Neck Tumor Segmentation; Springer: Berlin/Heidelberg, Germany, 2021; pp. 37–43. [Google Scholar]
- Isensee, F.; Jaeger, P.F.; Kohl, S.A.A.; Petersen, J.; Maier-Hein, K.H. nnU-Net: A Self-Configuring Method for Deep Learning-Based Biomedical Image Segmentation. Nat. Methods 2021, 18, 203–211. [Google Scholar] [CrossRef] [PubMed]
- Jungo, A.; Reyes, M. Assessing Reliability and Challenges of Uncertainty Estimations for Medical Image Segmentation. In Lecture Notes in Computer Science; Springer: Berlin/Heidelberg, Germany, 2019; pp. 48–56. [Google Scholar]
- Zhao, Y.; Yang, C.; Schweidtmann, A.; Tao, Q. Efficient Bayesian Uncertainty Estimation for nnU-Net. In Proceedings of the Medical Image Computing and Computer Assisted Intervention—MICCAI 2022, Singapore, 18–22 September 2022; Springer: Cham, Switzerland, 2022; pp. 535–544. [Google Scholar]
- Czolbe, S.; Arnavaz, K.; Krause, O.; Feragen, A. Is Segmentation Uncertainty Useful. In Lecture Notes in Computer Science; Springer: Berlin/Heidelberg, Germany, 2021; pp. 715–726. [Google Scholar]
- Lambin, P.; Leijenaar, R.T.H.; Deist, T.M.; Peerlings, J.; de Jong, E.E.C.; van Timmeren, J.; Sanduleanu, S.; Larue, R.T.H.M.; Even, A.J.G.; Jochems, A.; et al. Radiomics: The Bridge between Medical Imaging and Personalized Medicine. Nat. Rev. Clin. Oncol. 2017, 14, 749–762. [Google Scholar] [CrossRef] [PubMed] [Green Version]
- Refaee, T.; Salahuddin, Z.; Frix, A.-N.; Yan, C.; Wu, G.; Woodruff, H.C.; Gietema, H.; Meunier, P.; Louis, R.; Guiot, J.; et al. Diagnosis of Idiopathic Pulmonary Fibrosis in High-Resolution Computed Tomography Scans Using a Combination of Handcrafted Radiomics and Deep Learning. Front. Med. 2022, 9, 915243. [Google Scholar] [CrossRef]
- Aerts, H.J.W.L.; Velazquez, E.R.; Leijenaar, R.T.H.; Parmar, C.; Grossmann, P.; Carvalho, S.; Bussink, J.; Monshouwer, R.; Haibe-Kains, B.; Rietveld, D.; et al. Decoding Tumour Phenotype by Noninvasive Imaging Using a Quantitative Radiomics Approach. Nat. Commun. 2014, 5, 4006. [Google Scholar] [CrossRef] [PubMed] [Green Version]
- Kanchan, G.; Chen, Q.; Feng, X. Head and neck tumor segmentation with deeply-supervised 3D UNet and progression-free survival prediction with linear model. In Head and Neck Tumor Segmentation and Outcome Prediction: Second Challenge, HECKTOR 2021, Held in Conjunction with MICCAI 2021, Strasbourg, France, 27 September 2021; Springer International Publishing: Cham, Switzerland, 2022; pp. 141–149. [Google Scholar]
- Martinez-Larraz, A.; Asenjo, J.M.; Rodríguez, B.Á. PET/CT head and neck tumor segmentation and progression free survival prediction using deep and machine learning techniques. In Head and Neck Tumor Segmentation and Outcome Prediction: Second Challenge, HECKTOR 2021, Held in Conjunction with MICCAI 2021, Strasbourg, France, 27 September 2021; Springer International Publishing: Cham, Switzerland, 2022; pp. 168–178. [Google Scholar]
- Fatan, M.; Hosseinzadeh, M.; Askari, D.; Sheikhi, H.; Rezaeijo, S.M.; Salmanpour, M.R. Fusion-based head and neck tumor segmentation and survival prediction using robust deep learning techniques and advanced hybrid machine learning systems. In Head and Neck Tumor Segmentation and Outcome Prediction: Second Challenge, HECKTOR 2021, Held in Conjunction with MICCAI 2021, Strasbourg, France, 27 September 2021; Springer International Publishing: Cham, Switzerland, 2022; pp. 211–223. [Google Scholar]
- Keek, S.A.; Wesseling, F.W.R.; Woodruff, H.C.; van Timmeren, J.E.; Nauta, I.H.; Hoffmann, T.K.; Cavalieri, S.; Calareso, G.; Primakov, S.; Leijenaar, R.T.H.; et al. A Prospectively Validated Prognostic Model for Patients with Locally Advanced Squamous Cell Carcinoma of the Head and Neck Based on Radiomics of Computed Tomography Images. Cancers 2021, 13, 3271. [Google Scholar] [CrossRef]
- Mukherjee, P.; Cintra, M.; Huang, C.; Zhou, M.; Zhu, S.; Colevas, A.D.; Fischbein, N.; Gevaert, O. CT-Based Radiomic Signatures for Predicting Histopathologic Features in Head and Neck Squamous Cell Carcinoma. Radiol Imaging Cancer 2020, 2, e190039. [Google Scholar] [CrossRef]
- Xie, C.; Yang, P.; Zhang, X.; Xu, L.; Wang, X.; Li, X.; Zhang, L.; Xie, R.; Yang, L.; Jing, Z.; et al. Sub-Region Based Radiomics Analysis for Survival Prediction in Oesophageal Tumours Treated by Definitive Concurrent Chemoradiotherapy. EBioMedicine 2019, 44, 289–297. [Google Scholar] [CrossRef] [Green Version]
- Bogowicz, M.; Riesterer, O.; Stark, L.S.; Studer, G.; Unkelbach, J.; Guckenberger, M.; Tanadini-Lang, S. Comparison of PET and CT Radiomics for Prediction of Local Tumor Control in Head and Neck Squamous Cell Carcinoma. Acta Oncol. 2017, 56, 1531–1536. [Google Scholar] [CrossRef] [Green Version]
- Lv, W.; Feng, H.; Du, D.; Ma, J.; Lu, L. Complementary Value of Intra- and Peri-Tumoral PET/CT Radiomics for Outcome Prediction in Head and Neck Cancer. IEEE Access 2021, 9, 81818–81827. [Google Scholar] [CrossRef]
- McCartney, G.; Popham, F.; McMaster, R.; Cumbers, A. Defining Health and Health Inequalities. Public Health 2019, 172, 22–30. [Google Scholar] [CrossRef]
- Paulus, J.K.; Kent, D.M. Predictably Unequal: Understanding and Addressing Concerns That Algorithmic Clinical Prediction May Increase Health Disparities. NPJ Digit Med. 2020, 3, 99. [Google Scholar] [CrossRef]
- Lekadir, K.; Osuala, R.; Gallin, C.; Lazrak, N.; Kushibar, K.; Tsakou, G.; Aussó, S.; Alberich, L.C.; Marias, K.; Tsiknakis, M.; et al. FUTURE-AI: Guiding Principles and Consensus Recommendations for Trustworthy Artificial Intelligence in Medical Imaging. arXiv 2021, arXiv:2109.09658. [Google Scholar]
- Seyyed-Kalantari, L.; Liu, G.; McDermott, M.; Chen, I.Y.; Ghassemi, M. CheXclusion: Fairness Gaps in Deep Chest X-Ray Classifiers. Pac. Symp. Biocomput. 2021, 26, 232–243. [Google Scholar] [PubMed]
- Puyol-Antón, E.; Ruijsink, B.; Piechnik, S.K.; Neubauer, S.; Petersen, S.E.; Razavi, R.; King, A.P. Fairness in Cardiac MR Image Analysis: An Investigation of Bias Due to Data Imbalance in Deep Learning Based Segmentation. In Proceedings of the Medical Image Computing and Computer Assisted Intervention—MICCAI 2021, Strasbourg, France, 27 September–1 October 2021; pp. 413–423. [Google Scholar]
- Andrearczyk, V.; Oreiller, V.; Abobakr, M.; Akhavanallaf, A.; Balermpas, P.; Boughdad, S.; Capriotti, L.; Castelli, J.; Le Rest, C.C.; Decazes, P.; et al. Overview of the HECKTOR Challenge at MICCAI 2022: Automatic Head and Neck Tumor Segmentation and Outcome Prediction in PET/CT. In Head and Neck Tumor Segmentation and Outcome Prediction; HECKTOR 2022. Lecture Notes in Computer Science, Vol. 13626; Andrearczyk, V., Oreiller, V., Hatt, M., Depeursinge, A., Eds.; Springer: Cham, Switzerland, 2022. [Google Scholar]
- Oreiller, V.; Andrearczyk, V.; Jreige, M.; Boughdad, S.; Elhalawani, H.; Castelli, J.; Vallières, M.; Zhu, S.; Xie, J.; Peng, Y.; et al. Head and Neck Tumor Segmentation in PET/CT: The HECKTOR Challenge. Med. Image Anal. 2022, 77, 102336. [Google Scholar] [CrossRef] [PubMed]
- Isensee, F.; Jäger, P.F.; Full, P.M.; Vollmuth, P.; Maier-Hein, K.H. nnU-Net for Brain Tumor Segmentation. In Proceedings of the Brainlesion: Glioma, Multiple Sclerosis, Stroke and Traumatic Brain Injuries; Springer International Publishing: Cham, Switzerland, 2021; pp. 118–132. [Google Scholar]
- He, K.; Zhang, X.; Ren, S.; Sun, J. Identity Mappings in Deep Residual Networks. arXiv 2016, arXiv:1603.05027. [Google Scholar]
- Hu, J.; Shen, L.; Albanie, S.; Sun, G.; Wu, E. Squeeze-and-Excitation Networks. IEEE Trans. Pattern Anal. Mach. Intell. 2020, 42, 2011–2023. [Google Scholar] [CrossRef] [Green Version]
- Schlemper, J.; Oktay, O.; Schaap, M.; Heinrich, M.; Kainz, B.; Glocker, B.; Rueckert, D. Attention Gated Networks: Learning to Leverage Salient Regions in Medical Images. Med. Image Anal. 2019, 53, 197–207. [Google Scholar] [CrossRef]
- Sudre, C.H.; Li, W.; Vercauteren, T.; Ourselin, S.; Jorge Cardoso, M. Generalised Dice Overlap as a Deep Learning Loss Function for Highly Unbalanced Segmentations. In Deep Learn Med Image Anal Multimodal Learn Clin Decis Support; Springer: Berlin/Heidelberg, Germany, 2017; pp. 240–248. [Google Scholar]
- Tixier, F.; Le Rest, C.C.; Hatt, M.; Albarghach, N.; Pradier, O.; Metges, J.-P.; Corcos, L.; Visvikis, D. Intratumor Heterogeneity Characterized by Textural Features on Baseline 18F-FDG PET Images Predicts Response to Concomitant Radiochemotherapy in Esophageal Cancer. J. Nucl. Med. 2011, 52, 369–378. [Google Scholar] [CrossRef] [Green Version]
- Whang, S.E.; Lee, J.-G. Data Collection and Quality Challenges for Deep Learning. VLDB J. 2020, 13, 3429–3432. [Google Scholar] [CrossRef]
- Alves, N.; Schuurmans, M.; Litjens, G.; Bosma, J.S.; Hermans, J.; Huisman, H. Fully Automatic Deep Learning Framework for Pancreatic Ductal Adenocarcinoma Detection on Computed Tomography. Cancers 2022, 14, 376. [Google Scholar] [CrossRef]
- McKinney, S.M.; Sieniek, M.; Godbole, V.; Godwin, J.; Antropova, N.; Ashrafian, H.; Back, T.; Chesus, M.; Corrado, G.S.; Darzi, A.; et al. International Evaluation of an AI System for Breast Cancer Screening. Nature 2020, 577, 89–94. [Google Scholar] [CrossRef]
- Saha, A.; Hosseinzadeh, M.; Huisman, H. End-to-End Prostate Cancer Detection in bpMRI via 3D CNNs: Effects of Attention Mechanisms, Clinical Priori and Decoupled False Positive Reduction. Med. Image Anal. 2021, 73, 102155. [Google Scholar] [CrossRef] [PubMed]
- Meng, M.; Peng, Y.; Bi, L.; Kim, J. Multi-Task Deep Learning for Joint Tumor Segmentation and Outcome Prediction in Head and Neck Cancer. In Lecture Notes in Computer Science; Springer: Berlin/Heidelberg, Germany, 2022; pp. 160–167. [Google Scholar]
- Rebaud, L.; Escobar, T.; Khalid, F.; Girum, K.; Buvat, I. Simplicity Is All You Need: Out-of-the-Box nnUNet Followed by Binary-Weighted Radiomic Model for Segmentation and Outcome Prediction in Head and Neck PET/CT; Springer: Berlin/Heidelberg, Germany, 2022. [Google Scholar]
- Wang, K.; Li, Y.; Dohopolski, M.; Peng, T.; Lu, W.; Zhang, Y.; Wang, J. Recurrence-Free Survival Prediction under the Guidance of Automatic Gross Tumor Volume Segmentation for Head and Neck Cancers. arXiv 2022, arXiv:2209.11268. [Google Scholar]
- Carvalho, S.; Leijenaar, R.T.H.; Troost, E.G.C.; van Timmeren, J.E.; Oberije, C.; van Elmpt, W.; de Geus-Oei, L.-F.; Bussink, J.; Lambin, P. 18F-Fluorodeoxyglucose Positron-Emission Tomography (FDG-PET)-Radiomics of Metastatic Lymph Nodes and Primary Tumor in Non-Small Cell Lung Cancer (NSCLC)—A Prospective Externally Validated Study. PLoS ONE 2018, 13, e0192859. [Google Scholar] [CrossRef] [PubMed] [Green Version]
- Kim, J.H.; Choi, K.Y.; Lee, S.-H.; Lee, D.J.; Park, B.J.; Yoon, D.Y.; Rho, Y.-S. The Value of CT, MRI, and PET-CT in Detecting Retropharyngeal Lymph Node Metastasis of Head and Neck Squamous Cell Carcinoma. BMC Med. Imaging 2020, 20, 88. [Google Scholar] [CrossRef]
- Kinyanjui, N.M.; Odonga, T.; Cintas, C.; Codella, N.C.F.; Panda, R.; Sattigeri, P.; Varshney, K.R. Fairness of classifiers across skin tones in dermatology. In Medical Image Computing and Computer Assisted Intervention–MICCAI 2020: 23rd International Conference, Lima, Peru, 4–8 October 2020; Springer International Publishing: Cham, Switzerland, 2020; Part VI; pp. 320–329. [Google Scholar]
- Tahari, A.K.; Alluri, K.C.; Quon, H.; Koch, W.; Wahl, R.L.; Subramaniam, R.M. FDG PET/CT imaging of Oropharyngeal SCC: Characteristics of HPV positive and negative tumors. Clin. Nucl. Med. 2014, 39, 225. [Google Scholar] [CrossRef] [Green Version]
- Fujita, A.; Buch, K.; Li, B.; Kawashima, Y.; Qureshi, M.M.; Sakai, O. Difference between HPV-positive and HPV-negative non-oropharyngeal head and neck cancer: Texture analysis features on CT. J. Comput. Assist. Tomogr. 2016, 40, 43–47. [Google Scholar] [CrossRef]
- Economopoulou, P.; Kotsantis, I.; Psyrri, A. Special Issue about Head and Neck Cancers: HPV Positive Cancers. Int. J. Mol. Sci. 2020, 21, 3388. [Google Scholar] [CrossRef]


| Characteristic | Training Set (n = 524) | Test Set (n = 359) | p-Value |
|---|---|---|---|
| Gender (M/F) | 429/95 | 296/63 | 0.825 |
| Age (years) | 61.0 (54.0–67.0) | 59.0 (53.2–66.0) | 0.024 |
| Weight (kg) | 80.0 (67.8–92.1) | 81.0 (66.0–96.0) | 0.570 |
| Chemotherapy (Yes/No) | 457/67 | 311/48 | 0.800 |
| Tobacco (Yes/No/NA) | 108/111/305 | 97/94/168 | - |
| Alcohol (Yes/No/NA) | 112/70/342 | 103/45/211 | - |
| Surgery (Yes/No/NA) | 51/255/218 | 34/325/0 | - |
| HPV status (+/−/NA) | 279/61/184 | 203/20/136 | - |
| Performance status (0/1/2/3/4/NA) | 91/137/11/3/1/281 | 116/96/21/5/3/118 | - |
| N (%) | DSC Tumour | DSC Lymph | GTVp | GTVn | Sensitivity Tumour | Sensitivity Lymph | ||
|---|---|---|---|---|---|---|---|---|
| Total (All) | 488 | 0.725 | 0.653 | 0.808 | 0.780 | 0.964 | 0.878 | |
| Age | 0–50 | 44 (9.02%) | 0.745 | 0.629 | 0.820 | 0.780 | 0.943 | 0.824 |
| 50–60 | 178 (36.48%) | 0.715 | 0.671 | 0.796 | 0.786 | 0.963 | 0.888 | |
| 60–70 | 172 (35.3%) | 0.737 | 0.649 | 0.822 | 0.770 | 0.962 | 0.897 | |
| >70 | 94 (19.26%) | 0.710 | 0.639 | 0.794 | 0.784 | 0.979 | 0.854 | |
| Gender | Male | 402 (82.4%) | 0.726 | 0.663 | 0.809 | 0.782 | 0.966 | 0.874 |
| Female | 86 (17.6%) | 0.719 | 0.606 | 0.803 | 0.758 | 0.953 | 0.899 | |
| Chemotherapy | Yes | 422 (86.5%) | 0.741 | 0.669 | 0.820 | 0.781 | 0.947 | 0.918 |
| No | 66 (13.5%) | 0.623 | 0.551 | 0.627 * | 0.756 | 0.967 * | 0.873 | |
| HPV | Yes | 43 (8.81%) | 0.715 | 0.701 | 0.797 | 0.789 | 0.988 | 0.852 * |
| No | 274 (56.15%) | 0.788 | 0.563 | 0.830 | 0.758 | 0.962 | 0.904 * | |
| NA | 171 (35.04%) | 0.724 | 0.598 | 0.817 | 0.764 | 0.964 | 0.846 | |
| Tumour Size (cm3) | Small = 0–4.03 | 122 (25%) | 0.558 * | - | 0.552 * | - | 0.939 | 0.857 |
| Medium = 4.03–7.70 | 122 (25%) | 0.755 | - | 0.756 * | - | 0.996 | 0.924 | |
| Large = 7.70–17.03 | 122 (25%) | 0.750 | - | 0.774 | - | 0.963 | 0.874 | |
| Extra Large =17.3–184.5 | 122 (25%) | 0.836 * | - | 0.854 * | - | 0.959 | 0.860 | |
| Lymph Node Size (cm3) | Small = 0–2.90 | 122 (25%) | - | 0.381 * | - | 0.322 * | 0.930 | 0.889 |
| Medium = 2.90–11.8 | 122 (25%) | - | 0.652 * | - | 0.680 * | 0.988 | 0.859 | |
| Large = 11.8–24.0 | 122 (25%) | - | 0.768 | - | 0.782 | 0.971 | 0.865 | |
| Extra Large = 24.0–124.5 | 122 (25%) | - | 0.811 * | - | 0.812 * | 0.967 | 0.901 |
| No. | Method | Fivefold Cross-Validation |
|---|---|---|
| 1 | CT_all | 0.659 ± 0.063 |
| 2 | CT_only_tumour | 0.627 ± 0.062 |
| 3 | CT_largest_tumour | 0.587 ± 0.040 |
| 4 | CT_only_lymph_node | 0.608 ± 0.059 |
| 5 | CT_largest_lymph_node | 0.605 ± 0.060 |
| 6 | PET_all | 0.622 ± 0.077 |
| 7 | PET_only_tumour | 0.603 ± 0.065 |
| 8 | PET_largest_tumour | 0.569 ± 0.054 |
| 9 | PET_only_lymph_node | 0.635 ± 0.074 |
| 10 | PET_largest_lymph_node | 0.644 ± 0.084 |
| 11 | volume | 0.598 ± 0.051 |
| 12 | clinical | 0.552 ± 0.032 |
| 13 | radiomics_clinical | 0.682 ± 0.083 |
| No. | Method | Test Set |
| 1 | radiomics_clinical | 0.672 |
| Characteristics | Group | Number (Percentage) | C-Index | p-Value |
|---|---|---|---|---|
| Total (All) | - | 488 (100%) | 0.682 | - |
| Age | 0–50 | 44 (9.0%) | 0.846 | 0.126 |
| 50–60 | 178 (36.5%) | 0.609 | 0.217 | |
| 60–70 | 172 (35.2%) | 0.704 | 0.368 | |
| >70 | 94 (19.3%) | 0.728 | 0.352 | |
| Gender | Male | 402 (82.4%) | 0.663 | 0.325 |
| Female | 86 (17.6%) | 0.759 | 0.147 | |
| Chemotherapy | Yes | 422 (86.5%) | 0.685 | 0.408 |
| No | 66 (13.5%) | 0.555 | 0.022 * | |
| HPV | Yes | 43 (8.81%) | 0.650 | 0.451 |
| No | 274 (56.15%) | 0.551 | 0.006 * | |
| N/A | 171 (35.0) | 0.709 | 0.321 | |
| Tumour size (cm3) | Small = 0–4.03 | 122 (25%) | 0.654 | 0.271 |
| Medium = 4.03–7.70 | 122 (25%) | 0.737 | 0.363 | |
| Large = 7.70–17.3 | 122 (25%) | 0.561 | 0.037 * | |
| Extra Large = 17.3–184.5 | 122 (25%) | 0.633 | 0.378 | |
| Lymph node size (cm3) | Small = 0–2.90 | 122 (25%) | 0.606 | 0.134 |
| Medium = 2.90–11.8 | 122 (25%) | 0.664 | 0.327 | |
| Large = 11.8–24.0 | 122 (25%) | 0.847 | 0.053 | |
| Extra Large = 24.0–124.5 | 122 (25%) | 0.617 | 0.224 |
Disclaimer/Publisher’s Note: The statements, opinions and data contained in all publications are solely those of the individual author(s) and contributor(s) and not of MDPI and/or the editor(s). MDPI and/or the editor(s) disclaim responsibility for any injury to people or property resulting from any ideas, methods, instructions or products referred to in the content. |
© 2023 by the authors. Licensee MDPI, Basel, Switzerland. This article is an open access article distributed under the terms and conditions of the Creative Commons Attribution (CC BY) license (https://creativecommons.org/licenses/by/4.0/).
Share and Cite
Salahuddin, Z.; Chen, Y.; Zhong, X.; Woodruff, H.C.; Rad, N.M.; Mali, S.A.; Lambin, P. From Head and Neck Tumour and Lymph Node Segmentation to Survival Prediction on PET/CT: An End-to-End Framework Featuring Uncertainty, Fairness, and Multi-Region Multi-Modal Radiomics. Cancers 2023, 15, 1932. https://doi.org/10.3390/cancers15071932
Salahuddin Z, Chen Y, Zhong X, Woodruff HC, Rad NM, Mali SA, Lambin P. From Head and Neck Tumour and Lymph Node Segmentation to Survival Prediction on PET/CT: An End-to-End Framework Featuring Uncertainty, Fairness, and Multi-Region Multi-Modal Radiomics. Cancers. 2023; 15(7):1932. https://doi.org/10.3390/cancers15071932
Chicago/Turabian StyleSalahuddin, Zohaib, Yi Chen, Xian Zhong, Henry C. Woodruff, Nastaran Mohammadian Rad, Shruti Atul Mali, and Philippe Lambin. 2023. "From Head and Neck Tumour and Lymph Node Segmentation to Survival Prediction on PET/CT: An End-to-End Framework Featuring Uncertainty, Fairness, and Multi-Region Multi-Modal Radiomics" Cancers 15, no. 7: 1932. https://doi.org/10.3390/cancers15071932