Article

Aberrant Methylation of the Imprinted C19MC and MIR371-3 Clusters in Patients with Non-Small Cell Lung Cancer

by
Laura Boyero
1,
José Francisco Noguera-Uclés
1,
Alejandro Castillo-Peña
1,
Ana Salinas
1,
Amparo Sánchez-Gastaldo
1,2,
Miriam Alonso
1,2,
Johana Cristina Benedetti
1,2,
Reyes Bernabé-Caro
1,2,
Luis Paz-Ares
3,4,5,6 and
Sonia Molina-Pinelo
1,4,*
1
Institute of Biomedicine of Seville (IBiS), HUVR, CSIC, Universidad de Sevilla, 41013 Seville, Spain
2
Medical Oncology Department, Hospital Universitario Virgen del Rocío, 41013 Seville, Spain
3
H12O Lung Cancer Clinical Research Unit, Health Research Institute Hospital 12 de Octubre (imas12), 28029 Madrid, Spain
4
Spanish Center for Biomedical Research Network in Oncology (CIBERONC), 28029 Madrid, Spain
5
Spanish National Cancer Research Center (CNIO), 28029 Madrid, Spain
6
MD Anderson, 28033 Madrid, Spain
*
Author to whom correspondence should be addressed.
Cancers 2023, 15(5), 1466; https://doi.org/10.3390/cancers15051466
Submission received: 2 February 2023 / Revised: 21 February 2023 / Accepted: 23 February 2023 / Published: 25 February 2023
(This article belongs to the Special Issue Lung Cancer - Molecular Insights and Targeted Therapies)

Abstract

:

Simple Summary

Aberrations in DNA methylation profiles may alter the expression of key miRNAs in non-small cell lung cancer. In this study, we focus on the analysis of the imprinted C19MC and MIR371-3 miRNA clusters due to their oncogenic role. We identified the DNA methylation status and discovered its deregulated target genes in this disease. Additionally, we found five downstream target genes that were correlated with worse overall survival in non-small cell lung cancer. We conclude that C19MC and MIR371-3 are key players in lung cancer because their polycistronic epigenetic regulation leads to differential tumor expression, affecting downstream targets with prognostic value.

Abstract

Epigenetic mechanisms have emerged as an important contributor to tumor development through the modulation of gene expression. Our objective was to identify the methylation profile of the imprinted C19MC and MIR371-3 clusters in patients with non-small cell lung cancer (NSCLC) and to find their potential target genes, as well as to study their prognostic role. DNA methylation status was analyzed in a NSCLC patient cohort (n = 47) and compared with a control cohort including COPD patients and non-COPD subjects (n = 23) using the Illumina Infinium Human Methylation 450 BeadChip. Hypomethylation of miRNAs located on chromosome 19q13.42 was found to be specific for tumor tissue. We then identified the target mRNA–miRNA regulatory network for the components of the C19MC and MIR371-3 clusters using the miRTargetLink 2.0 Human tool. The correlations of miRNA-target mRNA expression from primary lung tumors were analyzed using the CancerMIRNome tool. From those negative correlations identified, we found that a lower expression of 5 of the target genes (FOXF2, KLF13, MICA, TCEAL1 and TGFBR2) was significantly associated with poor overall survival. Taken together, this study demonstrates that the imprinted C19MC and MIR371-3 miRNA clusters undergo polycistronic epigenetic regulation leading to deregulation of important and common target genes with potential prognostic value in lung cancer.

1. Introduction

Lung cancer remains the most common cause of mortality worldwide, and tobacco exposure increases its risk of developing [1]. Furthermore, the incidence of lung cancer is significantly higher in patients diagnosed with chronic obstructive lung disease (COPD), reflecting the impact of smoking habits in both pathologies [2,3]. Approximately 85% of all lung cancers are non-small cell lung cancer (NSCLC). Histologically, NSCLC is classified as adenocarcinoma (ADC), squamous cell carcinoma and large cell carcinoma (SCC) [4]. Molecular analyses have led to advances in our understanding of NSCLC genetics and even in the identification of biomarkers that can predict its occurrence [5]. This includes the role of microRNAs (miRNAs) in the disease, involved in the complexity of gene expression regulation. Therefore, a single miRNA can exert its regulatory function on several target mRNAs, and a particular target can be regulated by multiple miRNAs [6].
There are numerous miRNAs involved in cancer-relevant processes, and many of them are clustered on the genome and act in coordinated regulatory networks. Furthermore, some evidence has even been provided suggesting that several miRNAs are able to identify patients with an increased risk of developing lung cancer, as well as COPD [7,8]. For a more extensive review of oncomiRs in lung cancer, see [9,10]. In this context, epigenetics appears to play an important role in the regulation of miRNA expression levels [11]. Aberrations in methylation profiles can promote silencing of tumor suppressor microRNAs or overexpression of oncogenic miRNAs (oncomiRs) [12]. For example, a significant upregulation of the miR-17-92 cluster has been reported in lung cancer [13]. In addition, some oncomiRs can be located in imprinted genomic regions. Such is the case of the imprinted delta-like homolog 1 gene and the type III iodothyronine deiodinase gene (DLK1-DIO3) cluster, which includes two large miRNA clusters between other coding and non-coding transcripts, and has been reported to contribute to tumorigenesis in the lung, leukemia, breast, and hepatoblastoma, among others [14,15,16,17,18]. In addition, alterations in other clusters located in imprinted regions are also attracting interest due to their downstream targets and their involvement in oncogenic and drug resistance mechanisms, such as the chromosome 19 microRNA (C19MC) and MIR371-3 clusters [19,20,21].
The C19MC and MIR371-3 clusters are located on chromosome 19q13.42. The first cluster includes forty-six miRNA genes and the second one contains four miRNAs (miR-371, miR-372, miR-373 and miR-373*). Both clusters are only expressed from their paternal allele, so they are functionally haploid and, furthermore, they are expressed mainly in embryonic tissue, particularly in the placenta [22,23]. However, aberrations that involve some miRNAs from both these clusters have been linked to tumoral processes, such as immunomodulation, angiogenesis, invasion, and cell reprograming [21,24,25,26,27,28,29]. In fact, some miRNAs through exosomes have been proposed as specific cell-to-cell communication mediators [21,27,30]. Regarding lung cancer, the regulation of imprinted C19MC and MIR371-3 has not been extensively and systematically reviewed in patients with NSCLC. For this reason, we have analyzed the methylation profile of the C19MC and MIR371-3 clusters in lung tumors compared to non-tumoral lung tissue in NSCLC patients. We have also assessed the methylation patterns of both clusters in COPD patients to study their association in a population at high risk of developing lung cancer. In addition, we were able to experimentally identify and validate deregulated targets, as well as their prognostic role in the disease.

2. Materials and Methods

2.1. Patients and Clinical Specimens

The present study was carried out on 70 subjects from the Virgen del Rocio University Hospital (Seville, Spain). Samples were divided into 2 cohorts according to the underlying pathology. The first cohort consisted of 47 NSCLC patients who had undergone surgical resection at an early clinical stage. During surgical resection, adjacent normal and tumor tissue samples were collected from all patients and immediately frozen at −80 °C until further use. The clinical characteristics of patients with NSCLC (n = 47) are summarized in Supplementary Table S1. The second cohort was used as control without lung cancer (n = 23). This control cohort consisted of COPD patients and non-COPD subjects (Supplementary Table S1) who had undergone bullectomy or bronchoscopic biopsy with a negative diagnosis of lung cancer. Both cohorts were used for the analysis of the methylation profile. The protocol of the study and the use of human samples were approved by the Ethics Committee of our hospital (1381-N-21). Written informed consent was obtained from all patients included in the study.

2.2. DNA Sample

Genomic DNA was extracted from 15 mg adjacent normal and tumor tissue samples using the QIAamp DNA mini kit (QIAGEN, Hilden, Germany). DNA was quantified using the QuantiFluor dsDNA system (Promega, Madison, WI, USA) according to the manufacturer’s instructions.

2.3. Illumina 450 K Methylation Assay

DNA methylation status at the CpG sites within the C19MC and MIR371-3 clusters was identified using the Illumina Infinium Human Methylation 450 BeadChip (Illumina Inc., San Diego, CA, USA). 500 ng of DNA were treated with sodium bisulfate using the EZ DNA Methylation™ Kit and cleaned with the ZR-96 DNA Clean-up Kit™ (Zymo Research, Irvine, CA, USA). Subsequently, the following steps were performed: amplification, hybridization and imaging. Intensity data was analyzed with Illumina’s GenomeStudio, from which, β-scores (i.e., the proportion of total fluorescence signal from the methylation-specific probe or color channel) were obtained. Infinium HD-based assays included sample-dependent and sample-independent controls for the highest quality data.

2.4. Methylome Data Processing

The methylome data was processed using the R/Bioconductor package RnBeads [31]. After a quality check, intensity normalization was performed by SWAN method [32] and converted to β values. The probes were tested for differential methylation with the limma linear model followed by empirical Bayes methods for the comparisons of interest [33]. Statistical significance was established using the Benjamini–Hochberg false discovery rate (FDR) with a value lower than 0.05. The DNA methylation status and CpG chromosomal location were displayed using the Circos software [34]. Furthermore, the methylation data was visualized by the Wash U Epigenome Browser [35].

2.5. Integrated Analysis of the Target mRNA–miRNA Regulatory Network

Strong validated miRNA–mRNA interactions were identified for the C19MC and MIR371-3 miRNA clusters with the miRTargetLink 2.0 Human tool. miRTargetLink collects information from various databases, including the sources miRBase (v.22.1) and miRTarBase (v.8) [36,37]. Gene expression analysis on tumor and normal lung tissue were analyzed from the Cancer Genome Atlas datasets (TCGA) using GEPIA 2.0 (http://gepia2.cancer-pku.cn/#index, accessed on 6 September 2021). GEPIA is an interactive web server that compiles data from TCGA and GTEx projects, using a standard processing pipeline. This tool allows for a customizable analysis of the collected data [38]. The molecular function and proposed biological process of the experimentally verified mRNAs were determined using the PANTHER program (http://pantherdb.org, accessed on 29 September 2021). The PANTHER classification system contains a comprehensive, annotated “library” of phylogenetic trees of gene families designed to classify proteins (and their genes) to facilitate high-throughput analysis [39]. Besides, Kyoto Encyclopedia of Genes and Genomes (KEGG) pathway database was used to know the molecular interaction network (https://www.genome.jp/kegg/pathway.html, accessed on 3 October 2021) [40].

2.6. Correlation Analysis in Lung Primary Tumors from TCGA Datasets

Transcriptome profiling data from TCGA datasets were downloaded using the CancerMIRNome tool [41]. MicroRNA and mRNA expression data from primary tumors were retrieved from the LUAD (Lung Adenocarcinoma) and LUSC (Lung Squamous Carcinoma) datasets included in TCGA. Only samples labeled as “tumor” and expression level (Log2 Counts per Million (CPM)) > −3.322 were used for the analyses. To test the association between paired miRNA–mRNA profiles, the Pearson correlation coefficients and p-values were computed. p-values lower than 0.05 were considered statistically significant.

2.7. Survival Analysis to Assess the Prognostic Value of Validated Target Genes of the C19MC and MIR371-3 miRNA Clusters in NSCLC Patients

To analyze the prognosis associated with the target genes of the C19MC and MIR371-3 miRNA clusters, the Kaplan–Meier survival plots to overall survival time were obtained using the Kaplan–Meier (KM) plotter website [42], where unprocessed. CEL files from the Gene Expression Omnibus (GEO), the European Genome-phenome Archive (EGA) and the Cancer Genome Atlas (TCGA) repositories were normalized in the R environment. The datasets included in the Kaplan–Meier plotter website are GSE3141, GSE4573, GSE8894, GSE14814, GSE19188, GSE29013, GSE31210, GSE37745, EGA and TCGA (n = 1715 patients). The best-performing threshold from computed lower and upper quartiles was used as cut-off point for the definition of high and low expression of the analyzed genes. Overall survival (OS) was determined from the date of diagnosis to the date of death. p-values lower than 0.05 were considered statistically significant.

3. Results

3.1. DNA Methylation Pattern of the C19MC and MIR371-3 miRNA Clusters in Lung Cancer

To evaluate the potential role of the C19MC and MIR371-3 miRNA clusters in lung cancer, we analyzed the methylation status of both of them in human lung tissues from a NSCLC patient cohort (n = 47) and a control cohort (n = 23) of the Virgen del Rocio University Hospital (Seville, Spain). The methylation profile of these clustered miRNAs, which are located on chromosome 19q13.42, were evaluated in human tumor samples compared to paired non-tumoral tissue by using the Illumina Infinium Human Methylation 450 BeadChip. The methylation levels in lung cancer versus paired non-tumoral tissues are represented in Figure 1A and Supplementary Table S2. Patients with lung cancer at our hospital showed DNA hypomethylation at 50 miRNAs included in the C19MC and MIR371-3 clusters after standardisation with non-tumoral control samples. Statistically significant differences (adjusted p-value < 0.05) were detected in the large C19MC cluster (46 miRNAs) and the closely distal MIR371–3 cluster (miR-371a, miR-371b, miR-372 and miR-373). Among all miRNAs, miR-520b, miR-520c, miR-520f, miR-526a1, miR-1283-1 and miR-1283-2 showed greater changes in the DNA hypomethylation pattern in NSCLC patients (Figure 1B,C and Table 1).
We next analyzed the DNA methylation pattern of both clusters in patients at high risk of developing lung cancer, such as patients with COPD. In these patients, we found that the C19MC cluster methylation profile showed no statistical differences compared to the control group (Figure 1B and Table S2). We even found that miRNA-520e, miR-524 and miR-516b2 were hypermethylated in COPD patients versus the non-tumoral control group (Figure 1B). However, these differences did not reach statistical significance. In the case of the MIR371-3 cluster, changes in the DNA methylation levels were negligible between both patients groups (Figure 1C and Table S2).

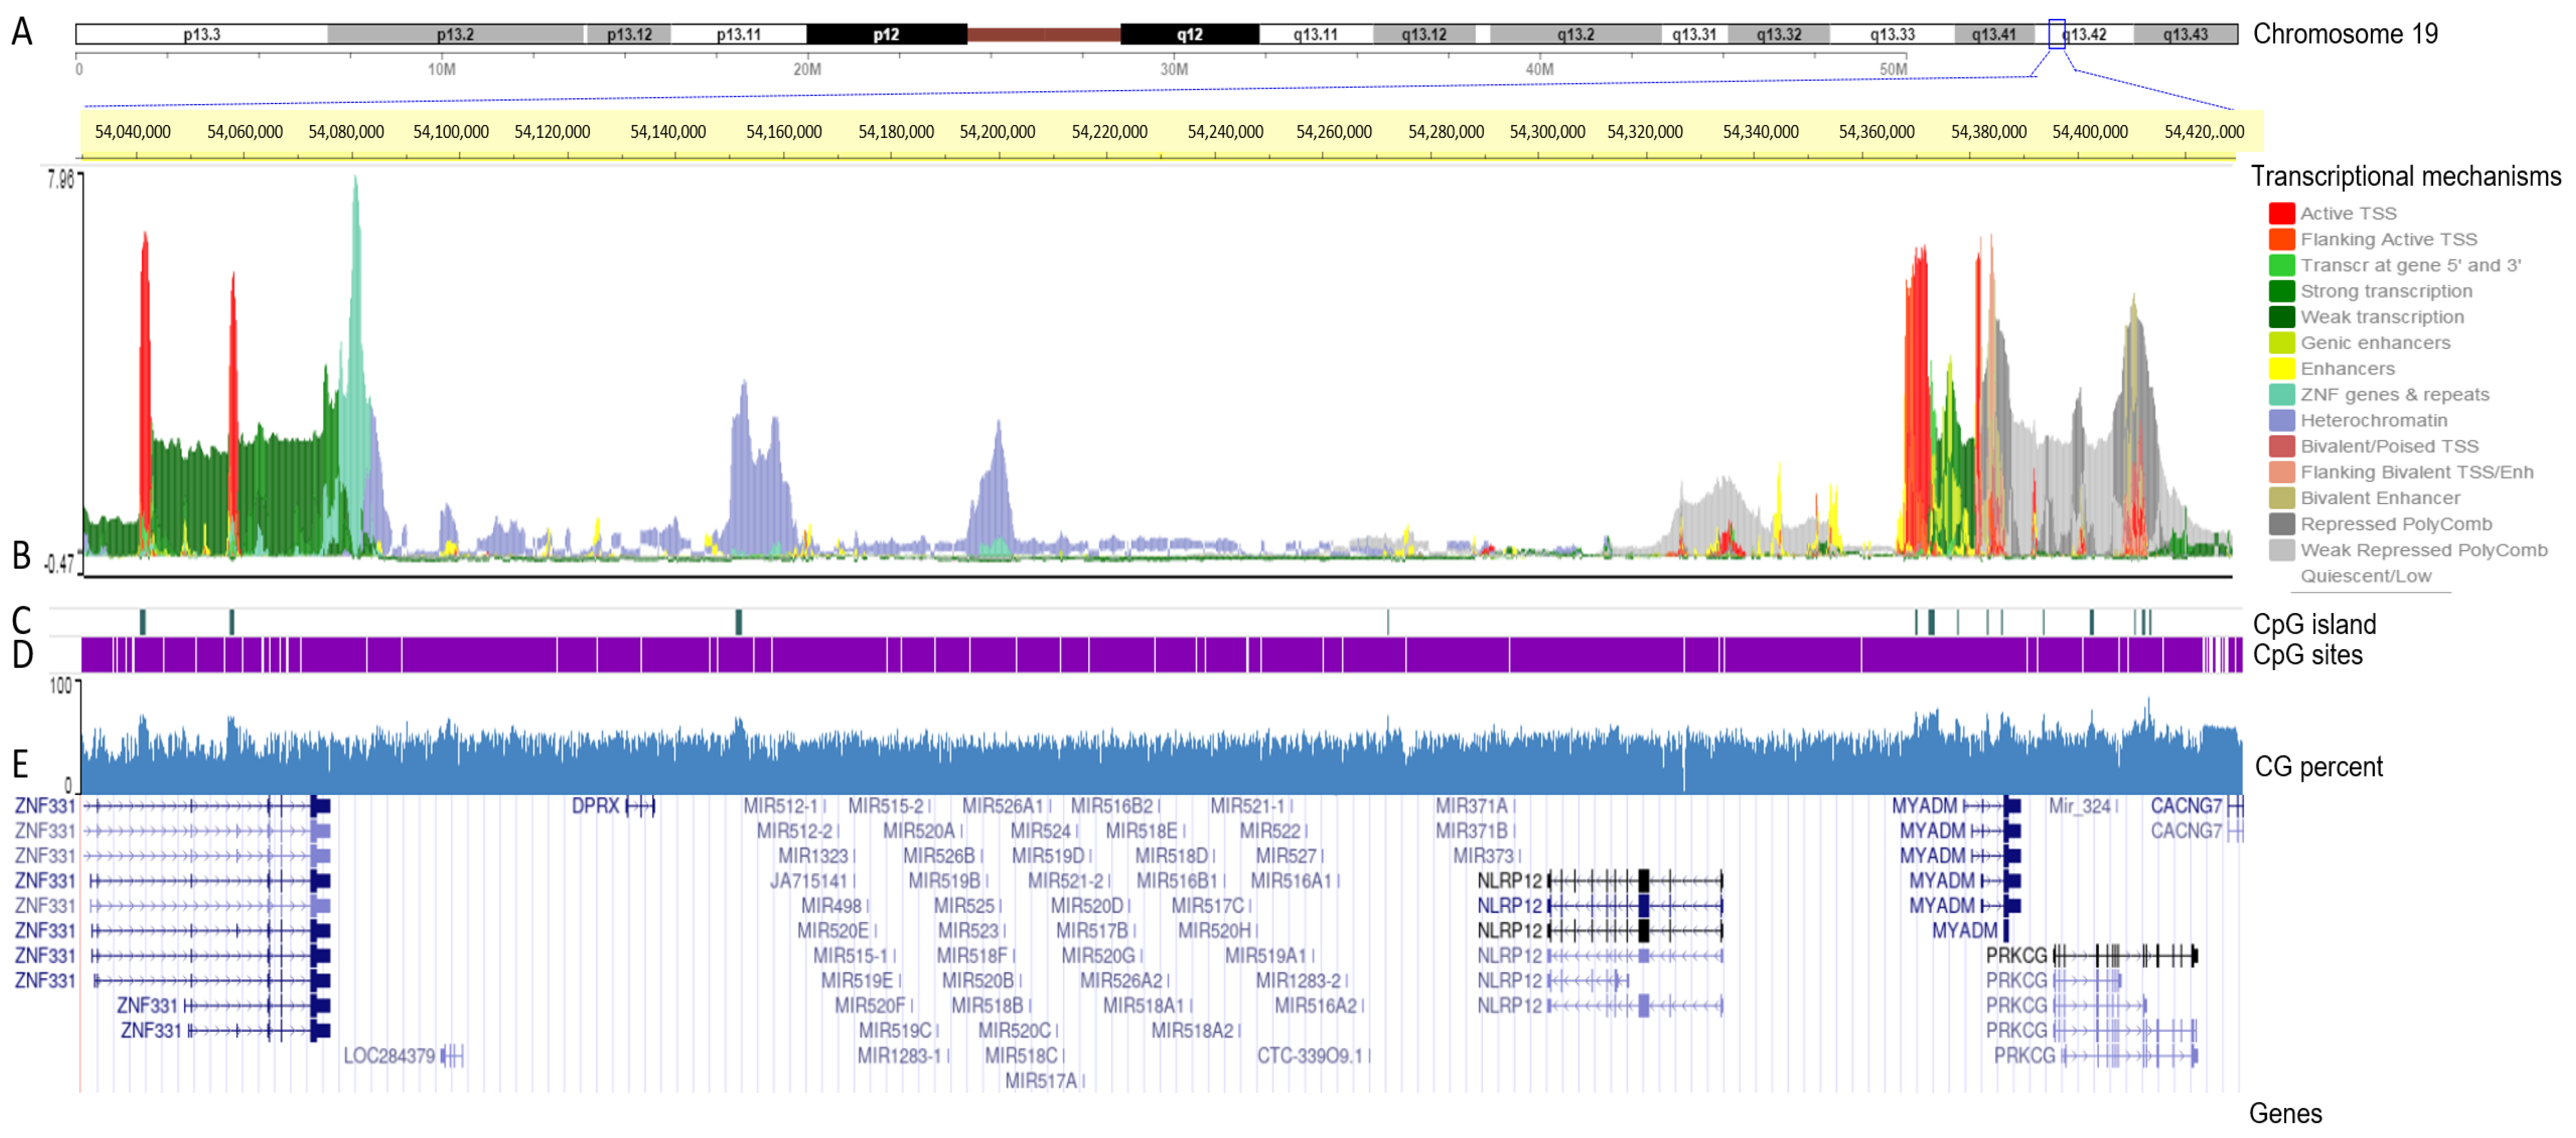
3.2. Transcriptional Mapping of the C19MC and MIR371-3 miRNA Clusters

To analyze genomic features associated with different mechanisms of the transcriptional regulation of the C19MC and MIR371-3 miRNA clusters, we used the Wash U Epigenome Browser [33] to display the epigenomic mapping of both clusters (19q13.42) on the reference human genome (hg19; chr19: 54,030,000–54,430,000 genomic coordinates) (Figure 2A). Thus, it is shown which transcriptional mechanisms (direct regulators and structural determinants) act at each locus throughout both clusters (Figure 2B). We observed that enhancers are distributed outside the regions where the C19MC and MIR371-3 miRNA clusters are located (yellow histograms). In these same regions, we found low activity of polycomb protein-mediated epigenetic regulator (grey histograms). In addition, we identified two heterochromatin-rich domains located in the C19MC cluster region (purple histograms). One of these highly condensed regions is observed at 5′ of the C19MC miRNA cluster. Interestingly, the 5′ and 3′ flanking regions of both clusters showed transcription initiation activity, marked by small active transcriptional start sites (TSS) shown by red histograms. No other region of the C19MC and MIR371-3 miRNA clusters showed active TSS. Behind these active TSS, we found regions with strong transcription activity (green histograms) (Figure 2B). We identified a CpG island in the 5′ region at the beginning of the C19MC miRNA cluster (~54,150,000 bp; CpG count: 86; and citosine base count plus guanine base count: 762) and another in the MIR371-3 miRNA cluster (~54,270,000 bp; CpG count: 23; and citosine count plus guanine count: 157) (green lines) (Figure 2C). However, the CpG sites were distributed throughout both clusters (white lines) (Figure 2D). The CG-content was similar from 54,030,000 to 54,430,000 bp on chromosome 19 (Figure 2E).

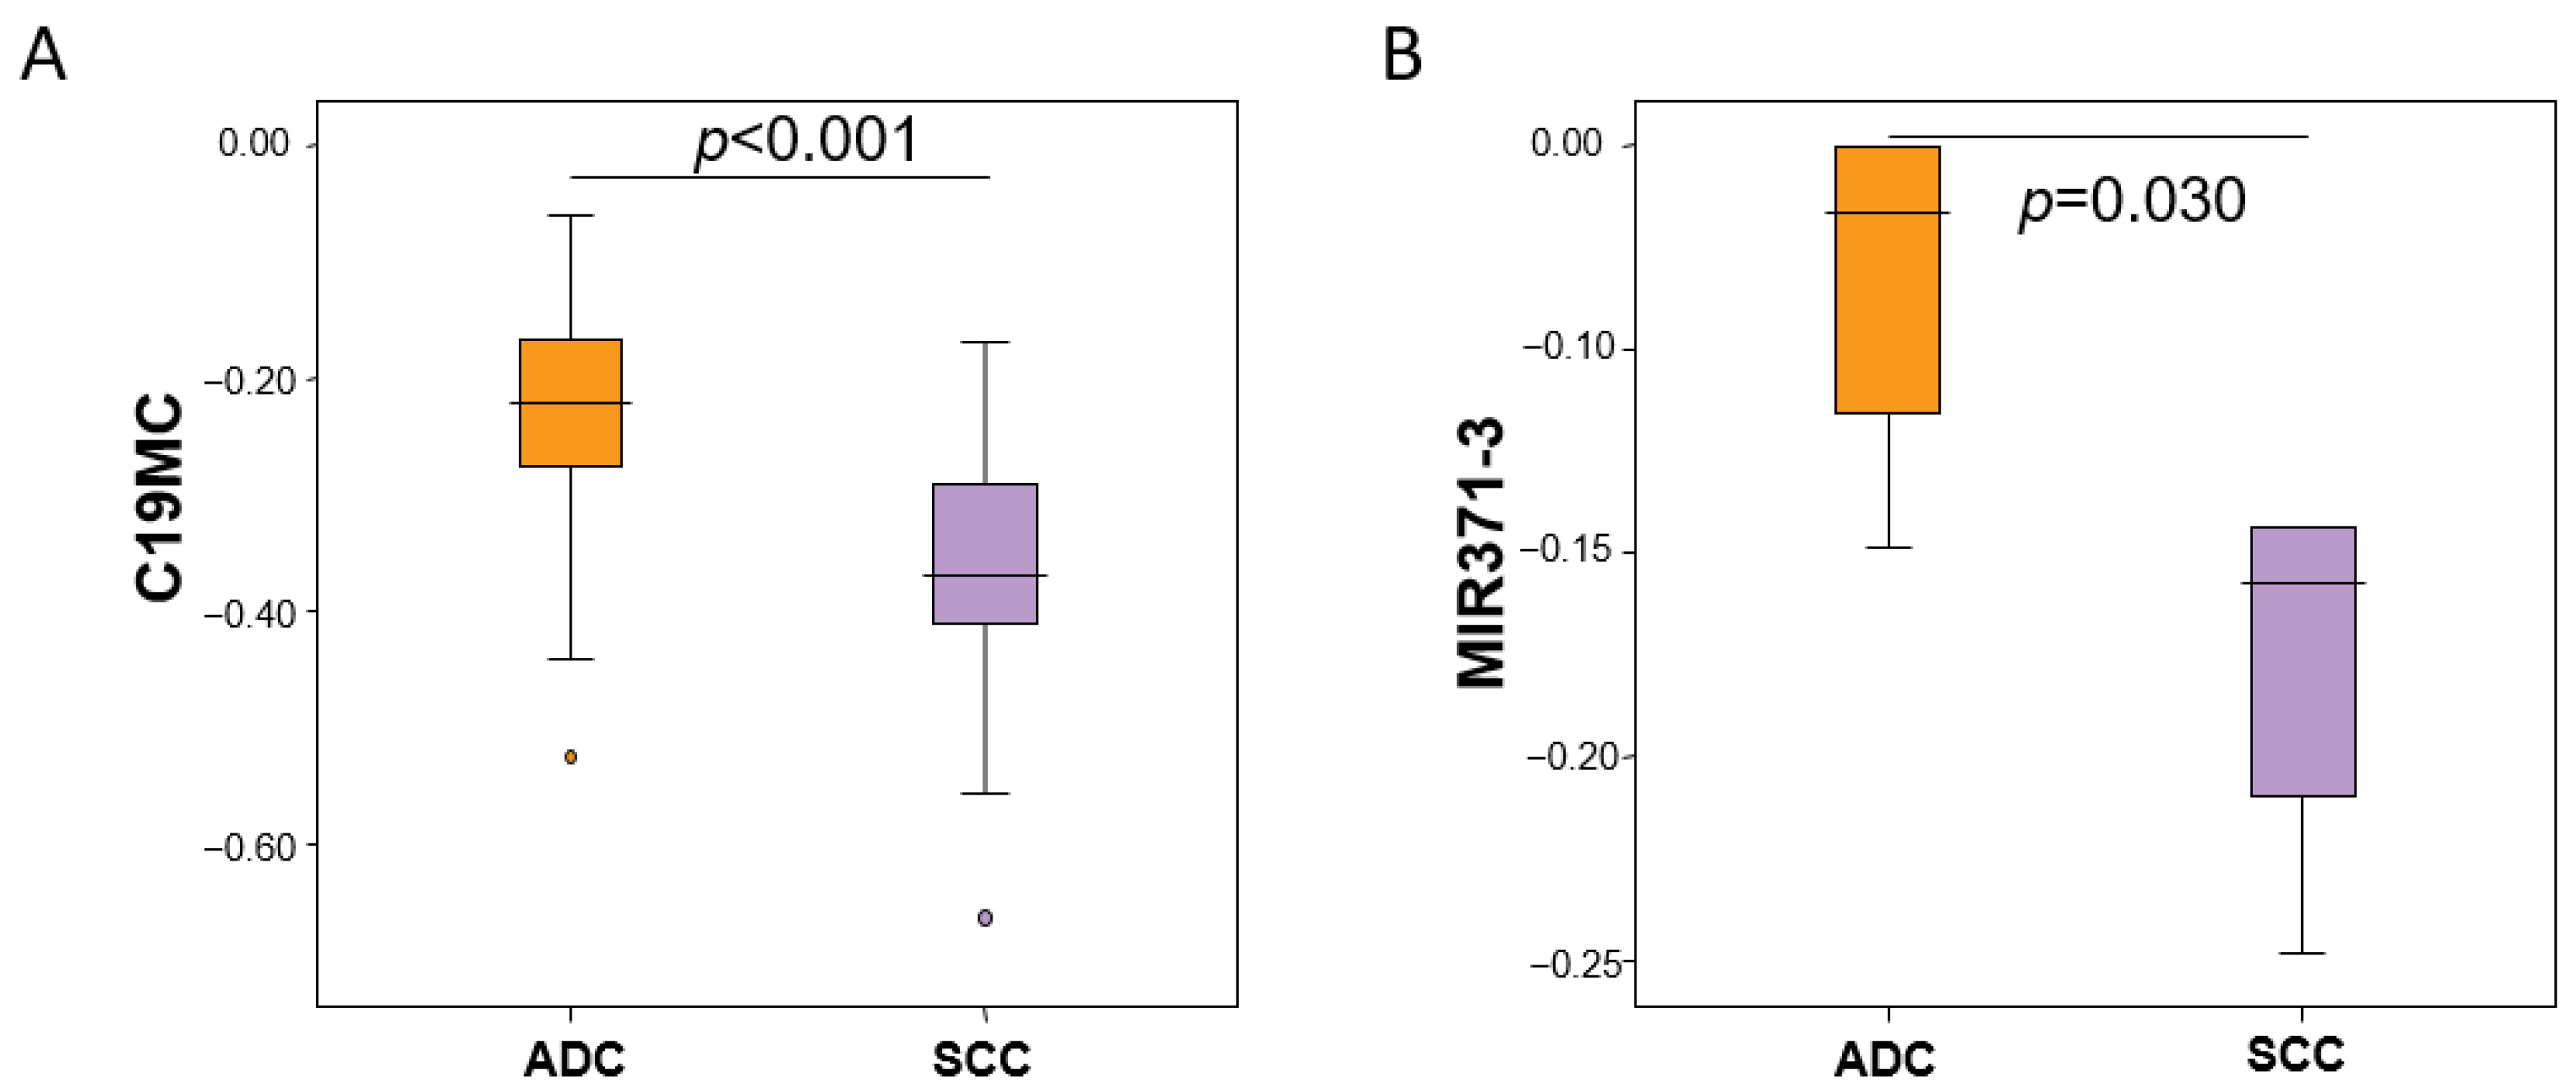
3.3. Methylation Profile of the C19MC and MIR371-3 miRNA Clusters by Histological Subtypes

Due to lung cancer-specific hypomethylation, in order to evaluate the potential role of the C19MC and MIR371-3 miRNA clusters as biomarkers in different histological subtypes of lung cancer, we analyzed the methylation pattern in SCC versus adenocarcinoma, pre-normalizing each patient with the methylation status of the matched non-tumoral tissue. The DNA-methylation levels of the C19MC and MIR371-3 clusters were consistently hypomethylated in both histological subtypes in comparison with non-tumoral tissue (Table S2). Furthermore, these differences were statistically significant for both clusters (C19MC, p < 0.001; MIR371-2, p = 0.030) (Figure 3).

3.4. Experimentally Validated miRNA–Target Interactions for the C19MC and MIR371-2 miRNA Clusters

We have graphically represented a network with experimentally validated miRNA–mRNA interactions for each component of the C19MC and MIR371-3 clusters in order to study their functional relevance (Figure 4). According to the data included in miRTargetLink software [36] and considering only strong evidence targets, a total of 115 genes were found targeted by at least one of the aforementioned miRNAs. In the network of the C19MC miRNA cluster, the nodes with several connections were those corresponding to miRNA-512-5p, miR-518a-5p, miR-519b-3p, miR-519a-3p, miR-519d-3p, miR-520a-3p, miR-520c-3p, miR-520g-3p, miR-520h, miR-524-5p and miR-525-3p (Figure 4A). Among the MIR371-3 cluster compounds, miR-371a-3p, miR-372-3p and miR-373-3p showed a high number of connections. The common target genes possessed a high interaction grade with different miRNAs simultaneously (Figure 4B and Table 2). Of these targets, we identified six genes (CD44, CDKN1A, MTOR, SIRT1, TGFBR2 and VEGFA) that were targeted by miRNAs from both clusters.

3.5. Aberrant Expression of Validated Target Genes for Both miRNA Clusters in Lung Cancer Patients

We explored the transcriptional levels of the previously identified validated target genes in cancer and normal lung tissues in the TCGA/GTEx data available in GEPIA2 [38]. Of the 115 target genes validated by miRTargetLink, 31 were significantly underexpressed in at least one of the histological subtypes of NSCLC compared to non-tumor tissue (Table 3 and Figure 5). Seventeen of them showed significant differences in both histological subtypes of lung cancer (adenocarcinoma and SCC). It is worth highlighting those genes that we found targeted by several miRNAs from both clusters, such as the tumor suppressor genes (TSG) CDKN1A (regulated by miR-372-3p, miR-512-5p, miR-515-3p, miR-519a-3p, miR-519b-3p, miR-519e-3p and miR-520a-3p) and TGFBR2 (targeted by miRNA-372-3p, miRN-373-3p and miR-520a-3p).
As displayed in Figure 6, we classified the validated targets by gene ontology (GO) molecular function and biological processes using the PANTHER software [39]. The main GO molecular functions were binding (GO:0005488) (39.0%), catalytic activity (GO:0003824) (26.8%) and transcription regulator activity (GO:0001071) (14.6%). The primary binding types were protein binding (GO:0005515) and organic cyclic compound binding (GO:0097159). In the case of catalytic activity, we primarily found hydrolase (GO:0016787), transferase (GO:0016740) and catalytic (GO:0140096) activities. Validated targets displayed three main biological processes: response to stimulus (GO:0050896) (15.0%), biological regulation (GO:0065007) (17.7%) and cellular process (GO:0009987) (19.5%). In the latter, we found represented cell communication (GO:0030234), signal transduction (GO:0007165) and cellular metabolic process (GO:0044237). Finally, we found that 31% of validated targets with aberrant expression in lung cancer were classified in cancer by the KEGG pathways (adjusted p = 7.0 × 10⁻³).

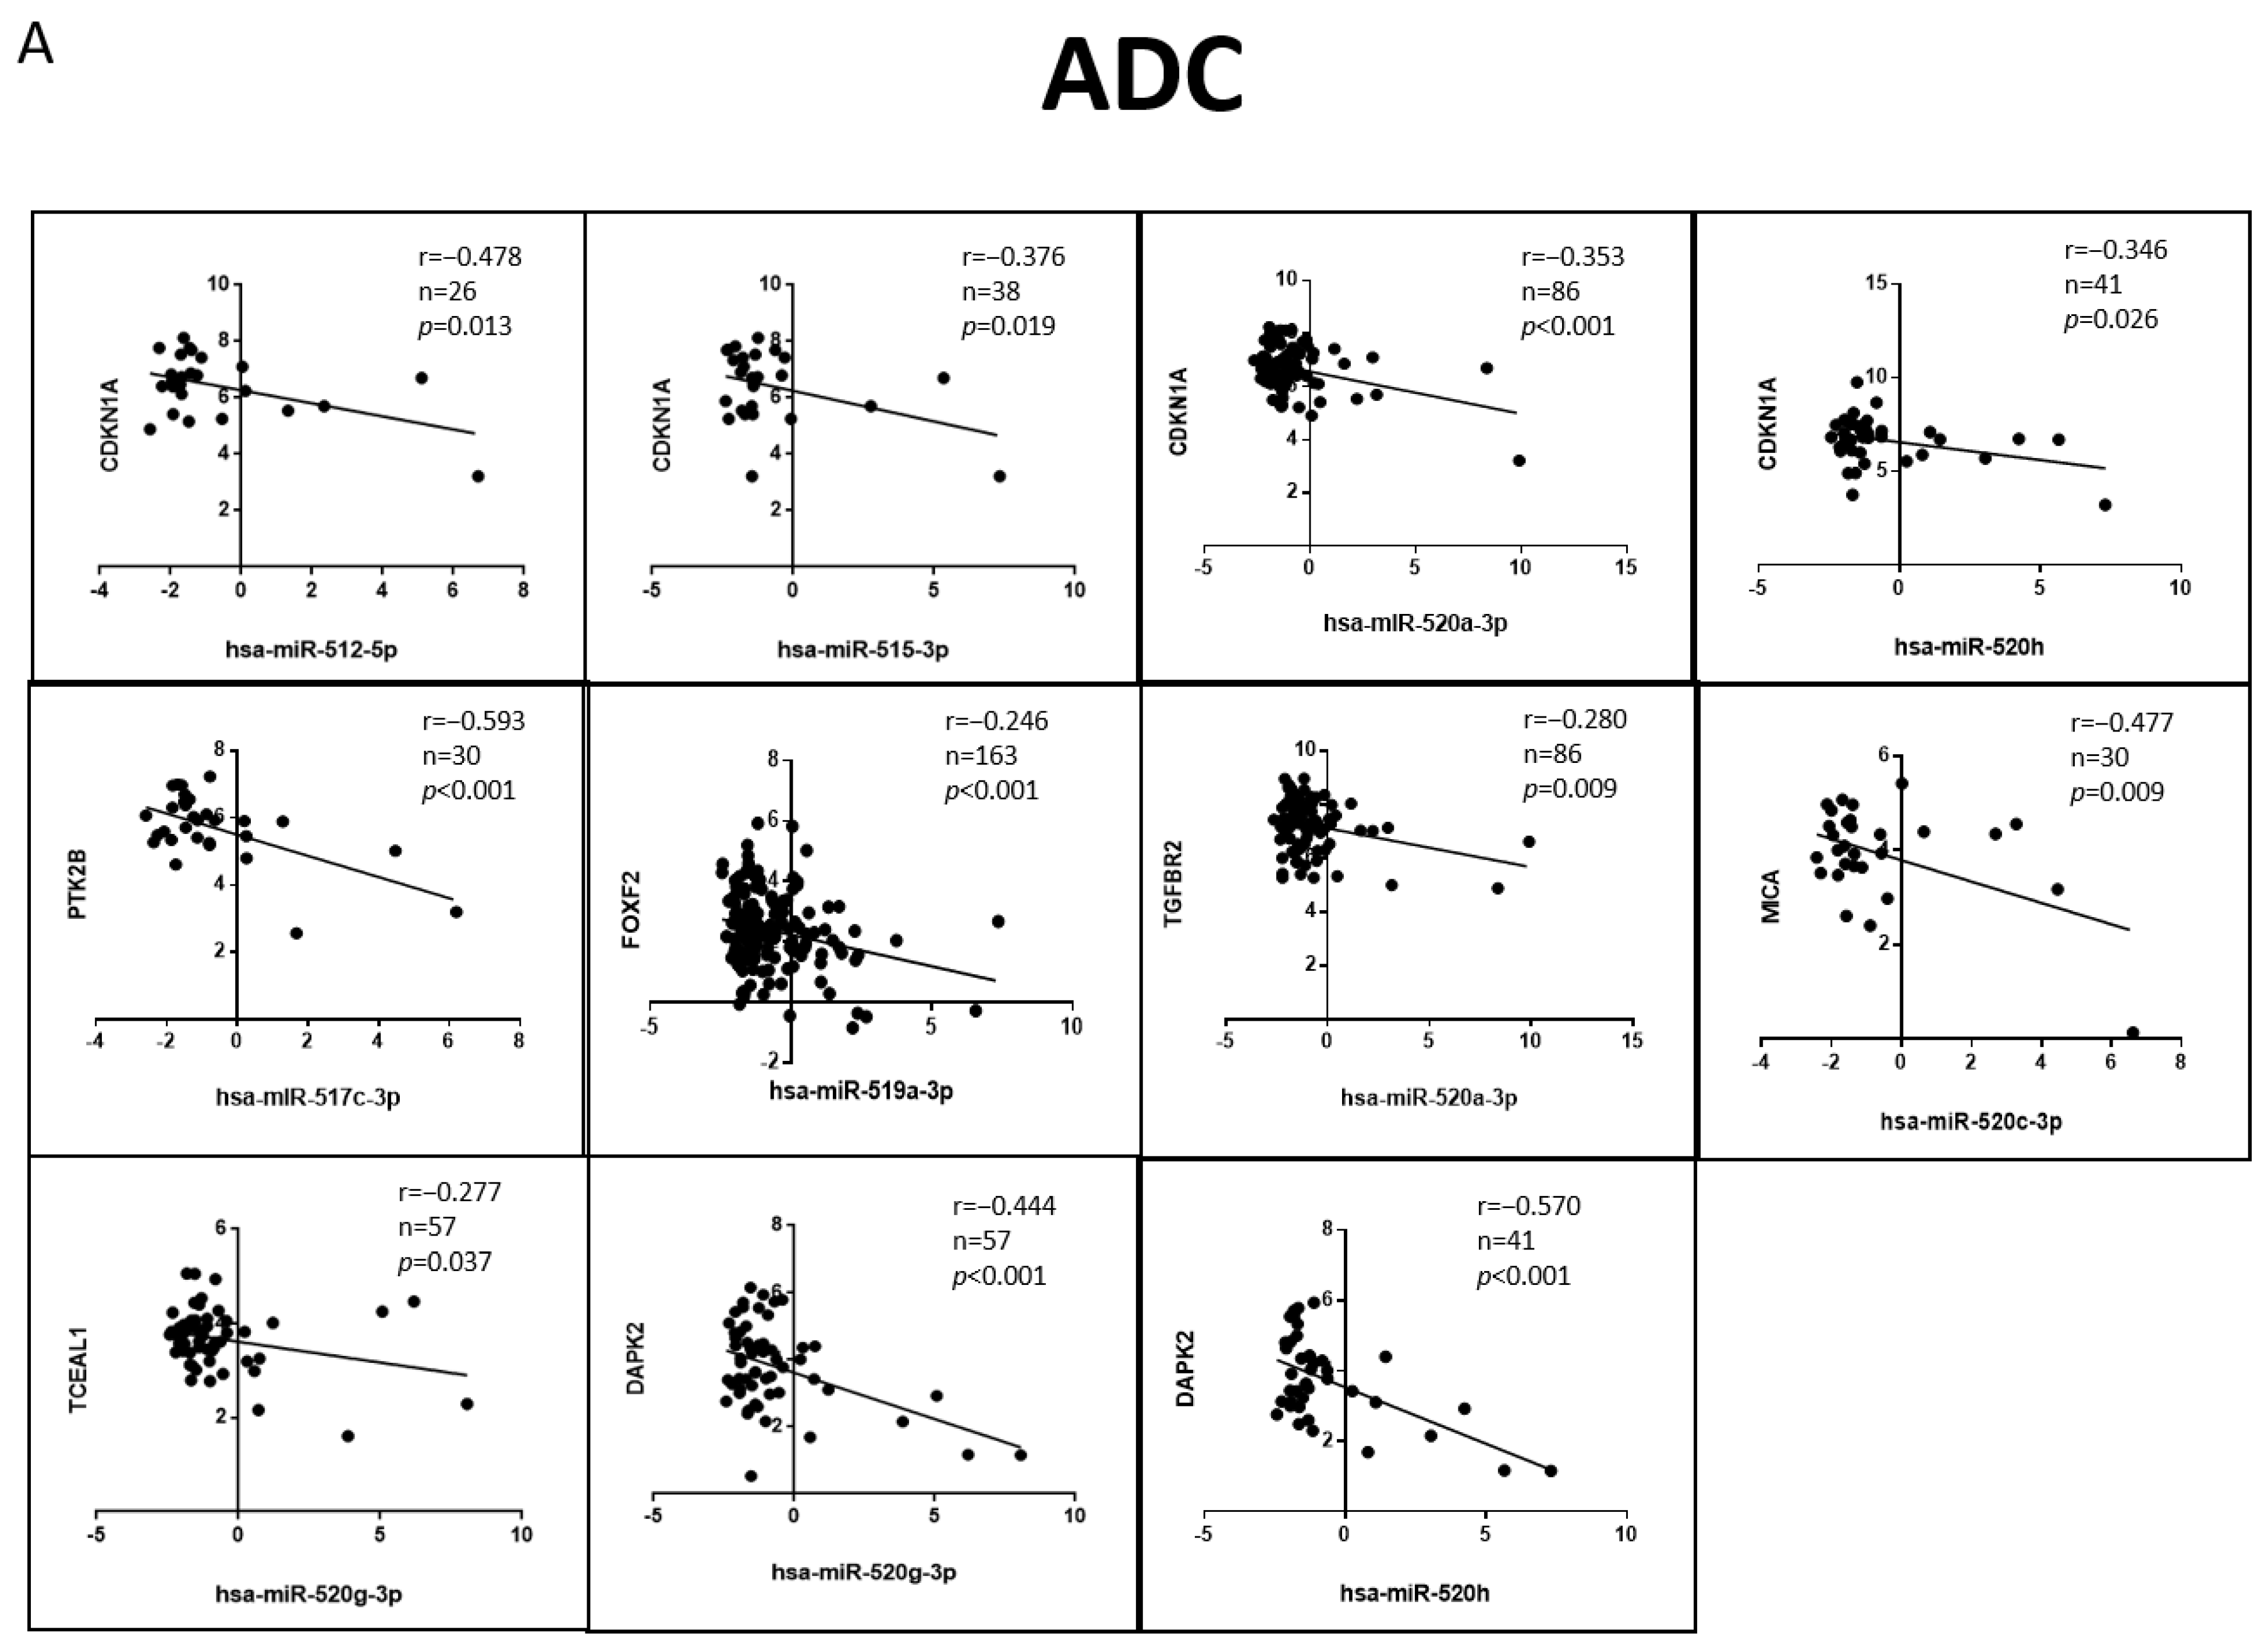
3.6. Correlation of the Validated Target mRNA–miRNA Expression in Lung Primary Tumors

Since we had compelling data on the functional relationship between miRNA–target for the C19MC and MIR371-3 miRNA clusters, as well as differential expression of the validated target genes in lung cancer, we tested whether miRNA–target correlations extended to primary tumors. We studied these correlations using external expression data obtained from the TCGA datasets through the CancerMIRNome tool [41]. We found 11 significant negative correlations for lung adenocarcinoma (Figure 7A), all of them for miRNAs included only in the C19MC cluster. On the other hand, 8 were found for SCC (Figure 7B), this time including miRNAs from both clusters. It should be noted that CDKN1A was the target gene with the highest number of significant negative correlations (p < 0.05) in both adenocarcinoma (miRNA-512-5p, miRNA-512-3p, miRNA-520a-3p and miRNA-520h) and SCC (miRNA-515-3p, miRNA-519b-3p, miRNA-520a-3p and mir-372-3p). Furthermore, DAPK2 was also negatively correlated with miRNA-520g-3p and miRNA-520h in both histological subtypes of lung cancer (p < 0.01). Other significant correlations for adenocarcinoma were PTK2B-miRNA-517c-3p (p < 0.001), FOXF2-miRNA-519a-3p (p = 0.001), TGFBR2-miRNA-520a-3p (p = 0.009), MICA-miRNA-520c-3p (p = 0.007) and TECEAL1-miRNA-520g-3p (p = 0.037); while for SCC, they were JAG1-miRNA-524-5p (p < 0.001) and KLF13-miRNA-372-3p (p = 0.003).

3.7. Prognostic Role of the Target Gene Network of the C19MC and MIR371-3 Clusters in Lung Cancer

To evaluate whether the genes targeted by the C19MC and MIR371-3 clusters with significant negative correlations were associated with clinical outcomes in patients with lung cancer, we analyzed their gene expression levels according to OS data using the KM Plotter website [42]. We found that five target genes were also significantly associated with worsening OS (Figure 8). These genes were FOXF2 (HR = 0.66, 95% CI = 0.58–0.75, p < 0.001), KLF13 (HR = 0.61, 95% CI = 0.52–0.72, p < 0.001), MICA (HR = 0.75, 95% CI = 0.66–0.86, p < 0.001), TCEAL1 (HR = 0.72, 95% CI = 0.63–0.82, p < 0.001) and TGFBR2 (HR = 0.66, 95% CI = 0.58–0.75, p < 0.001). The expression levels of the rest of the genes did not show significant differences regarding the OS in patients with lung cancer.

4. Discussion

In the present study, we identified the methylation pattern of the imprinted C19MC and MIR371-3 clusters in patients with NSCLC. Specifically, we identified that all compounds of both clusters are hypomethylated in tumor lung tissue compared to paired normal lung tissue. Importantly, this imprinted cluster-specific methylation signature is restricted to lung cancer, as it is absent in patients with COPD, who have an increased risk of developing lung cancer. Furthermore, these epigenetic changes observed in patients with NSCLC are negatively associated with the expression of relevant target genes in the disease; even five of them were significantly associated with the prognosis of this disease.
This methylation profile is consistent with the epigenetic features found at the 19q13.42 locus, in which, the C19MC and MIR371-3 miRNA clusters are located. Epigenetic modifications are characterized by not altering the nucleotide sequence, but by regulating genetic structure and expression reversibly. Early events in tumorigenesis and its progression are related to DNA methylation, histone modifications, nucleosome remodeling and miRNA, which are key epigenetic players [43]. In the particular case of C19MC and MIR371-3 miRNA clusters, the mechanisms involved in regulation were the presence of enhancers, CpG islands, active TSS, heterochromatin-rich domains, as well as low activity of polycomb complexes. In addition, these differences were evident for both histological subtypes of NSCLC. Thus, we found that although all subtypes are hypomethylated, this is more accentuated in SCC than in lung adenocarcinoma. At the same locus, the Protein Tyrosine Phosphatase Receptor type H (PTPRH) has also been confirmed to be hypomethylated and this is correlated with increased gene expression and leads to a poor prognosis in NSCLC [44,45]. Therefore, the epigenetic features of this region have a significant effect on the disease.
Members of the C19MC and MIR371-3 clusters are expressed almost exclusively in human embryonic stem cells (hESC) and rapidly down-regulated during the differentiation process [46,47,48]. However, they are over-expressed in cancer [20,48], suggesting a tumorigenic role and a possible maintenance function of tumor-associated progenitor cells for these clusters when reactivated [49]. Higher expression of members of the C19MC and MIR371-3 clusters has also been reported in thyroid adenomas [50] and parathyroid carcinomas [48], germ cell tumors [29,51,52], retinoblastoma [53], breast cancer [54], gastric adenocarcinoma [55] and esophageal cancer [56,57], among others. And this increase affects tumor growth, differentiation, progression and aggressiveness and, ultimately, patient survival. This cluster overexpression phenomenon also occurs in other sets of miRNAs in NSCLC, such as the miR-23a/27a/24-2 cluster, which has predictive value in early stages and stimulates postoperative progression by inducing tumor suppressor gene silencing [58]. Activation of all miRNAs from the DLK1-DIO3 locus has also been described for human lung adenocarcinoma samples, which is associated with cell stemness and its targets are involved in embryogenesis [59]. Moreover, it is hypomethylated in current and former smokers with NSCLC, suggesting a relevant role in the pathogenesis of lung cancer [15]. The 14q32 miRNA cluster is another example of up-regulation due to DNA hypomethylation in metastatic lung adenocarcinoma patients. Overexpression of this cluster induces cell migration and invasion and has prognostic value [60]. Furthermore, overexpression of the miR-17-92 cluster, which is a highly conserved oncogene cluster, has been frequently reported in lung cancer, especially in the small cell lung cancer subtype, promoting cell growth [61,62]. Therefore, the gene regulation mechanism mediated by miRNAs is very interesting due to its ability to associate with mRNAs of multiple targets.
On the other hand, we identified a total of 115 strongly validated targets for the C19MC or MIR371-3 clusters, and 31 of them presented a significant lower transcriptional level in NSCLC tissue compared to normal. In other words, we identified only those miRNA–mRNA interactions that had been experimentally validated previously. Of these, only six genes were targeted by members of both clusters: CD44, CDKN1A, MTOR, SIRT1, TGFBR2 and VEGFA. In addition, these miRNA–target interactions were verified with TCGA data for primary NSCLC tumors, corroborating significant miRNA–target negative correlations in both clusters and histological subtypes of the disease. Interestingly, redundancy is observed in the miRNAs belonging to C19MC and MIR371-3, since many of them share targets, as it can be inferred from our results. An explanation for this is the high degree of homology that has been described for some C19MC miRNAs through a seed region (5′-AAGUGC-3’), which can be found in several members of the cluster at different positions [20,46]. This suggests that, in addition to a polycistronic regulation, the targets of these miRNAs are common or share functions. Bioinformatic predictions for this seed region relate these miRNAs to cellular proliferation and apoptosis [20,63]. Something similar occurs with the MIR371-3 cluster, which has identical seed sequences that are similar to its murine miR290-295 homolog [64].
In this study, we even found that this redundancy occurs between the two clusters C19MC and MIR371-3. The CDKN1A and DAPK2 genes are notable for being negatively correlated with and targeted by multiple miRNAs from these clusters in the two most common subtypes of NSCLC (lung adenocarcinoma and SCC). CDKN1A, also known as p21, plays a critical role in the cellular response to DNA damage, and its overexpression results in p53-mediated cell cycle arrest [65]. It has been reported that CDKN1A/p21 can be blocked in NSCLC by oncomiRs, such as miR-212/132 [66] or miR-93. The latter can act directly or indirectly, thereby inhibiting liver kinase B1 (LKB1) [67]. This promotes proliferation and metastases through the phosphatidylinositol 3-kinase (PI3K)/protein kinase B (AKT) pathway in NSCLC. Other authors have also confirmed the relationship between CDKN1A/p21 and members of the MIR371-3 cluster in hESCs [68], specifically miR-372. On the other hand, DAPK2 is a serine/threonine kinase that promotes cell apoptosis and autophagy [69] by activating the oncogenic nuclear factor kappa-light-chain-enhancer of activated B cells (NF-κB) signaling pathway [70], which sensitizes resistant cells to tumor necrosis factor (TNF)-related apoptosis-inducing ligand (TRAIL)-mediated death [71]. DAPK2 expression has been reported to be significantly associated with the poor prognosis in NSCLC [70,72]. As in this study, DAPK2 is also downregulated by miR-520h in breast cancer [73] and miR-520g in epithelial ovarian cancer [74] and it contributes to chemoresistance.
Finally, we found that five of the genes targeted by members of the C19MC and MIR371-3 clusters correlated with worse OS in lung cancer. These genes were FOXF2, KLF13, MICA, TCEAL1 and TGFBR2. They are known transcription regulators and oncogenes, some involved in immune evasion and resistance to immune checkpoint inhibitors [75], which places them in the focus of current cancer research. For example, according to our results, decreased FOXF2 expression has been reported as an independent predictor of poor prognosis for patients with early-stage NSCLC [76]. FOXF2 deregulation ought to an aberrant DNA methylation status has also recently been identified for gastric cancer [77]. In the case of MICA, Okita et al. reported that PD-L1low/MICA/Bhigh is associated with a better clinical outcome in patients with stage I-IIIA NSCLC. On the other hand, both oncogenic and tumor suppressor roles have been attributed to the transforming growth factor beta (TGF-β) pathway, depending on both the type of tumor and its stage [78]. In this matter, TGFBR2 [79] has recently been proposed as a tumor suppressor with prognostic value in early-stage NSCLC; however, there is no prior evidence of an association between KLF13 and lung cancer prognosis, so further research is required.
Our study has the limitation that the mechanism underlying the alterated methylation status of the C19MC- and MIR371-3-imprinted clusters was not evaluated. Cancer-related gene hypomethylation is common in solid tumors, which could contribute to increased expression of oncogenes. In this case, miRNAs may act as oncomiRs by inhibiting the expression of tumor suppressor genes. DNA methylation is a dynamic process regulated by the action of DNA demethylases and DNA methyltransferases (DNMT) [80]. Alterations in the expression or activity of these enzymes can lead to changes in DNA methylation patterns that can trigger alterations in key genes involved in cancer development. For example, Zhang et al. have reported that DNMT1, DNMT3A and DNMT3B show frequency alterations in approximately 3% to 5% of lung cancer patients from the cBioPortal datasets [81]. However, further research is needed to validate the mechanisms in detail, e.g., in organoid in vitro and/or in preclinical in vivo models, to fully understand the mechanisms upstream involved in the aberrant methylation of both clusters and to assess the potential therapeutic applications of targeting them. In addition, we identify relevant miRNA–mRNA interactions in NSCLC patients. In other words, the regulation of the expression of these genes can be partly explained by the activity of these miRNAs; nevertheless, it should be noted that additional mechanisms may also be involved in the regulation of these genes, such as deletion, amplification, mutation, fusion and multiple alterations, and even other miRNAs not included in these clusters, as their regulation can be mediated by the action of many miRNAs. Despite these limitations, this study provides important insights into the consequences of these epigenetic alterations in NSCLC patients and highlights potential targets for future research and therapy. On the other hand, another limitation would be the sample size of patients with COPD included in the study. We have analyzed the DNA methylation pattern of the C19MC and MIR371-3 clusters in a group of COPD patients because they have a three- to six-fold increased risk of developing lung cancer, even if they quit smoking [2]. In our study, we found no statistical differences between the control group without lung cancer and COPD. However, sample size is an important consideration because it may affect the accuracy and reliability of the results. A larger size should be considered to conclude the effect of methylation status of both clusters in this disease.

5. Conclusions

In conclusion, this study demonstrates that the imprinted C19MC and MIR371-3 clusters undergo polycistronic epigenetic regulation that leads to differential tumor expression in NSCLC patients. These differences, in turn, deregulate the expression of important and common target genes, many of them with a clear oncogenic and regulatory role in this disease, highlighting five genes (FOXF2, KLF13, MICA, TCEAL1, TGFBR2) that have also a potential prognostic value in NSCLC patients. All these characteristics make the different components of both clusters an interesting target in oncology that needs to be further investigated; it would even be interesting to evaluate the use of methylation agents as an alternative approach to lung cancer therapy.

Supplementary Materials

The following supporting information can be downloaded at: https://www.mdpi.com/article/10.3390/cancers15051466/s1, Table S1: Characteristics of the study and control cohorts; Table S2: Methylation levels of the C19MC and MIR371-3 clusters in lung cancer versus non-tumoral tissue.

Author Contributions

Conception and design: S.M.-P.; Methodology: L.B., J.F.N.-U., A.C.-P., A.S., M.A., A.S.-G., J.C.B., R.B.-C., L.P.-A. and S.M.-P.; provision of study materials or patients: M.A., A.S.-G., R.B.-C. and L.P.-A.; collection and assembly of data: L.B., A.S., M.A., A.S.-G. and J.C.B.; data analysis and interpretation: L.B. and S.M.-P.; Validation: L.B. and S.M.-P.; supervision: S.M.-P.; Writing—original draft preparation: L.B., J.F.N.-U., A.C.-P., A.S., A.S.-G., M.A., J.C.B., R.B.-C., L.P.-A. and S.M.-P.; Writing—review and editing: L.B. and S.M.-P. Project administration: S.M.-P.; Funding acquisition: S.M.-P. All authors have read and agreed to the published version of the manuscript.

Funding

S.M.-P. was funded by the Ministry of Health and Social Welfare of the Junta de Andalucía (Nicolas Monardes Program RC-0004-2020, and PECART-0091-2020), Andalusian Research, Development and Innovation Plan (PY20_00992), and ISCIII (PI20/01109) and co-funded by FEDER from Regional Development European Funds (European Union). L.B. was funded by the Ministry of Health and Social Welfare of Junta de Andalucía (RH-0051-2020). J.F.N.-U. was funded by a PFIS predoctoral fellowship from ISCIII (F21/00226). J.C.B. was funded by ISCIII (CM20/00178) and co-funded by FEDER from Regional Development European Funds (European Union). RBC was funded by the Andalusian Research, Development and Innovation Plan (PY20_00951) and co-financed by the European Regional Development Fund (ERDF). L.P.-A. was funded by AECC (TRNSC18004PAZ), ISCIII (PI20/00870; AC20/0070) and CIBERONC (CD16/12/00442), and co-funded by FEDER from Regional Development European Funds (European Union).

Institutional Review Board Statement

The study was conducted in accordance with the Declaration of Helsinki, and approved by the Ethics Committee of Virgen del Rocio University Hospital, Seville, Spain (1381-N-21; 01/07/2020).

Informed Consent Statement

Informed consent was obtained from all subjects involved in the study.

Data Availability Statement

The data presented in this study are available in this article and supplementary material.

Acknowledgments

We would like to acknowledge patients and their families for donating tumor tissue. We would also like to thank Carolina Castillo, as well as the Biobank of the Hospital Virgen del Rocío for kindly providing the samples used in this study.

Conflicts of Interest

L.P.-A. has received honoraria for scientific advice and speaker fees from Lilly, Merck Sharp & Dohme, Bristol-Myers Squibb, Roche, PharmaMar, Merck, AstraZeneca, Novartis, Boehringer Ingelheim, Celgene, Servier, Sysmex, Amgen, Incyte, Pfizer, Ipsen, Adacap, Sanofi, Bayer and Blueprint, and participates as an external member on the board of Genómica. He is founder and board member of Altum sequencing and has received institutional support for contracted research from Merck Sharp & Dohme, Bristol-Myers Squibb, AstraZeneca and Pfizer. The remaining authors declare no potential conflicts of interest.

References

  1. Sung, H.; Ferlay, J.; Siegel, R.L.; Laversanne, M.; Soerjomataram, I.; Jemal, A.; Bray, F. Global Cancer Statistics 2020: GLOBOCAN Estimates of Incidence and Mortality Worldwide for 36 Cancers in 185 Countries. CA Cancer J. Clin. 2021, 71, 209–249. [Google Scholar] [CrossRef] [PubMed]
  2. Young, R.P.; Hopkins, R.J.; Christmas, T.; Black, P.N.; Metcalf, P.; Gamble, G.D. COPD Prevalence Is Increased in Lung Cancer, Independent of Age, Sex and Smoking History. Eur. Respir. J. 2009, 34, 380–386. [Google Scholar] [CrossRef] [PubMed] [Green Version]
  3. Young, R.P.; Hopkins, R.J. COPD and Lung Cancer Linked at a Molecular Genetic Level. Chest 2011, 140, 266–267. [Google Scholar] [CrossRef] [PubMed] [Green Version]
  4. Herbst, R.S.; Heymach, J.V.; Lippman, S.M. Lung Cancer. N. Engl. J. Med. 2008, 359, 1367–1380. [Google Scholar] [CrossRef] [Green Version]
  5. Calabrese, F.; Lunardi, F.; Pezzuto, F.; Fortarezza, F.; Vuljan, S.E.; Marquette, C.; Hofman, P. Are There New Biomarkers in Tissue and Liquid Biopsies for the Early Detection of Non-Small Cell Lung Cancer? J. Clin. Med. 2019, 8, 414. [Google Scholar] [CrossRef] [PubMed] [Green Version]
  6. MacFarlane, L.-A.; Murphy, P.R. MicroRNA: Biogenesis, Function and Role in Cancer. Curr. Genomics 2010, 11, 537. [Google Scholar] [CrossRef] [Green Version]
  7. Keller, A.; Fehlmann, T.; Ludwig, N.; Kahraman, M.; Laufer, T.; Backes, C.; Vogelmeier, C.; Diener, C.; Biertz, F.; Herr, C.; et al. Genome-Wide MicroRNA Expression Profiles in COPD: Early Predictors for Cancer Development. Genom. Proteom. Bioinform. 2018, 16, 162–171. [Google Scholar] [CrossRef]
  8. Zhang, Y.; Sui, J.; Shen, X.; Li, C.; Yao, W.; Hong, W.; Peng, H.; Pu, Y.; Yin, L.; Liang, G. Differential Expression Profiles of MicroRNAs as Potential Biomarkers for the Early Diagnosis of Lung Cancer. Oncol. Rep. 2017, 37, 3543–3553. [Google Scholar] [CrossRef] [Green Version]
  9. Ghafouri-Fard, S.; Shoorei, H.; Branicki, W.; Taheri, M. Non-Coding RNA Profile in Lung Cancer. Exp. Mol. Pathol. 2020, 114, 104411. [Google Scholar] [CrossRef]
  10. Zarredar, H.; Ansarin, K.; Baradaran, B.; Shekari, N.; Eyvazi, S.; Safari, F.; Farajnia, S. Critical MicroRNAs in Lung Cancer: Recent Advances and Potential Applications. Anticancer Agents Med. Chem. 2018, 18, 1991–2005. [Google Scholar] [CrossRef]
  11. Quintanal-Villalonga, Á.; Molina-Pinelo, S. Epigenetics of Lung Cancer: A Translational Perspective. Cell. Oncol. 2019, 42, 739–756. [Google Scholar] [CrossRef] [PubMed]
  12. Matouk, I.J.; Halle, D.; Gilon, M.; Hochberg, A. The Non-Coding RNAs of the H19-IGF2 Imprinted Loci: A Focus on Biological Roles and Therapeutic Potential in Lung Cancer. J. Transl. Med. 2015, 13, 113. [Google Scholar] [CrossRef] [PubMed] [Green Version]
  13. Zhang, X.; Li, Y.; Qi, P.; Ma, Z. Biology of MiR-17-92 Cluster and Its Progress in Lung Cancer. Int. J. Med. Sci. 2018, 15, 1443. [Google Scholar] [CrossRef] [PubMed] [Green Version]
  14. Enterina, J.R.; Enfield, K.S.S.; Anderson, C.; Marshall, E.A.; Ng, K.W.; Lam, W.L. DLK1-DIO3 Imprinted Locus Deregulation in Development, Respiratory Disease, and Cancer. Expert Rev. Respir. Med. 2017, 11, 749–761. [Google Scholar] [CrossRef]
  15. Molina-Pinelo, S.; Salinas, A.; Moreno-Mata, N.; Ferrer, I.; Suarez, R.; Andrés-León, E.; Rodríguez-Paredes, M.; Gutekunst, J.; Jantus-Lewintre, E.; Camps, C.; et al. Impact of DLK1-DIO3 Imprinted Cluster Hypomethylation in Smoker Patients with Lung Cancer. Oncotarget 2018, 9, 4395. [Google Scholar] [CrossRef]
  16. Merkerova, M.D.; Remesova, H.; Krejcik, Z.; Loudova, N.; Hrustincova, A.; Szikszai, K.; Cermak, J.; Jonasova, A.; Belickova, M. Relationship between Altered MiRNA Expression and DNA Methylation of the DLK1-DIO3 Region in Azacitidine-Treated Patients with Myelodysplastic Syndromes and Acute Myeloid Leukemia with Myelodysplasia-Related Changes. Cells 2018, 7, 138. [Google Scholar] [CrossRef] [PubMed] [Green Version]
  17. Honda, S.; Chatterjee, A.; Leichter, A.L.; Miyagi, H.; Minato, M.; Fujiyoshi, S.; Ara, M.; Kitagawa, N.; Tanaka, M.; Tanaka, Y.; et al. A MicroRNA Cluster in the DLK1-DIO3 Imprinted Region on Chromosome 14q32.2 Is Dysregulated in Metastatic Hepatoblastomas. Front. Oncol. 2020, 10, 513601. [Google Scholar] [CrossRef]
  18. McCarthy, E.C.; Dwyer, R.M. Emerging Evidence of the Functional Impact of the MiR379/MiR656 Cluster (C14MC) in Breast Cancer. Biomedicines 2021, 9, 827. [Google Scholar] [CrossRef]
  19. Flor, I.; Bullerdiek, J. The Dark Side of a Success Story: MicroRNAs of the C19MC Cluster in Human Tumours. J. Pathol. 2012, 227, 270–274. [Google Scholar] [CrossRef]
  20. Fonseca, Á.Y.G.; Santos, J.G.; Aristizábal-Pachón, A.F. An Overview of C19MC Cluster Subgroup 3 and Cancer. MicroRNA 2021, 10, 154–163. [Google Scholar] [CrossRef]
  21. Shah, J.A.; Khattak, S.; Rauf, M.A.; Cai, Y.; Jin, J. Potential Biomarkers of MiR-371-373 Gene Cluster in Tumorigenesis. Life 2021, 11, 984. [Google Scholar] [CrossRef] [PubMed]
  22. Cao, H.; Yang, C.S.; Rana, T.M. Evolutionary Emergence of MicroRNAs in Human Embryonic Stem Cells. PLoS ONE 2008, 3. [Google Scholar] [CrossRef] [PubMed] [Green Version]
  23. Hromadnikova, I.; Kotlabova, K.; Doucha, J.; Dlouha, K.; Krofta, L. Absolute and Relative Quantification of Placenta-Specific Micrornas in Maternal Circulation with Placental Insufficiency-Related Complications. J. Mol. Diagn. 2012, 14, 160–167. [Google Scholar] [CrossRef] [PubMed]
  24. Wu, S.; Huang, S.; Ding, J.; Zhao, Y.; Liang, L.; Liu, T.; Zhan, R.; He, X. Multiple MicroRNAs Modulate P21Cip1/Waf1 Expression by Directly Targeting Its 3’ Untranslated Region. Oncogene 2010, 29, 2302–2308. [Google Scholar] [CrossRef] [Green Version]
  25. Fornari, F.; Milazzo, M.; Chieco, P.; Negrini, M.; Marasco, E.; Capranico, G.; Mantovani, V.; Marinello, J.; Sabbioni, S.; Callegari, E.; et al. In Hepatocellular Carcinoma MiR-519d Is up-Regulated by P53 and DNA Hypomethylation and Targets CDKN1A/P21, PTEN, AKT3 and TIMP2. J. Pathol. 2012, 227, 275–285. [Google Scholar] [CrossRef]
  26. Zhou, A.D.; Diao, L.T.; Xu, H.; Xiao, Z.D.; Li, J.H.; Zhou, H.; Qu, L.H. β-Catenin/LEF1 Transactivates the MicroRNA-371-373 Cluster That Modulates the Wnt/β-Catenin-Signaling Pathway. Oncogene 2012, 31, 2968–2978. [Google Scholar] [CrossRef] [Green Version]
  27. Bullerdiek, J.; Flor, I. Exosome-Delivered MicroRNAs of “Chromosome 19 MicroRNA Cluster” as Immunomodulators in Pregnancy and Tumorigenesis. Mol. Cytogenet. 2012, 5, 27. [Google Scholar] [CrossRef] [Green Version]
  28. Li, Y.; Liang, M.; Zhang, Y.; Yuan, B.; Gao, W.; Shi, Z.; Bai, J. MiR-93, MiR-373, and MiR-17-5p Negatively Regulate the Expression of TBP2 in Lung Cancer. Front. Oncol. 2020, 10, 526. [Google Scholar] [CrossRef]
  29. Schönberger, S.; Mohseni, M.M.; Ellinger, J.; Tran, G.V.Q.; Becker, M.; Claviez, A.; Classen, C.F.; Hermes, B.; Driever, P.H.; Jorch, N.; et al. MicroRNA-Profiling of MiR-371~373- and MiR-302/367-Clusters in Serum and Cerebrospinal Fluid Identify Patients with Intracranial Germ Cell Tumors. J. Cancer Res. Clin. Oncol. 2023, 149, 791–802. [Google Scholar] [CrossRef]
  30. Xue, Q.; Yang, Y.; Yang, L.; Yan, X.; Shen, Z.; Liu, J.; Xue, J.; Zhao, W.; Liu, X. MiR-371b-5p-Engineered Exosomes Enhances Tumor Inhibitory Effect. Front. Cell Dev. Biol. 2021, 9, 750171. [Google Scholar] [CrossRef]
  31. Assenov, Y.; Müller, F.; Lutsik, P.; Walter, J.; Lengauer, T.; Bock, C. Comprehensive Analysis of DNA Methylation Data with RnBeads. Nat. Methods 2014, 11, 1138–1140. [Google Scholar] [CrossRef] [PubMed] [Green Version]
  32. Maksimovic, J.; Gordon, L.; Oshlack, A. SWAN: Subset-Quantile within Array Normalization for Illumina Infinium HumanMethylation450 BeadChips. Genome Biol. 2012, 13, R44. [Google Scholar] [CrossRef] [PubMed] [Green Version]
  33. Ritchie, M.E.; Diyagama, D.; Neilson, J.; van Laar, R.; Dobrovic, A.; Holloway, A.; Smyth, G.K. Empirical Array Quality Weights in the Analysis of Microarray Data. BMC Bioinform. 2006, 7, 261. [Google Scholar] [CrossRef] [Green Version]
  34. Krzywinski, M.; Schein, J.; Birol, I.; Connors, J.; Gascoyne, R.; Horsman, D.; Jones, S.J.; Marra, M.A. Circos: An Information Aesthetic for Comparative Genomics. Genome Res. 2009, 19, 1639–1645. [Google Scholar] [CrossRef] [PubMed] [Green Version]
  35. Zhou, X.; Li, D.; Lowdon, R.F.; Costello, J.F.; Wang, T. MethylC Track: Visual Integration of Single-Base Resolution DNA Methylation Data on the WashU EpiGenome Browser. Bioinformatics 2014, 30, 2206–2207. [Google Scholar] [CrossRef] [PubMed] [Green Version]
  36. Kern, F.; Aparicio-Puerta, E.; Li, Y.; Fehlmann, T.; Kehl, T.; Wagner, V.; Ray, K.; Ludwig, N.; Lenhof, H.P.; Meese, E.; et al. MiRTargetLink 2.0-Interactive MiRNA Target Gene and Target Pathway Networks. Nucleic Acids Res. 2021, 49, W409–W416. [Google Scholar] [CrossRef] [PubMed]
  37. Huang, H.Y.; Lin, Y.C.D.; Cui, S.; Huang, Y.; Tang, Y.; Xu, J.; Bao, J.; Li, Y.; Wen, J.; Zuo, H.; et al. MiRTarBase Update 2022: An Informative Resource for Experimentally Validated MiRNA-Target Interactions. Nucleic Acids Res. 2022, 50, D222–D230. [Google Scholar] [CrossRef]
  38. Tang, Z.; Kang, B.; Li, C.; Chen, T.; Zhang, Z. GEPIA2: An Enhanced Web Server for Large-Scale Expression Profiling and Interactive Analysis. Nucleic Acids Res. 2019, 47, W556–W560. [Google Scholar] [CrossRef] [Green Version]
  39. Thomas, P.D.; Ebert, D.; Muruganujan, A.; Mushayahama, T.; Albou, L.P.; Mi, H. PANTHER: Making Genome-Scale Phylogenetics Accessible to All. Protein Sci. 2022, 31, 8–22. [Google Scholar] [CrossRef]
  40. Kanehisa, M.; Goto, S.; Furumichi, M.; Tanabe, M.; Hirakawa, M. KEGG for Representation and Analysis of Molecular Networks Involving Diseases and Drugs. Nucleic Acids Res. 2010, 38, D355–D360. [Google Scholar] [CrossRef] [Green Version]
  41. Li, R.; Qu, H.; Wang, S.; Chater, J.M.; Wang, X.; Cui, Y.; Yu, L.; Zhou, R.; Jia, Q.; Traband, R.; et al. CancerMIRNome: An Interactive Analysis and Visualization Database for MiRNome Profiles of Human Cancer. Nucleic Acids Res. 2022, 50, D1139–D1146. [Google Scholar] [CrossRef] [PubMed]
  42. Lánczky, A.; Győrffy, B. Web-Based Survival Analysis Tool Tailored for Medical Research (KMplot): Development and Implementation. J. Med. Internet Res. 2021, 23, e27633. [Google Scholar] [CrossRef] [PubMed]
  43. Hoang, P.H.; Landi, M.T. DNA Methylation in Lung Cancer: Mechanisms and Associations with Histological Subtypes, Molecular Alterations, and Major Epidemiological Factors. Cancers 2022, 14, 961. [Google Scholar] [CrossRef] [PubMed]
  44. Sato, T.; Soejima, K.; Arai, E.; Hamamoto, J.; Yasuda, H.; Arai, D.; Ishioka, K.; Ohgino, K.; Naoki, K.; Kohno, T.; et al. Prognostic Implication of PTPRH Hypomethylation in Non-Small Cell Lung Cancer. Oncol. Rep. 2015, 34, 1137–1145. [Google Scholar] [CrossRef] [PubMed] [Green Version]
  45. Swiatnicki, M.R.; Rennhack, J.P.; Ortiz, M.M.O.; Hollern, D.P.; Perry, A.V.; Kubiak, R.; Riveria Riveria, S.M.; OReilly, S.; Andrechek, E.R. Elevated Phosphorylation of EGFR in NSCLC Due to Mutations in PTPRH. PLoS Genet. 2022, 18, e1010362. [Google Scholar] [CrossRef] [PubMed]
  46. Lin, S.; Cheung, W.K.C.; Chen, S.; Lu, G.; Wang, Z.; Xie, D.; Li, K.; Lin, M.C.M.; Kung, H.F. Computational Identification and Characterization of Primate-Specific MicroRNAs in Human Genome. Comput. Biol. Chem. 2010, 34, 232–241. [Google Scholar] [CrossRef] [PubMed]
  47. Suh, M.R.; Lee, Y.; Kim, J.Y.; Kim, S.K.; Moon, S.H.; Lee, J.Y.; Cha, K.Y.; Chung, H.M.; Yoon, H.S.; Moon, S.Y.; et al. Human Embryonic Stem Cells Express a Unique Set of MicroRNAs. Dev. Biol. 2004, 270, 488–498. [Google Scholar] [CrossRef] [Green Version]
  48. Vaira, V.; Elli, F.; Forno, I.; Guarnieri, V.; Verdelli, C.; Ferrero, S.; Scillitani, A.; Vicentini, L.; Cetani, F.; Mantovani, G.; et al. The MicroRNA Cluster C19MC Is Deregulated in Parathyroid Tumours. J. Mol. Endocrinol. 2012, 49, 115–124. [Google Scholar] [CrossRef] [Green Version]
  49. Ivey, K.N.; Srivastava, D. MicroRNAs as Regulators of Differentiation and Cell Fate Decisions. Cell Stem Cell 2010, 7, 36–41. [Google Scholar] [CrossRef] [Green Version]
  50. Rippe, V.; Dittberner, L.; Lorenz, V.N.; Drieschner, N.; Nimzyk, R.; Sendt, W.; Junker, K.; Belge, G.; Bullerdiek, J. The Two Stem Cell MicroRNA Gene Clusters C19MC and MiR-371-3 Are Activated by Specific Chromosomal Rearrangements in a Subgroup of Thyroid Adenomas. PLoS ONE 2010, 5, e9485. [Google Scholar] [CrossRef]
  51. Vilela-Salgueiro, B.; Barros-Silva, D.; Lobo, J.; Costa, A.L.; Guimarães, R.; Cantante, M.; Lopes, P.; Braga, I.; Oliveira, J.; Henrique, R.; et al. Germ Cell Tumour Subtypes Display Differential Expression of MicroRNA371a-3p. Philos. Trans. R. Soc. Lond. B Biol. Sci. 2018, 373. [Google Scholar] [CrossRef] [PubMed]
  52. Leão, R.; Albersen, M.; Looijenga, L.H.J.; Tandstad, T.; Kollmannsberger, C.; Murray, M.J.; Culine, S.; Coleman, N.; Belge, G.; Hamilton, R.J.; et al. Circulating MicroRNAs, the Next-Generation Serum Biomarkers in Testicular Germ Cell Tumours: A Systematic Review. Eur. Urol. 2021, 80, 456–466. [Google Scholar] [CrossRef]
  53. Zhao, J.J.; Yang, J.; Lin, J.; Yao, N.; Zhu, Y.; Zheng, J.; Xu, J.; Cheng, J.Q.; Lin, J.Y.; Ma, X. Identification of MiRNAs Associated with Tumorigenesis of Retinoblastoma by MiRNA Microarray Analysis. Child’s Nerv. Syst. 2009, 25, 13–20. [Google Scholar] [CrossRef] [PubMed]
  54. Huang, Q.; Gumireddy, K.; Schrier, M.; le Sage, C.; Nagel, R.; Nair, S.; Egan, D.A.; Li, A.; Huang, G.; Klein-Szanto, A.J.; et al. The MicroRNAs MiR-373 and MiR-520c Promote Tumour Invasion and Metastasis. Nat. Cell Biol. 2008, 10, 202–210. [Google Scholar] [CrossRef]
  55. Cho, W.J.; Shin, J.M.; Kim, J.S.; Lee, M.R.; Hong, K.S.; Lee, J.H.; Koo, K.H.; Park, J.W.; Kim, K.S. MiR-372 Regulates Cell Cycle and Apoptosis of Ags Human Gastric Cancer Cell Line through Direct Regulation of LATS2. Mol. Cells 2009, 28, 521–527. [Google Scholar] [CrossRef] [PubMed]
  56. Feber, A.; Xi, L.; Luketich, J.D.; Pennathur, A.; Landreneau, R.J.; Wu, M.; Swanson, S.J.; Godfrey, T.E.; Litle, V.R. MicroRNA Expression Profiles of Esophageal Cancer. J. Thorac. Cardiovasc. Surg. 2008, 135, 255–260. [Google Scholar] [CrossRef] [PubMed] [Green Version]
  57. Volinia, S.; Calin, G.A.; Liu, C.G.; Ambs, S.; Cimmino, A.; Petrocca, F.; Visone, R.; Iorio, M.; Roldo, C.; Ferracin, M.; et al. A MicroRNA Expression Signature of Human Solid Tumors Defines Cancer Gene Targets. Proc. Natl. Acad. Sci. USA 2006, 103, 2257–2261. [Google Scholar] [CrossRef] [Green Version]
  58. Fan, X.; Tao, S.; Li, Q.; Deng, B.; Tan, Q.Y.; Jin, H. The MiR-23a/27a/24-2 Cluster Promotes Postoperative Progression of Early-Stage Non-Small Cell Lung Cancer. Mol. Ther. Oncolytics 2021, 24, 205–217. [Google Scholar] [CrossRef]
  59. Valdmanis, P.N.; Roy-Chaudhuri, B.; Kim, H.K.; Sayles, L.C.; Zheng, Y.; Chuang, C.H.; Caswell, D.R.; Chu, K.; Zhang, Y.; Winslow, M.M.; et al. Upregulation of the MicroRNA Cluster at the Dlk1-Dio3 Locus in Lung Adenocarcinoma. Oncogene 2015, 34, 94–103. [Google Scholar] [CrossRef] [Green Version]
  60. González-Vallinas, M.; Rodríguez-Paredes, M.; Albrecht, M.; Sticht, C.; Stichel, D.; Gutekunst, J.; Pitea, A.; Sass, S.; Sánchez-Rivera, F.J.; Lorenzo-Bermejo, J.; et al. Epigenetically Regulated Chromosome 14q32 MiRNA Cluster Induces Metastasis and Predicts Poor Prognosis in Lung Adenocarcinoma Patients. Mol. Cancer Res. 2018, 16, 390–402. [Google Scholar] [CrossRef] [Green Version]
  61. Hayashita, Y.; Osada, H.; Tatematsu, Y.; Yamada, H.; Yanagisawa, K.; Tomida, S.; Yatabe, Y.; Kawahara, K.; Sekido, Y.; Takahashi, T. A Polycistronic MicroRNA Cluster, MiR-17-92, Is Overexpressed in Human Lung Cancers and Enhances Cell Proliferation. Cancer Res. 2005, 65, 9628–9632. [Google Scholar] [CrossRef] [PubMed] [Green Version]
  62. Yang, C.; Jia, X.; Zhou, J.; Sun, Q.; Ma, Z. The MiR-17-92 Gene Cluster Is a Blood-Based Marker for Cancer Detection in Non-Small-Cell Lung Cancer. Am. J. Med. Sci. 2020, 360, 248–260. [Google Scholar] [CrossRef]
  63. Nguyen, P.N.N.; Huang, C.J.; Sugii, S.; Cheong, S.K.; Choo, K.B. Selective Activation of MiRNAs of the Primate-Specific Chromosome 19 MiRNA Cluster (C19MC) in Cancer and Stem Cells and Possible Contribution to Regulation of Apoptosis. J. Biomed. Sci. 2017, 24, 20. [Google Scholar] [CrossRef] [PubMed] [Green Version]
  64. Wu, S.; Aksoy, M.; Shi, J.; Houbaviy, H.B. Evolution of the MiR-290-295/MiR-371-373 Cluster Family Seed Repertoire. PLoS ONE 2014, 9, e8519. [Google Scholar] [CrossRef]
  65. Bunz, F.; Dutriaux, A.; Lengauer, C.; Waldman, T.; Zhou, S.; Brown, J.P.; Sedivy, J.M.; Kinzler, K.W.; Vogelstein, B. Requirement for P53 and P21 to Sustain G2 Arrest after DNA Damage. Science 1998, 282, 1497–1501. [Google Scholar] [CrossRef] [PubMed]
  66. Jiang, X.; Chen, X.; Chen, L.; Ma, Y.; Zhou, L.; Qi, Q.; Liu, Y.; Zhang, S.; Luo, J.; Zhou, X. Upregulation of the MiR-212/132 Cluster Suppresses Proliferation of Human Lung Cancer Cells. Oncol. Rep. 2015, 33, 705–712. [Google Scholar] [CrossRef] [Green Version]
  67. Li, C.; Lyu, J.; Meng, Q.H. MiR-93 Promotes Tumorigenesis and Metastasis of Non-Small Cell Lung Cancer Cells by Activating the PI3K/Akt Pathway via Inhibition of LKB1/ PTEN/ CDKN1A. J. Cancer 2017, 8, 870–879. [Google Scholar] [CrossRef] [Green Version]
  68. Wang, L.Q.; Yu, P.; Li, B.; Guo, Y.H.; Liang, Z.R.; Zheng, L.L.; Yang, J.H.; Xu, H.; Liu, S.; Zheng, L.S.; et al. MiR-372 and MiR-373 Enhance the Stemness of Colorectal Cancer Cells by Repressing Differentiation Signaling Pathways. Mol. Oncol. 2018, 12, 1949–1964. [Google Scholar] [CrossRef] [Green Version]
  69. Chen, C.H.; Wang, W.J.; Kuo, J.C.; Tsai, H.C.; Lin, J.R.; Chang, Z.F.; Chen, R.H. Bidirectional Signals Transduced by DAPK-ERK Interaction Promote the Apoptotic Effect of DAPK. EMBO J. 2005, 24, 294–304. [Google Scholar] [CrossRef] [Green Version]
  70. Jin, M.; Li, G.; Liu, W.; Wu, X.; Zhu, J.; Zhao, D.; Zeng, Z.; Xiong, M.; Song, Y.; He, X.; et al. Cigarette Smoking Induces Aberrant N6-Methyladenosine of DAPK2 to Promote Non-Small Cell Lung Cancer Progression by Activating NF-ΚB Pathway. Cancer Lett. 2021, 518, 214–229. [Google Scholar] [CrossRef]
  71. Schlegel, C.R.; Fonseca, A.V.; Stöcker, S.; Georgiou, M.L.; Misterek, M.B.; Munro, C.E.; Carmo, C.R.; Seckl, M.J.; Costa-Pereira, A.P. DAPK2 Is a Novel Modulator of TRAIL-Induced Apoptosis. Cell Death Differ. 2014, 21, 1780–1791. [Google Scholar] [CrossRef] [PubMed] [Green Version]
  72. Yang, X.Y.; Zhang, J.; Yu, X.L.; Zheng, G.F.; Zhao, F.; Jia, X.J. Death-Associated Protein Kinase Promoter Methylation Correlates with Clinicopathological and Prognostic Features in Nonsmall Cell Lung Cancer Patients: A Cohort Study. J. Cancer Res. Ther. 2018, 14, S65–S71. [Google Scholar] [CrossRef] [PubMed]
  73. Su, C.M.; Wang, M.Y.; Hong, C.C.; Chen, H.A.; Su, Y.H.; Wu, C.H.; Huang, M.T.; Chang, Y.W.; Jiang, S.S.; Sung, S.Y.; et al. MiR-520h Is Crucial for DAPK2 Regulation and Breast Cancer Progression. Oncogene 2016, 35, 1134–1142. [Google Scholar] [CrossRef] [PubMed]
  74. Zhang, J.; Liu, L.; Sun, Y.; Xiang, J.; Zhou, D.; Wang, L.; Xu, H.; Yang, X.; Du, N.; Zhang, M.; et al. MicroRNA-520g Promotes Epithelial Ovarian Cancer Progression and Chemoresistance via DAPK2 Repression. Oncotarget 2016, 7, 26516–26534. [Google Scholar] [CrossRef] [Green Version]
  75. Li, T.; Wang, H.; Xu, J.; Li, C.; Zhang, Y.; Wang, G.; Liu, Y.; Cai, S.; Fang, W.; Li, J.; et al. TGFBR2 Mutation Predicts Resistance to Immune Checkpoint Inhibitors in Patients with Non-Small Cell Lung Cancer. Ther. Adv. Med. Oncol. 2021, 13, 17588359211038477. [Google Scholar] [CrossRef]
  76. Kong, P.Z.; Li, G.M.; Tian, Y.; Song, B.; Shi, R.Y. Decreased Expression of FOXF2 as New Predictor of Poor Prognosis in Stage I Non-Small Cell Lung Cancer. Oncotarget 2016, 7, 55601–55610. [Google Scholar] [CrossRef] [PubMed] [Green Version]
  77. Zhang, C.; Li, Y.Z.; Dai, D.Q. Aberrant DNA Methylation-Mediated FOXF2 Dysregulation Is a Prognostic Risk Factor for Gastric Cancer. Front. Mol. Biosci. 2021, 8, 645470. [Google Scholar] [CrossRef] [PubMed]
  78. Neel, J.-C.; Humbert, L.; Lebrun, J.-J. The Dual Role of TGFβ in Human Cancer: From Tumor Suppression to Cancer Metastasis. ISRN Mol. Biol. 2012, 2012, 381428. [Google Scholar] [CrossRef] [Green Version]
  79. Lo Sardo, F.; Pulito, C.; Sacconi, A.; Korita, E.; Sudol, M.; Strano, S.; Blandino, G. YAP/TAZ and EZH2 Synergize to Impair Tumor Suppressor Activity of TGFBR2 in Non-Small Cell Lung Cancer. Cancer Lett. 2021, 500, 51–63. [Google Scholar] [CrossRef]
  80. Feng, S.; Jacobsen, S.E.; Reik, W. Epigenetic Reprogramming in Plant and Animal Development. Science 2010, 330, 622–627. [Google Scholar] [CrossRef] [Green Version]
  81. Zhang, J.; Yang, C.; Wu, C.; Cui, W.; Wang, L. DNA Methyltransferases in Cancer: Biology, Paradox, Aberrations, and Targeted Therapy. Cancers 2020, 12, 2123. [Google Scholar] [CrossRef] [PubMed]
Figure 1. Methylation profiles of the C19MC and MIR371-3 miRNA clusters in lung cancer. (A) Circos plot showing the methylation levels on chromosome 19. From inside to outside: methylation levels, ideogram and gene labels. Hypermethylation (red dots and green background) and hypomethylation events (green dots and red background) in patients with lung cancer versus paired non-tumoral samples. NA: Not available. (B) Observed methylation changes (log2 ratio) in the C19MC cluster. Relative levels of methylation in patients with lung cancer relative to the control group are represented in blue bars, whereas methylation levels of COPD patients without lung cancer compared to the non-tumoral control group are represented by red bars. A grey background represents statistically significant differences (adjusted p-value < 0.05) of methylation levels relative to the control group. (C) Observed methylation changes (log2 ratio) in the MIR371-3 cluster. Relative levels of methylation in patients with lung cancer relative to the control group are represented in blue bars, whereas methylation levels of COPD patients without lung cancer compared to the non-tumoral control group are represented by red bars. A grey background represents statistically significant differences (adjusted p-value < 0.05) of methylation levels in comparison to the non-tumoral control group.
Cancers 15 01466 g001aCancers 15 01466 g001b
Figure 2. Transcriptional mapping of the C19MC and MIR371-3 clusters on the reference human genome hg19. (A) Chromosome 19 ideogram. The C19MC and MIR371-3 clusters are located on 19q13.42. The exact position of the cluster in the region is marked with a blue square. (B) Chromosome position. Base pairs of the C19MC and MIR371-3 clusters on chromosome 19 (highlighted in yellow). Transcriptional mechanisms underlying the expression of both clusters, such as transcription start sites (TSS), enhancer regions (Enh), zinc finger (ZNF), packed form of DNA and polycomb group proteins. (C) CpG islands in the C19MC and MIR371-3 clusters (green lines). (D) Genomic distribution of CpG sites in the C19MC and MIR371-3 clusters (white lines). (E) CG percentage in the C19MC and MIR371-3 clusters (blue). Finally, the reference sequences of the members of the C19MC and MIR371-3 cluster are represented at the bottom.
Cancers 15 01466 g002
Figure 3. Methylation levels of the C19MC and MIR371-3 clusters components according to the histological subtype of lung cancer. (A) C19MC methylation levels in patients with squamous cell carcinoma (SCC) relative to the control group is represented in purple bars, whereas methylation levels in patients with adenocarcinoma (ADC) compared to the control group are represented in orange bars. (B) Relative MIR371-3 methylation levels in patients with SCC (purple) and ADC (orange) relative to the control group. Relative methylation changes in β values (log2) are represented on the y-axis.
Cancers 15 01466 g003
Figure 4. miRNAs–target genes network. Strong interactions are displayed for experimentally validated target genes and the components of the C19MC (A) and MIR371-3. (B) clusters generated by miRTargetLink 2.0. Network layout: Random. Nodes are represented as circles: miRNAs (blue) and target genes (green).
Cancers 15 01466 g004
Figure 5. Transcripts per million (TPM) in normal (green) and tumor (red) lung tissues of those genes identified as strongly validated miRNA targets. (A) C19MC cluster and (B) MIR371-3 cluster. T: Tumor Tissue; N: Normal Tissue; ADC: Adenocarcinoma Lung; SCC: Squamous Cell Carcinoma. * ANOVA test with p-value < 0.01.
Cancers 15 01466 g005aCancers 15 01466 g005b
Figure 6. Classification of validated targets by gene ontology (GO) molecular function and biological processes. Summary of molecular functions and biological processes for validated target genes of miRNAs included in both clusters.
Cancers 15 01466 g006
Figure 7. miRNA–target correlations in lung primary tumors. Significant negative correlations between miRNA–target for the C19MC and MIR371-3 miRNA clusters in (A) ADC and (B) SCC lung primary tumors. r: Pearson’s correlation coefficient; n: sample size, ADC: Lung Adenocarcinoma; SCC: Lung Squamous. p-values lower than 0.05 were considered statistically significant.
Cancers 15 01466 g007aCancers 15 01466 g007b
Figure 8. Clinical outcomes significantly associated with target gene expression in lung cancer. The Kaplan–Meier survival plots were obtained using the Kaplan–Meier plotter website. HR: hazard ratio.
Cancers 15 01466 g008
Table 1. Statistically differences of the methylation levels of C19MC and MIR371-3 clusters between human lung tumor samples and normal lung.
GenesRelative Methylation Changes (log2)Adjusted p-Value
C19MCmiR-512-1−0.3076.3946 × 10−14
miR-512-2−0.3417.2597 × 10−9
miR-1323−0.2451.0347 × 10−6
miR-498−0.2412.7704 × 10−5
miR-520e−0.2145.7827 × 10−5
miR-515-1−0.3462.0661 × 10−12
miR-519e−0.3403.1486 × 10−11
miR-520f−0.4024.644 × 10−13
miR-515-2−0.2582.686 × 10−9
miR-519c−0.2642.9066 × 10−10
miR-1283-1−0.6014.8535 × 10−17
miR-520a−0.2794.1063 × 10−11
miR-526b−0.3295.2657 × 10−14
miR-519b−0.3481.5969 × 10−15
miR-525−0.3601.2282 × 10−10
miR-523−0.2671.1234 × 10−11
miR-518f−0.3687.9986 × 10−15
miR-520b−0.4414.5322 × 10−16
miR-518b−0.2901.7394 × 10−9
miR-526a1−0.4743.4512 × 10−14
miR-520c−0.5904.7234 × 10−18
miR-518c−0.2716.5541 × 10−9
miR-524−0.2611.5518 × 10−12
miR-517a−0.1291.6843 × 10−5
miR-519d−0.1403.7082 × 10−5
miR-521-2−0.3431.1838 × 10−14
miR-520d−0.3782.9354 × 10−13
miR-517b−0.3272.6624 × 10−12
miR-520g−0.2939.6092 × 10−11
miR-516b2−0.2151.1738 × 10−8
miR-526a2−0.3039.5413 × 10−10
miR-518e−0.1686.8329 × 10−7
miR-518a1−0.1397.0465 × 10−5
miR-518d−0.4122.144 × 10−12
miR-516b1−0.2699.8287 × 10−10
miR-518a2−0.3642.9253 × 10−14
miR-517c−0.1991.476 × 10−10
miR-520h−0.2112.5861 × 10−10
miR-521-1−0.1838.9968 × 10−5
miR-522−0.2355.605 × 10−10
miR-519a1−0.2179.8489 × 10−11
miR-527−0.1307.4475 × 10−9
miR-516a1−0.4002.5393 × 10−9
miR-1283-2−0.4532.9539 × 10−13
miR-516a2−0.3403.3131 × 10−16
miR-519a2−0.3441.2518 × 10−14
MIR371-3miR-371b−0.2091.4784 × 10−8
miR-371a−0.1067.6971 × 10−7
miR-372−0.1067.6971 × 10−7
miR-373−0.1371.183 × 10−7
Table 2. Common miRNA–target interactions for both C19MC and MIR371-2 miRNA clusters.
GeneGene DescriptionmiRNA
BTG1B-Cell Translocation Gene 1miRNA-372-3p, miRNA-373-3p
CD44Cluster of Differentiation 44miRNA-520a-3p, miRNA-520c-3p, miRNA-373-3p
CDK2Cyclin Dependent Kinase 2miRNA-524-5p, miRNA-372-3p
CDKN1ACyclin Dependent Kinase Inhibitor 1AmiRNA-512-5p, miRNA-515-3p, miRNA-519a-3p, miRNA-519b-3p, miRNA-519d-3p, miRNA-519e-3p, miRNA-520a-3p, miRNA-520h, miRNA-373-3p
DAPK2Death Associated Protein Kinase 2miRNA-520h, miRNA-520g-3p
DKK1Dickkopf WNT Signaling Pathway Inhibitor 1miRNA-371a-3p, miRNA-372-3p, miRNA-373-3p
ELAVL1ELAV (Embryonic Lethal, Abnormal Vision, Drosophila)-Like RNA Binding Protein 1miRNA-519a-3p, miRNA-519b-3p
LATS2Large Tumor Suppressor Kinase 2miRNA-372-3p, miRNA-373-3p
LEFTY1Left-Right Determination Factor 1miRNA-372-3p, miRNA-373-3p
MCL1Myeloid Cell Leukemia Sequence 1miRNA-512-5p, miRNA-518a-5p
MMP2Matrix Metallopeptidase 2miRNA-519d-3p, miRNA-520g-3p, miRNA-524-5p
MTORMechanistic Target of Rapamycin KinasemiRNA-520c-3p, miRNA-373-3p
NFIBNuclear Factor I BmiRNA-372-3p, miRNA-373-3p
PTENPhosphatase and Tensin HomologmiRNA-518c-3p, miRNA-519a-3p, miRNA-519d-3p
PTK2BProtein Tyrosine Kinase 2 BetamiRNA-517a-3p, miRNA-517c-3p
SIRT1Sirtuin 1miRNA-520c-3p, miRNA-373-3p
SAMD7Sterile Alpha Motif Domain Containing 7miRNA-519d-3p, miRNA-520g-3p
STAT3Signal Transducer and Activator of Transcription 3miRNA-519a-3p, miRNA-519g-3p, miRNA-520c-3p
TGFBR2Transforming Growth Factor Beta Receptor 2miRNA-520a-3p, miRNA-372-3p, miRNA-373-3p
TNFAIP1Tumor Necrosis Factor Alpha-Induced Protein 1miRNA-372-3p, miRNA-373-3p
VEGFAVascular Endothelial Growth Factor AmiRNA-520g-3p, miRNA-520h, miRNA-372-3p, miRNA-373-3p
Table 3. Target genes with significant expression differences in NSCLC tissue compared to normal lung tissue.
SymbolDescription
ARRB1Arrestin Beta 1
AKT3AKT Serine/Threonine Kinase 3
CCL2C-C Motif Chemokine Ligand 2
CDKN1ACyclin Dependent Kinase Inhibitor 1A
DAPK2Death Associated Protein Kinase 2
DICER1Double-Stranded RNA-Specific Endoribonuclease
FOXF2Forkhead Box F2
GPC3Glypican 3
JAG1Jagged Canonical Notch Ligand 1
JAK1Janus Kinase 1
KLF13Kruppel Like Factor 13
LEFTY2Left-Right Determination Factor 2
LATS2Large Tumor Suppressor Kinase 2
MBNL2Muscleblind-Like Protein 2
MCL1Myeloid Cell Leukemia Sequence 1
MICAMajor Histocompatibility Complex Class I Chain-Related Protein A
MMP2Matrix Metallopeptidase 2
NFIBMechanistic Target of Rapamycin Kinase (MTOR), Nuclear Factor I B
NR4A2Nuclear Receptor Subfamily 4 Group A Member 2
PIK3C2APhosphatidylinositol-4-Phosphate 3-Kinase Catalytic Subunit Type 2 Alpha
PLCB4Phospholipase C Beta 4
PTK2BProtein Tyrosine Kinase 2 Beta
TCEAL1Transcription Elongation Factor A Like 1
TEAD4TEA Domain Transcription Factor 4
TGFBR2Transforming Growth Factor Beta Receptor 2
TIMP2Tissue Inhibitor of Metalloproteinases 2
TXNIPThioredoxin Interacting Protein
RASSF1Ras Association Domain Family Member 1
RECKReversion Inducing Cysteine Rich Protein with Kazal Motifs
SMAD7SMAD (small Mothers Against Decapentaplegic) family member 7
STX12Syntaxin 12
Disclaimer/Publisher’s Note: The statements, opinions and data contained in all publications are solely those of the individual author(s) and contributor(s) and not of MDPI and/or the editor(s). MDPI and/or the editor(s) disclaim responsibility for any injury to people or property resulting from any ideas, methods, instructions or products referred to in the content.

