Article

Increased Expression Levels of Netrin-1 in Visceral Adipose Tissue during Obesity Favour Colon Cancer Cell Migration

1
Metabolic Research Laboratory, Clínica Universidad de Navarra, 31008 Pamplona, Spain
2
CIBER Fisiopatología de la Obesidad y Nutrición (CIBEROBN), Instituto de Salud Carlos III, 31008 Pamplona, Spain
3
Obesity and Adipobiology Group, Instituto de Investigación Sanitaria de Navarra (IdiSNA), 31008 Pamplona, Spain
4
Department of Surgery, Clínica Universidad de Navarra, 31008 Pamplona, Spain
5
Department of Anesthesia, Clínica Universidad de Navarra, 31008 Pamplona, Spain
6
Department of Histology and Pathology, Universidad de Navarra, 31008 Pamplona, Spain
7
Department of Endocrinology & Nutrition, Clínica Universidad de Navarra, 31008 Pamplona, Spain
8
School of Cardiovascular & Metabolic Medicine and Sciences, British Heart Foundation Centre of Research Excellence, King’s College London, London SE1 9NH, UK
*
Authors to whom correspondence should be addressed.
Cancers 2023, 15(4), 1038; https://doi.org/10.3390/cancers15041038
Submission received: 12 December 2022 / Revised: 1 February 2023 / Accepted: 2 February 2023 / Published: 7 February 2023

Abstract

:

Simple Summary

Netrin-1 (NTN-1) regulates obesity-associated low-grade inflammation, being also involved in the control of cell migration and proliferation. We aim to study whether excess visceral adipose tissue in patients with obesity and colon cancer is associated with increased NTN1 and the expression levels of its main receptors, promoting an inflammatory microenvironment that favours colon cancer development. Increased expression levels of NTN1 and its receptor NEO1 in the visceral adipose tissue from patients with obesity and colon cancer together with elevated DCC and UNC5B mRNA levels in patients with colon cancer were found. Moreover, the treatment of colorectal cancer cells with NTN-1 and with the adipocyte-derived secretome obtained from patients with obesity increased the migration of colorectal cancer cells. These results suggest that NTN-1 plays an important role in obesity-associated colon cancer development.

Abstract

Netrin (NTN)-1, an extracellular matrix protein with a crucial role in inflammation, is dysregulated during obesity (OB) and influences colon cancer (CC) progression. To decipher the mechanisms underlying CC development during obesity, we examined the expression of NTN1 and its receptors in the visceral adipose tissue (VAT) of 74 (25 normal weight (NW)) (16 with CC) and 49 patients with OB (12 with CC). We also evaluated the effect of caloric restriction (CR) on the gene expression levels of Ntn1 and its receptors in the colon from a rat model fed a normal diet. The impact of adipocyte-conditioned media (ACM) from patients with OB and NTN-1 was assessed on the expression levels of neogenin 1(NEO1), deleted in colorectal carcinomas (DCC) and uncoordinated-5 homolog B (UNC5B) in Caco-2 and HT-29 human colorectal cell lines, as well as on Caco-2 cell migration. Increased NTN1 and NEO1 mRNA levels in VAT were due to OB (p < 0.05) and CC (p < 0.001). In addition, an upregulation in the expression levels of DCC and UNC5B in patients with CC (p < 0.01 and p < 0.05, respectively) was observed. Decreased (p < 0.01) Ntn1 levels in the colon from rats submitted to CR were found. In vitro experiments showed that ACM increased DCC (p < 0.05) and NEO1 (p < 0.01) mRNA levels in HT-29 and Caco-2 cell lines, respectively, while UNC5B decreased (p < 0.01) in HT-29. The treatment with NTN-1 increased (p < 0.05) NEO1 mRNA levels in HT-29 cells and DCC (p < 0.05) in both cell lines. Finally, we revealed a potent migratory effect of ACM and NTN-1 on Caco-2 cells. Collectively, these findings point to increased NTN-1 during OB and CC fuelling cancer progression and exerting a strong migratory effect on colon cancer cells.

1. Introduction

Colorectal cancer (CRC) constitutes the third most common diagnosed cancer and the second in mortality rates, with more than half of all cases and deaths being attributed to potentially preventable risk factors [1,2]. Particularly, overweight and obesity account for 11% of CRC cases in Europe, and excess body fat is associated with a relative risk of 1.3 of CRC development [1,2,3,4,5]. Different factors are considered to associate obesity and colon carcinogenesis, including increased insulin-like growth factor (IGF)-1 axis signalling, sex hormone alterations, gut dysbiosis, increased hypoxia and fibrosis, changes in the adipocyte-derived cytokines, and the low-grade chronic inflammatory state [6,7]. Of interest, netrin-1 (NTN-1), a multifunctional secreted glycoprotein member of the neuronal guidance proteins, mediates crucial functions in inflammation [8,9], as well as in cell migration and proliferation [10,11], by signalling through different receptors including neogenin-1 (NEO-1), deleted in colorectal carcinomas (DCC), and uncoordinated-5 homolog family members (UNC5A, UNC5B, UNC5C, and UNC5D) [12].
The involvement of NTN-1 in the regulation of obesity-associated pathologies has been extensively demonstrated [8,9,13,14]. NTN-1 is highly expressed in the adipose tissue (AT) of humans and animal models with obesity, regulating macrophage accumulation and promoting chronic inflammation and insulin resistance [14,15]. In addition, NTN-1 has been described as a survival factor in a wide range of aggressive cancers including metastatic breast, pancreatic, lung, or liver cancer [11,16,17]. NTN-1 also plays a critical role in CRC development [10,18]. Increased circulating levels of NTN-1 in patients with CRC have been reported [19], being highest in the last stages and during the invasive tumoral phases [11,20]. NTN-1 has been identified as a direct target of the transcription factor nuclear factor κ B (NFκB), strengthening its involvement as a mediator between inflammation and tumour development [21,22]. Furthermore, the upregulation of NTN1 gene expression levels together with the loss of its tumour suppressor receptors DCC and UNC5B has been associated with the inhibition of cell death, leading to the spontaneous formation of gastrointestinal neoplastic lesions [10,20,22,23]. In this line, the expression levels of Ntn1 were upregulated in the colon from mice containing a germline mutation in the adenomatous polyposis coli (Apc) gene, as well as in azoxymethane and dextran sulphate models of colitis-associated colon cancer (CC), inhibiting colonic epithelial cell apoptosis and promoting the development of high-grade colon adenomas [10,18].
Despite growing epidemiological studies supporting a causal association between obesity and cancer development, the molecular basis remains unclear. We hypothesised that dysfunctional visceral AT (VAT) in patients with obesity is associated with increased NTN1 expression levels promoting an inflammatory microenvironment that favours CC development. Thus, we first investigated whether the expression of NTN1 and its receptors are influenced by obesity and CC in human VAT. We further evaluated the effect of caloric restriction on Ntn1 gene expression levels in the colon of a rat model. Subsequently, we compared the impact of the adipocyte-derived secretome from patients with obesity and NTN-1 on the expression levels of NEO1, DCC, and UNC5B in two human colorectal cell lines, Caco-2 and HT-29. Finally, the migratory effect of the adipocyte-conditioned media (ACM) and NTN-1 on Caco-2 cells was assessed in real time.

2. Materials and Methods

2.1. Study Population

Seventy-four (25 normal weight (NW) (16 with CC) and 49 patients living with obesity (OB) (12 with CC)) recruited from healthy volunteers and patients at the Clínica Universidad de Navarra were included in the study. The inclusion criteria were 18–65-year-old males and females, body mass index (BMI) between 18.5–24.9 kg/m2 for NW subjects and BMI ≥30.0 kg/m2 for volunteers with OB, absence of psychiatric pathology, validated diagnosis of CC for patients included in the CC group, and written informed consent for participation in the study. The exclusion criteria were infectious/inflammatory diseases, severe nephropathy, pregnancy or lactation, and people whose freedom is under legal or administrative requirement. Body weight was measured with a digital scale to the nearest 0.1 kg and height was calculated with a Harpenden stadiometer to the nearest 0.1 cm (Holtain Ltd., Crymych, UK) as previously described [24]. BMI was calculated dividing kilograms of weight by the square of the height in meters. The CUN-BAE formula was used to estimate body fat (BF) [25]. The pathological characteristics of the subjects with CC included in the study are displayed in Table S1.
The experimental design was approved, from an ethical and scientific perspective, by the Universidad de Navarra’s Ethical Committee responsible for research (2019.089). Informed consents were obtained voluntarily from all participants. The study was carried out in accordance with the Declaration of Helsinki’s ethical guidelines.

2.2. Surgical Procedures, Sample Collection, and Analytical Measurements

VAT samples were collected as previously reported [26] from patients undergoing Nissen fundoplication (NW volunteers, n = 9), Roux-en-Y gastric bypass (patients with OB, n = 37), and curative resection for primary colon carcinoma (patients with CC, n = 28).
Plasma and serum samples were obtained in the morning following a 12 h fast to ensure the absence of biochemical and hormonal alterations. Serum glucose, triglyceride, and C-reactive protein (CRP) concentrations were analysed by enzymatic spectrophotometric reactions using an automated analyser (Hitachi Modular P800, Roche, Basel, Switzerland). Circulating levels of the intestinal damage biomarkers calprotectin subunit S100 calcium-binding protein A8 (S100A8) (R&D Systems, Abingdon, UK), lactoferrin (Invitrogen, Carlsbad, CA, USA), and C-C motif chemokine ligand 5 (CCL5) (R&D Systems) concentrations were determined by commercially available ELISA kits following the manufacturer’s instructions. The mean intra-assay and inter-assay coefficient of variations were 3.4% and 4.6% for S100A8, 10% and 12% for lactoferrin, and 2.3% and 6.5% for CCL5, respectively.

2.3. Experimental Animals

Ten-week-old male Wistar rats (n = 40) (bred in the University of Navarra animal facility) were individually housed in a ventilated room (at least 15 complete air changes/h) with relative humidity (50 ± 10%), at a controlled temperature (22 ± 2 °C) and a 12:12 h light–dark cycle (lights on at 8:00 am). Rats were fed ad libitum with a normal chow diet (ND, n = 20) (Diet 2014S, Harlan Laboratories Inc., Barcelona, Spain) or a high-fat diet (HFD, n = 20) (Diet F3282, Bio-Serv, Frenchtown, NJ, USA) for 16 weeks as previously described [27]. The animals’ weight and food intake were registered on a weekly basis. Rats under ND and HFD were randomly assigned into two groups (n = 10 each) to analyse the effect of a 25% caloric restriction (CR) (ND/CR and HFD/CR). Following all procedures, rats were sacrificed by decapitation after an 8 h fast, and the colon was removed and stored at −80 °C until the next experiments. All experimental protocols adhered to the European Guidelines for the Care and Use of Laboratory Animals (directive 2010/63/EU) and were approved by the Ethics Committee for Animal Experimentation of the University of Navarra (049/10).

2.4. Human Adipocyte and Colon Adenocarcinoma Cell Cultures

Stromal vascular fraction cells (SVFC) from patients with OB were isolated from VAT and differentiated to adipocytes, as previously described [28]. To prepare the ACM, the supernatant of differentiated adipocytes was collected, centrifuged at 200 g for 15 min and frozen at −80 °C. Two colorectal adenocarcinoma cell lines, HT-29 (HTB-38TM) and Caco-2 (HTB-37TM), were provided by the ATCC® (Washington DC, NW, USA) and cultured according to the manufacturer’s instructions. The Caco-2 cell line was kindly gifted by Dr. Amaya Azqueta from the University of Navarra. Briefly, HT-29 and Caco-2 cells were seeded at 3 × 10⁵ cells/well and grown in McCoy’s 5A medium with L-glutamine (Merck, Darmstadt, Germany) and DMEM/F-12 [1:1] (Invitrogen), respectively, supplemented with 10% of new-born-calf serum (Merck) and antibiotic–antimycotic (Invitrogen) at 37 °C for 72 h. Both types of tumour colorectal cells were serum starved for 2 h and then treated with ACM (20% and 40%) and NTN-1 (200 ng/mL and 500 ng/mL) (R&D Systems) for 24 h.

2.5. Analysis of Gene Expression Levels

Human VAT and rat colon samples were homogenised with an Ultra-Turrax® T25 basic (IKA-Werke GmbH, Staugen, Germany). Total RNA was isolated using the QIAzol® reagent (Qiagen, Hilden, Germany) for VAT and adipocytes, and the TRIzol® reagent (Invitrogen) for colon samples, as well as Caco-2 and HT-29 cell lines. Samples were purified using the RNeasy Mini kit (Qiagen) and treated with DNase I (Qiagen) to remove genomic DNA, as previously reported [29]. For the cDNA synthesis, 2 µg of total RNA were transformed to cDNA using random hexamers (Roche) as primers and 200 units of M-MLV reverse transcriptase (Invitrogen).
Transcription levels of apoptosis-associated speck-like protein containing a CARD (ASC), DCC, NEO1, interleukin (IL)-1β (IL1B), IL18, NLR family pyrin domain containing 6 (NLRP6), NTN1, and UNC5B were quantified by Real-Time PCR (7300 Real Time PCR System, Applied Biosystem, Foster City, CA, USA). Primers and probes (Merck) were designed using Primer Express 2.0 software (Applied Biosystems, Foster City, CA, USA) (Table S2). The probes covered the ends of two exons to prevent amplification of the genomic DNA. The cDNA was amplified as previously described [30]. Primer and probe concentrations for gene amplification were 300 nM and 200 nM, respectively. The results were normalised to the levels of the ribosomal 18S rRNA (Applied Biosystems) and relative quantification was calculated with the ∆∆Ct formula. Relative mRNA expression was expressed as a fold increase over the calibrator sample (average of gene expression corresponding to the NW group without CC, ND fed rats, or unstimulated cells), as previously described [31]. The mean values of the samples were calculated after they were analysed in duplicate.

2.6. Migration Assay

Caco-2 cell migration in response to NTN-1, ACM and IL-8 stimuli was measured with the electronic-impedance-based xCELLigence real-time cell migration assay system (Roche Applied Science, San Diego, CA, USA) monitoring every 5 min. Caco-2 cells were grown in DMEM/F-12 media (Invitrogen) supplemented with 2% FBS (Merck) at 37 °C for 24 h. Next, 1 × 10⁵ cells were directly placed on top of the 8 µm microporous polyethylene terephthalate (PET) membrane of the 16-well cell invasion and migration (CIM) plates (Roche Applied Science) previously covered with DMEM/F-12 media containing 2% FBS. Cells were serum starved for 2 h before treatment. The lower chamber was filled with DMEM/F-12 media containing 2% FBS with either NTN-1 (200 ng/mL and 500 ng/mL, R&D Systems), ACM (20% and 40%), or IL-8 (100 ng/mL, R&D Systems) as chemo-attractants for cells. The chemokine IL-8 was used as a positive control because of its known role in the migration of in vitro colon cancer cell models [32,33]. The impedance sensors automatically detected cells as they migrated and attached to the impedance microelectrodes in the lower chamber. The impedance of electron flow caused by adherent cells was reported using a unitless parameter called cell index (CI). After cell migration for 20 h, RTCA Software Pro version 2.2 (San Diego, CA, USA) was used to determine the number of cells that reached the lower chamber, as well as data display and analysis [34,35]. The experiment was repeated three times in quadruplicate.

2.7. Data and Statistical Analysis

Data are displayed as mean ± SEM. Due to the non-normal distribution, gene expression levels were logarithmically transformed. To examine the influence of our two categorical factors, namely OB and CC, two-way ANCOVA (age as covariable) was used. In the case of interaction between factors (P OBxCC < 0.05), one-way ANOVA followed by Tukey’s post hoc tests were applied. One-way ANOVA followed by Dunnett’s post hoc tests were used to evaluate differences in the in vitro experiments, and two-tailed unpaired Student’s t-tests were applied to analyse differences in the animal model. Pearson’s correlation coefficient (r) was used to analyse the association between variables. The calculations were performed with the SPSS/Windows version 15.0 statistical package (SPSS, Chicago, IL, USA), and graphs were generated with GraphPad Prism version 8.3 (GraphPad Software, Inc., San Diego, CA, USA). A p value <0.05 was considered statistically significant.

3. Results

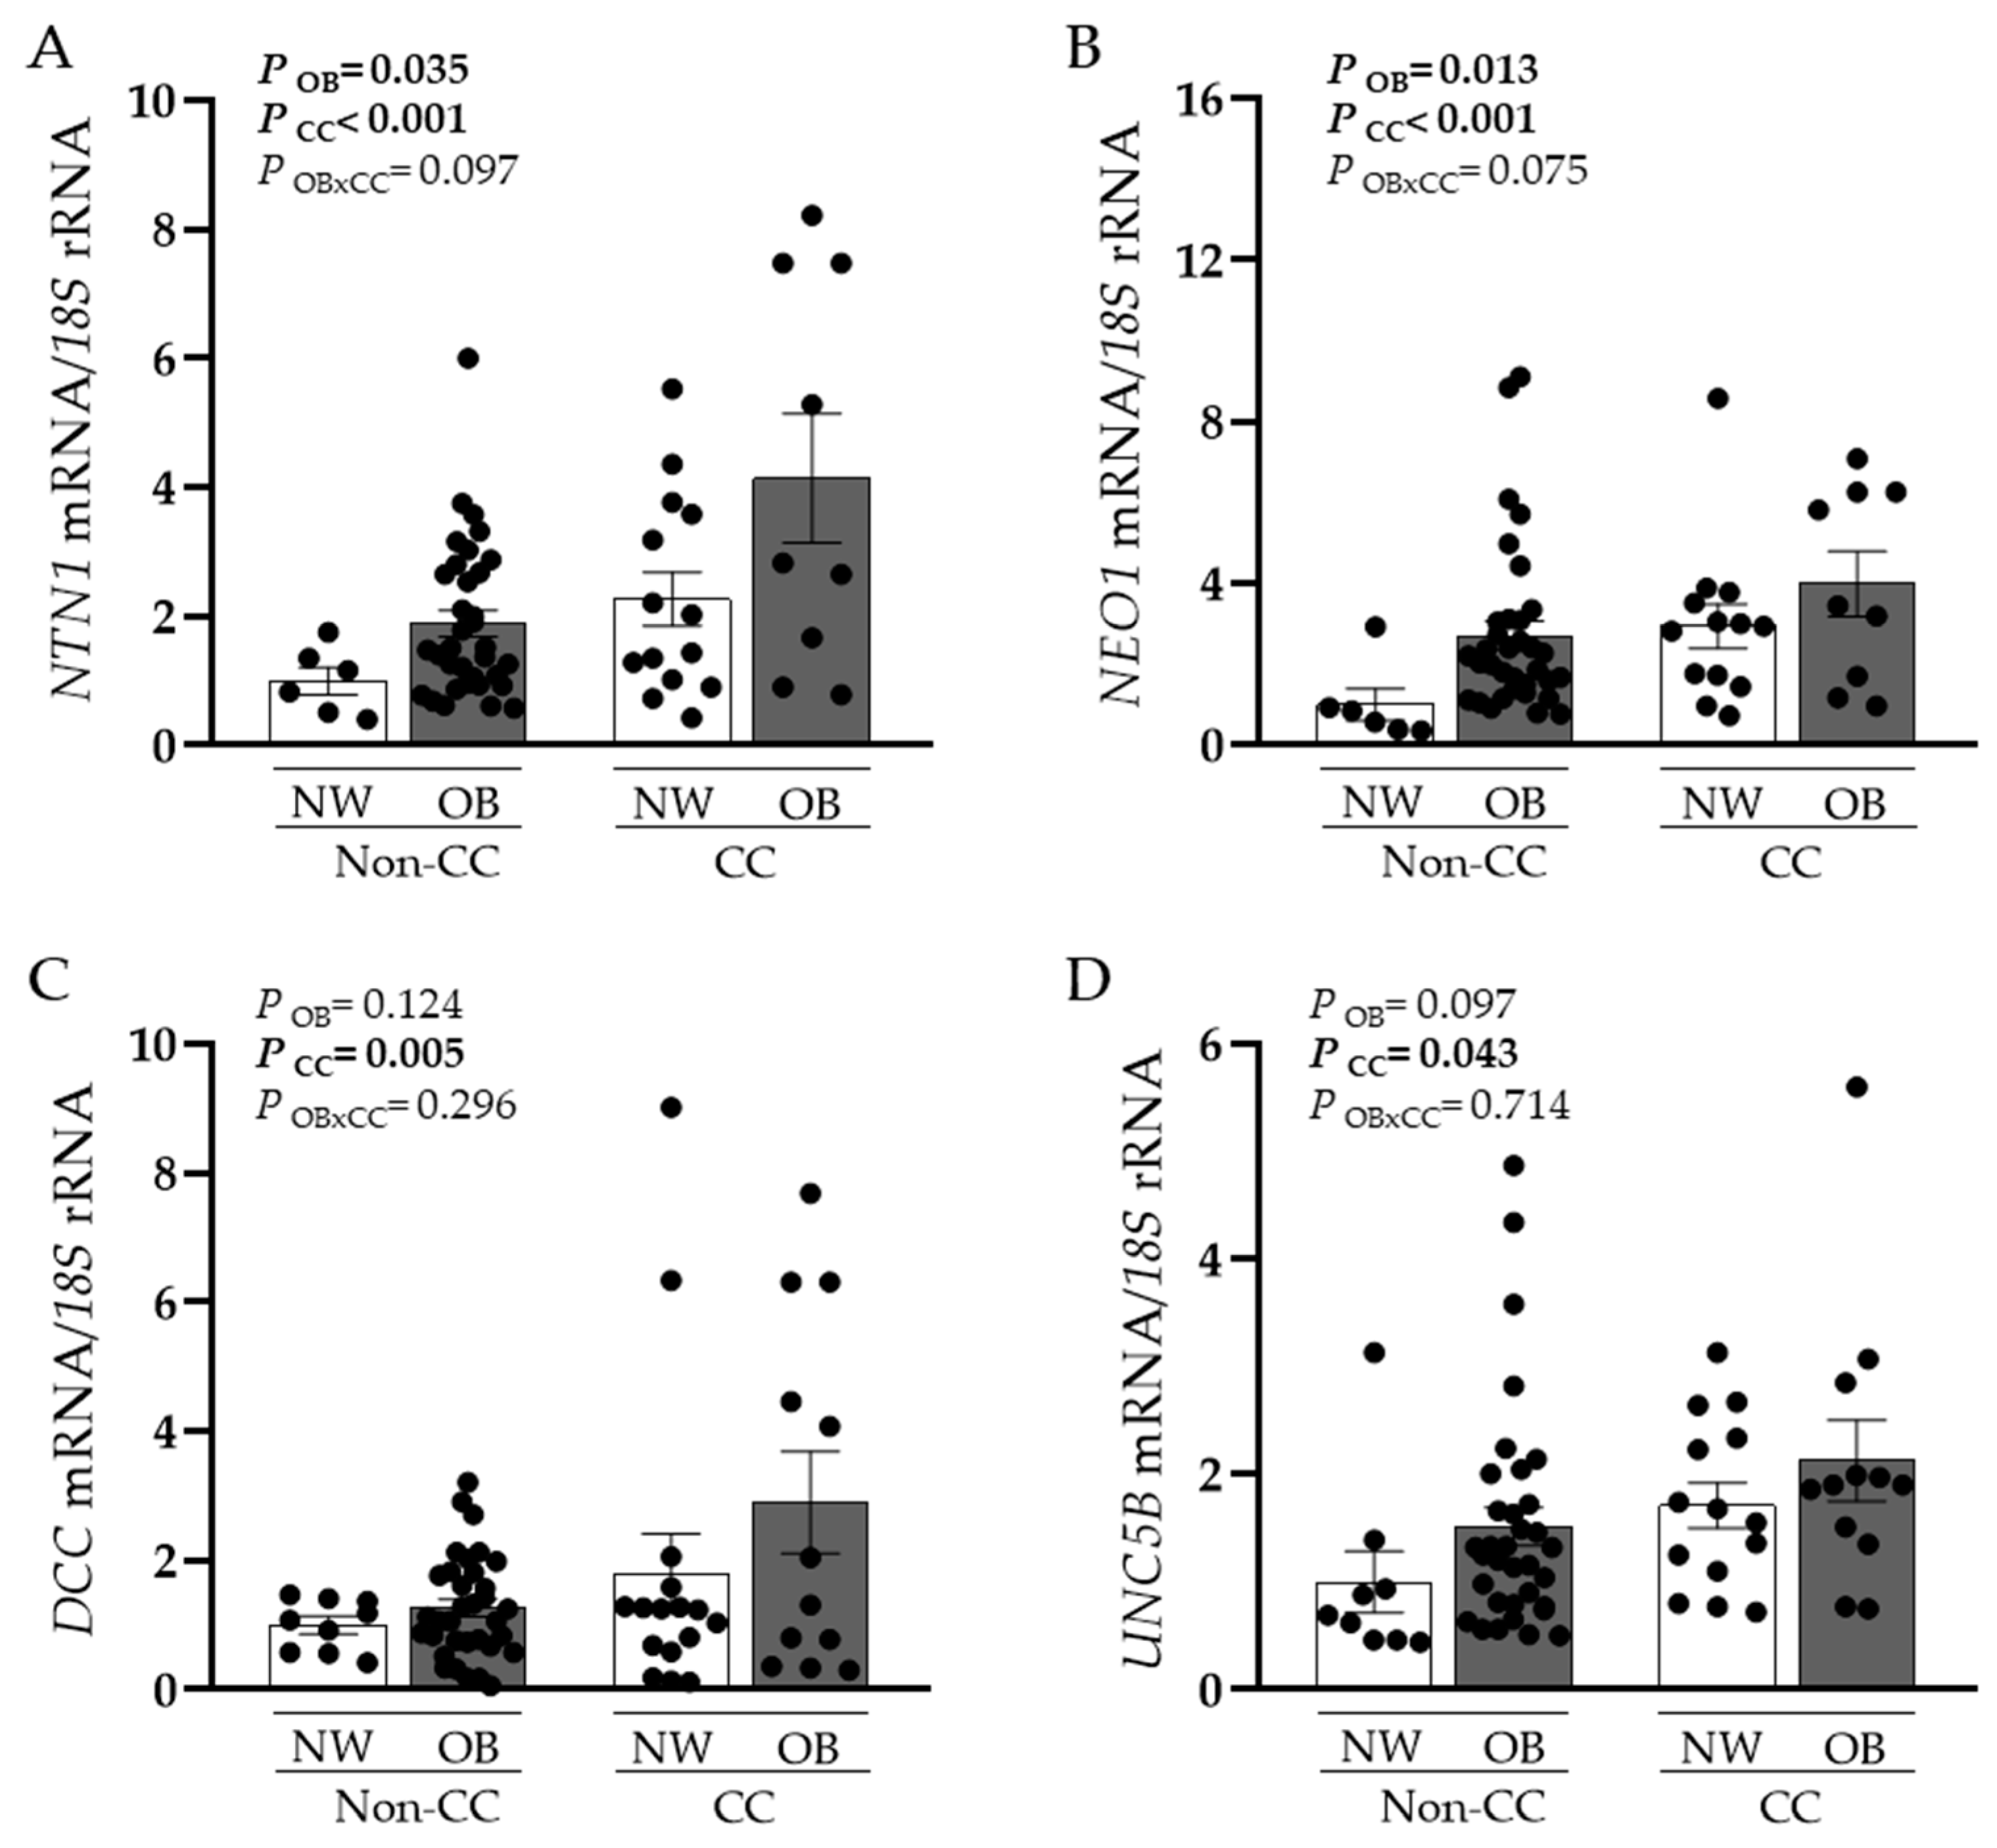
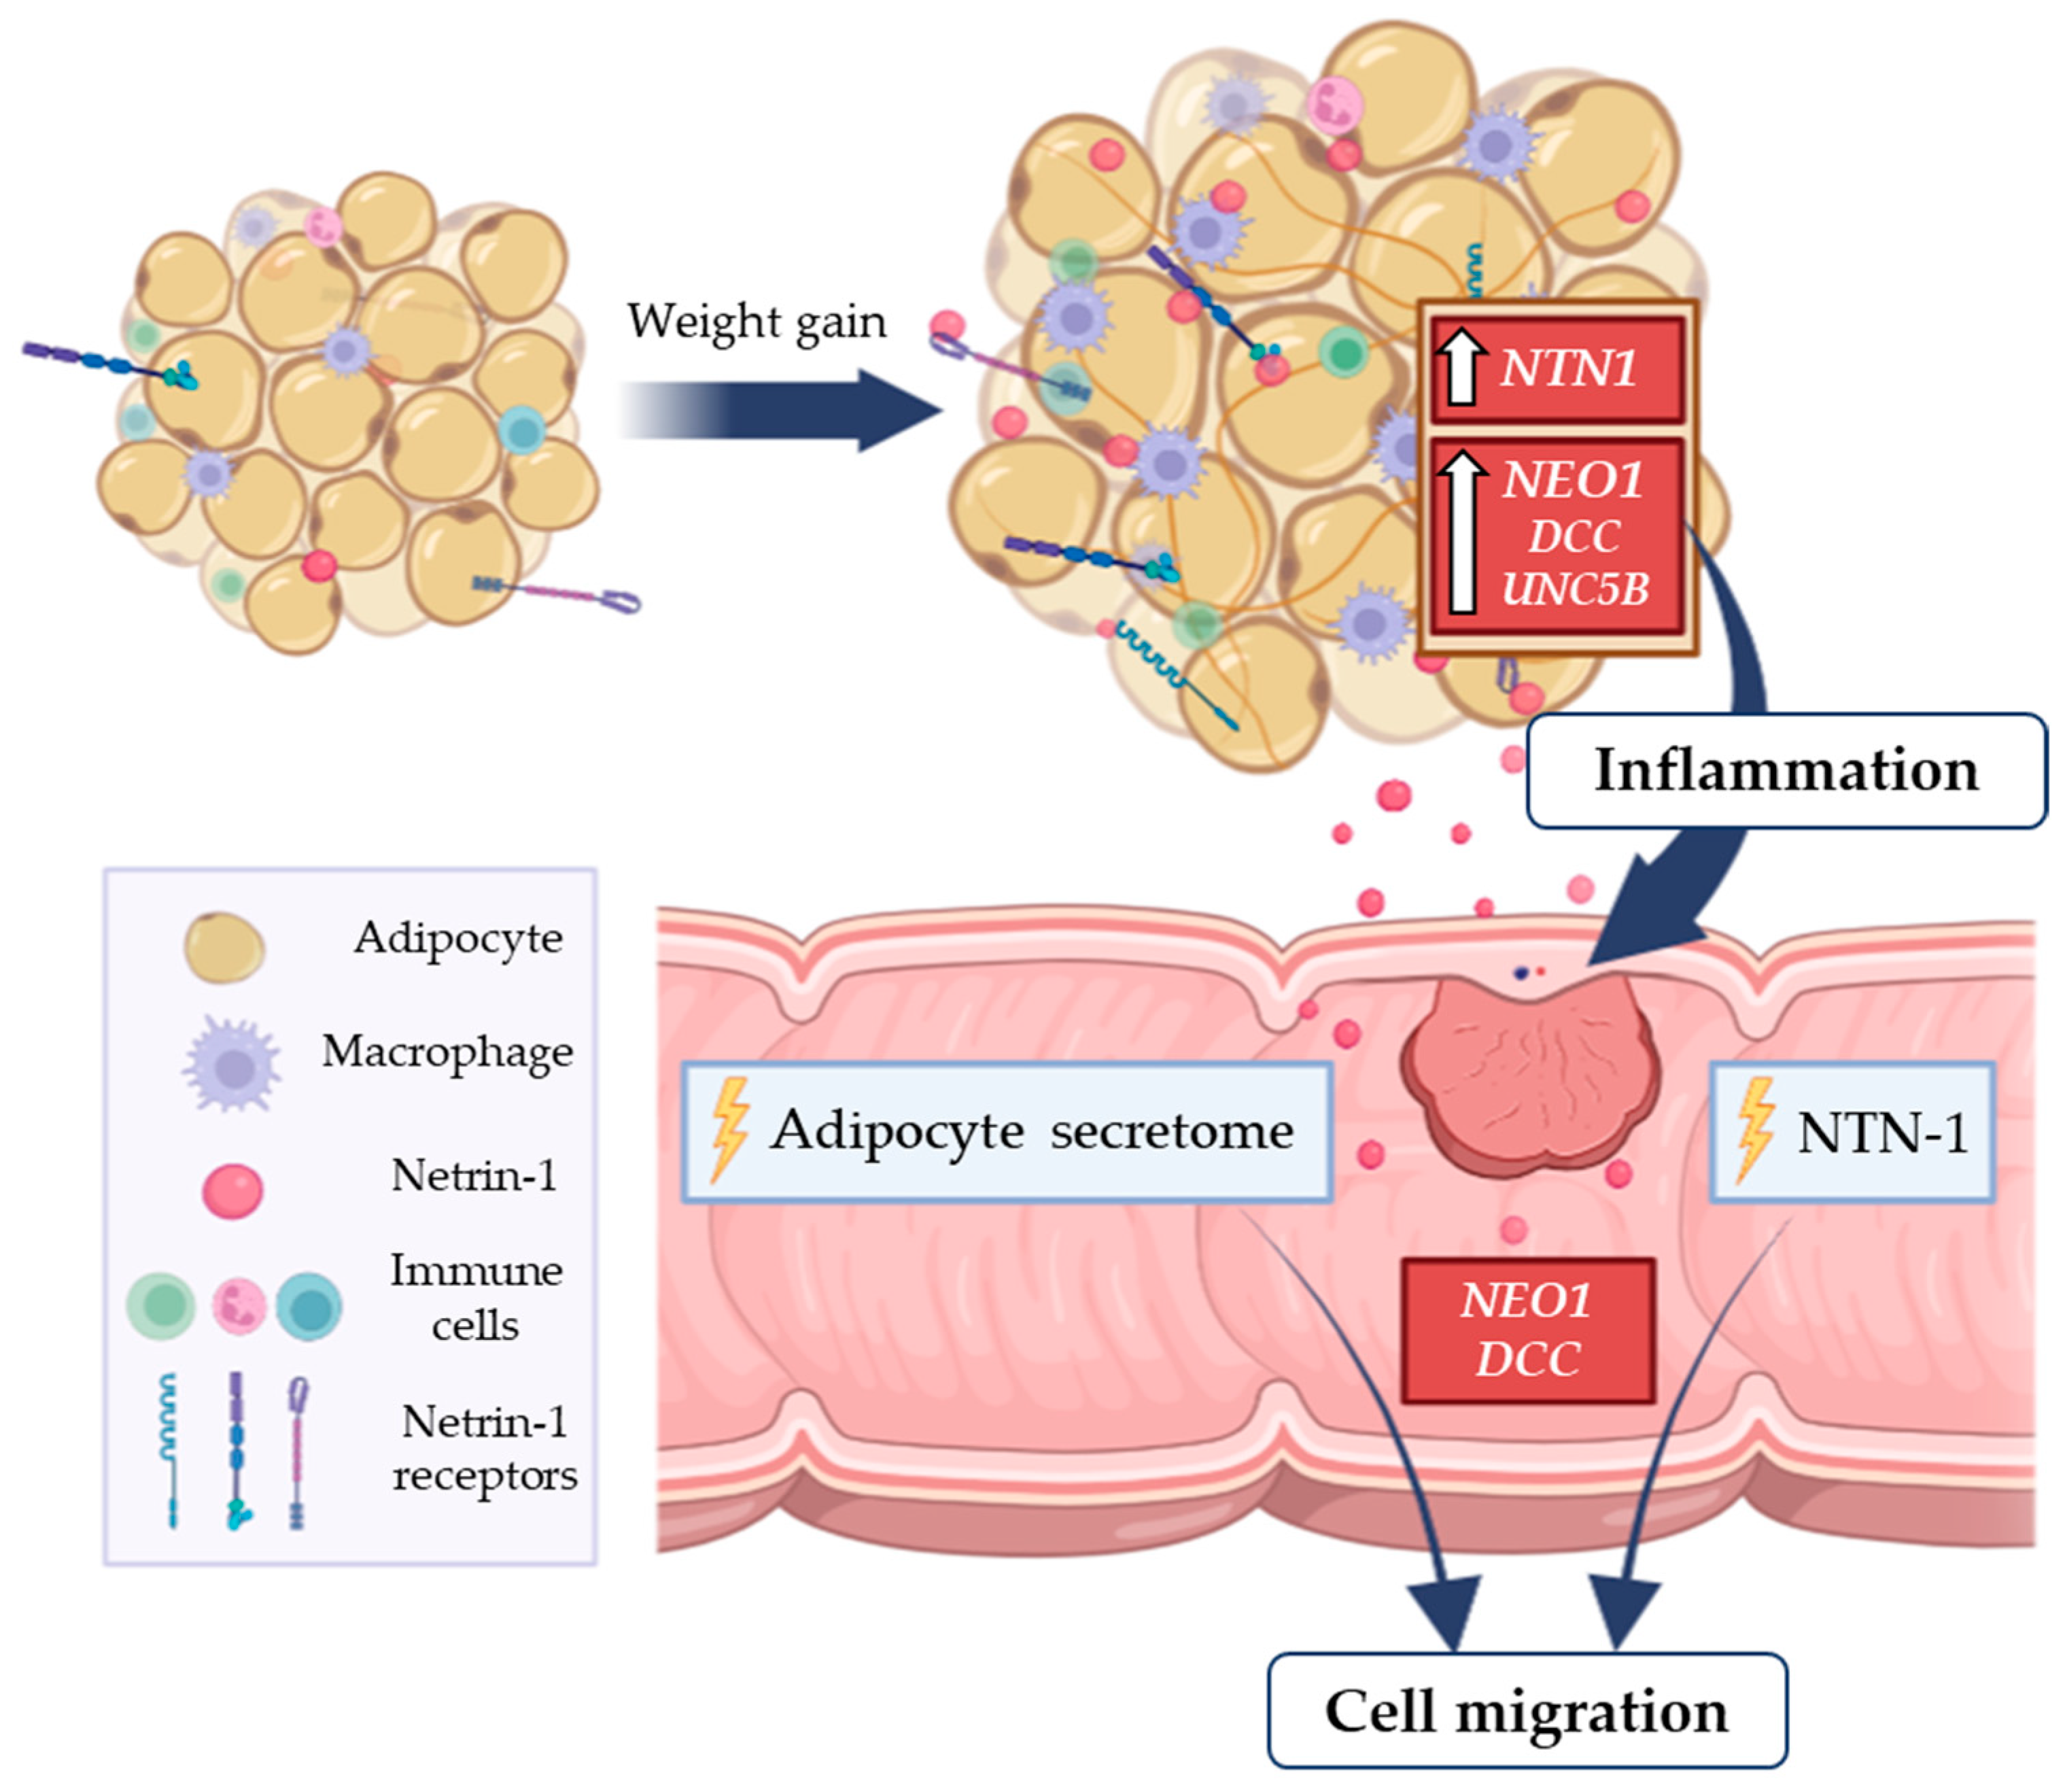
3.1. NTN1 and NEO1 Expression Levels Are Increased in VAT in Obesity and CC and Are Associated with Key Inflammatory Factors

Table 1 shows the clinical features of the study population. Differences between groups were adjusted by age because of significant differences between CC and non-CC patients (p < 0.001). Weight, BMI, and estimated BF were increased (p < 0.01) in patients with OB compared to the NW volunteers. Although patients with CC exhibited higher glucose concentrations compared to patients without CC, differences did not reach statistical differences. Obesity was clearly associated with higher circulating levels of triglycerides (p < 0.01) and with the intestinal damage biomarkers S100A8 (p < 0.001) and lactoferrin (p < 0.05). Patients with OB without CC exhibited higher concentrations (p < 0.01) of CCL5 compared to the rest of the groups. Overall, the differences in leukocytes did not reach statistical significance.
A significant upregulation in the gene expression levels of NTN1 and NEO1 in VAT caused by OB (p < 0.05) and CC (p < 0.001) was observed (Figure 1A,B). Although no effect of OB was found in the mRNA expression levels of DCC and UNC5B, a significant increase was found in patients with CC (p < 0.01 and p < 0.05, respectively) (Figure 1C,D). Since volunteers with OB without CC exhibited higher BMI and BF than patients with OB and CC, we also analysed differences between groups controlled by BF finding the same tendency. Furthermore, gene expression levels of NTN1 and its receptors were positively associated between them (Table 2). Importantly, NTN1 expression was also associated with glucose (r = 0.27, p = 0.046), as well as with the markers of inflammation CRP (r = 0.41, p = 0.020) and the percentage of monocytes (r = 0.37, p = 0.011). No association between NTN1 mRNA levels and BMI was detected in our study, which may be due to the increased inflammatory profile of both groups of patients with CC, NW, and OB.
Given the importance of NTN-1 in inflammation, we also aimed to analyse its association with relevant genes involved in VAT inflammation, but also with a crucial function in intestinal homeostasis. mRNA levels of the inflammasome NLRP6, its associated molecule ASC, as well as its main effector IL1B were significantly increased because of OB and CC (Table 3). Interestingly, mRNA levels of NTN1, NEO1, and UNC5B were associated with ASC and IL18 (Table 2).

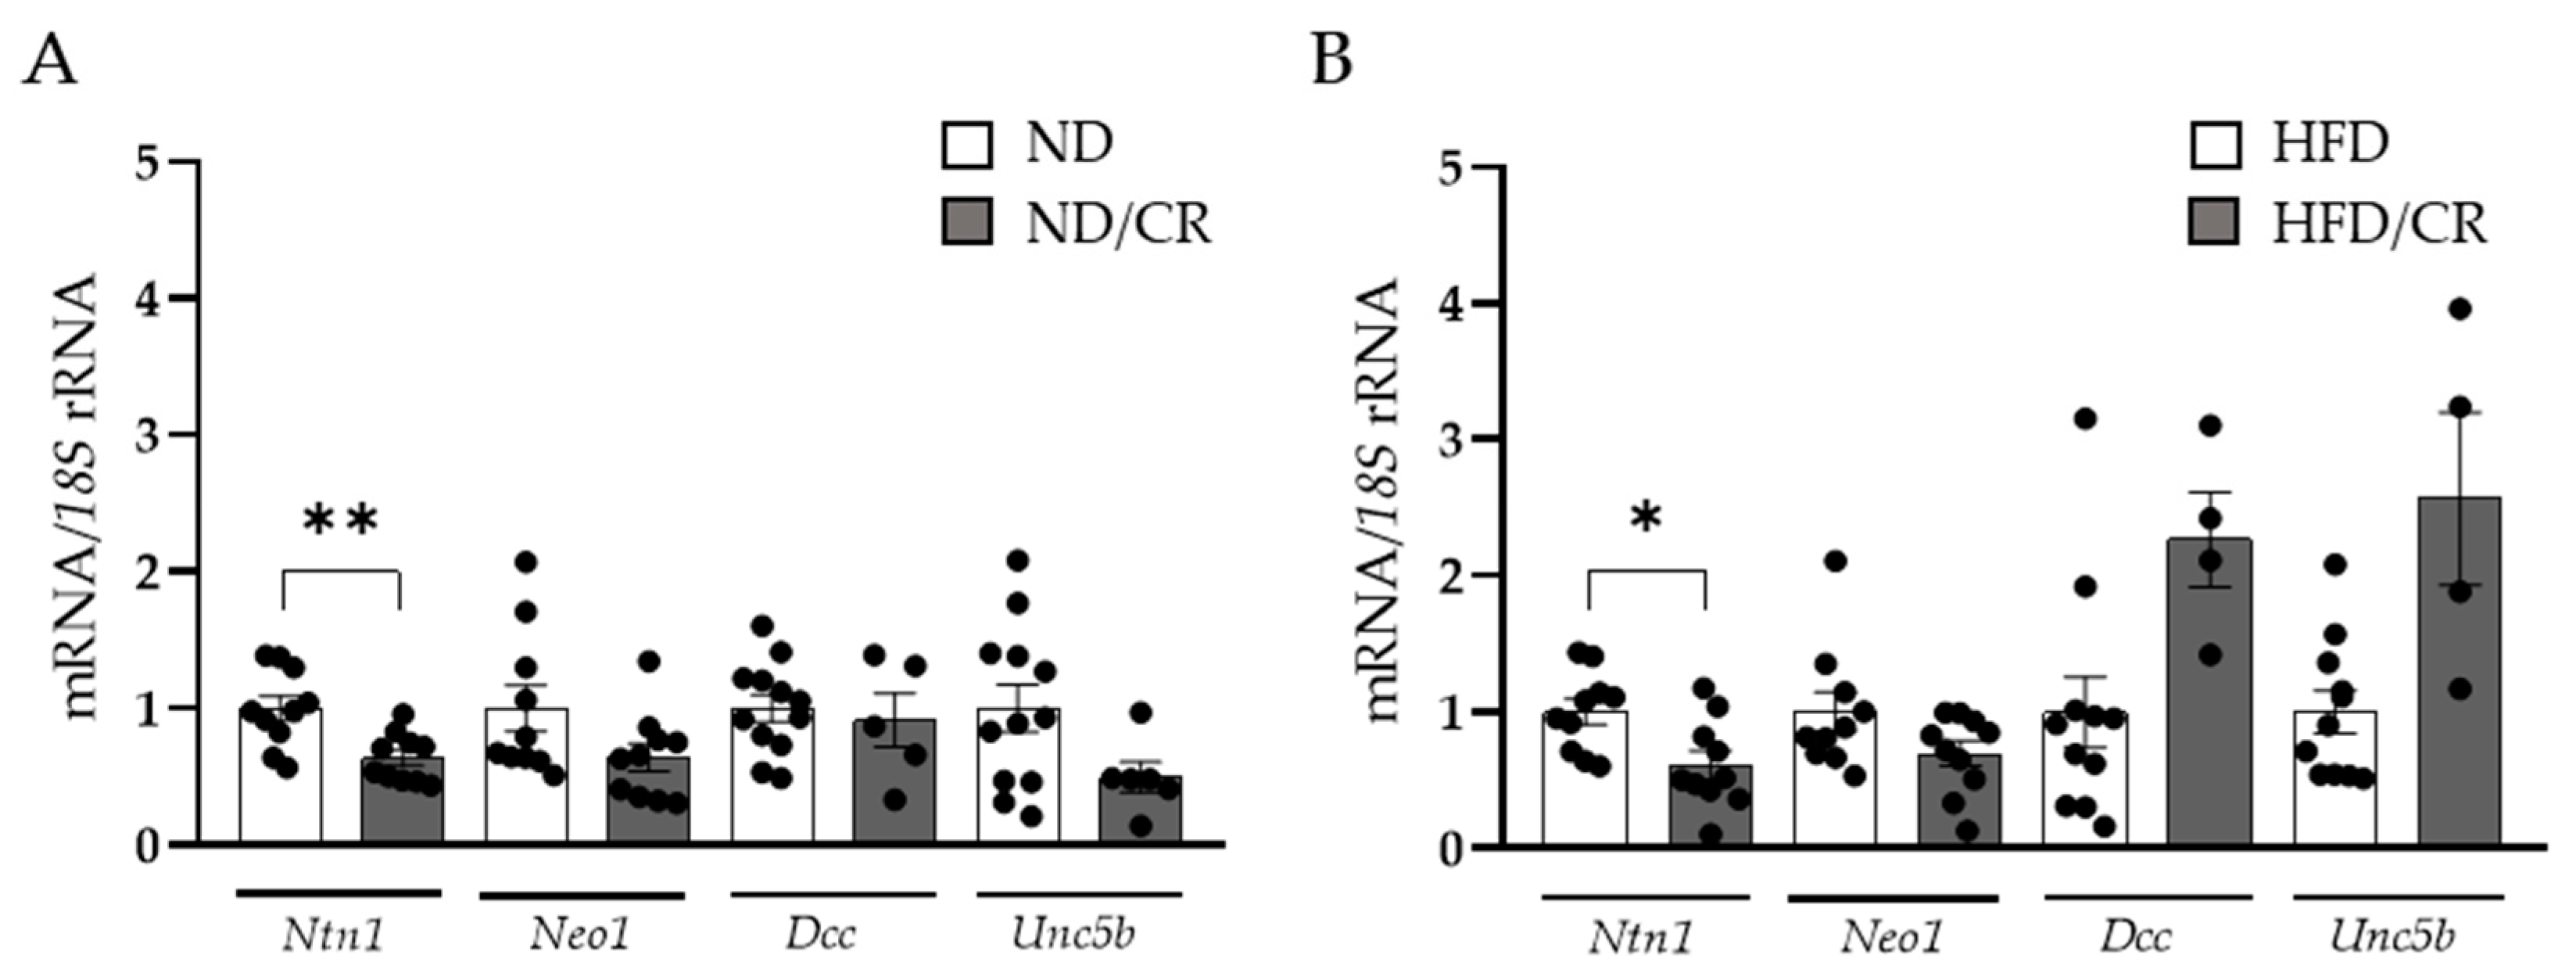
3.2. Decreased Ntn1 Expression Levels in the Colon of Rats after Caloric Restriction

To better understand the effect of weight loss on NTN-1 regulation in the colon, we analysed its expression levels and its receptors in a rat model under both ND and HFD, submitted to CR (Figure 2). Numerous studies support the beneficial effects of food restriction, alleviating different obesity-associated complications, including insulin resistance and systemic inflammation [36]. In our study, rats on a 25% CR exhibited decreased colonic Ntn1 mRNA levels (p < 0.01) in rats fed an ND or an HFD together with a tendency to downregulate Neo1, Dcc and Unc5b expression levels remained unchanged.

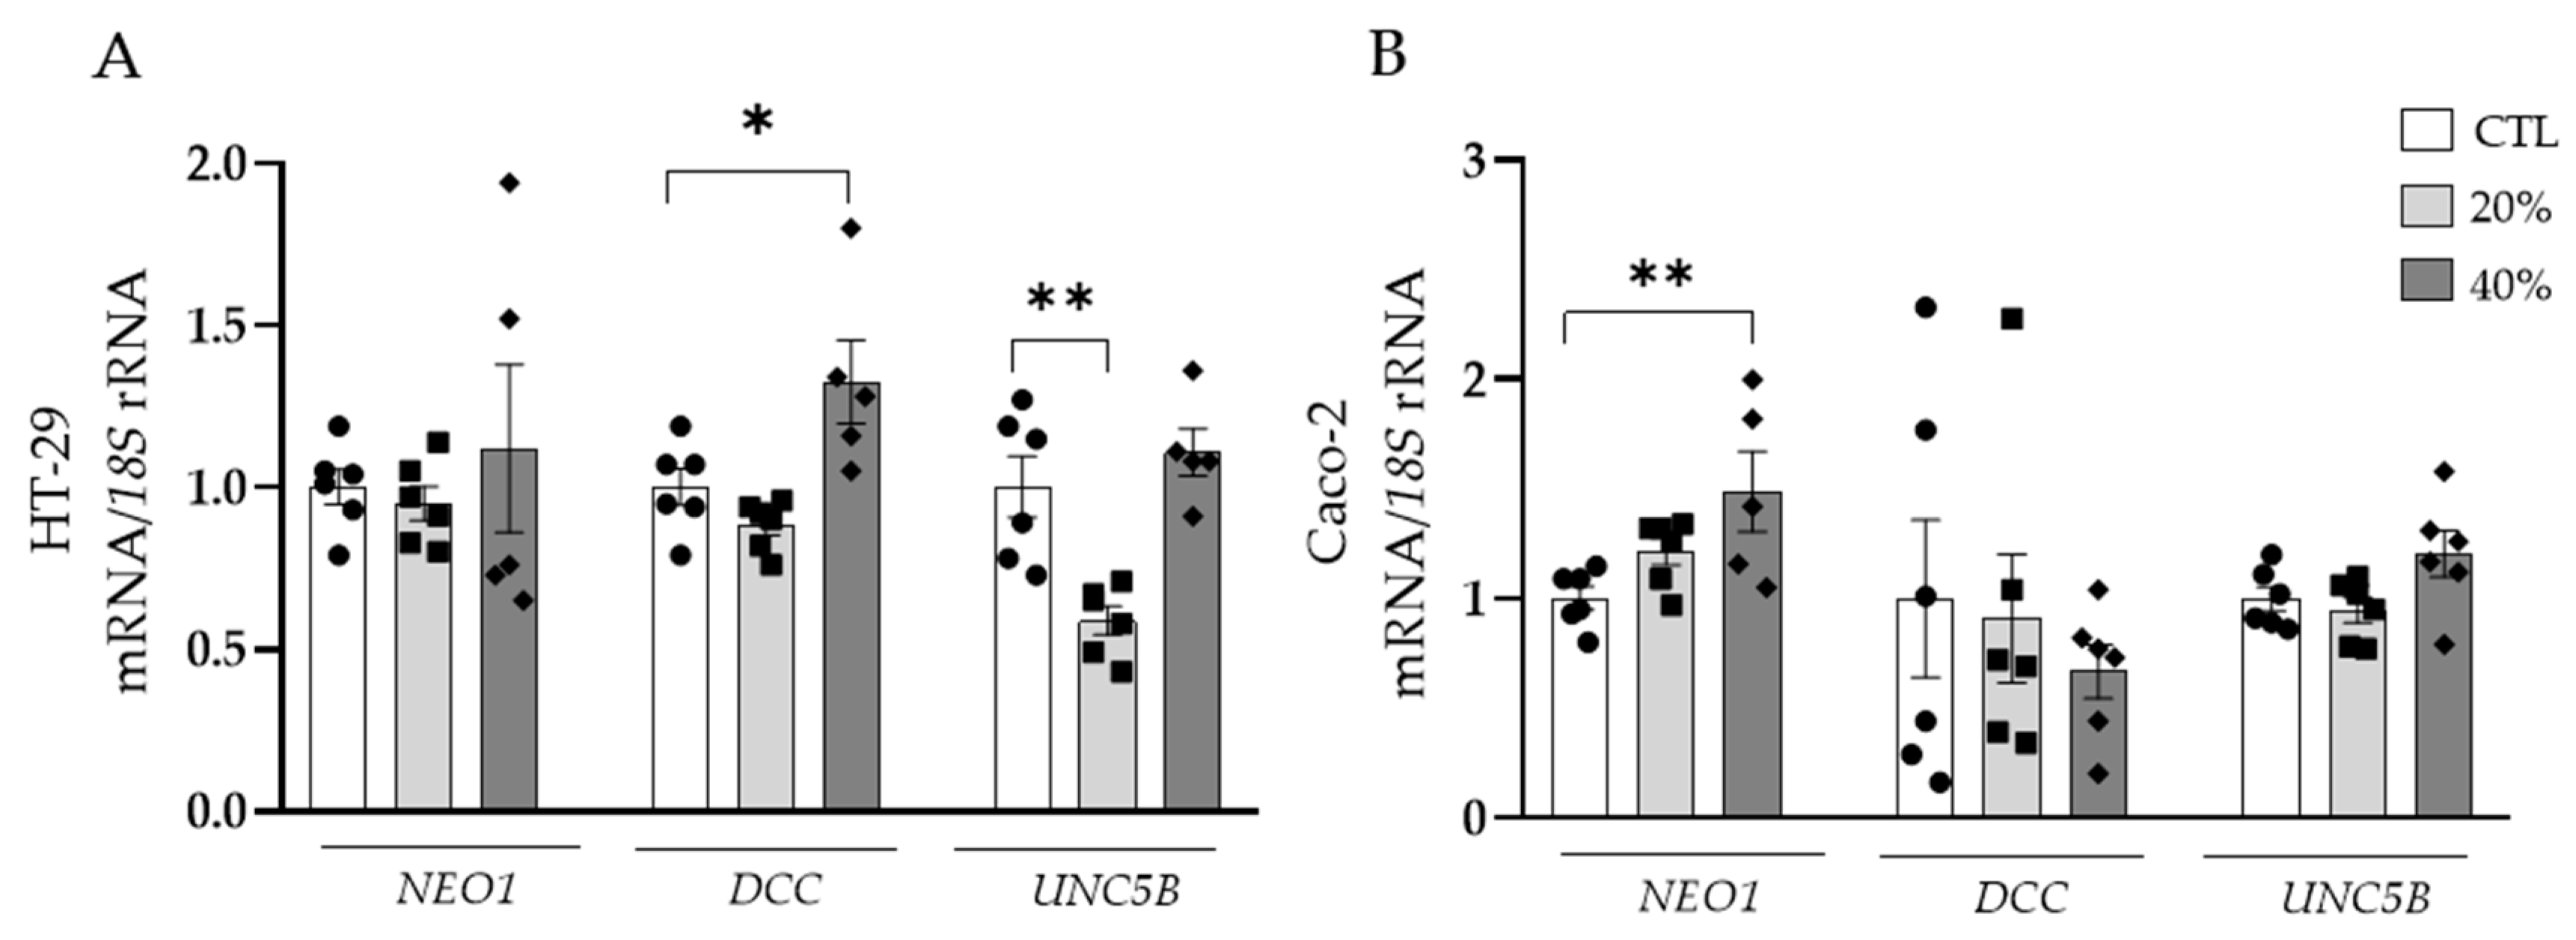
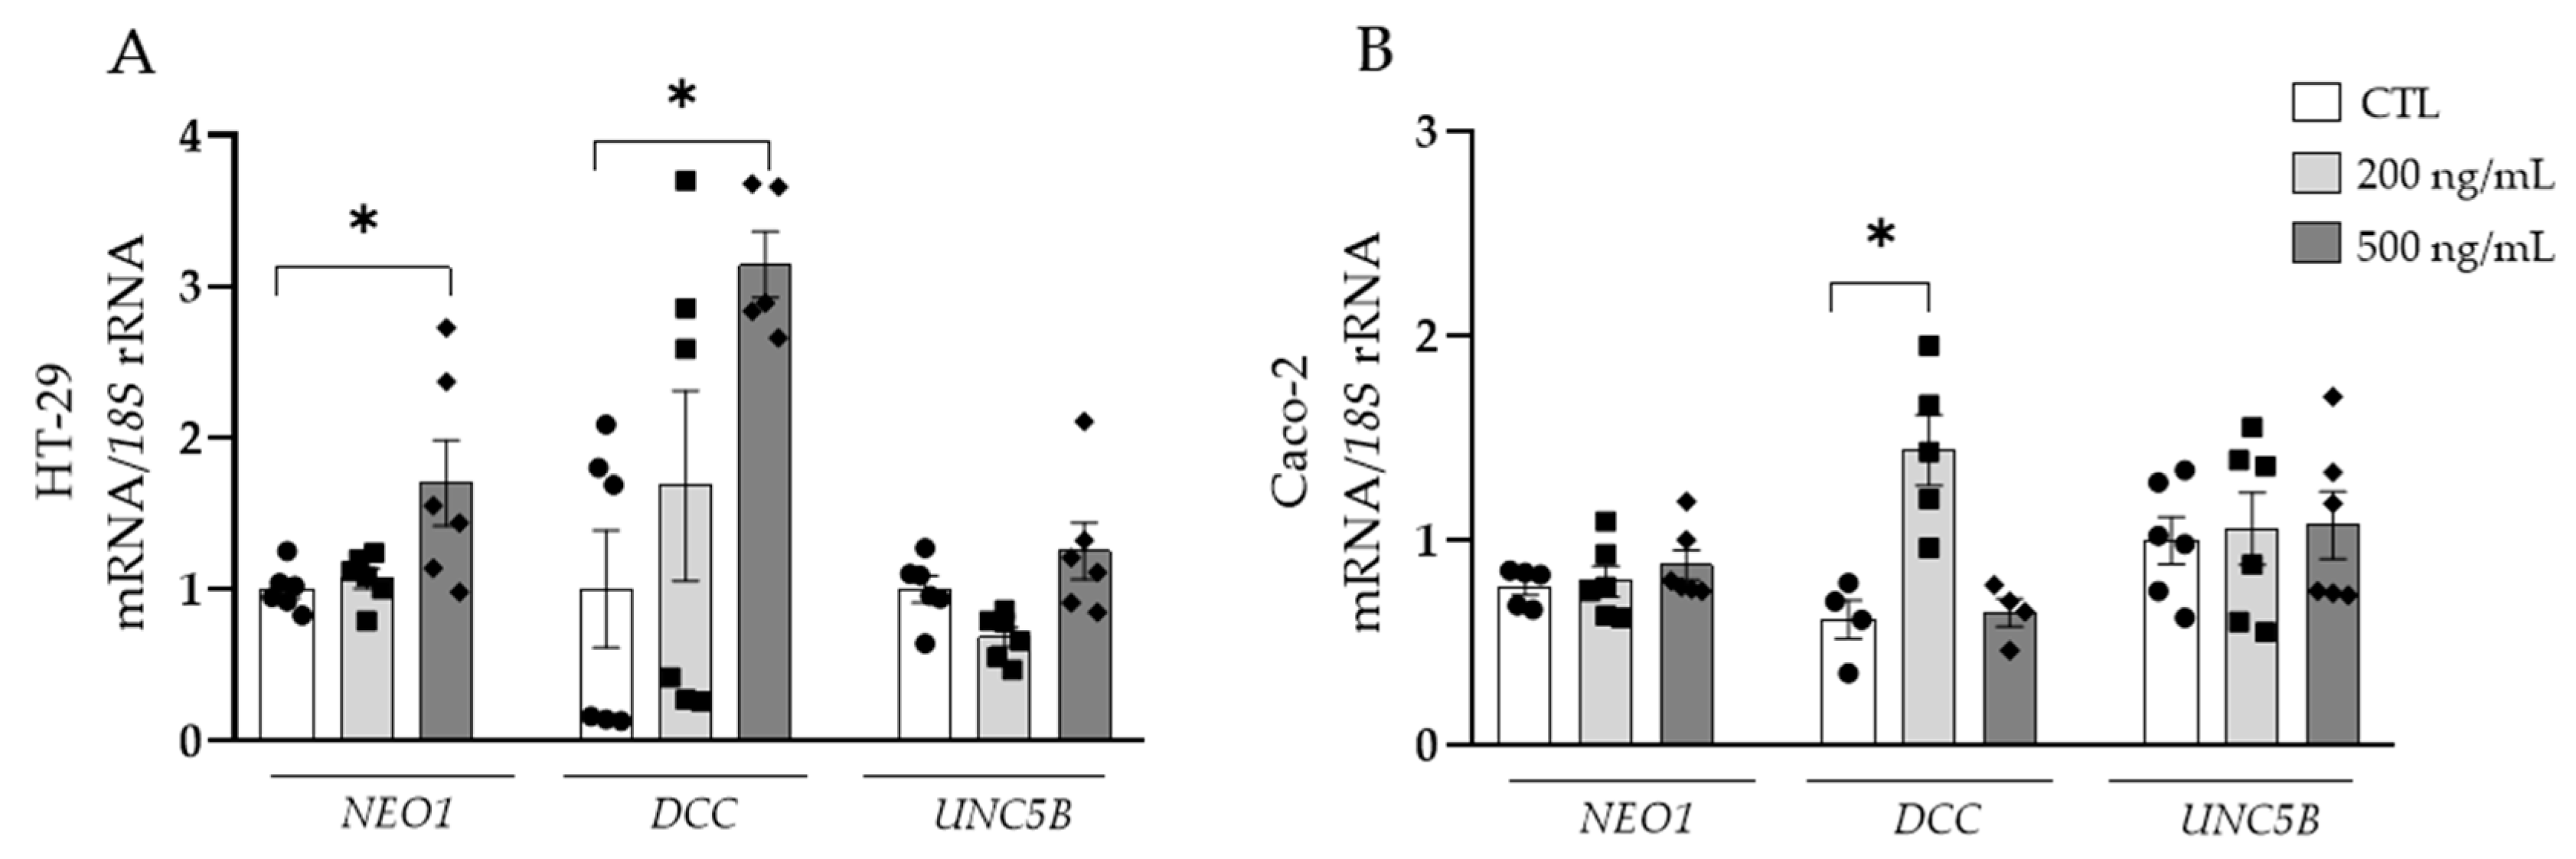
3.3. Adipocyte-Conditioned Media and NTN-1 Induce the Expression of NEO1 and DCC in Human Colorectal Cells

Due to the potential contribution of dysregulated adipokines in tumour development, the effect of the secretome of adipocytes obtained from patients with OB on the expression levels of the main receptors of NTN-1 was investigated in both HT-29 and Caco-2 cell lines. After the treatment of HT-29 cells with ACM, an upregulation (p < 0.05) of DCC expression levels was observed (Figure 3A). Oppositely, UNC5B mRNA levels exhibited a significant decrease (p < 0.01), while NEO1 expression levels remained constant (Figure 3A). NEO1 expression levels were significantly upregulated (p < 0.01) in Caco-2 cells treated with ACM, whereas DCC and UNC5B remained unchanged (Figure 3B).
Next, we studied the specific role of NTN-1, finding an upregulation of DCC in HT-29 and Caco-2 cell lines (Figure 4A,B). The mRNA expression of NEO1 was increased (p < 0.05) in HT-29 cells and gene expression levels of UNC5B remained unchanged in both colorectal cancer cell lines.

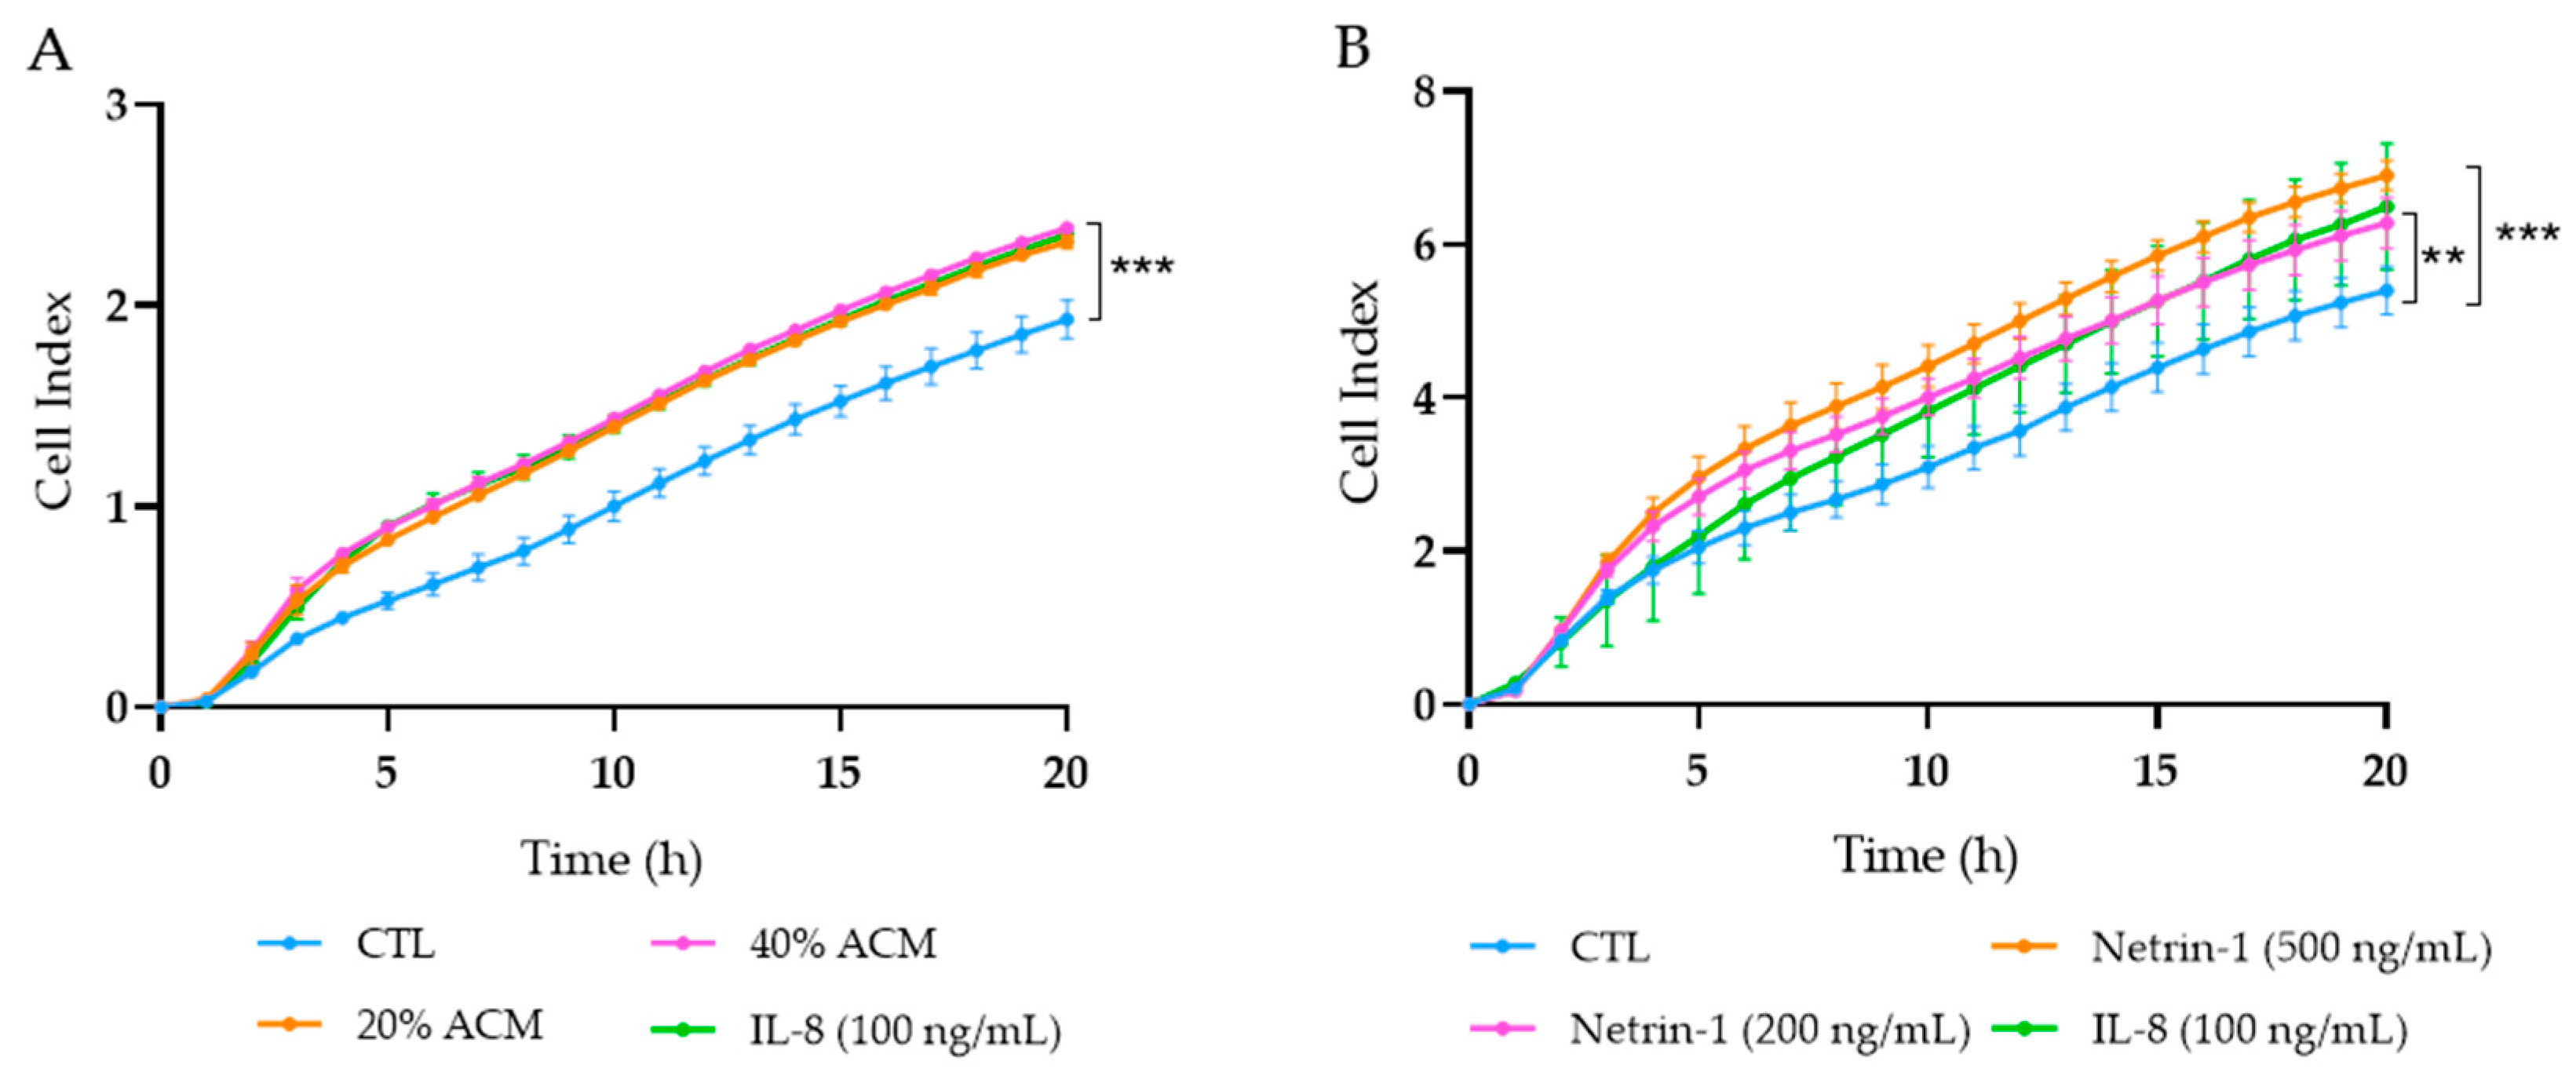
3.4. Effect of Adipocyte-Conditioned Media and NTN-1 on Caco-2 Cell Migration

Since dysregulated secretion of adipokines promotes cancer cell progression in adjacent tissues to adipose depots [37,38] and NTN-1 has been reported to trigger cancer cell migration [39,40], we aimed to elucidate the role of ACM and NTN-1 in the modulation of tumour Caco-2 cell chemotaxis. Caco-2 cells treated with ACM at 20% and 40% showed a significant increase (p < 0.001) in chemotaxis, similar to the migration observed after the stimulation with the positive control IL-8 (Figure 5A). After the treatment with NTN-1 at 200 ng/mL, Caco-2 cells reached a similar cell index migration rate as after the treatment with IL-8, both being significantly increased (p < 0.01) compared with the control cells (Figure 5B). After the stimulation with NTN-1 at 500 ng/mL, tumour cells exhibited a higher (p < 0.001) migration effect compared to untreated cells (Figure 5B).

4. Discussion

Independent studies have identified NTN-1 as a key tumorigenic factor in CC and as a pro-inflammatory player in OB, suggesting that its increase during OB may induce CC development [14,41]. To elucidate the mechanisms contributing to CC progression during obesity, we studied the expression of NTN1 and its receptors in VAT and the effect of ACM and NTN-1 on colorectal cancer cell migration. We found increased NTN1 and NEO1 expression levels in VAT caused by OB and CC, whereas DCC and UNC5B mRNA levels were upregulated in patients with CC. We also found a downregulation of Ntn1 levels in the colon from rats submitted to CR. Furthermore, both NTN-1 and ACM were found to increase NEO1 and DCC mRNA levels in two colorectal adenocarcinoma cell lines, together with UNC5B downregulation in HT-29 cells when stimulated with ACM. Finally, Caco-2 cells exhibited a strong migratory effect after the treatment with ACM and NTN-1.
During obesity, the inflamed VAT is a source of pro-inflammatory adipokines including tumour necrosis factor (TNF)-α, IL-6, IL-8, CRP, or leptin, among others, that are released into the circulation promoting systemic inflammation [42,43,44]. Relevant studies have demonstrated obesity-associated inflammation as a crucial step in the establishment of the tumour microenvironment, conferring optimal survival conditions to dysregulated pro-tumorigenic cells [45]. Our group previously described that circulating concentrations and VAT gene expression levels of the pro-inflammatory mediator NTN-1 are increased in patients with OB being associated with insulin resistance [14]. For the first time, our findings show increased NTN1 expression levels in VAT from patients with OB and CC. We also observed higher DCC and UNC5B expression in VAT, especially in patients with CC, as well as NEO1 upregulation in OB and CC, suggesting that during tumorigenesis, the downstream signalling of NTN-1 is continuously activated, potentiating inflammation and cell survival. We further demonstrate a positive association between NTN1 and its receptors, as well as with relevant proinflammatory genes involved in the maintenance of intestinal homeostasis including NLRP6, ASC, and IL18, endorsing the pro-inflammatory nature of NTN-1, similar to that of inflammasome products secreted mainly by activated macrophages. In this line, our group previously demonstrated that the treatment of visceral adipocytes with NTN-1 promoted the upregulation of proinflammatory and chemotactic molecules (CCL2, IL1B, IL8, and IL36) strengthening the role of NTN-1 in favouring VAT inflammation [14]. Patients with CC and inflammatory bowel disease, a condition involving a chronic inflammation similar to the VAT from patients with OB, showed upregulated levels of NTN1 in the colon being related to tumour progression, suggesting that OB-associated VAT inflammation increased NTN1 expression levels in CC favouring and supporting tumour development [18]. High NTN1 expression levels in VAT during OB and CC may perpetuate the systemic inflammatory state favouring a microenvironment that impacts the colon and fuels CC development.
In light of previous studies showing increased Ntn1 in the AT from obese mice, we aimed to determine whether CR influences Ntn1 expression levels in the colon of ND-fed rats [15]. We found that Nnt1 mRNA levels were downregulated in animals submitted to CR, strengthening the antitumoral effect of CR by reducing inflammatory signalling pathways [46,47]. In this regard, a study in high-fat- and low-fat-fed rats, as well as in azoxymethane-treated and control rats, found that CR decreased the proliferation rate of colon cells, being considered an intermediate biomarker of CC risk [48]. Although results did not reach statistical differences, the expression levels of Ntn-1 receptors tended to decrease, suggesting that the downregulation of their ligand effectively modulates the inflammatory response.
Progressive malignancies are characterised by elevated NTN1 together with decreased expression levels of DCC and UNC5 receptors, which trigger apoptosis via p53 when unbound to NTN-1 [41,49,50,51]. Consequently, either losing receptor activity or increasing NTN1 expression is advantageous for tumour progression. However, depending on the type of NTN-1 receptor expression, cells may be either attracted or repulsed by NTN-1 with DCC and NEO-1 being classic attractive receptors and the UNC family repulsive receptors [52,53]. In addition, the loss of NTN-1 receptors is not arbitrary and can be attributed to particular stages of tumour growth [54]. Early UNC5C inactivation contrasts with late DCC loss during multistep CC, while increased NTN1 mRNA expression has been detected in stages III and IV of CRC [54]. High NTN-1 signalling through UNC5B and DCC during tumorigenesis has been related to cancer cell proliferation and migration by up-regulation of the proto-oncogene YAP, a downstream signalling of the Hippo pathway, important in cell proliferation and apoptosis [55]. Due to the opposing roles of NTN-1 and its receptors, the development of a humanised monoclonal antibody in phase II clinical trials selectively inhibiting NTN1 has shed light onto restoring apoptosis in patients with advanced solid tumours, including CC [56]. In an effort to determine the impact of VAT-derived adipokines from patients with OB on NTN-1 receptors, we stimulated both HT-29 and Caco-2 cells with ACM, showing upregulated DCC and NEO1 mRNA levels, respectively. In parallel, we studied the effect of the exogenous administration of NTN-1 on the regulation of its receptors and found upregulated DCC and NEO1 mRNA levels in HT-29 cells and increased DCC levels in Caco-2 cells, suggesting that increased NTN-1 in CC and NTN-1-rich VAT media derived from patients with OB might induce CC progression mainly through NEO-1 and DCC [14]. In addition to cell survival, NTN-1 and its receptors have been shown to regulate cell morphogenesis, motility, and polarisation events [57].
Invasion of CC cells is associated with advanced tumour stages. Increased expression levels of NTN1 in gastric cancer samples have been found in patients with stage III and IV CRC, indicating that NTN1 overexpression may promote tumour metastasis. Our data show a greater migratory capacity of Caco-2 cells under ACM and NTN-1 compared to treatment with the proinflammatory cytokine IL-8, highlighting increased motility of Caco-2 cells under the effects of VAT-derived medium from patients with OB rich in NTN-1 and NTN-1 [58]. According to a study on the migratory effect of NTN-1 in a 3D cell culture model of liver cancer cells, NTN-1 increased N-cadherin-mediated cell junctions (a hallmark of epithelial-to-mesenchymal transition) and promoted cell migration, while NTN1 silencing decreased N-cadherin and inhibited cell migration, revealing that the ability of NTN-1 to enhance migration may also increase the metastasis of liver cancer. In this line, the importance of NTN-1 on the formation of intracellular fibres for cell contraction and motility in a human colon carcinoma cell line has been described, with greater cell retraction and an increase in actin filaments along the cell margins, further supporting the migratory effect of NTN-1 on tumour cells [50].
The study has some limitations. Further studies in larger cohorts will shed light on our understanding of the role of NTN-1 in obesity-associated CC. Future mechanistic studies in animal models may help to better understand the role of this molecule in AT, and the study of the different signalling pathways triggered by NTN-1 in this tissue is a subject of further investigation. Cell cultures are in vitro systems that are different at a molecular level from the in vivo situation and this difference may be reflected in the secretome. In addition, cell cultures do not represent a real tumour as they are cultured as isolated adenocarcinoma cell lines; therefore, the development of co-cultures comprising both tumour cell lines may constitute an optimal strategy to find an in vitro model to mimic the intestinal epithelium.

5. Conclusions

Collectively, these findings suggest that the upregulated NTN1 gene expression in VAT from patients with OB and CC promotes a pro-inflammatory microenvironment that may trigger tumour progression and migration (Figure 6). Future studies are required to elucidate the role of NTN-1 in the molecular pathophysiology of CC progression, as well as to assess the impact of its downregulation on obesity-related CC.

Supplementary Materials

The following supporting information can be downloaded at: https://www.mdpi.com/article/10.3390/cancers15041038/s1, Table S1: Clinicopathological characteristics of patients with CC. Table S2: Sequences of the primers and TaqMan® probes.

Author Contributions

Conceptualisation, V.C. (Victoria Catalán) and G.F.; data curation, R.M. and C.S.; formal analysis, A.M., J.G.-A., G.N., A.R., A.F., V.C. (Victoria Catalán) and G.F.; funding acquisition, J.G.-A., V.C. (Victoria Catalán) and G.F.; investigation, A.M. and B.R.; methodology, A.M., J.G.-A., B.R., S.B., A.R., V.V., R.M., J.B., M.A.B., C.S., V.C. (Vasco Claro), A.F., V.C. (Victoria Catalán) and G.F.; software, V.C. (Vasco Claro); validation, S.B.; writing—original draft, A.M., V.C. (Victoria Catalán) and G.F.; writing—review and editing, A.M., J.G.-A., G.N., B.R., S.B., A.R., V.V., R.M., J.B., M.A.B., C.S., V.C. (Vasco Claro), A.F., V.C. (Victoria Catalán) and G.F. All authors have read and agreed to the published version of the manuscript.

Funding

This work was funded by the Spanish Institute of Health ISCIII (Subdirección General de Evaluación and Fondos FEDER projects PI19/00785, PI20/00080, and PI20/00927) and CIBEROBN. Funding sources had no role in manuscript writing or in the decision to submit it for publication.

Institutional Review Board Statement

The study was conducted in accordance with the Declaration of Helsinki and approved from an ethical and scientific standpoint by the Universidad de Navarra’s Ethical Committee responsible for research (protocol code 2019.089). All experimental protocols were approved by the Ethical Committee for Animal Experimentation of the University of Navarra (7 March 2019, 026-19) and conformed to the European Guidelines for the Care and Use of Laboratory Animals (directive 2010/63/EU).

Informed Consent Statement

Written informed consent was obtained from all subjects involved in the study.

Data Availability Statement

The data that support the findings of this study are available from the corresponding author upon reasonable request.

Acknowledgments

The authors gratefully acknowledge the valuable collaboration of all the members of the Multidisciplinary Obesity Team, Clínica Universidad de Navarra, Pamplona, Spain.

Conflicts of Interest

The authors declare no conflict of interest. The funders had no role in the design of the study, in the collection, analyses, or interpretation of data, in the writing of the manuscript, or in the decision to publish the results.

References

  1. Dekker, E.; Tanis, P.J.; Vleugels, J.L.A.; Kasi, P.M.; Wallace, M.B. Colorectal cancer. Lancet 2019, 394, 1467–1480. [Google Scholar] [CrossRef] [PubMed]
  2. Siegel, R.L.; Miller, K.D.; Goding Sauer, A.; Fedewa, S.A.; Butterly, L.F.; Anderson, J.C.; Cercek, A.; Smith, R.A.; Jemal, A. Colorectal cancer statistics, 2020. CA Cancer J. Clin. 2020, 70, 145–164. [Google Scholar] [CrossRef] [PubMed]
  3. GBD 2015 Obesity Collaborators; Afshin, A.; Forouzanfar, M.H.; Reitsma, M.B.; Sur, P.; Estep, K.; Lee, A.; Marczak, L.; Mokdad, A.H.; Moradi-Lakeh, M.; et al. Health effects of overweight and obesity in 195 countries over 25 years. N. Engl. J. Med. 2017, 377, 13–27. [Google Scholar] [PubMed]
  4. Lauby-Secretan, B.; Scoccianti, C.; Loomis, D.; Grosse, Y.; Bianchini, F.; Straif, K. Body fatness and cancer--viewpoint of the IARC working group. N. Engl. J. Med. 2016, 375, 794–798. [Google Scholar] [CrossRef]
  5. Frühbeck, G.; Busetto, L.; Dicker, D.; Yumuk, V.; Goossens, G.H.; Hebebrand, J.; Halford, J.G.; Farpour-Lambert, N.J.; Blaak, E.E.; Woodward, E.; et al. The ABCD of Obesity: An EASO Position Statement on a Diagnostic Term with Clinical and Scientific Implications. Obes. Facts 2019, 12, 131–136. [Google Scholar] [CrossRef]
  6. Quail, D.F.; Dannenberg, A.J. The obese adipose tissue microenvironment in cancer development and progression. Nat. Rev. Endocrinol. 2019, 15, 139–154. [Google Scholar] [CrossRef]
  7. Pérez-Hernández, A.I.; Catalán, V.; Gómez-Ambrosi, J.; Rodríguez, A.; Frühbeck, G. Mechanisms linking excess adiposity and carcinogenesis promotion. Front. Endocrinol. 2014, 5, 65. [Google Scholar]
  8. Xia, X.; Hu, Z.; Wang, S.; Yin, K. Netrin-1: An emerging player in inflammatory diseases. Cytokine Growth Factor Rev. 2022, 64, 46–56. [Google Scholar] [CrossRef]
  9. Ziegon, L.; Schlegel, M. Netrin-1: A modulator of macrophage driven acute and chronic inflammation. Int. J. Mol. Sci. 2021, 23, 275. [Google Scholar] [CrossRef]
  10. Mazelin, L.; Bernet, A.; Bonod-Bidaud, C.; Pays, L.; Arnaud, S.; Gespach, C.; Bredesen, D.E.; Scoazec, J.Y.; Mehlen, P. Netrin-1 controls colorectal tumorigenesis by regulating apoptosis. Nature 2004, 431, 80–84. [Google Scholar] [CrossRef]
  11. Ylivinkka, I.; Keski-Oja, J.; Hyytiäinen, M. Netrin-1: A regulator of cancer cell motility? Eur J Cell Biol 2016, 95, 513–520. [Google Scholar] [CrossRef] [Green Version]
  12. Arakawa, H. Netrin-1 and its receptors in tumorigenesis. Nat. Rev. Cancer 2004, 4, 978–987. [Google Scholar] [CrossRef] [PubMed]
  13. Sharma, M.; Schlegel, M.; Brown, E.J.; Sansbury, B.E.; Weinstock, A.; Afonso, M.S.; Corr, E.M.; van Solingen, C.; Shanley, L.C.; Peled, D.; et al. Netrin-1 Alters Adipose Tissue Macrophage Fate and Function in Obesity. Immunometabolism 2019, 1, e190010. [Google Scholar] [CrossRef] [PubMed]
  14. Mentxaka, A.; Gómez-Ambrosi, J.; Ramírez, B.; Rodríguez, A.; Becerril, S.; Neira, G.; Valentí, V.; Moncada, R.; Silva, C.; Unamuno, X.; et al. Netrin-1 promotes visceral adipose tissue inflammation in obesity and is associated with insulin resistance. Nutrients 2022, 14, 4372. [Google Scholar] [CrossRef] [PubMed]
  15. Ramkhelawon, B.; Hennessy, E.J.; Ménager, M.; Ray, T.D.; Sheedy, F.J.; Hutchison, S.; Wanschel, A.; Oldebeken, S.; Geoffrion, M.; Spiro, W.; et al. Netrin-1 promotes adipose tissue macrophage retention and insulin resistance in obesity. Nat. Med. 2014, 20, 377–384. [Google Scholar] [CrossRef] [PubMed]
  16. Fitamant, J.; Guenebeaud, C.; Coissieux, M.M.; Guix, C.; Treilleux, I.; Scoazec, J.Y.; Bachelot, T.; Bernet, A.; Mehlen, P. Netrin-1 expression confers a selective advantage for tumor cell survival in metastatic breast cancer. Proc. Natl. Acad. Sci. USA 2008, 105, 4850–4855. [Google Scholar] [CrossRef]
  17. Han, P.; Liu, J.; Lei, Y.; Lin, Z.; Tian, D.; Yan, W. Netrin-1 promotes the collective cell migration of liver cancer cells in a 3D cell culture model. J. Physiol. Biochem. 2019, 75, 489–498. [Google Scholar] [CrossRef]
  18. Paradisi, A.; Maisse, C.; Coissieux, M.M.; Gadot, N.; Lépinasse, F.; Delloye-Bourgeois, C.; Delcros, J.G.; Svrcek, M.; Neufert, C.; Fléjou, J.F.; et al. Netrin-1 up-regulation in inflammatory bowel diseases is required for colorectal Cancer progression. Proc. Natl. Acad. Sci. USA 2009, 106, 17146–17151. [Google Scholar] [CrossRef]
  19. Li, B.; Shen, K.; Zhang, J.; Jiang, Y.; Yang, T.; Sun, X.; Ma, X.; Zhu, J. Serum netrin-1 as a biomarker for colorectal cancer detection. Cancer Biomark. 2020, 28, 391–396. [Google Scholar] [CrossRef]
  20. Kefeli, U.; Yildirim, M.E.; Aydin, D.; Madenci, O.C.; Yasar, N.; Sener, N.; Mert, A.G.; Yuksel, S.; Ercelep, O.B.; Korkmaz, T.; et al. Netrin-1 concentrations in patients with advanced gastric cancer and its relation with treatment. Biomarkers 2012, 17, 663–667. [Google Scholar] [CrossRef]
  21. Paradisi, A.; Maisse, C.; Bernet, A.; Coissieux, M.M.; Maccarrone, M.; Scoazec, J.Y.; Mehlen, P. NF-KappaB regulates netrin-1 expression and affects the conditional tumor suppressive activity of the netrin-1 receptors. Gastroenterology 2008, 135, 1248–1257. [Google Scholar] [CrossRef] [PubMed]
  22. Paradisi, A.; Mehlen, P. Netrin-1, a missing link between chronic inflammation and tumor progression. Cell Cycle 2010, 9, 1253–1262. [Google Scholar] [CrossRef] [PubMed]
  23. Castets, M.; Broutier, L.; Molin, Y.; Brevet, M.; Chazot, G.; Gadot, N.; Paquet, A.; Mazelin, L.; Jarrosson-Wuilleme, L.; Scoazec, J.-Y.; et al. DCC constrains tumour progression via its dependence receptor activity. Nature 2011, 482, 534–537. [Google Scholar] [CrossRef]
  24. Frühbeck, G.; Catalán, V.; Rodríguez, A.; Ramírez, B.; Becerril, S.; Salvador, J.; Colina, I.; Gómez-Ambrosi, J. Adiponectin-leptin ratio is a functional biomarker of adipose tissue inflammation. Nutrients 2019, 11, 454. [Google Scholar] [CrossRef]
  25. Gómez-Ambrosi, J.; Silva, C.; Catalán, V.; Rodríguez, A.; Galofré, J.C.; Escalada, J.; Valentí, V.; Rotellar, F.; Romero, S.; Ramírez, B.; et al. Clinical usefulness of a new equation for estimating body fat. Diabetes Care 2012, 35, 383–388. [Google Scholar] [CrossRef]
  26. Rodríguez, A.; Gomez-Ambrosi, J.; Catalan, V.; Rotellar, F.; Valentí, V.; Silva, C.; Mugueta, M.D.C.; Pulido, M.R.; Vázquez, R.; Salvador, J.; et al. The ghrelin O-acyltransferase–ghrelin system reduces TNF-α-induced apoptosis and autophagy in human visceral adipocytes. Diabetologia 2012, 55, 3038–3050. [Google Scholar] [CrossRef]
  27. Muruzábal, F.J.; Frühbeck, G.; Gómez-Ambrosi, J.; Archanco, M.; Burrell, M.A. Immunocytochemical detection of leptin in non-mammalian vertebrate stomach. Gen. Comp. Endocrinol. 2002, 128, 149–152. [Google Scholar] [CrossRef]
  28. Rodríguez, A.; Catalán, V.; Gómez-Ambrosi, J.; García-Navarro, S.; Rotellar, F.; Valentí, V.; Silva, C.; Gil, M.J.; Salvador, J.; Burrell, M.A.; et al. Insulin- and leptin-mediated control of aquaglyceroporins in human adipocytes and hepatocytes is mediated via the PI3K/Akt/MTOR signaling cascade. J. Clin. Endocrinol. Metab. 2011, 96, E586–E597. [Google Scholar] [CrossRef]
  29. Frühbeck, G.; Mentxaka, A.; Ahechu, P.; Gómez-Ambrosi, J.; Ramírez, B.; Becerril, S.; Rodríguez, A.; Unamuno, X.; Cienfuegos, J.A.; Casado, M.; et al. The differential expression of the inflammasomes in adipose tissue and colon influences the development of colon cancer in a context of obesity by regulating intestinal inflammation. J. Inflamm. Res. 2021, 14, 6431–6446. [Google Scholar] [CrossRef]
  30. Catalán, V.; Gómez-Ambrosi, J.; Rodríguez, A.; Ramírez, B.; Ortega, V.A.; Hernández-Lizoain, J.L.; Baixauli, J.; Becerril, S.; Rotellar, F.; Valentí, V.; et al. IL-32α-induced inflammation constitutes a link between obesity and colon cancer. Oncoimmunology 2017, 6, e1328338. [Google Scholar] [CrossRef]
  31. Catalán, V.; Gómez-Ambrosi, J.; Rotellar, F.; Silva, C.; Rodríguez, A.; Salvador, J.; Gil, M.J.; Cienfuegos, J.A.; Frühbeck, G. Validation of endogenous control genes in human adipose tissue: Relevance to obesity and obesity-associated type 2 diabetes mellitus. Horm. Metab. Res. 2007, 39, 495–500. [Google Scholar] [CrossRef] [PubMed] [Green Version]
  32. Ning, Y.; Manegold, P.C.; Hong, Y.K.; Zhang, W.; Pohl, A.; Lurje, G.; Winder, T.; Yang, D.; LaBonte, M.J.; Wilson, P.M.; et al. Interleukin-8 is associated with proliferation, migration, angiogenesis and chemosensitivity in vitro and in vivo in colon cancer cell line models. Int. J. Cancer 2011, 128, 2038–2049. [Google Scholar] [CrossRef] [PubMed]
  33. Kuai, W.X.; Wang, Q.; Yang, X.Z.; Zhao, Y.; Yu, R.; Tang, X.J. Interleukin-8 associates with adhesion, migration, invasion and chemosensitivity of human gastric cancer cells. World J. Gastroenterol. 2012, 18, 979–985. [Google Scholar] [CrossRef] [PubMed]
  34. Bird, C.; Kirstein, S. Real-time, label-free monitoring of cellular invasion and migration with the XCELLigence system. Nat. Methods 2009, 6, v–vi. [Google Scholar] [CrossRef]
  35. Ly, N.P.; Komatsuzaki, K.; Fraser, I.P.; Tseng, A.A.; Prodhan, P.; Moore, K.J.; Kinane, T.B. Netrin-1 inhibits leukocyte migration in vitro and in vivo. Proc. Natl. Acad. Sci. USA 2005, 102, 14729–14734. [Google Scholar] [CrossRef]
  36. Martín, M.; Rodríguez, A.; Gómez-Ambrosi, J.; Ramírez, B.; Becerril, S.; Catalán, V.; López, M.; Diéguez, C.; Frühbeck, G.; Burrel, M.A. Caloric restriction prevents metabolic dysfunction and the changes in hypothalamic neuropeptides associated with obesity independently of dietary fat content in rats. Nutrients 2021, 13, 2128. [Google Scholar] [CrossRef]
  37. Nieman, K.M.; Romero, I.L.; Van Houten, B.; Lengyel, E. Adipose tissue and adipocytes support tumorigenesis and metastasis. Biochim. Biophys. Acta 2013, 1831, 1533–1541. [Google Scholar] [CrossRef]
  38. Rajesh, Y.; Sarkar, D. Association of adipose tissue and adipokines with development of obesity-induced liver cancer. Int. J. Mol. Sci. 2021, 22, 2163. [Google Scholar] [CrossRef]
  39. Zhang, X.; Cui, P.; Ding, B.; Guo, Y.; Han, K.; Li, J.; Chen, H.; Zhang, W. Netrin-1 elicits metastatic potential of non-small cell lung carcinoma cell by enhancing cell invasion, migration and vasculogenic mimicry via EMT induction. Cancer Gene Ther. 2018, 25, 18–26. [Google Scholar] [CrossRef]
  40. Chen, H.; Chen, Q.; Luo, Q. Expression of netrin-1 by hypoxia contributes to the invasion and migration of prostate carcinoma cells by regulating YAP activity. Exp. Cell Res. 2016, 349, 302–309. [Google Scholar] [CrossRef]
  41. Kefeli, U.; Ucuncu Kefeli, A.; Cabuk, D.; Isik, U.; Sonkaya, A.; Acikgoz, O.; Ozden, E.; Uygun, K. Netrin-1 in cancer: Potential biomarker and therapeutic target? Tumor Biol. 2017, 39, 1–7. [Google Scholar] [CrossRef] [PubMed] [Green Version]
  42. Frühbeck, G. Obesity: Aquaporin enters the picture. Nature 2005, 438, 436–437. [Google Scholar] [CrossRef] [PubMed]
  43. Catalan, V.; Gómez-Ambrosi, J.; Rodríguez, A.; Ramírez, B.; Rotellar, F.; Valentí, V.; Silva, C.; Gil, M.J.; Fernández-Real, J.M.; Salvador, J.; et al. Increased Levels of Calprotectin in Obesity Are Related to Macrophage Content: Impact on Inflammation and Effect of Weight Loss. Mol. Med. 2011, 17, 1157–1167. [Google Scholar] [CrossRef] [PubMed]
  44. Fantuzzi, G. Adipose tissue, adipokines, and inflammation. J. Allergy Clin. Immunol. 2005, 115, 911–919. [Google Scholar] [CrossRef]
  45. Ringel, A.E.; Drijvers, J.M.; Baker, G.J.; Catozzi, A.; García-Cañaveras, J.C.; Gassaway, B.M.; Miller, B.C.; Juneja, V.R.; Nguyen, T.H.; Joshi, S.; et al. Obesity shapes metabolism in the tumor microenvironment to suppress anti-tumor immunity. Cell 2020, 183, 1848–1866. [Google Scholar] [CrossRef]
  46. Meynet, O.; Ricci, J.E. Caloric restriction and cancer: Molecular mechanisms and clinical implications. Trends Mol. Med. 2014, 20, 419–427. [Google Scholar] [CrossRef]
  47. Olivo-Marston, S.E.; Hursting, S.D.; Perkins, S.N.; Schetter, A.; Khan, M.; Croce, C.; Harris, C.C.; Lavigne, J. Effects of calorie restriction and diet-induced obesity on murine colon carcinogenesis, growth and inflammatory factors, and microRNA expression. PLoS ONE 2014, 9, e94765. [Google Scholar] [CrossRef]
  48. Steinbach, G.; Kumar, S.P.; Reddy, B.S.; Lipkin, M.; Holt, P.R. Effects of caloric restriction and dietary fat on epithelial cell proliferation in rat colon. Cancer Res. 1993, 53, 2745–2749. [Google Scholar]
  49. Grandin, M.; Meier, M.; Delcros, J.G.; Nikodemus, D.; Reuten, R.; Patel, T.R.; Goldschneider, D.; Orriss, G.; Krahn, N.; Boussouar, A.; et al. Structural decoding of the netrin-1/UNC5 interaction and its therapeutical implications in cancers. Cancer Cell 2016, 29, 173–185. [Google Scholar] [CrossRef]
  50. Rodrigues, S.; De Wever, O.; Bruyneel, E.; Rooney, R.J.; Gespach, C. Opposing roles of netrin-1 and the dependence receptor DCC in cancer cell invasion, tumor growth and metastasis. Oncogene 2007, 26, 5615–5625. [Google Scholar] [CrossRef]
  51. Mehlen, P.; Llambi, F. Role of netrin-1 and netrin-1 dependence receptors in colorectal cancers. Br. J. Cancer 2005, 93, 1–6. [Google Scholar] [CrossRef] [PubMed]
  52. Boyer, N.P.; Gupton, S.L. Revisiting netrin-1: One who guides (axons). Front. Cell. Neurosci. 2018, 12, 221. [Google Scholar] [CrossRef] [PubMed]
  53. Untiveros, G.; Raskind, A.; Linares, L.; Dotti, A.; Strizzi, L. Netrin-1 stimulates migration of neogenin expressing aggressive melanoma cells. Int. J. Mol. Sci. 2022, 23, 12751. [Google Scholar] [CrossRef]
  54. Shin, S.K.; Nagasaka, T.; Jung, B.H.; Matsubara, N.; Kim, W.H.; Carethers, J.M.; Boland, C.R.; Goel, A. Epigenetic and genetic alterations in netrin-1 receptors UNC5C and DCC in human colon cancer. Gastroenterology 2007, 133, 1849–1857. [Google Scholar] [CrossRef] [PubMed]
  55. Qi, Q.; Li, D.Y.; Luo, H.R.; Guan, K.L.; Ye, K. Netrin-1 exerts oncogenic activities through enhancing yes-associated protein stability. Proc. Natl. Acad. Sci. USA 2015, 112, 7255–7260. [Google Scholar] [CrossRef] [PubMed]
  56. First in Human Evaluation of Safety, Pharmacokinetics, and Clinical Activity of a Monoclonal Antibody Targeting Netrin-1 in Patients with Advanced/Metastatic Solid Tumors (NP137). Available online: https://clinicaltrials.gov/ct2/show/NCT02977195 (accessed on 12 December 2022).
  57. Murray, M.J. The role of netrins and their receptors in epithelial mesenchymal plasticity during development. Cells Tissues Organs 2017, 203, 71–81. [Google Scholar] [CrossRef]
  58. Sturm, A.; Baumgart, D.C.; d’Heureuse, J.H.; Hotz, A.; Wiedenmann, B.; Dignass, A.U. CXCL8 modulates human intestinal epithelial cells through a CXCR1 dependent pathway. Cytokine 2005, 29, 42–48. [Google Scholar] [CrossRef]
Figure 1. Gene expression levels of (A) netrin-1 (NTN1), (B) neogenin-1 (NEO1), (C) deleted in colorectal carcinomas (DCC), and (D) uncoordinated-5 homolog family member B (UNC5B) in visceral adipose tissue (VAT) from normal weight volunteers (NW) without (n = 6–9) and with (n = 14–16) colon cancer (CC) and patients with obesity (OB) without CC (n = 34–37) and with CC (n = 9–12). Bars represent the mean ± SEM. Differences between groups were analysed by two-way ANCOVA.
Cancers 15 01038 g001
Figure 2. Effect of caloric restriction on netrin-1 (Ntn1), neogenin-1 (Neo1), deleted in colorectal carcinomas (Dcc), and uncoordinated-5 homolog family member B (Unc5b) gene expression levels in the colons of rats under a normal (ND) (A) or a high-fat diet (HFD) (B) (n = 4–12). Gene expression levels in rats fed an ND or an HFD were assumed to be 1. Values are the mean ± SEM. Differences between groups were analysed by two-tailed unpaired Student’s t-tests. * p < 0.05, ** p < 0.01.
Cancers 15 01038 g002
Figure 3. Gene expression levels of neogenin-1 (NEO1), deleted in colorectal carcinomas (DCC) and uncoordinated-5 homolog family member B (UNC5B) in (A) HT-29 and (B) Caco-2 human colorectal cancer cell lines after the treatment with adipocyte conditioned media (ACM) for 24 h. Gene expression levels in untreated cells were assumed to be 1. Values are the mean ± SEM (n = 4–6 per group). Differences between groups were analysed by one-way ANOVA followed by Dunnett’s post hoc tests. * p < 0.05 and ** p < 0.01.
Cancers 15 01038 g003
Figure 4. Gene expression levels of neogenin-1 (NEO1) deleted in colorectal carcinomas (DCC) and uncoordinated-5 homolog family member B (UNC5B) in (A) HT-29 and (B) Caco-2 human colorectal cancer cell lines after the treatment with netrin-1 (NTN-1) for 24 h. Gene expression levels in untreated cells were assumed to be 1. Values are the mean ± SEM (n = 4–6 per group). Differences between groups were analysed by one-way ANOVA followed by Dunnett’s post hoc tests. * p < 0.05.
Cancers 15 01038 g004
Figure 5. Migration of Caco-2 cells treated with (A) adipocyte conditioned media (ACM), (B) netrin-1 (NTN-1), and interleukin (IL)-8. RPMI media with 2% FBS was used as the baseline control (CTL), and IL-8 was the positive control of migration. Graphs represent the mean from four replicates in three different experiments. Differences between groups were analysed by one-way ANOVA followed by Dunnett’s post hoc tests. ** p < 0.01 and *** p < 0.001 vs. CTL.
Cancers 15 01038 g005
Figure 6. Obesity-associated chronic low-grade inflammation is related with increased risk of colon cancer. In this context, the increased gene expression levels of the pro-inflammatory factor NTN1 and its receptor NEO1 in VAT from patients with OB and CC promote a pro-inflammatory microenvironment that may favour tumour progression. The treatment of a colorectal adenocarcinoma cell line with NTN-1 and with the ACM from patients with OB promoted tumour cell migration, emphasising a key role of NTN-1 in CC progression. CC, colon cancer; DCC, deleted in colorectal carcinomas; NEO-1, neogenin-1; NTN1, netrin-1; OB, obesity; UNC5B, uncoordinated-5 homolog B; VAT, visceral adipose tissue.
Cancers 15 01038 g006
Table 1. Anthropometric and biochemical characteristics of the volunteers included in the study.
Non-CCCC
NWOBNWOBP OBP CCP OB × CC
n9371612
Age (years)44 ± 6.446 ± 2.260 ± 2.664 ± 3.10.410<0.0010.652
Weight (kg)59.5 ± 2.8115 ± 3.8 ***64.5± 2.2 †††80.3 ± 2.9 **,†††,#<0.0010.010<0.001
BMI (kg/m2)20.8 ± 0.540.9 ± 1.3 ***21.8 ± 0.4 †††29.5 ± 0.7 ***,†††,###<0.0010.001<0.001
Estimated BF (%)22.4 ± 2.150.0 ± 1.3 ***28.3 ± 1.6 †††35.2 ± 1.7 **,†††<0.0010.076<0.001
Glucose (mg/dL)88 ± 4.6119.9 ± 8.4130.2 ± 14.9127.5 ± 8.80.3410.2170.105
Triglycerides (mg/dL)71 ± 11.1131.9 ± 9.794.2 ± 21.8182 ± 190.0050.3820.569
Leucocytes (×106)6.4 ± 0.57.3 ± 0.46.8 ± 17.7 ± 0.80.5420.5240.507
S100A8 (ng/mL)357.4 ± 93.6552.9 ± 69233 ± 34.8387.9 ± 57.4<0.0010.5910.372
Lactoferrin (ng/mL)37.9 ± 5.771.3 ± 7.750.8 ± 7.255.8 ± 7.60.0370.9810.197
CCL5 (ng/mL)5.1 ± 0.79.3 ± 0.7 **6.6 ± 0.7 5.4 ± 0.7 ††0.0480.0430.002
BMI, body mass index; BF, body fat; CC, colon cancer; CCL5, C-C chemokine ligand 5; NW, normal weight; OB, obesity; S100A8, S100 calcium-binding protein A8. Data are mean ± SEM. Differences between groups were analysed by two-way ANCOVA and one-way ANOVA followed by Tukey’s post hoc tests as appropriate. ** p < 0.01 and *** p < 0.001 vs. NW non-CC; p < 0.05, †† p < 0.01 and ††† p < 0.001 vs. OB non-CC; # p < 0.05 and ### p < 0.001 vs. NW CC. p values lower than 0.05 are highlighted in bold.
Table 2. Analysis of the correlation between gene expression levels of NTN1, its receptors and inflammation-related genes in visceral adipose tissue.
mRNA NTN1mRNA NEO1mRNA DCCmRNA UNC5B
rPrPrPrP
mRNA NTN1--0.69<0.0010.320.0110.370.004
mRNA NEO10.69<0.001--0.370.0030.49<0.001
mRNA DCC0.320.0110.370.003--0.47<0.001
mRNA UNC5B0.370.0040.49<0.0010.470.000--
mRNA ASC0.40<0.0010.57<0.0010.130.3070.41<0.001
mRNA IL1B0.030.8110.210.1280.200.146−0.040.756
mRNA IL180.43<0.0010.54<0.0010.160.2250.43<0.001
mRNA NLRP6−0.070.59−0.020.8720.070.6100.060.656
Values are Pearson’s correlation coefficients and associated p values. ASC, apoptosis-associated speck-like protein containing a CARD; DCC, deleted in colorectal carcinomas; IL1B, interleukin 1 beta; IL18, interleukin 18; NEO1, neogenin-1; NLRP6, NLR family pyrin domain containing 6; NTN1, netrin-1; UNC5B, uncoordinated-5 homolog B. Bold number indicates statistically significant values.
Table 3. Gene expression levels of inflammation-related factors in human visceral adipose tissue.
Non CCCC
NWOBNWOBP OBP CCP OB × CC
ASC1.00 ± 0.231.46 ± 0.10 **1.62 ± 0.19 **1.61 ± 0.29 *0.0030.0010.010
IL1B1.00 ± 0.315.71 ± 0.265.34 ± 2.048.49 ± 2.610.0160.0220.439
IL181.00 ± 0.280.95 ± 0.121.41 ± 0.231.14 ± 0.360.0260.0040.024
NLRP61.00 ± 0.236.94 ± 1.366.00 ± 1.639.61 ± 2.940.0060.0040.137
ASC, apoptosis-associated speck-like protein containing a CARD; CC, colorectal cancer; IL, interleukin; NW, normal weight; NLRP6, NLR family pyrin domain containing 6; OB, obesity. Data are mean ± SEM. Differences between groups were analysed by two-way ANCOVA and one-way ANOVA followed by Tukey’s post hoc tests as appropriate. Bold number indicates statistically significant values. * p < 0.05 and ** p < 0.01 vs. LN non-CC.
Disclaimer/Publisher’s Note: The statements, opinions and data contained in all publications are solely those of the individual author(s) and contributor(s) and not of MDPI and/or the editor(s). MDPI and/or the editor(s) disclaim responsibility for any injury to people or property resulting from any ideas, methods, instructions or products referred to in the content.

