Article

Selective Activation of M1 Muscarinic Receptors Attenuates Human Colon Cancer Cell Proliferation

1
Department of Surgery, University of Maryland School of Medicine, Baltimore, MD 21201, USA
2
Department of Medicine, Division of Gastroenterology and Hepatology, University of Maryland School of Medicine, Baltimore, MD 21201, USA
3
Department of Pathology, University of Maryland School of Medicine, Baltimore, MD 21201, USA
4
VA Maryland Healthcare System, Baltimore, MD 21201, USA
5
Marlene and Stewart Greenebaum Cancer Center, University of Maryland School of Medicine, Baltimore, MD 21201, USA
6
Department of Biochemistry and Molecular Biology, University of Maryland School of Medicine, Baltimore, MD 21201, USA
*
Author to whom correspondence should be addressed.
These authors contributed equally to this work.
Cancers 2023, 15(19), 4766; https://doi.org/10.3390/cancers15194766
Submission received: 24 August 2023 / Revised: 20 September 2023 / Accepted: 22 September 2023 / Published: 28 September 2023
(This article belongs to the Topic Advance in Tumorigenesis Research and Cancer Cell Therapy)

Abstract

:

Simple Summary

M1 and M3 muscarinic receptors, M1R and M3R, play important roles in health and disease. Previously, we found opposite patterns of expression in colon cancer for the genes encoding M1R and M3R. Likewise, M1R and M3R deficiency had opposite effects in a mouse colon cancer model. Based on these observations, we hypothesized that activating M1R might inhibit the growth of colon cancer cells. Here, we confirmed divergent expression of M1R and M3R protein in progressive colon cancer. Then, we discovered that in contrast to M3R activators, treating human colon cancer cells with M1R activators inhibited cell growth. The effects of M1R activation appeared to be mediated by a signaling pathway downstream of the receptor. Notably, M1R activation was more effective than conventional chemotherapy agents at inhibiting colon cancer cell growth and combining these agents augmented this action. We believe our findings support further investigation of selective M1R activators as treatments for advanced colon cancer.

Abstract

M3 muscarinic receptor (M3R) activation stimulates colon cancer cell proliferation, migration, and invasion; M3R expression is augmented in colon cancer and ablating M3R expression in mice attenuates colon neoplasia. Several lines of investigation suggest that in contrast to these pro-neoplastic effects of M3R, M1R plays an opposite role, protecting colon epithelial cells against neoplastic transformation. To pursue these intriguing findings, we examined the relative expression of M1R versus M3R in progressive stages of colon neoplasia and the effect of treating colon cancer cells with selective M1R agonists. We detected divergent expression of M1R and M3R in progressive colon neoplasia, from aberrant crypt foci to adenomas, primary colon cancers, and colon cancer metastases. Treating three human colon cancer cell lines with two selective M1R agonists, we found that in contrast to the effects of M3R activation, selective activation of M1R reversibly inhibited cell proliferation. Moreover, these effects were diminished by pre-incubating cells with a selective M1R inhibitor. Mechanistic insights were gained using selective chemical inhibitors of post-muscarinic receptor signaling molecules and immunoblotting to demonstrate M1R-dependent changes in the activation (phosphorylation) of key downstream kinases, EGFR, ERK1/2, and p38 MAPK. We did not detect a role for drug toxicity, cellular senescence, or apoptosis in mediating M1R agonist-induced attenuated cell proliferation. Lastly, adding M1R-selective agonists to colon cancer cells augmented the anti-proliferative effects of conventional chemotherapeutic agents. Collectively, these results suggest that selective M1R agonism for advanced colon cancer, alone or in combination with conventional chemotherapy, is a therapeutic strategy worth exploring.

1. Introduction

Members of the cholinergic muscarinic receptor family, expressed ubiquitously in all organs and tissues examined, play key roles in regulating important normal and neoplastic cell functions [1]. Of the five cholinergic muscarinic receptor subtypes (designated M1R–M5R and encoded respectively by CHRM1CHRM5), M1R, M3R, and M5R, often referred to as MRodd, are coupled to Gq and downstream signaling is mediated by phospholipid turnover which increases cellular calcium levels that, in turn, activates a variety of protein kinases. In contrast, M2R and M4R (MReven), coupled to Gs, modulate protein kinase activity by altering cellular levels of cAMP. Notably, few studies have examined differences between the actions of muscarinic receptor subtypes within these two subfamilies.
Amongst other key functions in normal gastrointestinal biology, muscarinic receptors regulate cell proliferation, migration, secretion, absorption, and intestinal stem cell differentiation [2]. In gastrointestinal neoplasia, muscarinic receptors regulate cell proliferation, survival, migration, and invasion [3]; the latter being hallmarks of an invasive phenotype. In human colon cancer cell lines, signaling via M3R selectively stimulates the expression and release of matrix metalloproteinase (MMP)1, MMP7, and other proteases that facilitate colon cancer cell migration and invasion. Treating human colon cancer cells with non-subtype-selective muscarinic agonists (e.g., acetylcholine or bethanechol) stimulates cell proliferation, invasion, and intestinal tumor formation in murine colon cancer models. M3R overexpression by primary colon adenocarcinomas predicts metastatic disease and M3R-deficient mice and mice treated with a non-selective muscarinic receptor inhibitor (scopolamine) exhibit attenuated intestinal neoplasia [3].
In contrast to M3R, much less is known about the functional role of M1R expression and activation in health and disease. Previously, it was considered that the functions of M1R and M3R overlapped, i.e., that their activation resulted in similar downstream effects with variable efficacy, and that this redundancy presumably provided survival advantages to the organism. For example, work using mice with global knockout of M1R, M3R, and combined deficiency of both M1R and M3R revealed that genetic ablation of both receptor subtypes was required to completely attenuate cholinergic agonist-induced pepsinogen secretion. These findings suggested overlapping activities of these two muscarinic receptor subtypes.
The current line of investigation was instigated by our surprising finding that in contrast to the pro-neoplastic effects of M3R, M1R expression appeared to play an opposite role, protecting colon epithelial cells against neoplasia. In an unbiased analysis, we found that in contrast to CHRM3, expression of CHRM1 was significantly downregulated in human colorectal adenocarcinomas [4]. In line with these observations, using a murine colon cancer model, we had previously reported that global M1R deficiency resulted in a modest increase in the number of colon tumors, and in mice with dual M1R and M3R deficiency, global M1R deficiency negated the anti-neoplastic effects of M3R knockout; that is, in contrast to azoxymethane (AOM)-treated M3R-deficient mice that had fewer colon tumors than AOM-treated wild-type (WT) control mice, AOM-treated mice with dual deficiency of M1R and M3R had as many colon tumors as control mice [5]—that is, M1R deficiency reversed the anti-neoplastic effects of M3R deficiency. Thus, in contrast to work from several laboratories supporting the concept that M3R is an oncogene and tumor promoter [6,7,8], our findings suggest that within the context of colorectal cancer, M1R functions as a tumor suppressor. This intriguing paradigm is supported by our discovery of additional instances where M1R and M3R have diametrically divergent effects; for example, whereas activation of M3R in murine models of advanced liver disease promotes fibrosis and advanced disease, M1R activation mitigates liver scarring.
As we report in the present communication, to pursue these interesting observations, we examined the relative expression of M1R versus M3R in progressive stages of human colon neoplasia. We then examined the actions of activating M1R with selective receptor agonists. When relevant, we compared results to those obtained using non-subtype-selective muscarinic receptor agonists and antagonists. The overarching goal was to elucidate the relative contribution of M1R expression and activation to colon cancer cell function. This work uncovered divergent expression of M1R and M3R in progressive colon neoplasia, from aberrant crypt foci to adenomas, primary colon cancers, and colon cancer metastases. Then, using well-studied, established colon cancer cell lines we found that in contrast to M3R, selective activation of M1R inhibited human colon cancer cell proliferation. Confirmatory evidence was obtained by showing similar effects when applying two selective M1R agonists to three different colon cancer cell lines, and attenuation of these effects when we pre-incubated cells with a selective inhibitor of M1R activation. We gained mechanistic insights using selective chemical inhibitors of post-receptor signaling pathways and assessing M1R-dependent changes in the activation (phosphorylation) of key downstream kinases. We also compared the actions of M1R-selective agonists alone and in combination with conventional chemotherapeutics for colon cancer, 5-fluorouracil and oxaliplatin. Our results suggest that the selective M1R agonism may be a worthwhile treatment strategy for advanced colon cancer that is worthy of further exploration.

2. Materials and Methods

2.1. Reagents and Antibodies

Antibodies against total and phospho-p38 MAPK (catalog #9212 and 9211), total and phospho-ERK1/2 (catalog #4695 and 4377), and β-actin (catalog #93473) were purchased from Cell Signaling (Danvers, MA, USA). Acetylcholine (ACh), atropine, McN-A-343 (McN), xanomeline, VU0255035 (VU), Gö6976, SB203580, and unspecified reagents were purchased from Sigma-Aldrich (Burlington, MA, USA).

2.2. Cell Lines and Cell Culture

HT-29, H508, and HCT116 human colon cancer cell lines were purchased from American Type Culture Collection (ATCC) (Manassas, VA, USA). H508 cells were grown in RPMI 1640 (Thermo Fisher Scientific (Waltham, MA USA)) supplemented with 10% fetal bovine serum (FBS). HT-29 cells were grown in McCoy’s 5A medium (Thermo Fisher Scientific) supplemented with 10% FBS. HCT116 cells were grown in McCoy’s 5A medium (Thermo Fisher Scientific) supplemented with 10% FBS plus 50 µg/mL streptomycin and 50 U/mL penicillin. Cells were grown at 37 °C, with 5% CO2 in a humidified incubator and passaged weekly at subconfluence after trypsinization. Prior to each experiment, the cells were incubated in serum-free medium without FBS for 24 h for serum starvation.

2.3. Human Tissues

To examine M1R (CHRM1) and M3R (CHRM3) gene and protein expression, we used archived pre-existing de-identified surgical specimens of colon cancer and adjacent normal colon epithelium (approved by the University of Maryland School of Medicine Institutional Review Board and the Baltimore VA Research and Development Committee). To ensure we had sufficient material for analysis and uniform distribution of immunohistochemical staining, we used only surgical tissue specimens; we did not use smaller, endoscopic biopsies.

2.4. Immunoblot Analysis

After treatments with muscarinic receptor agonists, cells were lysed in a solution containing Cell Lysis Buffer (catalog #9803), anti-protease (catalog #5871), and anti-phosphatase (catalog #5870)—all from Cell Signaling. Cell lysates were centrifuged at 15,000× g at 4 °C for 10 min. Supernatants were collected and protein concentration was determined by the BCA method (Thermo Fisher Scientific). Proteins were separated by SDS-PAGE and transferred to PVDF membranes that were probed against total and phospho-38 MAPK, total and phospho-ERK1/2, and total and cleaved caspase-3. To confirm equal protein loading, blots were stripped and re-probed with antibodies against β-actin. Immunoblots were then developed using the Bio-Rad ChemiDoc Touch Imaging System (Bio-Rad Laboratories, Hercules, CA, USA). In most experiments, conditions were normalized and expressed relative to the positive control.

2.5. Quantitative Real-Time PCR (qPCR)

qPCR was performed on total RNA obtained from H508, HT-29, and HCT116 human colon cancer cells. We synthesized first-strand cDNAs from 5 µg RNA (Superscript III First Strand Synthesis System for RT-PCR, Invitrogen (Carlsbad, CA, USA)) and performed qPCR using 50 ng cDNA, the SYBR Green PCR Master Mix (Applied Biosystems (Foster City, CA, USA)), and 0.5 μM in 20 μL forward and reverse primers. We designed primers (Supplementary Table S1) to span introns using the National Center for Biotechnology Information nucleotide database SIM-4 gene alignment program and on-line software (www.genscript.com/ssl-bin/app/primer (accessed on 6 September 2012). We performed qPCR using Step One (Applied Biosystems) with Power SYBR Green Master Mix (ABI) and the following PCR conditions: 5 min at 95 °C followed by 37 cycles of 95 °C for 15 s, 60 °C for 20 s, 72 °C for 40 s, and final cycles at 95 °C for 15 s, 60 °C for 15 s, and 95 °C for 15 s. We normalized gene expression to β2-microglobulin (B2M) and analyzed qPCR data using the comparative CT (2−ΔΔCT) method.

2.6. Cell Proliferation Assay

Cell proliferation was measured using the WST-1 Cell Proliferation Assay Kit (Roche (Atlanta, GA, USA)), following the manufacturer’s instructions. H508, HT-29, and HCT116 cells were cultured at 50% confluence on 96-well flat-bottom plates. After serum starvation overnight, cells were treated with test chemicals for five days with or without 30-min pretreatment with inhibitors. Plates were read on a microplate reader at 440 nm 30 min after adding the WST-1 reagent. Cell proliferation rates were calculated according to the manufacturer’s protocol.

2.7. Lactate Dehydrogenase (LDH) Release Assay

Cytotoxicity was measured using the CyQUANT LDH Cytotoxicity Assay (Invitrogen). H508 cells were cultured at 50% confluence on 96-well flat-bottom plates. After serum starvation overnight, cells were treated with test chemicals for five days. The assay was performed per the manufacturer’s instructions; briefly, 50 µL of sample medium was removed from each well and treated with the reaction mixture followed by a 30-min incubation at room temperature. After 30 min, stop solution was added and the plates were examined using a microplate reader set at 490 and 680 nm. Percent cytotoxicity was determined using the manufacturer’s instructions.

2.8. Senescence-Associated β-Galactosidase

Cell senescence was evaluated using the Senescence β-Galactosidase Staining Kit (Cell Signaling). H508 cells were cultured at 50% confluence in six-well plates. After serum starvation overnight, cells were treated with test agents for 24, 48, and 72 h. Cells were fixed and stained following the manufacturer’s instructions and images were captured using a Nikon Eclipse Ti microscope (Melville, NY, USA).

2.9. Statistical Analysis

Data are presented as mean ± SE of at least three separate experiments. As appropriate for comparisons and specified in figure legends, data were analyzed using two-tailed unpaired Student’s t-test. We used global nonlinear regression to compare dose response curves. These analyses were performed using GraphPad Prism version 9.5.1 for macOS, GraphPad, Boston, MA, USA. We considered p < 0.05 to be statistically significant.

3. Results

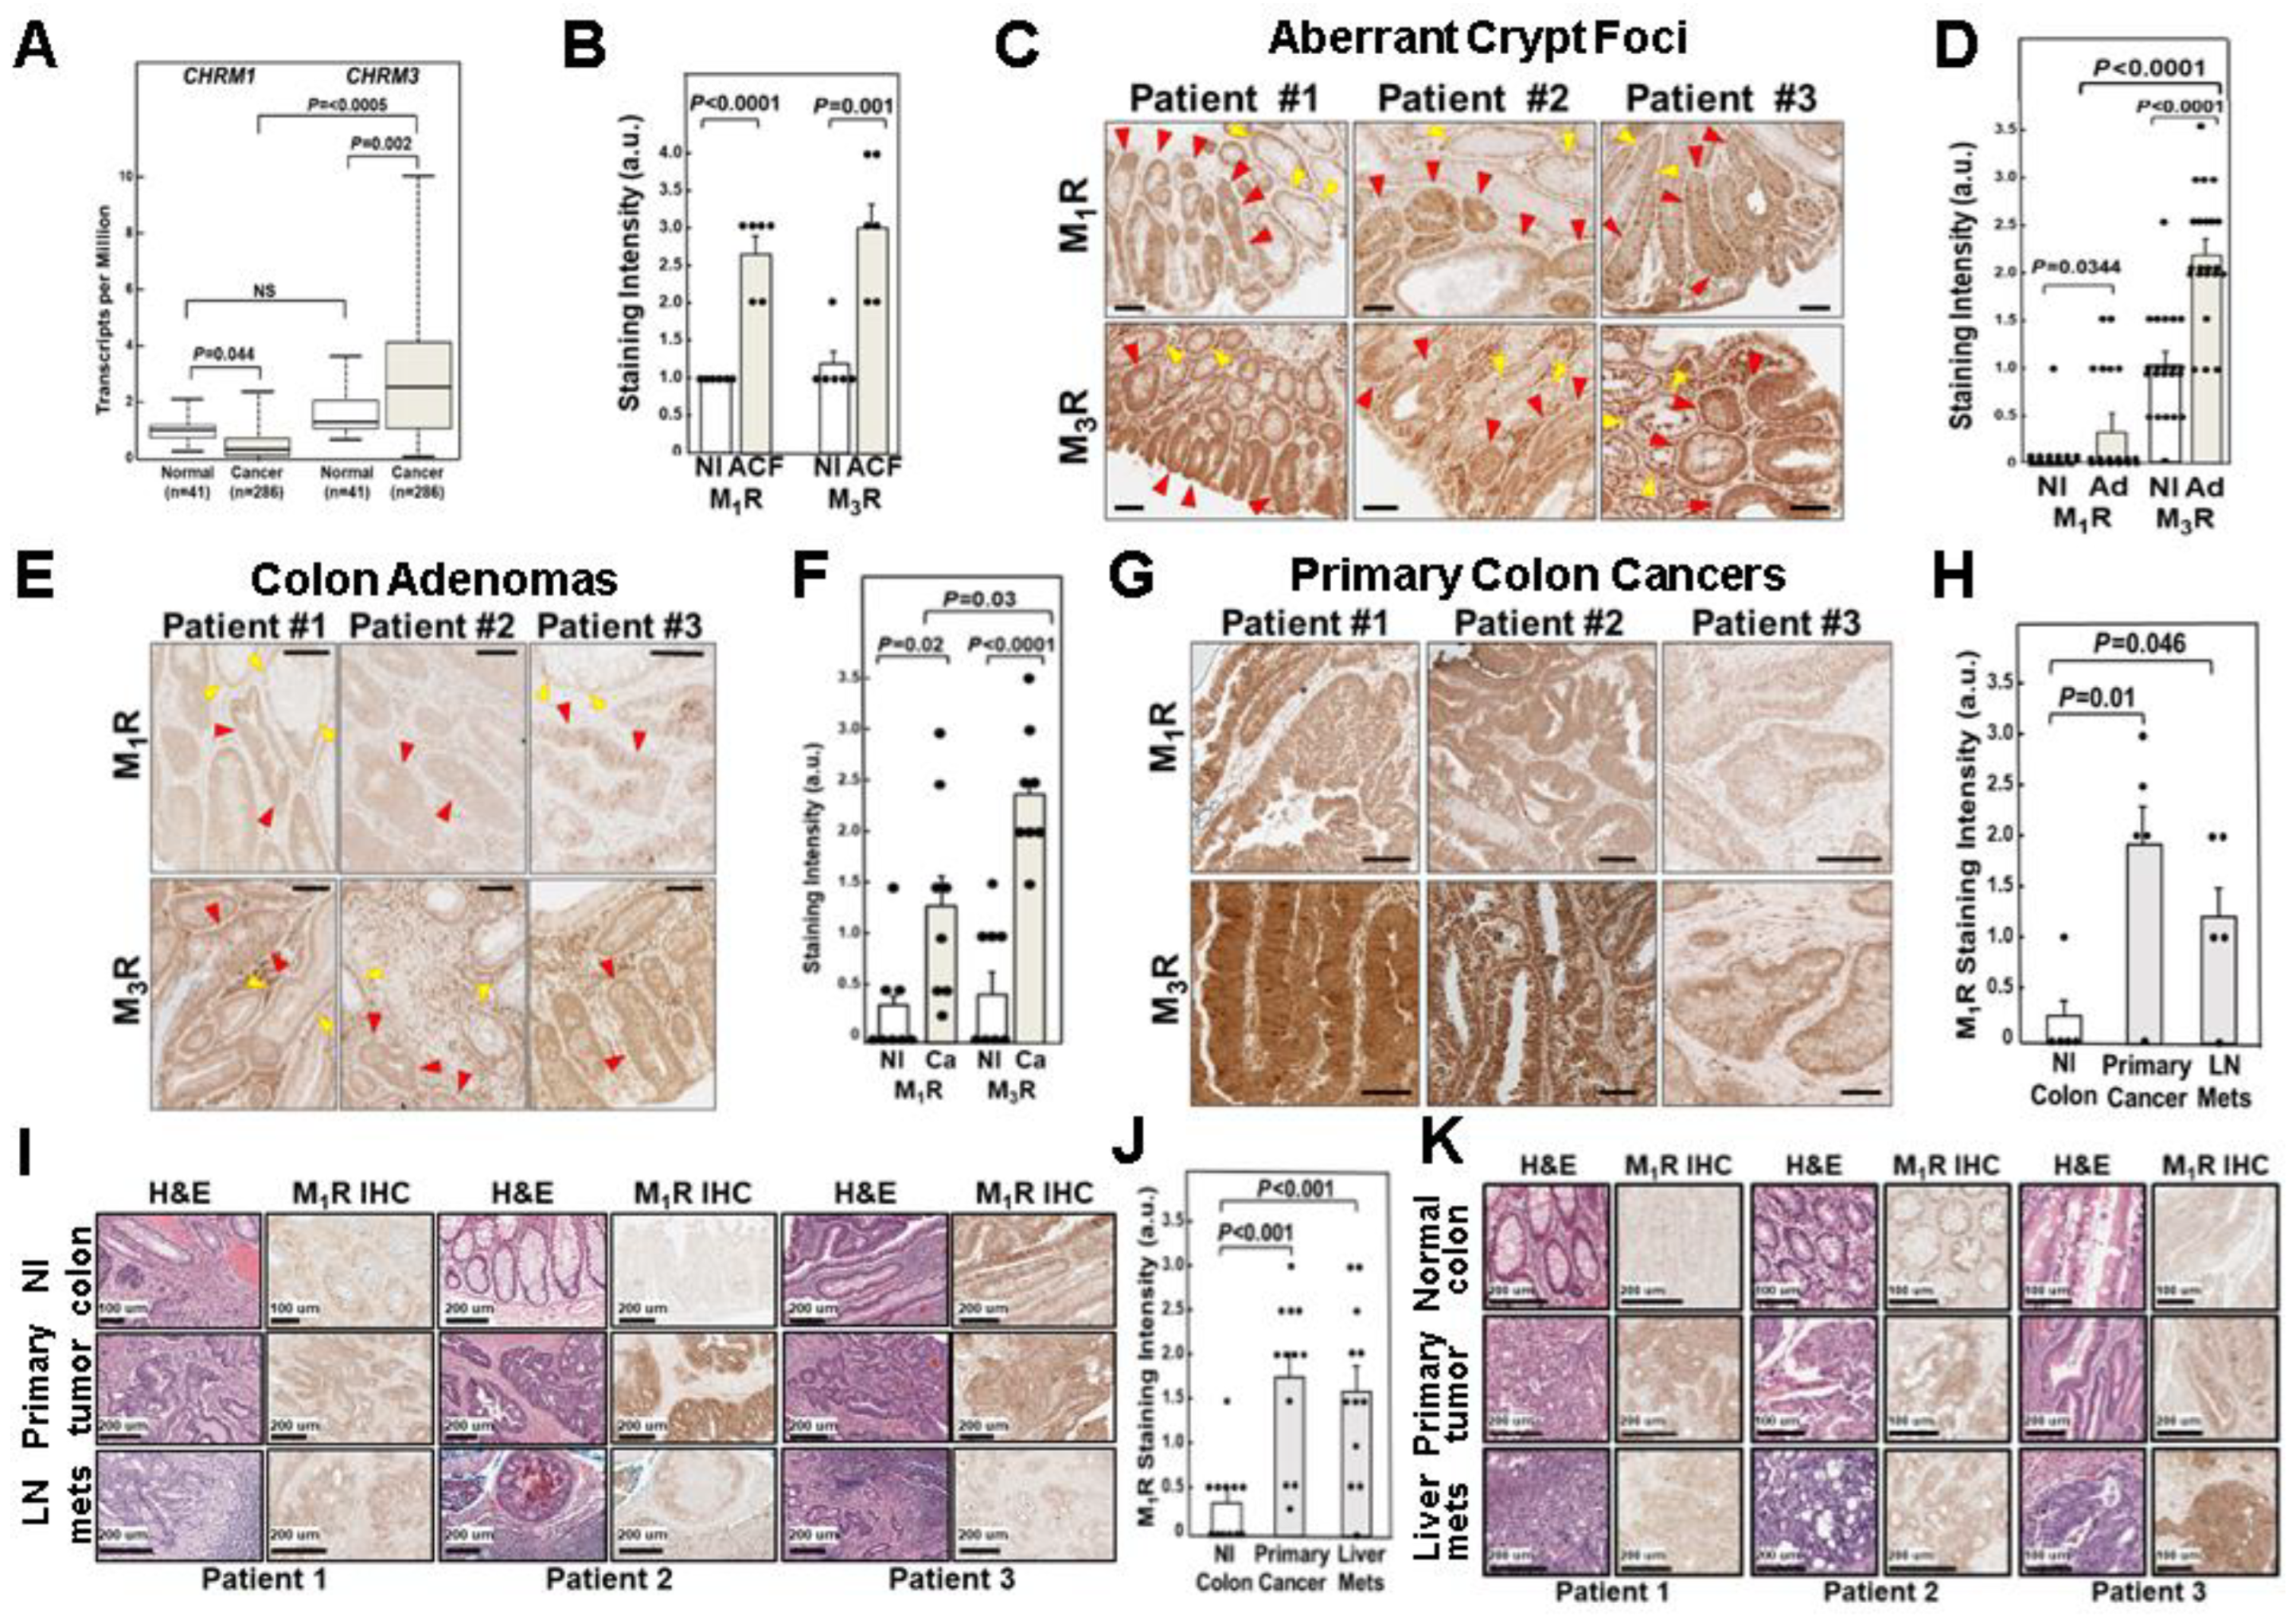
3.1. Relative CHRM1 and CHRM3 mRNA Expression in Colorectal Adenocarcinomas

Based on relatively small datasets, CHRM3, the gene encoding M3R, was reported to be overexpressed in 60–80% of colon cancers [3,4]. However, little was reported regarding CHRM1 expression in colon cancer or relative CHRM1 versus CHRM3 expression. To fill these gaps in knowledge, we performed an in-silico analysis of a publicly available online database, UALCAN, which contains larger colon cancer datasets [9]. This analysis confirmed increased CHRM3 mRNA levels in colon cancer compared to adjacent normal colon; median CHRM3 transcript levels were elevated in 286 adenocarcinomas compared to 41 normal colon samples [2.528 vs. 1.272 transcripts per million, respectively (p = 0.002)] (Figure 1A). In contrast, CHRM1 transcript levels in the same dataset were modestly, but significantly (p = 0.044), reduced in colon cancer compared to a normal colon (Figure 1A). Analysis of the UALCAN dataset [9] revealed that CHRM1 transcript levels were approximately 30% lower in colon cancer compared to a normal colon [0.316 versus 1.03 transcripts per million, respectively (p = 0.044)] (Figure 1A). Moreover, CHRM1 transcript levels in colon cancer were significantly lower than CHRM3 transcript levels (p < 0.0005; Figure 1A). We recently confirmed these findings using a smaller dataset in which colon cancer tissue samples were matched to adjacent normal tissue samples [4]. Collectively, these findings support the finding of increased CHRM3 expression but reduced CHRM1 expression in colon cancer.

3.2. Relative M1R and M3R Protein Expression in Progressive Colon Neoplasia

For a variety of reasons, including post-transcriptional regulation, mRNA expression may not precisely reflect protein expression. It has been estimated that mRNA expression may account for only 40–60% of the variance in protein expression [10,11,12,13,14]. Hence, we sought to confirm that changes in muscarinic receptor protein expression mirrored those we observed in mRNA expression. Yet, measuring muscarinic receptor protein expression is challenging due primarily to the lack of muscarinic receptor subtype-specific antibodies for immunoblotting, a problem hindering the entire field of G protein-coupled receptor research [15]. As an alternative strategy to assess relative M1R and M3R protein expression, we used subtype-selective antibodies for immunohistochemistry (IHC), an approach that also allowed us to compare receptor expression in normal and neoplastic areas within the same specimen. As recommended by Jositsch et al. to address the lack of subtype specificity of many anti-muscarinic receptor antibodies [16], we used anti-M1R and -M3R antibodies from Alomone Labs that were used previously for IHC by our lab [3] and others [17], and whose specificity we had validated using intestinal tissues harvested from wild-type, M1R- and M3R-deficient, and dual M1R/M3R-deficient mice.

3.2.1. Relative M1R and M3R Protein Expression in Aberrant Crypt Foci

We used IHC to perform a comprehensive examination of the relative expression of M1R and M3R along the continuum from normal colonic mucosa to invasive cancer. Initially, we examined M1R and M3R staining in aberrant crypt foci (ACF), the first histological manifestation of colon neoplasia [18,19,20,21]. To obtain sufficient ACFs to achieve meaningful comparisons, we examined archived deidentified colon tissues from six individuals with familial adenomatous polyposis (FAP). In FAP, APC gene mutations result in aberrant β-catenin signaling and exuberant colon neoplasia (i.e., abundant ACF), thereby facilitating the acquisition and immunohistochemical comparison of M1R and M3R expression. Staining intensity in Figure 1 was quantified using an analog scale [0 (no staining) to 4 (maximal staining)] by a senior pathologist masked to the antibody used and tissue source. As shown in Figure 1B, compared to adjacent normal colon, both M1R and M3R expression levels were increased approximately three-fold in ACF compared to adjacent normal colon (p < 0.001 and p < 0.01 for M1R and M3R, respectively). As shown by representative images (Figure 1C), even within ACF, the visual intensity of M1R and M3R staining progressively increased commensurate with advancing degrees of dysplasia. In both normal colon and ACF, we detected no significant difference in the levels of M1R compared to M3R staining intensity (Figure 1B). Based on these findings, we concluded that M1R and M3R expression levels were similar in normal colon epithelium and in the earliest stages of colon neoplasia.

3.2.2. Relative M1R and M3R Protein Expression in Colon Adenomas

Next, we compared M1R and M3R staining levels in a normal colon to more advanced colon neoplasia, tubular adenomas. As shown in Figure 1D, both M1R and M3R staining intensity, as scored on an analog scale by a senior pathologist masked to tissue source, was greater in adenomas compared to a normal colon (p = 0.0344 and p < 0.0001). In contrast to our findings in ACF, the intensity of M3R staining in adenomas was significantly greater than that for M1R staining (p < 0.0001; Figure 1D,E). Unlike our findings with ACF (Figure 1C), for both adenomas and the adjacent normal colon, M3R staining intensity exceeded that for M1R staining intensity (Figure 1E). We believe there are at least two likely explanations for these differences. First, unlike sporadic colon neoplasia represented by the samples tested in Figure 1E, aberrant β-catenin signaling in all epithelial cells in patients with FAP drives increased expression of both M1R and M3R in ‘normal’ epithelial cells. Second, increased M3R staining in a normal colon adjacent to the adenomas shown in Figure 1E is likely due to a ‘field effect’, wherein a field of chromosomal instability surrounds the area of neoplasia [22]. Representative images shown in Figure 1E highlight the differences between M1R and M3R expression in normal and adenomatous colon crypts in tissues from the same patients.

3.2.3. Relative M1R and M3R Protein Expression in Primary Colon Adenocarcinomas

Next, in tissue samples from eight individuals with colon cancer, we compared M1R and M3R staining in a normal colon and adjacent adenocarcinomas. In this set of samples, M3R and M1R staining intensity was the same in a normal colon (Figure 1F). As shown in Figure 1F, in adenocarcinomas, staining intensity for both M1R and M3R was greater than that in a normal colon (p = 0.02 and p < 0.0001). Nonetheless, the intensity of M3R staining in adenocarcinomas was again significantly greater than that for M1R staining (p = 0.03; Figure 1F). Representative images shown in Figure 1G highlight differences between M1R and M3R staining intensity in colon cancer samples obtained from the same individuals.

3.2.4. M1R Protein Expression in Colon Cancer Lymph Node and Liver Metastases

Previously, we reported that although M3R expression was increased in primary colon cancers compared to an adjacent normal colon, M3R expression was only minimally elevated in lymph node and liver metastases from the same patients; M3R expression in metastases was not significantly increased compared to a normal colon [3]. To determine if the same was true of M1R expression, we compared relative M1R expression in samples of a normal colon, primary colon cancer, and lymph node and liver metastases from the same patients (Figure 1H–K). In contrast to our findings with M3R expression [3], we were surprised to find that M1R expression was significantly greater in lymph node and liver metastases compared to a normal colon (p = 0.046 and p < 0.001, respectively, Figure 1H,J) and M1R expression in metastases was not significantly different than that in the respective primary tumors (Figure 1H–K).
Collectively, the findings depicted in Figure 1 allowed us to reach several conclusions. First, while CHRM1 gene expression was modestly but significantly reduced in colon cancer compared to normal tissue (Figure 1A), M1R protein expression levels were significantly increased in both colon adenomas (Figure 1D) and adenocarcinomas (Figure 1F) compared to a normal colon. Second, M3R protein expression was significantly greater than M1R expression in both adenomas (Figure 1D) and adenocarcinomas (Figure 1F); in both adenomas and adenocarcinomas, M3R staining intensity was approximately two-fold greater than that for M1R. Third, in contrast to our findings for M3R expression, compared to expression levels in primary colon cancers, M1R expression remained increased in lymph node and liver metastases (Figure 1H,J).
Collectively, these findings indicate several points of divergence between M1R and M3R expression in progressive colon neoplasia, from ACF to adenomas, primary colon cancers, and colon cancer metastases. To gain additional mechanistic insights into the role of these muscarinic receptor subtypes in colon neoplasia, we explored the relative effects of M1R and M3R activation in human colon cancer cells.

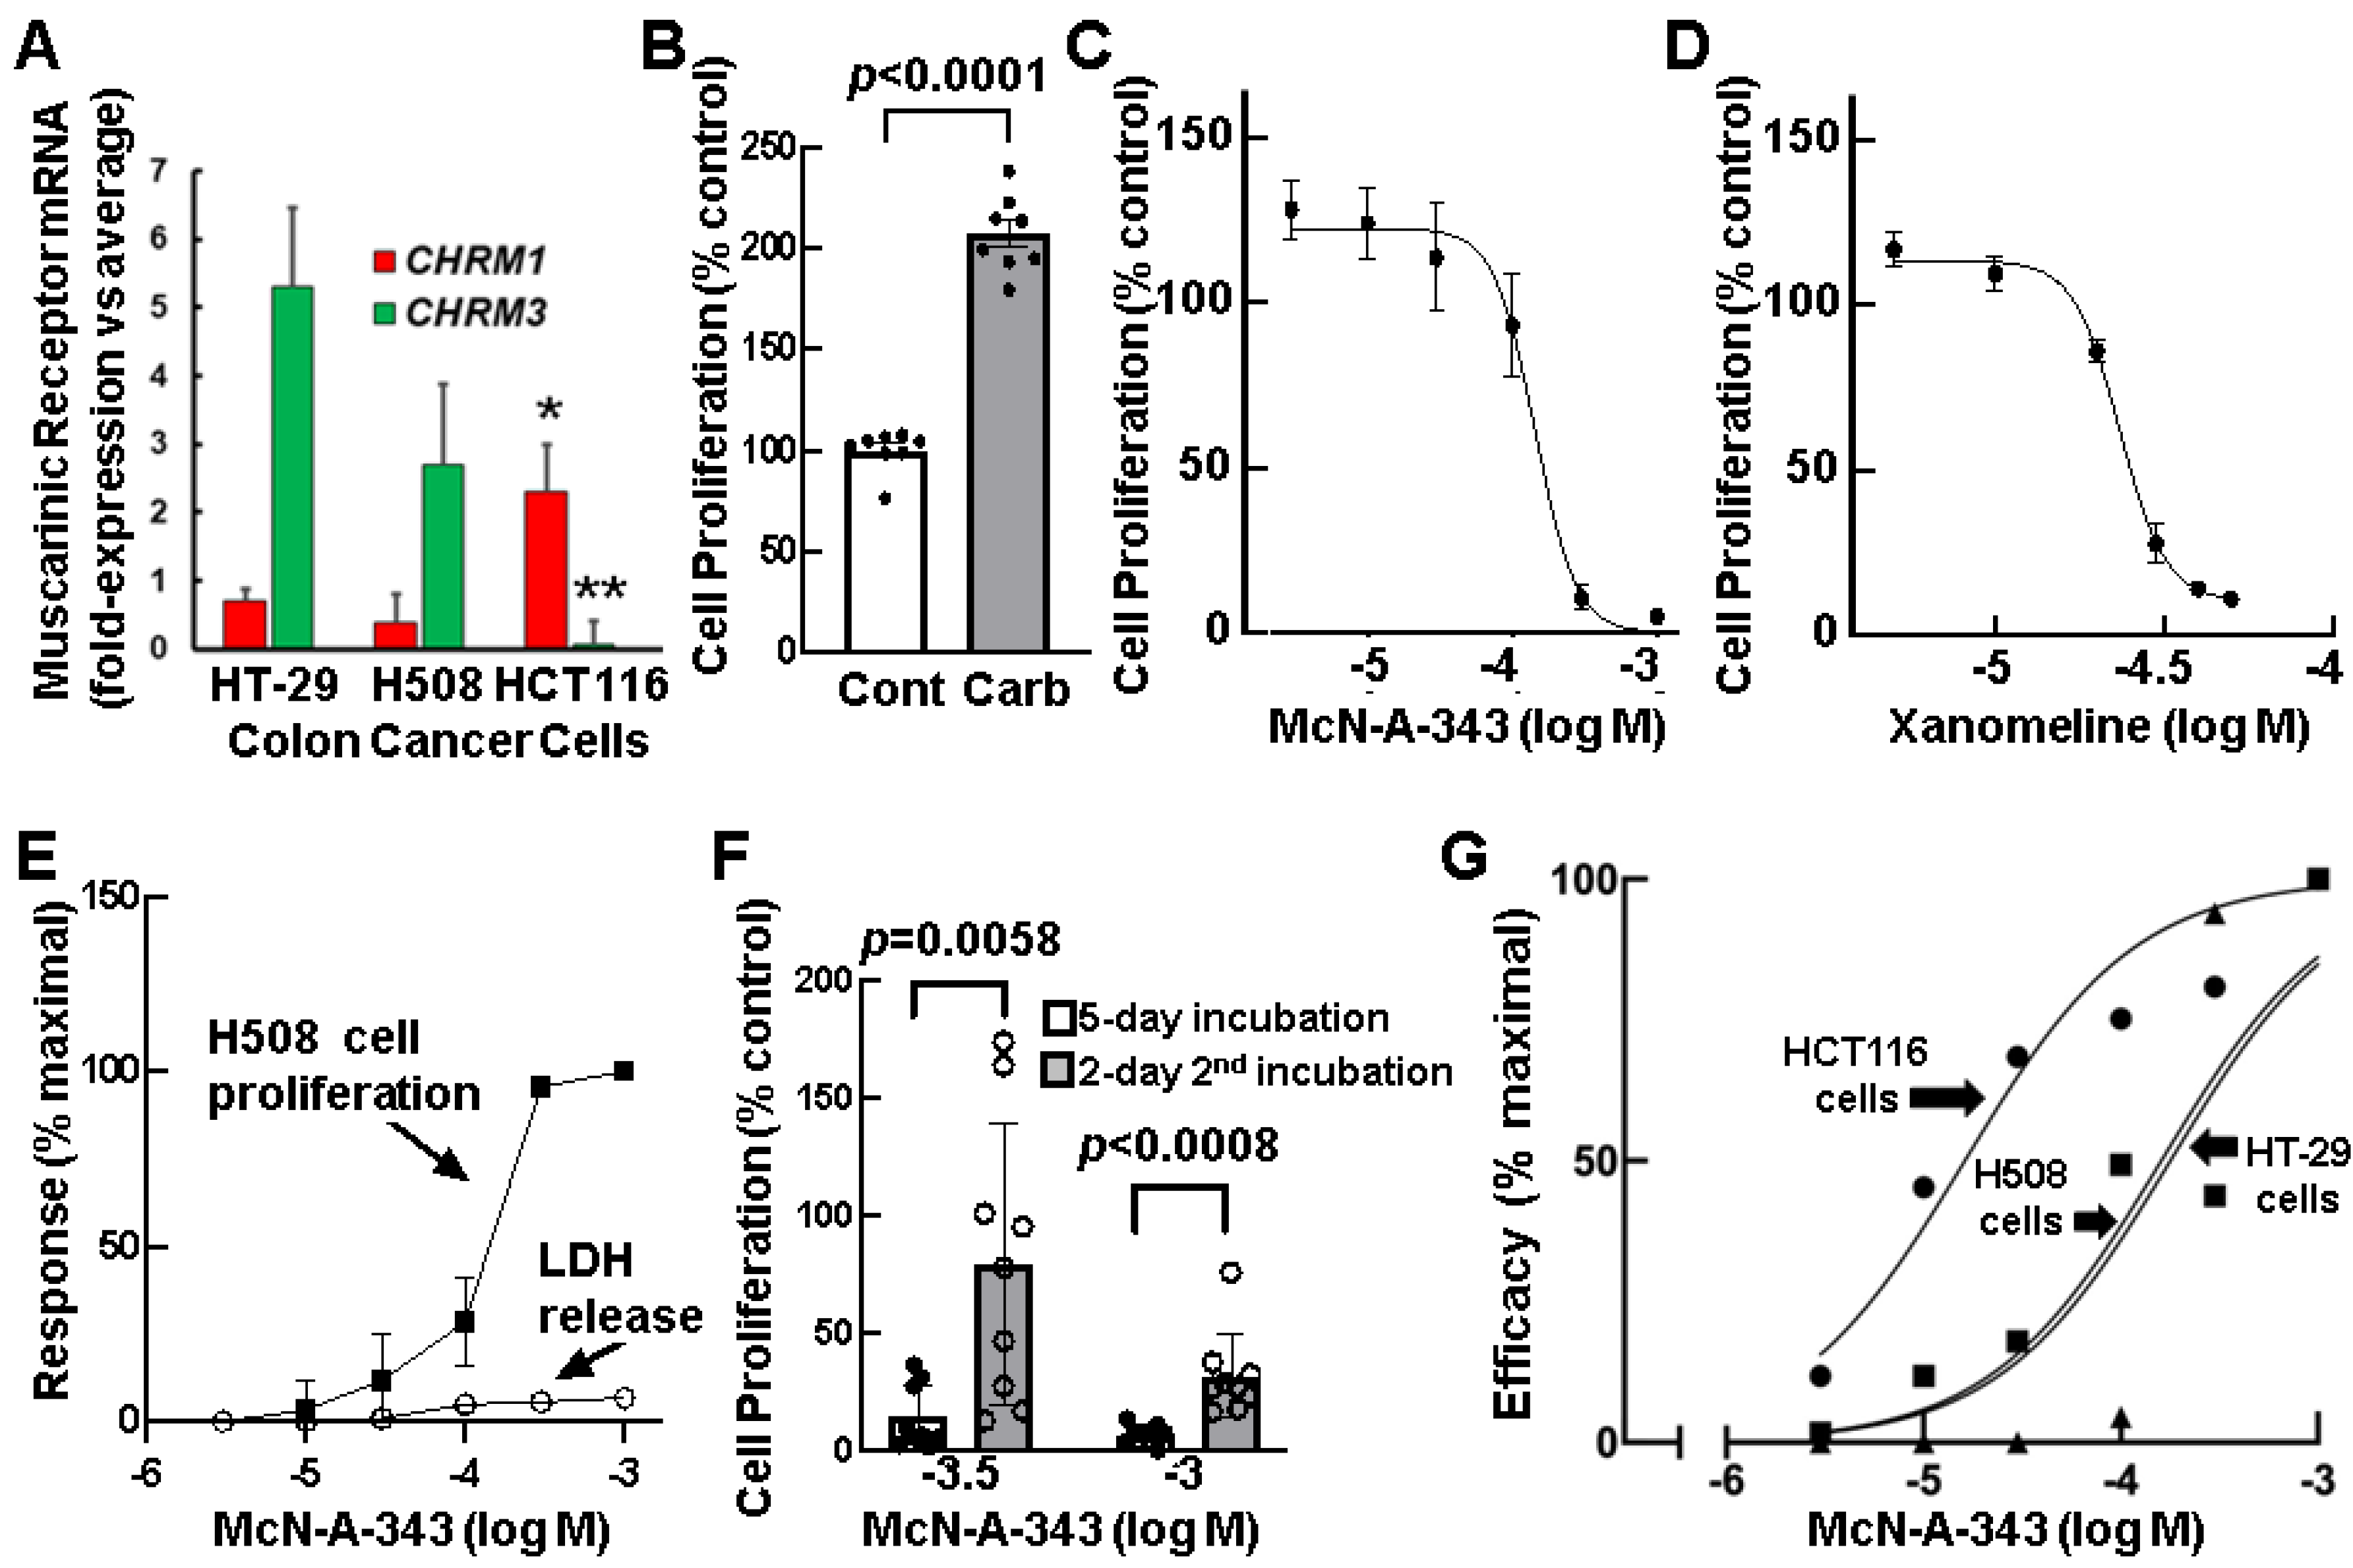
3.3. Relative Expression of CHRM1 and CHRM3 in Human Colon Cancer Cells

To explore the relative expression of M1R and M3R in established human colon cancer cells, we selected three commonly used cell lines to examine the relative expression of CHRM1 and CHRM3 mRNA (Figure 2A); HT-29, H508, and HCT116 cells were used in many of our in vitro studies of colon cancer cell function [23,24]. Whereas these cell lines are well-characterized (all have mutated APC and/or CTNNB1) [25], their relative expression of CHRM1 and CHRM3 was not previously examined. Using qPCR, in HT-29 and H508 cells, we detected substantially higher relative expression of CHRM3 compared to CHRM1 mRNA (Figure 2A); H508 and HT29 cells express three- and five-fold, respectively, more CHRM3 than CHRM1. In contrast, HCT116 cells, expressed higher relative levels of CHRM1 mRNA, thus providing us with experimental colon cancer cell lines with a broad range of relative expression of CHRM1 and CHRM3 for our studies (Figure 2A).

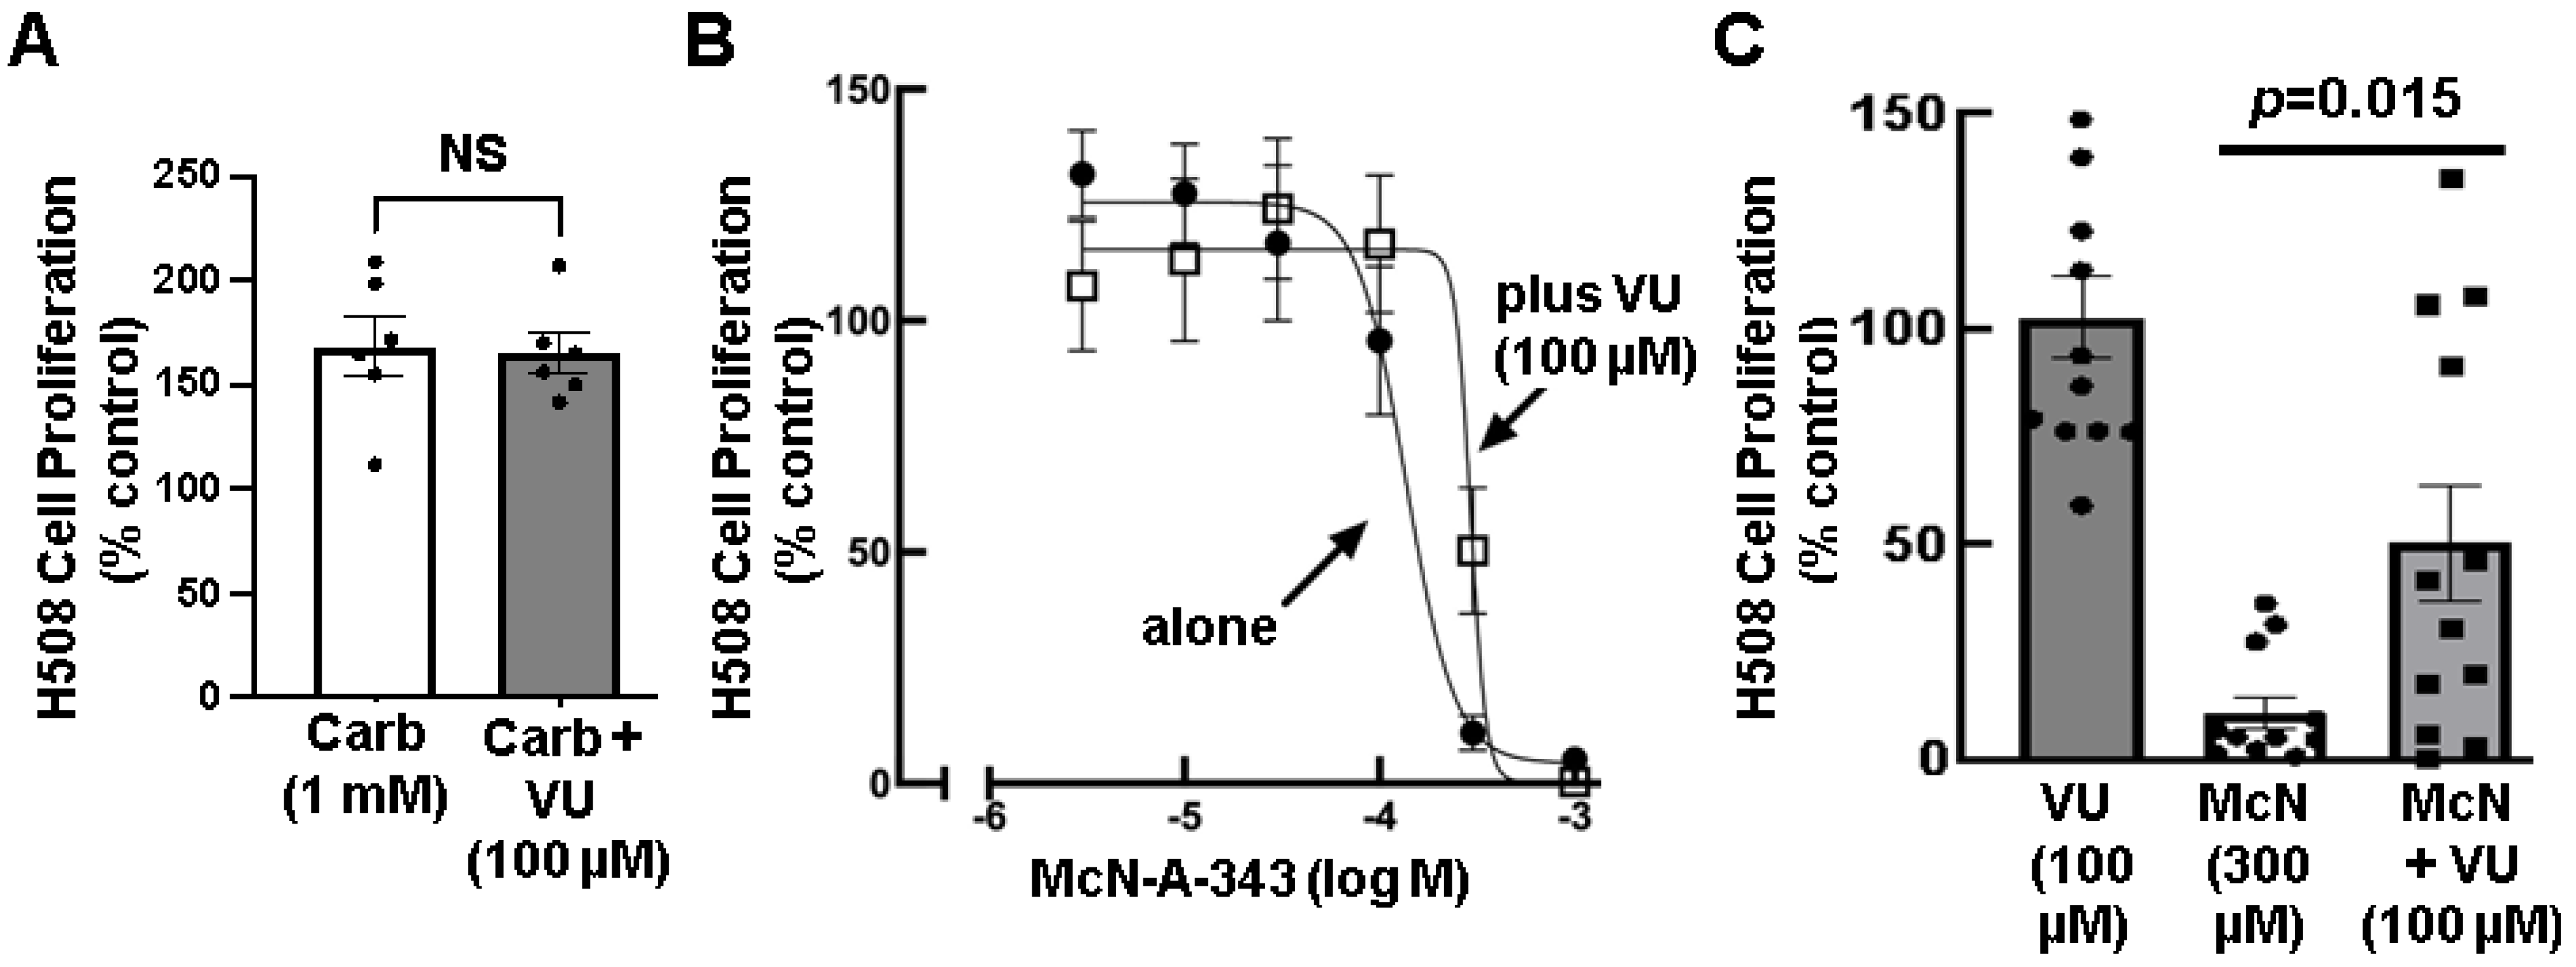
3.4. Effects of Selective M1R Activation on Human Colon Cancer Cell Proliferation

To explore the role of the M1R muscarinic receptor subtype in regulating colon cancer cell proliferation, we employed previously validated orthosteric modulators of M1R activation. First, we tested the effects of McN-A-343, a M1R selective agonist developed over 60 years ago [26], on well-characterized H508 human colon cancer cells that express M3R at relatively higher levels than M1R (M1Rlow; Figure 2A) and whose rates of proliferation respond robustly to treatment with non-subtype-selective muscarinic agonists like acetylcholine and carbamylcholine (carbachol) [23]. Although McN-A-343 may interact with other muscarinic receptor subtypes (e.g., M4R), in tissues with limited expression of M4R, its use can be helpful to distinguish actions resulting from M1R agonism [27,28,29]. Whereas 100 µM carbachol stimulated a two-fold increase in H508 cell proliferation (Figure 2B), treating cells with 10 µM to 1 mM McN-A-343 progressively reduced H508 cell proliferation (Figure 2C). Then, to confirm that M1R agonism inhibited colon cancer cell proliferation, we tested the effects of another putative M1R selective agonist, xanomeline [30,31,32]. As we observed with McN-A-343, increasing concentrations of xanomeline progressively reduced H508 cell proliferation (Figure 2D). In H508 cells, xanomeline was an approximately six-fold more potent inhibitor of colon cancer cell proliferation than McN-A-343 (IC50 xanomeline vs. McN-A-343 = 23.4 µM vs. 136.8 µM).
We used two approaches to exclude non-specific actions of these agents on colon cancer cell viability. First, to determine if cellular toxicity could account for the effects of McN-A-343 on cell proliferation, we measured the cellular release of lactate dehydrogenase (LDH), a commonly used indicator of cell membrane damage that is stable for long periods under our in vitro test conditions [33]. As shown in Figure 2E, even at the highest McN-A-343 concentration used (1 mM), we observed minimal LDH leakage from cells; Triton X-100 was used as a positive control. These results suggested that activating M1R in human colon cancer cells selectively stimulates anti-proliferative cell signaling, not cell damage. Next, to test the reversibility of the effects of 0.3 and 1 mM McN-A-343 on cell proliferation, we incubated H508 cells with the M1R agonist for two days and then washed and re-incubated cells in culture medium without McN-A-343 for an additional three days. As shown in Figure 2F, compared to cells that had been incubated with McN-A-343 for a full five days, cells re-incubated in the absence of the M1R agonist resumed proliferation, findings consistent with effects mediated by reversible M1R activation. These findings also supported the conclusion that the effects of the selective M1R agonist were not a consequence of cell toxicity.
We next performed experiments to explore the possibilities that stimulation of cellular senescence or apoptosis might explain the results observed with McN-A-343. To test for changes in cell senescence, we determined if treating H508 cells with McN-A-343 altered senescence associated-β-galactosidase staining, a validated marker of premature senescence [34]. As shown by representative images in Supplementary Figure S1A, treatment with McN-A-343 did not induce changes in β-galactosidase staining. To test for McN-A-343-induced apoptosis, we measured changes in total and cleaved caspase-3 expression [35,36]. Treating H508 cells with the highest concentrations of McN-A-343 resulted in a modest reduction in total caspase-3 expression. Nonetheless, as demonstrated by the representative gel shown in Supplementary Figure S1B, treating H508 cells with either a non-selective (carbachol) or selective M1R (McN-A-343) agonist did not alter cleaved caspase-3 levels. Based on these findings, we concluded that neither induction of cellular senescence nor apoptosis explained the anti-proliferative effects we observed in cells treated with selective M1R agonists.
To confirm that the effects of the M1R agonists were not idiosyncratic to H508 cells and to explore the effects of varying relative expression levels of M1R and M3R (Figure 1A), we examined the effects of increasing concentrations of McN-A-343 on HT-29 (M1Rlow) and HCT116 (M1Rhigh) cells. As shown in Figure 2G, we observed similar inhibitory actions of McN-A-434 on cell proliferation when we tested increasing concentrations of the M1R agonist in H508 and HT-29 human colon cancer cells; both cell lines are M1R low (Figure 2A). However, the dose–response for McN-A-434-induced inhibition of colon cancer cell proliferation was shifted substantially to the left in HCT116 cells compared to both H508 and HT-29 cells; the half-maximal effective concentration (EC50) was 7.89 µM for HCT116 cells, 136.8 µM for H508 cells, and 548.1 µM for HT-29 cells (Figure 2G). We believe the nearly two orders of magnitude increase in potency for the M1R agonist in HCT116 cells compared to HT-29 cells is most likely due to the substantially higher relative level of M1R expression in M1Rhigh HCT116 cells (Figure 2A) [37,38,39].
Next, we determined if blocking M1R agonism by pre-treating cells with a selective M1R inhibitor would mitigate the effects of treating cells with McN-A-343. First, we tested the effects of VU0255035 (VU), a selective M1R antagonist [40], on carbachol-induced H508 cell proliferation. As shown in Figure 3A, preincubating cells with a maximal concentration of VU did not alter carbachol-induced cell proliferation, supporting the observation that carbachol is an M3R-predominant agonist. Then, we tested the effect of pretreating cells with a fixed concentration of VU on the dose–response curve for McN-A-343-induced inhibition of colon cancer cell proliferation. As shown in Figure 3B, pre-incubation with VU shifted the McN-A-343 dose–response curve significantly to the right (IC50 with McN-A-343 alone was 136.8 µM versus 293.0 µM for McN plus VU; p = 0.0165). Moreover, as shown in Figure 3C, preincubating cells with 100 µM VU to block the effects of 300 µM McN-A-343 significantly preserved cell proliferation. The highest concentration of VU tested, 100 µM, did not by itself alter basal colon cancer cell proliferation (Figure 3C). However, whereas cell proliferation with McN-A-343 alone was reduced by 90% of control, preincubating cells with VU, attenuated the effects of McN-A-343 such that cell proliferation was reduced by only 50% of control (p = 0.015). Collectively, these findings supported the concept that activating M1R inhibits colon cancer cell proliferation.

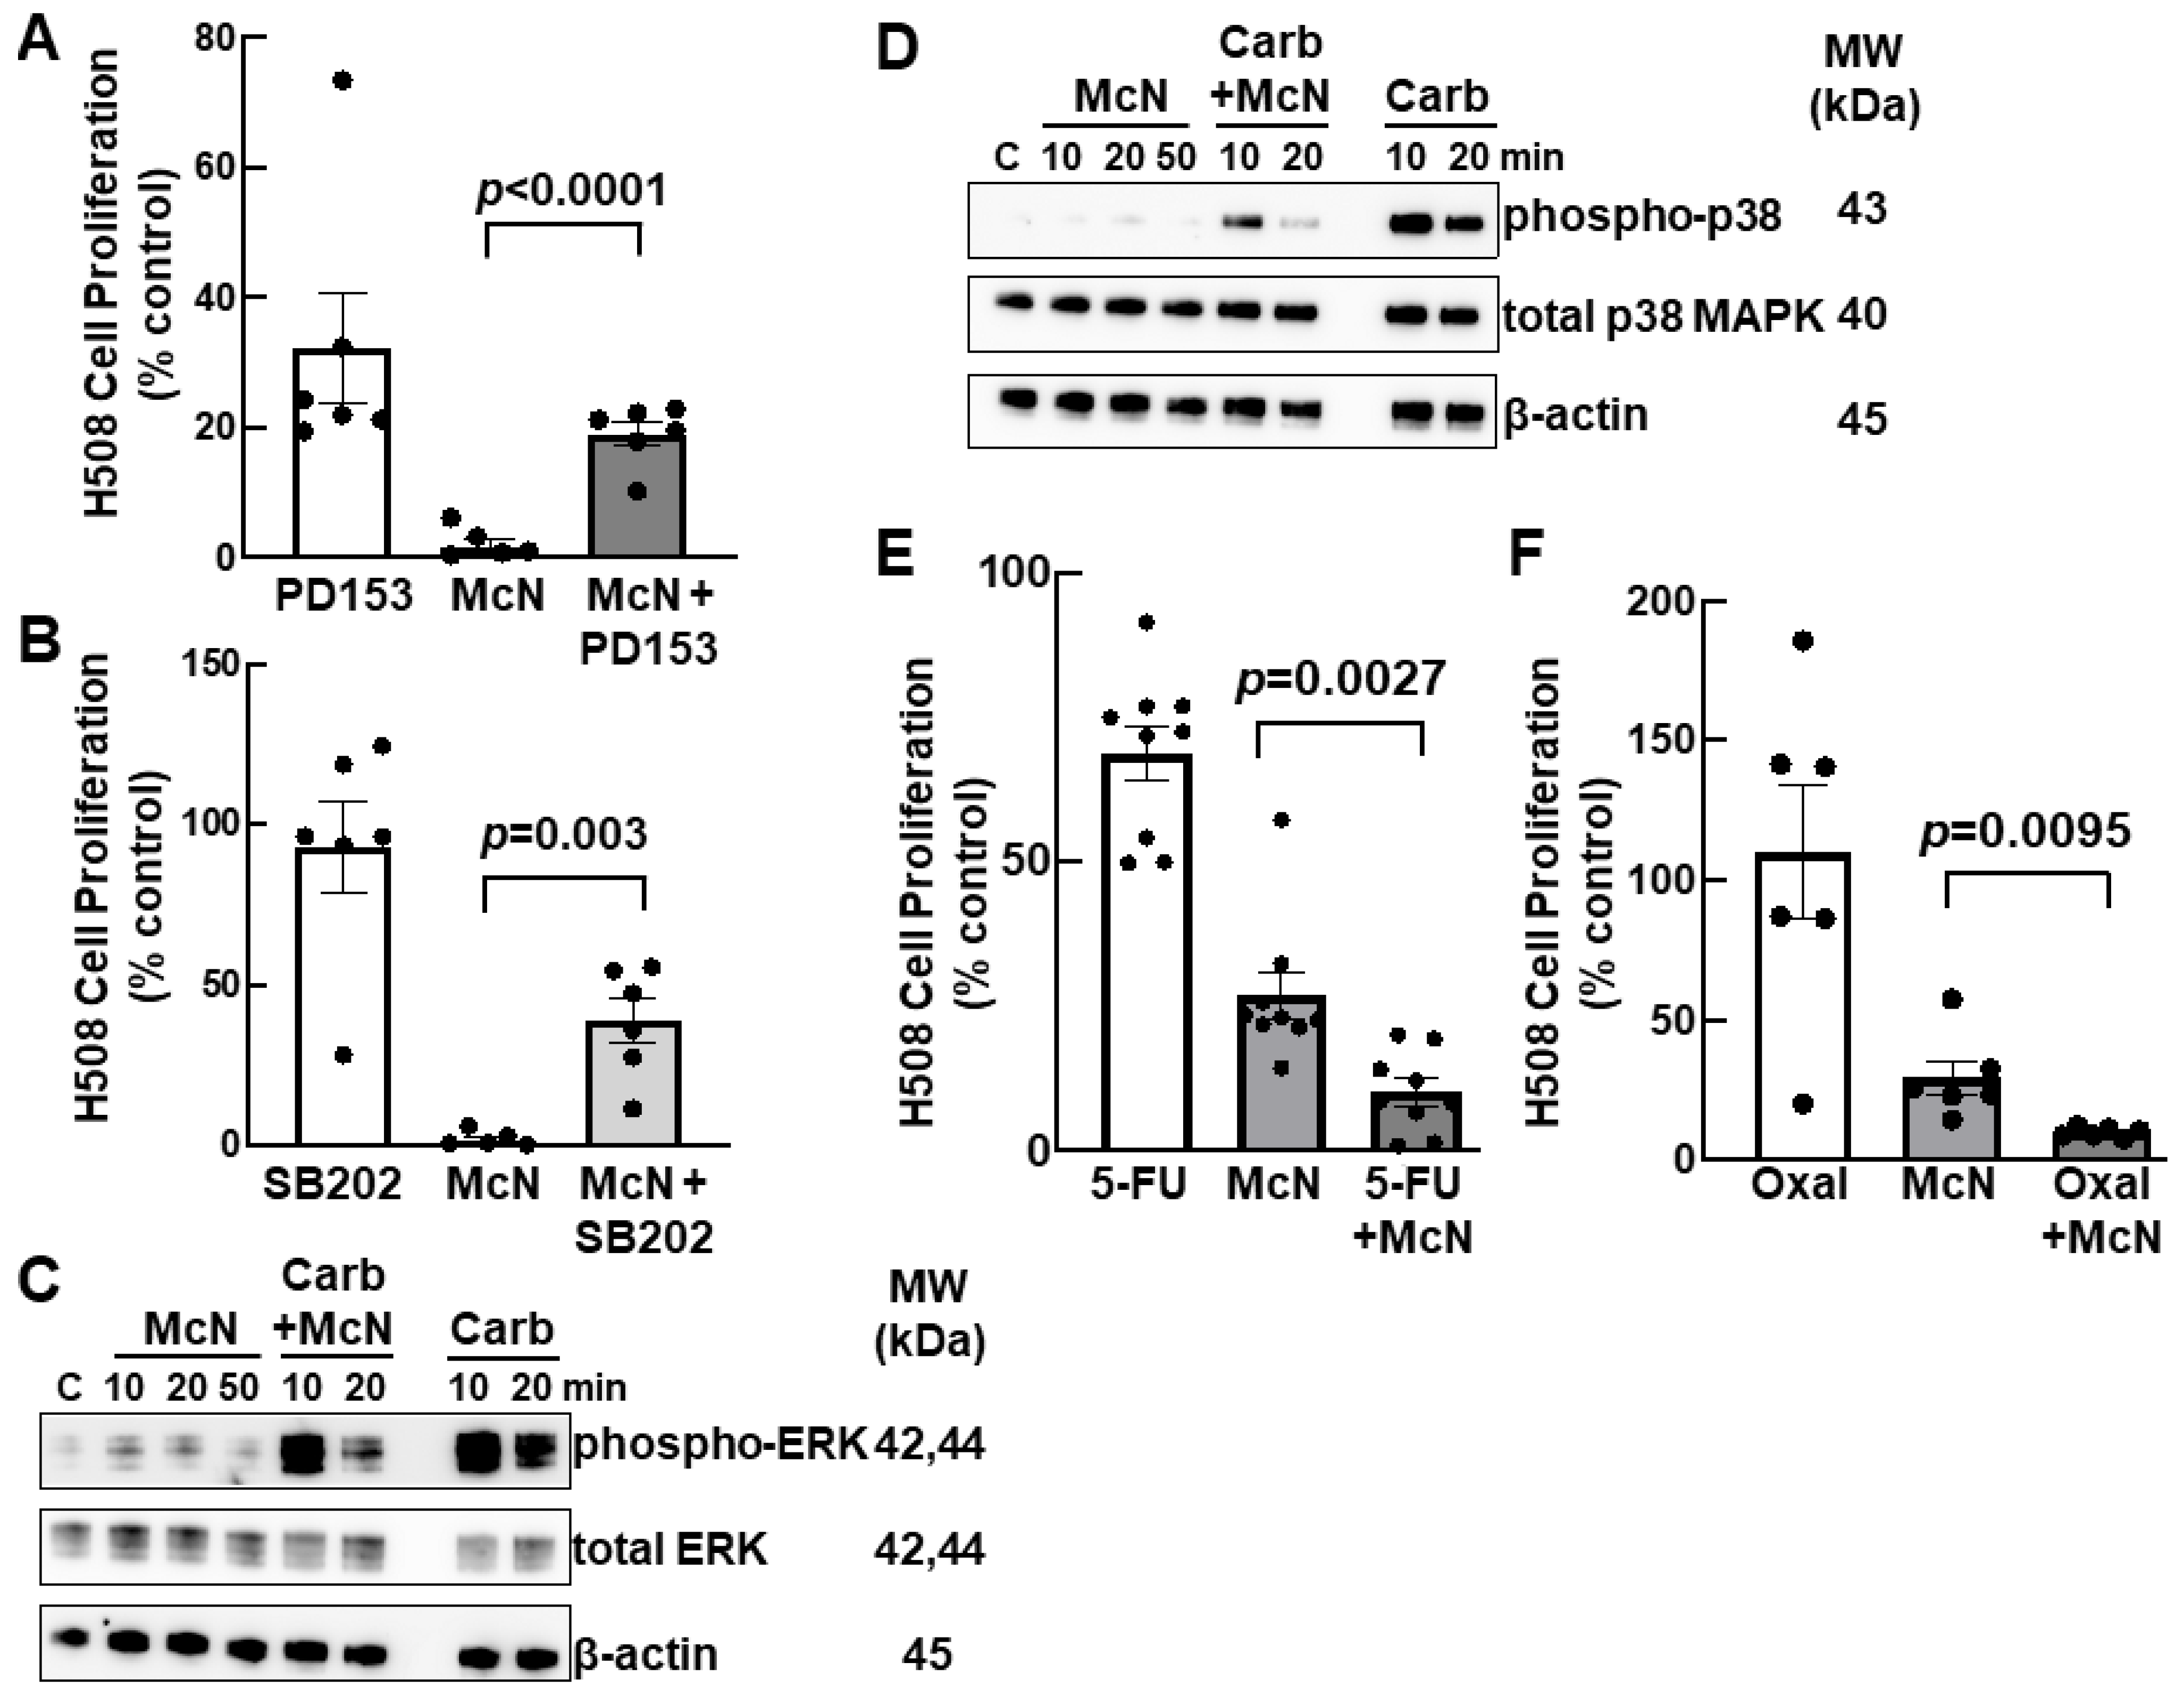
3.5. Inhibiting EGFR and p38 MAPK Activation Attenuates the Inhibitory Actions of an M1R Agonist on Colon Cancer Cell Proliferation

To identify relevant signaling proteins downstream of M1R activation, we used selective inhibitors for several kinases whose actions were previously implicated in post-muscarinic receptor signaling in colon cancer; we had previously validated the actions of these inhibitors in human colon cancer cells [23]. First, we determined whether maximal concentrations of any of these kinase inhibitors altered McN-A-343-induced inhibition of cell proliferation. As shown in Supplementary Figure S2, treating H508 cells with inhibitors of Src, phosphoinositide 3-kinase (PI3K), mitogen-activated protein kinase kinase (MEK), and protein kinase C (PKC) did not alter the actions of McN-A-343. In contrast, pretreating H508 cells with 5 µM PD153035, a selective inhibitor of epidermal growth factor receptors (EGFR), or 10 µM SB202190, a selective inhibitor of p38 mitogen-activated protein kinase (MAPK), partially reversed the inhibitory actions of McN-A-343 on cell proliferation (Figure 4). As shown in Figure 4A, treating H508 cells with the EGFR inhibitor reversed the effects of McN-A-343 by approximately 50% (p < 0.0001). As shown in Figure 4B, treating H508 cells with a p38 MAPK inhibitor had an effect of similar magnitude, reducing McN-A-343-induced effects by approximately 50% (p = 0.003). We previously showed that transactivation of EGFR occurs downstream of muscarinic receptor activation [24].
As both ERK and p38 MAPK activation are downstream of EGFR activation [30], we pursued these potential roles for EGFR and p38 MAPK by examining the effects of McN-A-343 on ERK and p38 MAPK activation (i.e., phosphorylation). As post-receptor kinase activation occurs quickly after muscarinic receptor activation [23,24], we examined both ERK and p38 MAPK phosphorylation at early time points, 10 to 50 min. As shown in Figure 4C and Figure 4D, respectively, treating cells with 1 mM McN-A-343 alone did not alter ERK or p38 MAPK phosphorylation during this time span. In contrast, treating cells with 1 mM carbachol stimulated robust ERK and p38 MAPK phosphorylation at 10 min which was diminished by 20 min (Figure 4C,D). Notably, the combination of McN-A-343 plus carbachol attenuated both ERK and p38 MAPK phosphorylation at 20 min; carbachol-induced activation of p38 MAPK was attenuated after both 10 and 20 min of incubation (Figure 4D). None of these treatments altered the expression of total ERK or total p38 MAPK (Figure 4C,D). Collectively, these findings support the conclusion that EGFR, ERK, and p38 MAPK activation play a role in McN-A-343-mediated inhibition of colon cancer cell proliferation.

3.6. Combining an M1R Agonist with Conventional Colon Cancer Chemotherapy Enhances Inhibition of Cell Proliferation

Lastly, we were curious to see if combining an M1R agonist with currently used agents for colon cancer chemotherapy had therapeutic potential. Interestingly, we found that treating H508 human colon cancer cells with a submaximal dose of McN-A-343 (200 µM) in combination with either 100 µM 5-fluorouracil (5-FU) (Figure 4E) or 10 µM oxaliplatin (Figure 4F) potentiated the anti-proliferative effects of both chemotherapeutic agents acting alone. These findings suggest that adding a M1R agonist to conventional chemotherapy for colon cancer may have therapeutic benefit.

4. Discussion

The work presented here expands our understanding of the divergent roles M1 and M3 muscarinic receptors play in colon cancer progression, and the findings that they appear to be reciprocal regulators of colon cancer cell proliferation opens the door to therapeutic opportunities. CHRM3 and M3 muscarinic receptors are commonly over-expressed in colon cancer [3] and genetic ablation of Chrm3 or pharmacological inhibition of M3R activation in murine models of colon cancer attenuates tumor formation [5]. In contrast, we found that CHRM1 mRNA expression is significantly reduced in human colon neoplasia [4] and Chrm1 ablation in mouse models negates the anti-neoplastic effects of Chrm3 ablation [5]; that is, Chrm1/M1R expression appears to protect against colon cancer. This concept was again supported in the present work by our interrogation of a large public colon cancer database which confirmed that while CHRM3 levels were significantly elevated in cancer compared to those in normal colon tissue, CHRM1 levels were modestly, but significantly, reduced in cancer.
Due to epigenetic and other effects, the functional component of gene expression, protein expression, may not mirror changes in mRNA levels [41,42,43]. To address this concern, we applied previously validated muscarinic receptor-subtype-specific antibodies to examine and compare M1R and M3R protein expression in progressive stages of colon neoplasia. Notably, we observed that the relative expression of M3R compared to M1R increases with the progressive pre-metastatic development of colon cancer from ACF to adenomas to primary adenocarcinomas. Whereas M1R and M3R expression was similar in a normal colon and the expression of both receptor subtypes increased equally in ACF, the ratio of M3R to M1R expression was significantly enhanced in adenomas and primary colon cancers. It is possible, although admittedly highly speculative, that increased M1R expression in colon ACF, adenomas, and cancers is a compensatory mechanism in reponse to greatly increased M3R expression and, thus, an anti-neoplastic effort on the part of cells to maintain homeostasis.
It is noteworthy that M1R levels in lymph node and liver metastases, although increased compared to normal colon tissue, were not increased compared to primary cancers (Figure 1H–K). We previously reported that M3R levels were lower in colon cancer metastases than in primary colon cancers; in fact, levels in metastases were not significantly different compared to levels in normal colon tissue [3]. We believe these findings have several important implications. First, they suggest that colon cancer cells that have already metastasized no longer require the attributes, like enhanced migration and invasion, that accrue from increased M3R activation. Second, persistent over-expression of M1R in metastatic cells compared to a normal colon suggests that M1R is accessible for targeting to attenuate the proliferation of metastatic colon cancer cells, thereby potentially blocking the expansion and, more intriguingly, promoting the regression of colon cancer metastases. Although these suggestions also remain speculative until supported by additional experimental findings, the latter is of key importance to the translational value of our findings. Whereas primary colon cancers rarely result in death as they are readily amenable to endoscopic or surgical resection, metastatic colon cancer almost always becomes resistant to therapy, resulting in a fatal outcome. Hence, a therapeutic approach that may selectively target metastatic colon cancer cells is attractive.
Regarding the translational potential of our findings, we present several lines of evidence to support the concept that M1R activation impedes colon cancer cell proliferation. We tested two different selective M1R agonists, McN-A-343 and xanomeline, on H508 human colon cancer cells, a cell line previously used in many colon cancer studies. In contrast to carbamylcholine, which robustly stimulated H508 cell proliferation, both M1R agonists dose-dependently reduced tumor cell proliferation, effects attenuated by pre-incubating cells with a selective M1R inhibitor. Key findings were reproduced in two additional commonly used human colon cell lines, HT-29 and HCT116 cells. Notably, in HCT116 cells, the McN-A-343 inhibition dose–response curve was left-shifted by two orders of magnitude, likely reflecting the observation that this cell line overexpresses M1R relative to M3R (Figure 2A).
Several experiments provided evidence that the inhibitory effects of M1R agonism on cell proliferation were not mediated by test agent toxicity or the induction of cellular senescence or apoptosis; after applying test agents (carbachol and McN-A-343) to colon cancer cells, we detected no meaningful changes in LDH release, senescence-activated β-galactosidase activity, or cleaved caspase-3 generation. Nonetheless, we did observe a modest reduction in total caspase-3 levels in cells treated with the highest McN-A-343 concentrations. Although speculative, it is possible that McN-A-343 reduces expression of caspase-3 by a currently unclear mechanism. Moreover, our findings contrasted with those from investigators who observed that in HEK293 cells overexpressing M1R, treatment with carbachol induced apoptosis by an ERK-independent mechanism [44]. We ascribe these divergent outcomes to experimental conditions, including the use of different cell types, i.e., HEK293 versus human colon cancer cells. Perhaps the most important difference is that in contrast to our work which utilized established human tissue-derived cell lines with naturally occurring levels of M1R expression, carbachol-induced cell death was observed in HEK293 cells expressing supra-physiological levels of M1R, a caveat highlighted by the authors [44]. Indeed, our findings are reassuring in that they speak to the likely safety of exposing normal tissues to M1R agonists and support the hypothesis that the anti-proliferative effects of M1R agonists derive from specific alterations in post-M1R signaling. This hypothesis was supported by the results of cell proliferation experiments that examined the effects of pre-treating cells with selective kinase inhibitors before adding an M1R agonist and detected M1R agonist-induced changes in kinase activation by immunoblotting for phosphorylated (activated) kinases.
To identify potential post-receptor mediators of M1R agonist-induced attenuation of colon cancer cell proliferation, we examined the effects of blocking key kinases in the muscarinic receptor signal transduction pathway [23]. This set of experiments revealed that activation of a signaling cascade involving EGFR, ERK, and p38 MAPK likely plays a role in mediating M1R agonist-induced attenuation of cell proliferation; validated EGFR and p38 MAPK inhibitors significantly attenuated the actions of McN-A-343 on cell proliferation (Figure 4A,B) and McN-A-343 treatment attenuated carbachol-induced ERK and p38 MAPK phosphorylation (activation) (Figure 4C,D). We cannot presently explain why inhibition of MEK, a kinase upstream of ERK activation did not alter McN-A-343-induced attenuation of cell proliferation (Supplementary Figure S2B); this finding suggests the possible presence of an alternative route of ERK activation downstream of M1R activation. Control experiments using selective inhibitors of other relevant kinases clearly demonstrated their lack of involvement in the effects of McN-A-343 (Supplementary Figure S2).
Our work has limitations. These include the use of selective but not necessarily specific muscarinic receptor agonists and inhibitors. Although all the agents we used were validated in previous studies, we must acknowledge the possibility of off-target effects on other muscarinic receptor subtypes, e.g., M4R. We also acknowledge the possibility that field effects in ‘normal’ tissue adjacent to colon cancer cells may impact the analysis of muscarinic receptor expression depicted in Figure 1; that is, muscarinic receptor expression may be even lower in normal tissue more distant from the site of cancer. Moreover, whereas we detected limited variability in M1R and M3R expression in tissue from a normal colon, there was extensive variability in receptor expression in neoplastic tissues (Figure 1). Admittedly, more mechanistic investigation is required to fully understand the signaling pathways underlying the actions of M1R activation. Nonetheless, these experiments clearly implicate the EGFR, ERK, p38 MAPK signaling cascade in mediating the anti-proliferative effects of M1R activation. Future experiments will seek a deeper mechanistic understanding of precisely how M1Rs regulate cell proliferation, if this requires proximity between M1R and M3R as was reported for other plasma membrane G protein-coupled receptors with reciprocal relationships [45], and whether a similar reciprocal relationship exists between M1R and M3R activation in other gastrointestinal cancers—current evidence suggests this is highly likely. Lastly, animal studies are required to demonstrate both the efficacy and safety of M1R agonism in models of both sporadic and colitis-associated colon cancer; a report that McN-A-343 treatment reduces inflammation and oxidative stress in a murine model of ulcerative colitis suggests promise for the latter indication [46].
In summary, we have demonstrated a novel anti-proliferative effect of M1R activation in human colon cancer cells that may explain why CHRM1/M1R levels in colon cancer are relatively reduced compared to CHRM3/M3R levels. The findings reported here are likely to have clinical importance. For example, our analysis of M1R versus M3R expression in progressive colon neoplasia (Figure 1) suggests the potential of using the M3R:M1R expression ratio as a biomarker to predict which cancers are better suited for treatment with M3R inhibitors versus M1R agonists (i.e., M1Rlow vs. M1Rhigh). Additionally, our experiments examining the effects of combining an M1R agonist with conventional colon cancer chemotherapeutics (Figure 4E,F) suggest that M1R agonism, alone or in combination with these agents, is a potential therapeutic strategy worthy of further investigation.

5. Conclusions

Novel insights into the structural biology and mechanisms whereby muscarinic receptors regulate fundamental functions of the central and enteric nervous systems are driving drug development [1]. There is focused interest within the pharmaceutical industry to develop selective M1R agonists to treat a host of neurological and psychiatric disorders, including schizophrenia and Alzheimer disease [47,48]. For example, a xanomeline-trospium formulation is currently in clinical trials. To reduce peripheral cholinergic side-effects, this agent combines, xanomeline, an M1R-selective blood–brain barrier permeable agonist, with trospium, a non-selective muscarinic receptor inhibitor that does not cross the blood–brain barrier. The trospium moiety is intended to mitigate the off-target peripheral cholinergic side-effects of xanomeline, e.g., blurred vision, excess sweating and salivation, and urinary frequency. Marketed as KarXT by Karuna Therapeutics, this agent demonstrated an acceptable safety profile in Phase 2 clinical trials and is currently in Phase 3 trials for psychosis and schizophrenia [49,50]. Similar agents could be designed or repurposed to treat cancers of the colon and other GI organs in which muscarinic receptor signaling plays an important role. Based on our collective findings, designing drugs that exhibit dual selective M3R antagonism and M1R agonism may have great therapeutic promise to treat advanced colon cancer.

Supplementary Materials

The following supporting information can be downloaded at: https://www.mdpi.com/article/10.3390/cancers15194766/s1, Figure S1: Markers of senescence and apoptosis are not altered in M1R agonist-treated human colon cancer cells; Figure S2: Inhibitors of protein kinase C-α (PKCα), mitogen activated kinase kinase (MEK), phosphoinositide 3-kinase, and Src do not alter the actions of an M1R agonist on human colon cancer cell proliferation; Figure S3: Original uncut gels for immunoblots. Table S1: Primers for human genes used in this study; Original uncut gels for immunoblots.

Author Contributions

Conceptualization, M.H.S., N.S.M., K.C. and J.-P.R.; methodology, M.H.S., N.S.M., K.C., O.C., S.H. and C.B.D.; validation, O.C.; resources, J.-P.R.; writing—original draft preparation, M.H.S., N.S.M., K.C., O.C. and G.X.; project administration, K.C. and J.-P.R.; writing—review and editing, J.-P.R.; supervision, J.-P.R.; funding acquisition, J.-P.R. All authors have read and agreed to the published version of the manuscript.

Funding

This research was funded by the United States (U.S.) National Institutes of Health grant number T32 DK067872 (J.R.) and the U.S. Department of Veteran Affairs Biomedical Laboratory Research and Development Program, VA Merit grant number BX002129 (J.R). The contents do not represent the views of the U.S. Government or the U.S. Department of Veterans Affairs.

Institutional Review Board Statement

Ethical review and approval were waived for this study by the Institutional Review Board of the University of Maryland School of Medicine, which issued a NOT HUMAN RESEARCH determination (HP-00050270) based on the use of deidentified, previously obtained tissue specimens.

Informed Consent Statement

As per the Institutional Review Board determination noted above, patient consent was waived for this study due to the use of pre-existing, deidentified tissue samples.

Data Availability Statement

The data presented in this study are available on request from the corresponding author.

Conflicts of Interest

The authors declare no conflict of interest. The funders had no role in the design of the study; in the collection, analyses, or interpretation of data; in the writing of the manuscript; or in the decision to publish the results.

References

  1. Kruse, A.C.; Kobilka, B.K.; Gautam, D.; Sexton, P.M.; Christopoulos, A.; Wess, J. Muscarinic acetylcholine receptors: Novel opportunities for drug development. Nat. Rev. Drug Discov. 2014, 13, 549–560. [Google Scholar] [CrossRef]
  2. Middelhoff, M.; Nienhuser, H.; Valenti, G.; Maurer, H.C.; Hayakawa, Y.; Takahashi, R.; Kim, W.; Jiang, Z.; Malagola, E.; Cuti, K.; et al. Prox1-positive cells monitor and sustain the murine intestinal epithelial cholinergic niche. Nat. Commun. 2020, 11, 111. [Google Scholar] [CrossRef]
  3. Cheng, K.; Shang, A.C.; Drachenberg, C.B.; Zhan, M.; Raufman, J.P. Differential expression of M3 muscarinic receptors in progressive colon neoplasia and metastasis. Oncotarget 2017, 8, 21106–21114. [Google Scholar] [CrossRef]
  4. Alizadeh, M.; Schledwitz, A.; Cheng, K.; Raufman, J.P. Mechanistic Clues Provided by Concurrent Changes in the Expression of Genes Encoding the M(1) Muscarinic Receptor, beta-Catenin Signaling Proteins, and Downstream Targets in Adenocarcinomas of the Colon. Front. Physiol. 2022, 13, 857563. [Google Scholar] [CrossRef]
  5. Cheng, K.; Xie, G.; Khurana, S.; Heath, J.; Drachenberg, C.B.; Timmons, J.; Shah, N.; Raufman, J.P. Divergent effects of muscarinic receptor subtype gene ablation on murine colon tumorigenesis reveals association of M3R and zinc finger protein 277 expression in colon neoplasia. Mol. Cancer 2014, 13, 77. [Google Scholar] [CrossRef]
  6. Song, P.; Sekhon, H.S.; Lu, A.; Arredondo, J.; Sauer, D.; Gravett, C.; Mark, G.P.; Grando, S.A.; Spindel, E.R. M3 muscarinic receptor antagonists inhibit small cell lung carcinoma growth and mitogen-activated protein kinase phosphorylation induced by acetylcholine secretion. Cancer Res. 2007, 67, 3936–3944. [Google Scholar] [CrossRef]
  7. Frucht, H.; Jensen, R.T.; Dexter, D.; Yang, W.-L.; Xiao, Y. Human colon cancer cell proliferation mediated by the M3 muscarinic cholinergic receptor. Clin. Cancer Res. 1999, 5, 2532–2539. [Google Scholar]
  8. Yang, W.L.; Frucht, H. Cholinergic receptor up-regulates COX-2 expression and prostaglandin E(2) production in colon cancer cells. Carcinogenesis 2000, 21, 1789–1793. [Google Scholar] [CrossRef]
  9. Chandrashekar, D.S.; Bashel, B.; Balasubramanya, S.A.H.; Creighton, C.J.; Ponce-Rodriguez, I.; Chakravarthi, B.; Varambally, S. UALCAN: A Portal for Facilitating Tumor Subgroup Gene Expression and Survival Analyses. Neoplasia 2017, 19, 649–658. [Google Scholar] [CrossRef]
  10. de Sousa Abreu, R.; Penalva, L.O.; Marcotte, E.M.; Vogel, C. Global signatures of protein and mRNA expression levels. Mol. Biosyst. 2009, 5, 1512–1526. [Google Scholar] [CrossRef]
  11. Maier, T.; Guell, M.; Serrano, L. Correlation of mRNA and protein in complex biological samples. FEBS Lett. 2009, 583, 3966–3973. [Google Scholar] [CrossRef] [PubMed]
  12. Vogel, C.; Abreu Rde, S.; Ko, D.; Le, S.Y.; Shapiro, B.A.; Burns, S.C.; Sandhu, D.; Boutz, D.R.; Marcotte, E.M.; Penalva, L.O. Sequence signatures and mRNA concentration can explain two-thirds of protein abundance variation in a human cell line. Mol. Syst. Biol. 2010, 6, 400. [Google Scholar] [CrossRef] [PubMed]
  13. Schwanhausser, B.; Busse, D.; Li, N.; Dittmar, G.; Schuchhardt, J.; Wolf, J.; Chen, W.; Selbach, M. Global quantification of mammalian gene expression control. Nature 2011, 473, 337–342. [Google Scholar] [CrossRef]
  14. Liu, Y.; Beyer, A.; Aebersold, R. On the Dependency of Cellular Protein Levels on mRNA Abundance. Cell 2016, 165, 535–550. [Google Scholar] [CrossRef]
  15. Michel, M.C.; Wieland, T.; Tsujimoto, G. How reliable are G-protein-coupled receptor antibodies? Naunyn. Schmiedebergs. Arch. Pharmacol. 2009, 379, 385–388. [Google Scholar] [CrossRef] [PubMed]
  16. Jositsch, G.; Papadakis, T.; Haberberger, R.V.; Wolff, M.; Wess, J.; Kummer, W. Suitability of muscarinic acetylcholine receptor antibodies for immunohistochemistry evaluated on tissue sections of receptor gene-deficient mice. Naunyn. Schmiedebergs. Arch. Pharmacol. 2009, 379, 389–395. [Google Scholar] [CrossRef]
  17. Olianas, M.C.; Dedoni, S.; Onali, P. Involvement of store-operated Ca(2+) entry in activation of AMP-activated protein kinase and stimulation of glucose uptake by M3 muscarinic acetylcholine receptors in human neuroblastoma cells. Biochim. Biophys. Acta. 2014, 1843, 3004–3017. [Google Scholar] [CrossRef]
  18. Bird, R.P. Observation and quantification of aberrant cruypts in the murine colon treated with a colon carcinogen: Preliminary findings. Cancer Lett. 1987, 37, 147–151. [Google Scholar] [CrossRef]
  19. Bird, R.P. Role of aberrant crypt foci in understanding the pathogenesis of colon cancer. Cancer Lett. 1995, 93, 55–71. [Google Scholar] [CrossRef]
  20. Takayama, T.; Katsuki, S.; Takahashi, Y.; Ohi, M.; Nojiri, S.; Sakamaki, S.; Kato, J.; Kogawa, K.; Miyake, H.; Niitsu, Y. Aberrant crypt foci of the colon as precursors of adenoma and cancer. N. Engl. J. Med. 1998, 339, 1277–1284. [Google Scholar] [CrossRef]
  21. Alrawi, S.J.; Schiff, M.; Carroll, R.E.; Dayton, M.; Gibbs, J.F.; Kulavlat, M.; Tan, D.; Berman, K.; Stoler, D.L.; Anderson, G.R. Aberrant crypt foci. Anticancer. Res. 2006, 26, 107–119. [Google Scholar] [PubMed]
  22. Hawthorn, L.; Lan, L.; Mojica, W. Evidence for field effect cancerization in colorectal cancer. Genomics 2014, 103, 211–221. [Google Scholar] [CrossRef] [PubMed]
  23. Said, A.H.; Hu, S.; Abutaleb, A.; Watkins, T.; Cheng, K.; Chahdi, A.; Kuppusamy, P.; Saxena, N.; Xie, G.; Raufman, J.P. Interacting post-muscarinic receptor signaling pathways potentiate matrix metalloproteinase-1 expression and invasion of human colon cancer cells. Biochem. J. 2017, 474, 647–665. [Google Scholar] [CrossRef]
  24. Cheng, K.; Zimniak, P.; Raufman, J.P. Transactivation of the epidermal growth factor receptor mediates cholinergic agonist-induced proliferation of H508 human colon cancer cells. Cancer Res. 2003, 63, 6744–6750. [Google Scholar] [CrossRef]
  25. Mouradov, D.; Sloggett, C.; Jorissen, R.N.; Love, C.G.; Li, S.; Burgess, A.W.; Arango, D.; Strausberg, R.L.; Buchanan, D.; Wormald, S.; et al. Colorectal cancer cell lines are representative models of the main molecular subtypes of primary cancer. Cancer Res. 2014, 74, 3238–3247. [Google Scholar] [CrossRef]
  26. Roszkowski, A.P. An unusual type of sympathetic ganglionic stimulant. J. Pharmacol. Exp. Ther. 1961, 132, 156–170. [Google Scholar]
  27. Mitchelson, F.J. The pharmacology of McN-A-343. Pharmacol. Ther. 2012, 135, 216–245. [Google Scholar] [CrossRef]
  28. Eglen, R.M.; Kenny, B.A.; Michel, A.D.; Whiting, R.L. Muscarinic activity of McN-A-343 and its value in muscarinic receptor classification. Br. J. Pharmacol. 1987, 90, 693–700. [Google Scholar] [CrossRef]
  29. Wakade, A.R.; Kahn, R.; Malhotra, R.K.; Wakade, C.G.; Wakade, T.D. McN-A-343, a specific agonist of M1-muscarinic receptors, exerts antinicotinic and antimuscarinic effects in the rat adrenal medulla. Life Sci. 1986, 39, 2073–2080. [Google Scholar] [CrossRef]
  30. Shannon, H.E.; Bymaster, F.P.; Calligaro, D.O.; Greenwood, B.; Mitch, C.H.; Sawyer, B.D.; Ward, J.S.; Wong, D.T.; Olesen, P.H.; Sheardown, M.J.; et al. Xanomeline: A novel muscarinic receptor agonist with functional selectivity for M1 receptors. J. Pharmacol. Exp. Ther. 1994, 269, 271–281. [Google Scholar]
  31. Bender, A.M.; Jones, C.K.; Lindsley, C.W. Classics in Chemical Neuroscience: Xanomeline. ACS Chem. Neurosci. 2017, 8, 435–443. [Google Scholar] [CrossRef] [PubMed]
  32. Grant, M.K.; Noetzel, M.J.; De Lorme, K.C.; Jakubik, J.; Dolezal, V.; El-Fakahany, E.E. Pharmacological evaluation of the long-term effects of xanomeline on the M(1) muscarinic acetylcholine receptor. PLoS ONE 2010, 5, e15722. [Google Scholar] [CrossRef] [PubMed]
  33. Jacobs, E.; Hissin, P.J.; Propper, W.; Mayer, L.; Sarkozi, L. Stability of lactate dehydrogenase at different storage temperatures. Clin. Biochem. 1986, 19, 183–188. [Google Scholar] [CrossRef] [PubMed]
  34. Oikonomou, E.; Makrodouli, E.; Evagelidou, M.; Joyce, T.; Probert, L.; Pintzas, A. BRAF(V600E) efficient transformation and induction of microsatellite instability versus KRAS(G12V) induction of senescence markers in human colon cancer cells. Neoplasia 2009, 11, 1116–1131. [Google Scholar] [CrossRef]
  35. McIlwain, D.R.; Berger, T.; Mak, T.W. Caspase functions in cell death and disease. Cold Spring Harb. Perspect. Biol. 2013, 5, a008656. [Google Scholar] [CrossRef]
  36. O’Donovan, N.; Crown, J.; Stunell, H.; Hill, A.D.; McDermott, E.; O’Higgins, N.; Duffy, M.J. Caspase 3 in breast cancer. Clin. Cancer Res. 2003, 9, 738–742. [Google Scholar]
  37. Gazi, L.; Bobirnac, I.; Danzeisen, M.; Schupbach, E.; Langenegger, D.; Sommer, B.; Hoyer, D.; Tricklebank, M.; Schoeffter, P. Receptor density as a factor governing the efficacy of the dopamine D4 receptor ligands, L-745,870 and U-101958 at human recombinant D4.4 receptors expressed in CHO cells. Br. J. Pharmacol. 1999, 128, 613–620. [Google Scholar] [CrossRef]
  38. Robertson, S.; Rohwer, J.M.; Hapgood, J.P.; Louw, A. Impact of glucocorticoid receptor density on ligand-independent dimerization, cooperative ligand-binding and basal priming of transactivation: A cell culture model. PLoS ONE 2013, 8, e64831. [Google Scholar] [CrossRef]
  39. Koener, B.; Focant, M.C.; Bosier, B.; Maloteaux, J.M.; Hermans, E. Increasing the density of the D2L receptor and manipulating the receptor environment are required to evidence the partial agonist properties of aripiprazole. Prog. Neuropsychopharmacol. Biol. Psychiatry 2012, 36, 60–70. [Google Scholar] [CrossRef]
  40. Sheffler, D.J.; Williams, R.; Bridges, T.M.; Xiang, Z.; Kane, A.S.; Byun, N.E.; Jadhav, S.; Mock, M.M.; Zheng, F.; Lewis, L.M.; et al. A novel selective muscarinic acetylcholine receptor subtype 1 antagonist reduces seizures without impairing hippocampus-dependent learning. Mol. Pharmacol. 2009, 76, 356–368. [Google Scholar] [CrossRef]
  41. Fu, N.; Drinnenberg, I.; Kelso, J.; Wu, J.R.; Paabo, S.; Zeng, R.; Khaitovich, P. Comparison of protein and mRNA expression evolution in humans and chimpanzees. PLoS ONE 2007, 2, e216. [Google Scholar] [CrossRef] [PubMed]
  42. Nie, L.; Wu, G.; Zhang, W. Correlation of mRNA expression and protein abundance affected by multiple sequence features related to translational efficiency in Desulfovibrio vulgaris: A quantitative analysis. Genetics 2006, 174, 2229–2243. [Google Scholar] [CrossRef] [PubMed]
  43. Koussounadis, A.; Langdon, S.P.; Um, I.H.; Harrison, D.J.; Smith, V.A. Relationship between differentially expressed mRNA and mRNA-protein correlations in a xenograft model system. Sci. Rep. 2015, 5, 10775. [Google Scholar] [CrossRef] [PubMed]
  44. Graham, E.S.; Woo, K.K.; Aalderink, M.; Fry, S.; Greenwood, J.M.; Glass, M.; Dragunow, M. M1 muscarinic receptor activation mediates cell death in M1-HEK293 cells. PLoS ONE 2013, 8, e72011. [Google Scholar] [CrossRef]
  45. Zaccor, N.W.; Sumner, C.J.; Snyder, S.H. The nonselective cation channel TRPV4 inhibits angiotensin II receptors. J. Biol. Chem. 2020, 295, 9986–9997. [Google Scholar] [CrossRef]
  46. Magalhaes, D.A.; Batista, J.A.; Sousa, S.G.; Ferreira, J.D.S.; da Rocha Rodrigues, L.; Pereira, C.M.C.; do Nascimento Lima, J.V.; de Albuquerque, I.F.; Bezerra, N.; Monteiro, C.; et al. McN-A-343, a muscarinic agonist, reduces inflammation and oxidative stress in an experimental model of ulcerative colitis. Life Sci. 2021, 272, 119194. [Google Scholar] [CrossRef]
  47. Caccamo, A.; Fisher, A.; LaFerla, F.M. M1 agonists as a potential disease-modifying therapy for Alzheimer’s disease. Curr. Alzheimer. Res. 2009, 6, 112–117. [Google Scholar] [CrossRef]
  48. Brown, A.J.H.; Bradley, S.J.; Marshall, F.H.; Brown, G.A.; Bennett, K.A.; Brown, J.; Cansfield, J.E.; Cross, D.M.; de Graaf, C.; Hudson, B.D.; et al. From structure to clinic: Design of a muscarinic M1 receptor agonist with potential to treatment of Alzheimer’s disease. Cell 2021, 184, 5886–5901.e5822. [Google Scholar] [CrossRef]
  49. Brannan, S.K.; Sawchak, S.; Miller, A.C.; Lieberman, J.A.; Paul, S.M.; Breier, A. Muscarinic Cholinergic Receptor Agonist and Peripheral Antagonist for Schizophrenia. N. Engl. J. Med. 2021, 384, 717–726. [Google Scholar] [CrossRef]
  50. Singh, A. Xanomeline and Trospium: A Potential Fixed Drug Combination (FDC) for Schizophrenia-A Brief Review of Current Data. Innov. Clin. Neurosci. 2022, 19, 43–47. [Google Scholar]
Figure 1. Divergent CHRM1 and CHRM3 mRNA and M1R and M3R protein expression in progressive colon neoplasia compared to a normal colon. (A) Reduced expression of the gene encoding M1R (CHRM1) and overexpression of the gene encoding M3R (CHRM3) in colorectal cancer. As shown by box-whisker plots, UALCAN server analysis [9] reveals CHRM1 (left) and CHRM3 (right panel) mRNA transcripts are respectively under- and over-expressed in primary colon cancer (n = 286 patients) compared with a normal colon (n = 41 patients). For a normal colon, maximum, upper quartile, median, lower quartile, and minimum values, respectively, are 2.146, 1.375, 1.03, 0.828, and 0.299 for CHRM1 and 3.645, 2.055, 1.272, 1.069, and 0.678 for CHRM3. For colon cancer, maximum, upper quartile, median, lower quartile, and minimum values, respectively, are 2.317, 0.732, 0.316, 0.12 and 0 for CHRM1 and 10.027, 4.072, 2.528, 1.094, and 0.02 for CHRM3. (B) M1R and M3R protein expression is increased in aberrant crypt foci (ACF). M1R and M3R immunostaining in ACF and adjacent normal colon. Both M1R and M3R expression was significantly increased in ACF compared to an adjacent normal colon (p < 0.0001 and p < 0.001, respectively, respectively; n = 6 per group). Bars represent means ± SE. au, arbitrary units. (C) Representative images of M1R and M3R immunostaining in ACF in tissues from the resected colons of three patients with familial adenomatous polyposis; ACF are delineated by red arrows. Yellow arrows indicate non-dysplastic glands. Size bars for M1R and M3R staining images respectively: Patient 1, 300 and 500 µm; Patient 2, 500 and 300 µm; Patient 3, 300 and 200 µm. (D) M1R and M3R protein expression is increased in colon adenomas. Both M1R and M3R expression was significantly increased in adenomas compared to an adjacent normal colon (p = 0.0344 and p < 0.0001, respectively; n = 12–24 per group). Bars represent means ± SE. au, arbitrary units. (E) Representative images of M1R and M3R immunostaining in colon adenomas. Dysplastic glands are delineated by red arrows. Yellow arrows indicate non-dysplastic glands. Size bars for M1R and M3R staining images respectively: Patient 1, both 200 µm; Patient 2, both 200 µm; Patient 3, 200 and 300 µm. (F) M1R and M3R protein expression in colon adenocarcinomas. Both M1R and M3R expression was significantly increased in adenocarcinoma compared to an adjacent normal colon (p = 0.02 and p < 0.0001, respectively; n = 8 per group). Bars represent means ± SE. au, arbitrary units. (G) Representative images of M1R and M3R immunostaining in colon adenocarcinomas. Size bars for M1R and M3R staining images respectively: Patient 1, both 400 µm; Patient 2, both 400 µm; Patient 3, both 200 µm. (H) M1R protein expression in colon cancer lymph node metastases. M1R expression was significantly increased in lymph node metastases compared to a normal colon but to a lesser extent than in the primary cancer (p = 0.01 and p = 0.046, respectively; n = 5 per group). Bars represent means ± SE. au, arbitrary units. (I) Representative images of M1R immunostaining in a normal colon, colon adenocarcinoma, and lymph node metastases. Size bars as noted on each image. (J) M1R protein expression in colon cancer liver metastases. M1R expression was significantly increased in liver metastases compared to a normal colon to the same degree as in the primary cancer (p < 0.001 and p < 0.001 compared to a normal colon, respectively; n = 12 per group). Bars represent means ± SE. au, arbitrary units. (K) Representative images of M1R immunostaining in a normal colon, primary colon adenocarcinomas, and liver metastases. Size bars as noted on each image. Scoring of M1R and M3R immunostaining for all tissues, including normal colon tissues, was quantified using an analog scale (0, no staining; 4, maximal staining) by a senior pathologist masked to the antibody used. In panels B, D, F, H, and J, solid black circles represent individual tissue scores.
Cancers 15 04766 g001
Figure 2. Selective activation of M1R dose-dependently and reversibly attenuates human colon cancer cell proliferation. (A) Relative expression of CHRM1 and CHRM3 mRNA in three established human colon cancer cell lines. *, ** p < 0.05 and 0.01 vs. HT-29 cells. Gene expression was normalized to β2-microglobulin (B2M) and qPCR data were analyzed using the comparative CT (2−ΔΔCT) method. n = 8 for each cell line. (B) Effect of treating H508 cells with a non-selective muscarinic agonist. Cells were incubated with or without the test agent for five days before proliferation was measured as described in Methods. Cont, control; Carb, carbachol. Solid black circles represent values for individual replicates. (C) Effect of increasing concentrations of McN-A-343 on H508 cell proliferation. Cells were incubated with or without increasing concentrations of McN-A-343 for five days before proliferation was measured as described in Methods. n = 4. (D) Effect of increasing concentrations of xanomeline on H508 cell proliferation. Cells were incubated with or without increasing concentrations of xanomeline for five days before proliferation was measured as described in Methods. n = 4. (E) Comparison of McN-A-343-induced changes in H508 cell proliferation and LDH release. H508 cells were incubated with or without increasing concentrations of McN-A-343 for five days before proliferation and LDH release into the media was measured as described in Methods. LDH, lactate dehydrogenase. n = 4. (F) McN-A-343-induced attenuation of colon cancer cell proliferation is reversible. H508 cells were incubated with 0.3 and 1 mM McN-A-343 for five days (open bars). Cells were then washed and re-incubated for an additional 2 days in media without McN-A-343 (shaded bars). Cell proliferation after the initial incubation with McN-A-343 and following the additional two-day incubation without McN-A-343 was measured as described in Methods. Symbols represent values for individual replicates. (G) Comparison of maximal responses observed with increasing concentrations of McN-A-343 in H508 (■), HT-29 (▲), and HCT116 (●) human colon cancer cells. Cells were incubated with or without increasing concentrations of McN-A-343 for five days and cell proliferation was measured as described in Methods. The dose–response curves shown were created using the nonlinear regression feature in GraphPad Prism (GraphPad Prism version 9.5.1, Boston, MA, USA). n = 3–4; for visual clarity, error bars are not shown. n, number of replicates.
Cancers 15 04766 g002
Figure 3. Selectively inhibiting M1R activation attenuates the effects of M1R-selective but not non-selective muscarinic receptor agonists. (A) Selective inhibition of M1R activation does not alter carbachol-induced cell proliferation. H508 colon cancer cells were pre-incubated for 30 min with 100 µM VU0255035 before adding 1 mM carbachol and incubating cells for an additional 5 days. Cell proliferation was measured as described in Methods. Each symbol represents the result of a separate experiment. n = 6. (B) Selective inhibition of M1R activation attenuates the effects of McN-A-343 on cell proliferation. H508 colon cancer cells were pre-incubated for 30 min with 100 µM VU0255035 before adding the indicated concentrations of McN-A-343 and incubating cells for an additional 5 days. Cell proliferation was measured as described in Methods. n = 4. (C) Pre-incubating H508 cells for 30 min with 100 µM VU0255035 before adding 300 µM McN-A-343 and incubating cells for an additional 5 days significantly diminished the ability of the selective M1R agonist to inhibit cell proliferation. Cell proliferation was measured as described in Methods. n = 12. n, number of replicates, shown by the symbols.
Cancers 15 04766 g003
Figure 4. Inhibiting EGFR and p38 MAPK activation attenuates and combining chemotherapeutic agents with an M1R agonist augments inhibition of colon cancer cell proliferation. (A) Inhibiting EGFR activation attenuates basal colon cancer cell proliferation and partially reverses the actions of a M1R agonist. H508 cells were treated for 5 days with 5 µM PD153035 (PD153), 300 µM McN-A-343 (McN), or the combination of PD153035 plus McN-A-343. (B) Inhibiting p38 MAPK activation partially reverses the actions of a M1R agonist on cell proliferation. H508 cells were treated for 5 days with 10 µM SB202190 (SB202), 300 µM McN-A-343 (McN), or the combination of SB202190 plus McN-A-343. For (A,B), cell proliferation was measured after a 5-day incubation as described in Methods; symbols represent the results of separate incubations. (C) Pre-incubating colon cancer cells with McN-A-343 attenuates carbachol-induced ERK activation. H508 cells were incubated with the vehicle (C), 1 mM McN-A-343 (McN), and 1 mM carbachol (Carb) for the times indicated. For the combination of McN-A-343 plus carbachol, cells were pre-incubated with 1 mM McN-A-343 for 30 min before adding carbachol for an additional 10- or 20-min incubation. Membranes were probed with antibodies against total and phosphorylated ERK. (D) Pre-incubating colon cancer cells with McN-A-343 attenuates carbachol-induced p38 MAPK activation. H508 cells were incubated with the the vehicle (control; C), 1 mM McN-A-343 (McN), and 1 mM carbachol (Carb) alone for the times indicated. For the combination of McN-A-343 plus carbachol, cells were pre-incubated with 1 mM McN-A-343 for 30 min before adding carbachol for an additional 10- or 20-min incubation. Membranes were probed with antibodies against total and phosphorylated p38 MAPK. For (C,D), β-actin was used as a loading control, and the immunoblots shown are representative of three separate experiments. (E) Combining a M1R agonist with 5-FU augments the inhibition of colon cancer cell proliferation. H508 cells were incubated for 5 days with 100 µM 5-FU, 200 µM McN-A-343, or the combination of 5-FU plus McN-A343 (McN). n = 9 (F) Combining a M1R agonist with oxaliplatin augments the inhibition of colon cancer cell proliferation. H508 cells were incubated for 5 days with 10 µM oxaliplatin (oxal), 200 µM McN-A-343, or the combination of 5-FU plus McN-A343 (McN). n = 6. For (E,F), cell proliferation was measured after a 5-day incubation as described in Methods; symbols represent the results of separate incubations. The whole blot of Figure 4C,D is Figure S3. Symbols in Figure 4A,B,E,F represent values for individual replicates.
Cancers 15 04766 g004
Disclaimer/Publisher’s Note: The statements, opinions and data contained in all publications are solely those of the individual author(s) and contributor(s) and not of MDPI and/or the editor(s). MDPI and/or the editor(s) disclaim responsibility for any injury to people or property resulting from any ideas, methods, instructions or products referred to in the content.

