Article

Genome-Wide Association Study Identifies Novel Candidate Variants Associated with Postoperative Nausea and Vomiting

1
Addictive Substance Project, Tokyo Metropolitan Institute of Medical Science, Tokyo 156-8506, Japan
2
Division of Anesthesiology, Koujinkai Daiichi Hospital, Tokyo 125-0041, Japan
3
Department of Anesthesiology and Pain Medicine, Juntendo University School of Medicine, Tokyo 113-8421, Japan
4
Department of Anesthesiology, Cancer Institute Hospital, Tokyo 135-8550, Japan
5
Department of Anesthesiology, East Hokkaido Hospital, Kushiro 085-0036, Japan
*
Author to whom correspondence should be addressed.
These authors contributed equally to this work.
Cancers 2023, 15(19), 4729; https://doi.org/10.3390/cancers15194729
Submission received: 11 August 2023 / Revised: 18 September 2023 / Accepted: 19 September 2023 / Published: 26 September 2023

Abstract

:

Simple Summary

Postoperative nausea and vomiting (PONV) is experienced by approximately 30% of patients who undergo general anesthesia. However, many genetic factors involved in the vulnerability to PONV remain unidentified. The aim of our genome-wide association study (GWAS) was to comprehensively explore genetic variations associated with PONV. We identified several single-nucleotide polymorphisms (SNPs) that may possibly be associated with the frequency of nausea and vomiting, of which the most potent were the rs2776262, rs140703637, rs7212072, rs12444143, rs45574836, and rs1752136 SNPs. These results indicate that these SNPs in the LOC100506403, CNTN5, SHISA6, RBFOX1, ATP8B3, and LOC105370198 gene regions could serve as markers that predict the vulnerability to PONV.

Abstract

Considerable individual differences are widely observed in the incidence of postoperative nausea and vomiting (PONV). We conducted a genome-wide association study (GWAS) to identify potential candidate single-nucleotide polymorphisms (SNPs) that contribute to PONV by utilizing whole-genome genotyping arrays with more than 950,000 markers. The subjects were 806 patients who provided written informed consent and underwent elective surgery under general anesthesia with propofol or desflurane. The GWAS showed that two SNPs, rs2776262 and rs140703637, in the LOC100506403 and CNTN5 gene regions, respectively, were significantly associated with the frequency of nausea. In another GWAS conducted only on patients who received propofol, rs7212072 and rs12444143 SNPs in the SHISA6 and RBFOX1 gene regions, respectively, were significantly associated with the frequency of nausea as well as the rs2776262 SNP, and the rs45574836 and rs1752136 SNPs in the ATP8B3 and LOC105370198 gene regions, respectively, were significantly associated with vomiting. Among these SNPs, clinical and SNP data were available for the rs45574836 SNP in independent subjects who underwent laparoscopic gynecological surgery, and the association was replicated in these subjects. These results indicate that these SNPs could serve as markers that predict the vulnerability to PONV. Our findings may provide valuable information for achieving satisfactory prophylactic treatment for PONV.

1. Introduction

General anesthesia is commonly utilized in surgeries for the treatment of cancer and other diseases. Postoperative nausea and vomiting (PONV) is the most common adverse event following general anesthesia [1], with an estimated incidence of 30% in the general surgical population and as high as 80% in high-risk cohorts [1,2,3]. The development of PONV is associated with significantly lower postoperative quality of life (QOL) [1,4]. Unresolved PONV may result in prolonged post-anesthesia stays in the care unit or hospital that can significantly increase overall healthcare costs [3]. PONV is thought to be multifactorial, involving anesthetic, surgical, and individual risk factors [2,5,6,7]. Female gender, a history of PONV, non-smoking status, a history of motion sickness, and younger age are patient-specific predictors, and the use of volatile anesthetics, the duration of anesthesia, postoperative opioid use, and nitrous oxide have been reported to be anesthesia-related predictors. Cholecystectomy, gynecological surgery, and laparoscopic procedures have been shown to be surgical risk factors for PONV [8,9,10]. Among these, four major factors—female gender, a history of PONV and/or motion sickness, non-smoking status, and the use of postoperative opioids—were incorporated into a simplified risk score to predict PONV that was developed by Apfel et al. (1999) [2]. However, even patients at low PONV risk according to their assigned Apfel score may experience PONV, suggesting a genetic predisposition [11].
Previous genetic studies of candidate molecules that are related to nausea/vomiting mechanisms identified human genetic variants associated with PONV-related phenotypes in genes that encode serotonin receptor type 3, dopamine receptor type 2, μ-opioid receptor, neurokinin 1 receptor, serotonin transporter, adenosine triphosphate (ATP)-binding cassette subfamily B member 1 transporter, organic cation transporter (OCT), and cytochrome P450 2D6 isoform, among others [11,12,13,14]. To date, genetic polymorphisms within and around several genes, including HTR3A [15,16], HTR3B [16,17,18], DRD2/ANKK1 [19,20], OPRM1 [21,22], TACR1 [23], SLC6A4 [24], ABCB1 [25,26,27], OCT1 (SLC22A1) [28], and CYP2D6 [29,30,31], have been found to be associated with PONV-related phenotypes. PONV-related single-nucleotide polymorphisms (SNPs) have also been comprehensively explored based on recent advances in high-density SNP arrays that can screen hundreds of thousands or millions of genetic markers throughout the human genome. For example, Janicki et al. (2011) found that one SNP in the CHRM3 gene, rs2165870, which encodes muscarinic acetylcholine receptor 3, was associated with PONV in a genome-wide association study (GWAS) using pooled deoxyribonucleic acid (DNA) and a separate verification study [32]. Klenke et al. (2018) confirmed the association between the rs2165870 SNP and PONV [33] and identified another SNP, rs349358, in the gene that encodes potassium voltage-gated channel subfamily B member 2 (KCNB2), which was significantly associated with PONV [14]. Another GWAS was reported in female subjects who had a higher risk of PONV and underwent breast cancer surgery with standardized propofol anesthesia and antiemetics, in which six variants with a suggestive association with PONV (p < 1 × 10⁻⁵) were identified, and the association with the DRD2 variant rs1800497 (TaqIA) in previous studies [19,20] was replicated [34]. Although the aforementioned GWASs were all conducted in subjects of European origin, a GWAS in subjects of Asian origin was also recently reported [35]. Sugino et al. (2020) performed a GWAS using a DNA microarray that was optimized for genotyping in Japanese populations and identified 78 SNPs that were associated with the incidence of PONV in a limited sample of 24 female patients (p < 1 × 10⁻⁴). Among these, associations of the two candidate SNPs, the rs1333114 SNP of the PTPRD gene and the rs11232965 SNP of the MIR4300HG gene, were verified in independent samples [35]. However, GWASs with relatively large sample sizes have not been conducted in Asian populations to date, and many genetic factors that contribute to PONV remain unknown.
In the present study, we conducted a GWAS on subjects who were scheduled to undergo general anesthesia by total intravenous anesthesia (TIVA) with propofol or inhalational anesthesia with desflurane to identify potential genetic variants contributing to the vulnerability to PONV. Considering that the entire population was a mixture of subjects who underwent general anesthesia with propofol and desflurane, another GWAS was also performed only in subjects who underwent general anesthesia with propofol to explore the genetic factors associated with PONV.

2. Materials and Methods

2.1. Patients

2.1.1. Patients Who Underwent Elective Surgery under General Anesthesia with Propofol or Desflurane

Enrolled in the study were 806 adult patients (20–93 years old, 432 males and 374 females) who were scheduled to undergo elective surgery for cancer under general anesthesia by TIVA with propofol or inhalational anesthesia with desflurane at The Cancer Institute Hospital of the Japanese Foundation for Cancer Research (JFCR; CIH samples). The exclusion criteria were the following: (1) patients to whom mild or more emetogenic antitumor agents were administered or were scheduled to be administered from 6 days before the start of the study to 48 h after surgery; (2) patients with symptomatic brain metastases; (3) patients who used the following antiemetic drugs within 48 h before and during surgery: 5-hydroxytryptamine 3 (5-HT3) receptor antagonists (granisetron, ondansetron, azasetron, etc.), phenothiazines (chlorpromazine, prochlorperazine, perphenazine, etc.), butyrophenone-based preparations (haloperidol, droperidol, etc.), benzamide preparations (sulpiride, tiapride, sultopride, etc.), dopamine receptor antagonists (metoclopramide, itopride, domperidone, etc.), antihistamines (hydroxyzine, dimenhydrinate, diphenhydramine), or NK1 receptor antagonists (apireptant); (4) patients who were mentally unable to communicate; (5) patients who were pregnant; (6) patients who were judged to be inappropriate for inclusion in the study by the investigator; and (7) patients of the Head and Neck Department and Gastroenterology Department who needed advanced management in the postoperative intensive care unit. The major reasons for applying these exclusion criteria were the possible influence of these factors on the incidence and severity of PONV and the collection of accurate data. The cancellation criteria were the following: (1) patients for whom blood collection was not possible and (2) patients whose informed consent was withdrawn. All of the individuals who were included in the study were of Japanese origin. Peripheral blood samples were collected from these subjects for gene analysis. Detailed demographic and clinical data of the subjects are provided in Table 1.
The study was conducted according to the guidelines of the Declaration of Helsinki and approved by the Institutional Review Board or Ethics Committee of The Cancer Institute Hospital and Tokyo Metropolitan Institute of Medical Science (Tokyo, Japan). Written informed consent was obtained from all of the patients.

2.1.2. Patients Who Underwent Laparoscopic Gynecological Surgery

Enrolled in the study were 350 females (20–70 years old) who were classified as American Society of Anesthesiologists (ASA) Physical Status (ASA-PS) Class I or II and were scheduled to undergo laparoscopic gynecological surgery (LGS) under general anesthesia for benign gynecological diseases (e.g., uterine myoma and ovarian cysts) at Juntendo University Hospital between June 2017 and May 2019 (JUH samples). Excluded were patients who chronically received antipsychotic drugs, antiepileptic drugs, or opioid analgesics; patients with obstructive sleep apnea syndrome; and patients whose body mass index (BMI) was >30 kg/m2. Additionally, patients for whom surgery was converted from LGS to open abdominal surgery and patients who underwent re-operation for hemorrhage were excluded. The major reasons for applying these exclusion criteria were the possible influence of these factors on the incidence and severity of PONV and the collection of accurate data.
The study was conducted according to the guidelines of the Declaration of Helsinki and was approved by the Institutional Review Board or Ethics Committee of Juntendo University School of Medicine and Tokyo Metropolitan Institute of Medical Science (Tokyo, Japan). Written informed consent was obtained from all of the patients.

2.2. Patient Characteristics and Clinical Data

2.2.1. Patient Characteristics and Clinical Data in Patients Who Underwent Elective Surgery under General Anesthesia with Propofol or Desflurane

In the CIH samples, we obtained data on patient characteristics (gender, age, height, weight, and BMI), history of smoking, frequency of alcohol drinking per week, history of motion sickness, history of PONV, surgery data, clinical data for the postoperative period (duration of anesthesia, duration of surgery, type of anesthesia, total dose of remifentanil, total dose of fentanyl, postoperative administration of narcotic drugs, and postoperative administration of opioids (including pentazocine)), the experience and frequency of postoperative pain, and PONV data (Table 1).
For PONV evaluation, the evaluator recorded the number of nausea and vomiting episodes that occurred in the postoperative period. Vomiting was defined as episodes of vomiting and/or retching that occurred once or more (the act of excreting the contents of the stomach) or dry vomiting (the act of trying to vomit without excreting the contents of the stomach). Vomiting that occurred as separate events was defined as the absence of vomiting for at least 1 min between two events. The investigator thoroughly explained the definition of vomiting to the subject.
The presence or absence of nausea, frequency of nausea, presence or absence of vomiting, and presence or absence of PONV (the presence or absence of the incidence of nausea and/or vomiting) were used as endpoints for the genetic association analysis in the present study. Despite possible correlations among the four major endpoint variables, GWASs were performed for all four of these phenotypes in case even slight differences in these endpoint values could be caused by some slightly or moderately different genetic variants. The frequency of vomiting was not analyzed because vomiting occurred only once in most of the subjects. The clinical data on the subjects are detailed in Table 1. Although several kinds of opioids were administered during surgery and the postoperative period, opioid narcotic administration was not standardized in the present study, because opioid administration during surgery and the postoperative period were treated as different variates in the clinical data analyses.

2.2.2. Patient Characteristics and Clinical Data in Patients Who Underwent Laparoscopic Gynecological Surgery

For the JUH samples, patient characteristics, surgical protocols, and postoperative pain management are detailed in another report by Inoue et al. (in preparation). Briefly, anesthesia was induced with remifentanil at a rate of 0.5 μg/kg/min and the target-controlled infusion (TCI) of propofol at a target concentration of 3–5 μg/mL using a TCI pump (TE-371, Terumo, Tokyo, Japan). Dexamethasone (6.6 mg) and droperidol (1.25 mg) were administered intravenously (i.v.) to prevent PONV. Around the end of surgery, infusions of propofol and remifentanil were discontinued. Fentanyl (approximately 4 μg/kg) and acetaminophen (20 mg/kg, up to 1000 mg) were administered i.v. to achieve immediate postoperative pain relief. When patients complained of significant pain, fentanyl (50–100 μg) was given in increments. After adequate immediate postoperative pain relief was achieved, postoperative pain was managed with i.v. fentanyl patient-controlled analgesia (PCA) combined with droperidol (fentanyl (1000 μg in 20 mL) and droperidol (2.5 mg in 1 mL) diluted with normal saline (80 mL) to a total volume of 101 mL) that commenced using a CADD-Legacy PCA pump (Smiths Medical Japan, Tokyo, Japan). Additionally, acetaminophen (20 mg/kg, up to 1000 mg) was administered i.v. every 6 h until it became unnecessary during the first 24 h postoperative period. When the analgesia that was achieved with i.v. fentanyl PCA combined with repeated doses of acetaminophen was inadequate, i.v. flurbiprofen axetil (50 mg) or i.v. pentazocine (30 mg) were given as rescue analgesics. The presence or absence of PONV was assessed at the same time as pain intensities, every 3 h postoperatively or whenever patients complained of PONV. When required, i.v. metoclopramide (10 mg) or rectal domperidone (60 mg) were used to treat PONV. The number of patients who experienced PONV or other adverse effects of fentanyl within the 24 h postoperative period was noted. The characteristics of these clinical data are summarized in Supplementary Table S1.

2.3. Whole-Genome Genotyping and Quality Control

For the CIH samples, 10 mL of venous blood was sampled during anesthesia for the subsequent preparation of genomic DNA specimens. The DNA concentration was adjusted to 100 ng/L for whole-genome genotyping using a NanoDrop ND-1000 Spectrophotometer (NanoDrop Technologies, Wilmington, DE, USA). Whole-genome genotyping was performed using Infinium Assay II with an iScan system (Illumina, San Diego, CA, USA), according to the manufacturer’s instructions. Three kinds of BeadChips were used to genotype 806 samples: HumanOmniExpressExome-8 v. 1.2 (total markers: 964,193), HumanOmniExpressExome-8 v. 1.3 (total markers: 958,497), and HumanOmniExpressExome-8 v. 1.4 (total markers: 960,919). The BeadChips included a number of probes that were specific to copy number variation markers, but most of the BeadChips were for SNP markers on the human autosomes or sex chromosomes. Approximately 946,000 SNP markers were commonly included in all of the BeadChips.
For the JUH samples, 10 mL of venous blood was also sampled to prepare DNA specimens. According to the manufacturer’s recommendations, whole-genome genotyping was performed using Infinium Assay II with an iScan system (Illumina). Infinium Asian Screening Array-24 v. 1.0 BeadChips (one kind) were utilized to genotype 333 patient samples (total markers: 659,184). Numerous copy number variation markers were included in the BeadChips, but the majority of the BeadChips were for SNP markers on the human autosomes or sex chromosomes.
GenomeStudio v. 2.0.4 with the Genotyping v. 2.0.4 module (Illumina) was used to examine the data for samples with their entire genomes genotyped to assess the quality of the findings. Following data cleaning, quality control was performed as for the CIH samples. The patient samples retained a total of 651,086 SNP markers after this screening step. Among these SNPs, the genotype data for a potent SNP found in the GWAS, rs45574836 (exm1401859), were extracted and used for a further replication study.
In the CIH samples, for phenotypes of the frequency of nausea in all patients, the frequency of nausea in patients who received propofol, and the presence/absence of vomiting in patients who received propofol, log QQ p-value plots were subsequently drawn as a result of the GWAS for the 806 samples to check the pattern of the generated p-value distribution, in which the observed p-values against the values that were expected from the null hypothesis of a uniform distribution, calculated as −log10 (p value), were plotted for each model. All of the plots were mostly concordant with the expected line (y = x), especially over the range of 0 < −log10 (p value) < 2.5 for each model in the frequency of nausea in patients who received propofol and vomiting in patients who received propofol, and over the range of 0 < −log10 (p value) < 4.5 for each model in vomiting in patients who received propofol, indicating no apparent population stratification of the samples that were used in the study (Supplementary Figures S1–S3). The Functional Mapping and Annotation of Genome-Wide Association Studies (FUMA GWAS) v. 1.3.9 platform was used to visualize the QQ plots [36].

2.4. Statistical Analysis

In the GWAS for CIH samples, the presence/absence of nausea, frequency of nausea, presence/absence of vomiting, and presence/absence of PONV (the presence/absence of nausea or vomiting) were used as indices of the vulnerability or severity of PONV during the 48 h postoperative period. Before the analyses, quantitative values of the frequency of nausea, represented as integer numbers of the incidence of nausea during the 48 h postoperative period, were modified based on the procedure of variable transformation that was developed by Yeo and Johnson (2000), with the lambda value set as 0.5 for approximation to the normal distribution [37]. To explore the associations between SNPs and the incidence of PONV, Fisher’s exact test or the Cochran–Armitage trend test were conducted in analyses using both the group of all patients and that of patients who received propofol. This was carried out to compare genotype data between subjects with the presence of incidence and subjects with the absence of incidence. To explore associations between the SNPs and the frequency of nausea in analyses using both the group of all patients and that of patients who received propofol, linear regression analyses were conducted in which the variable-transformed frequency of nausea and genotype data for each SNP were incorporated as dependent and independent variables, respectively, with proper covariates. Trend or additive, dominant, and recessive genetic models were used for the analyses due to our previously insufficient knowledge about genetic factors that are associated with PONV. Male genotypes were not included in the analysis of X chromosome markers, whereas both male and female individuals were included in the association study for autosomal markers. PLINK v. 1.07 (https://zzz.bwh.harvard.edu/plink/index.shtml; accessed on 25 June 2023) [38], gPLINK v. 2.050 [38], and Haploview v. 4.1 [39] were used to perform the statistical analyses and visualize the results. Bonferroni’s correction of multiple comparisons was performed to determine the significance of the results. The criterion for significance in the GWAS was set to p < 7.812 × 10⁻⁸ (~0.05/640,000), considering that valid statistical data were obtained for approximately 570,000–640,000 SNPs. Additionally, Hardy–Weinberg equilibrium was tested using the χ2 test (df = 1) for genotypic distributions of SNPs that were significantly associated with the phenotypes, with values of significant deviation set to p = 0.05.
In the replication study for JUH samples, clinical data on the presence/absence of nausea, presence/absence of vomiting, and presence/absence of PONV (the presence/absence of nausea or vomiting) during the 24 h postoperative period were made available and used for an additional association study. Fisher’s exact test or the Cochran–Armitage trend test were conducted in analyses using all patient samples, as in the GWAS. Trend, dominant, and recessive genetic models were, again, used for the analyses. PLINK v. 1.07 [38] was used to perform the statistical analyses. The criterion for significance in the analysis was set to p < 0.05. Additionally, Hardy–Weinberg equilibrium was tested using the χ2 test (df = 1) for genotypic distributions of the candidate SNPs, with values of significant deviation set to p = 0.05.

2.5. Additional In Silico Analysis

2.5.1. Power Analysis

Statistical power analyses were preliminarily performed using G*Power 3.1.3 software [40]. Power analyses for Fisher’s exact tests, with degrees of freedom set to 2, indicated that the expected power (1 minus type II error probability) was 80.0% for the type I error probability, which was set to 1.000 × 10⁻⁷ (close to 7.812 × 10⁻⁸) when risk allele frequencies for patients with nausea and/or vomiting and patients without nausea and/or vomiting were 0.2756 and 0.1000, 0.3138 and 0.1000, and 0.2729 and 0.1000, and when the sample sizes for patients with nausea and/or vomiting and patients without nausea and/or vomiting were 265 and 541, 149 and 657, and 280 and 526, respectively, in the present study. However, for the same type I error probability and sample sizes of 265 and 541, 149 and 657, and 280 and 526, the expected power decreased to 50.0% when the risk allele frequencies for patients with nausea and/or vomiting and patients without nausea and/or vomiting were 0.2478 and 0.1000, 0.2788 and 0.1000, and 0.2455 and 0.1000, respectively. Conversely, the estimated risk allele frequencies for patients with nausea and/or vomiting and patients without nausea and/or vomiting were 0.2905 and 0.1000, 0.3327 and 0.1000, and 0.2876 and 0.1000 for the same type I error probability, and sample sizes of 265 and 541, 149 and 657, and 280 and 526, respectively, were required in order to achieve 90% power. Therefore, a single analysis in the present study was expected to detect true associations with the phenotypes, with 80% statistical power for effect sizes from large to moderately medium but not small, although the exact effect size is poorly understood in cases of SNPs that significantly contribute to PONV.

2.5.2. Reference of Databases

Several databases and bioinformatic tools were referenced to more thoroughly examine the candidate SNPs that may be related to human vulnerability to PONV, including the National Center for Biotechnology (NCBI) database (http://www.ncbi.nlm.nih.gov; accessed on 19 January 2023), HaploReg v. 4.1 (https://pubs.broadinstitute.org/mammals/haploreg/haploreg.php; accessed on 25 June 2023) [41], SNPinfo Web Server (https://snpinfo.niehs.nih.gov; accessed on 25 June 2023) [42], the Genotype-Tissue Expression (GTEx) portal (https://gtexportal.org/home/; accessed on 25 June 2023) [43], the PheWeb database (https://pheweb.jp/; accessed on 18 July 2023) [44], and the SIFT tool (https://sift.bii.a-star.edu.sg/; accessed on 18 July 2023). HaploReg is a tool for investigating non-coding genomic annotations at variations in haplotype blocks, such as potential regulatory SNPs at disease-associated sites [41]. The SNPinfo Web Server is a set of web-based SNP selection tools (freely available at https://snpinfo.niehs.nih.gov; accessed on 19 January 2023) where investigators can specify genes or linkage regions and select SNPs based on GWAS results, linkage disequilibrium (LD), and predicted functional characteristics of both coding and non-coding SNPs [42]. The GTEx project, an ongoing effort to create a comprehensive public resource to study tissue-specific gene expression and regulation [43], is the basis of the GTEx portal, which offers open access to data such as gene expression, quantitative trait loci, and histology images. The PheWeb database is a platform that releases GWAS summary statistics of the BioBank Japan Project (BBJ) [44]. The SIFT tool was utilized to estimate whether amino acid substitution would affect protein function based on sequence homology and the physical properties of amino acids. Furthermore, the protein structures of contactin 5 and ATPase phospholipid transporting 8B3 were predicted from the amino acid sequence (NCBI accession no. NP_001230199.1 and NP_001171473.1, respectively) by the SWISS-MODEL server (http://swissmodel.expasy.org/; accessed on 18 July 2023).

3. Results

3.1. Impact of Clinical Variables on the Incidence of PONV in Subjects Who Underwent Elective Surgery under General Anesthesia with Propofol or Desflurane

In the CIH samples, nausea, vomiting, and PONV (nausea and/or vomiting) occurred in 32.88%, 18.49%, and 34.74% of the subjects, respectively (Table 1). Prior to the GWAS, multivariate regression analysis was conducted to explore possible factors influencing the quantitative trait of the frequency of nausea among subjects characterized by various demographic and clinical data, described in Table 1. Significant associations were revealed between the variable-transformed frequency of nausea and gender (β = 0.1743, p = 0.0343), history of smoking (β = −0.2480, p = 0.0001), history of motion sickness (β = 0.1782, p = 0.0093), history of PONV (β = 0.3034, p = 0.0049), postoperative administration of narcotic drugs (β = 0.3383, p < 0.0001), frequency of pain (β = 0.0240, p = 0.0267), and duration of surgery (min) (β = 0.0007 p = 0.0152). Therefore, these variables were incorporated as covariates in the linear regression analyses for the frequency of nausea.

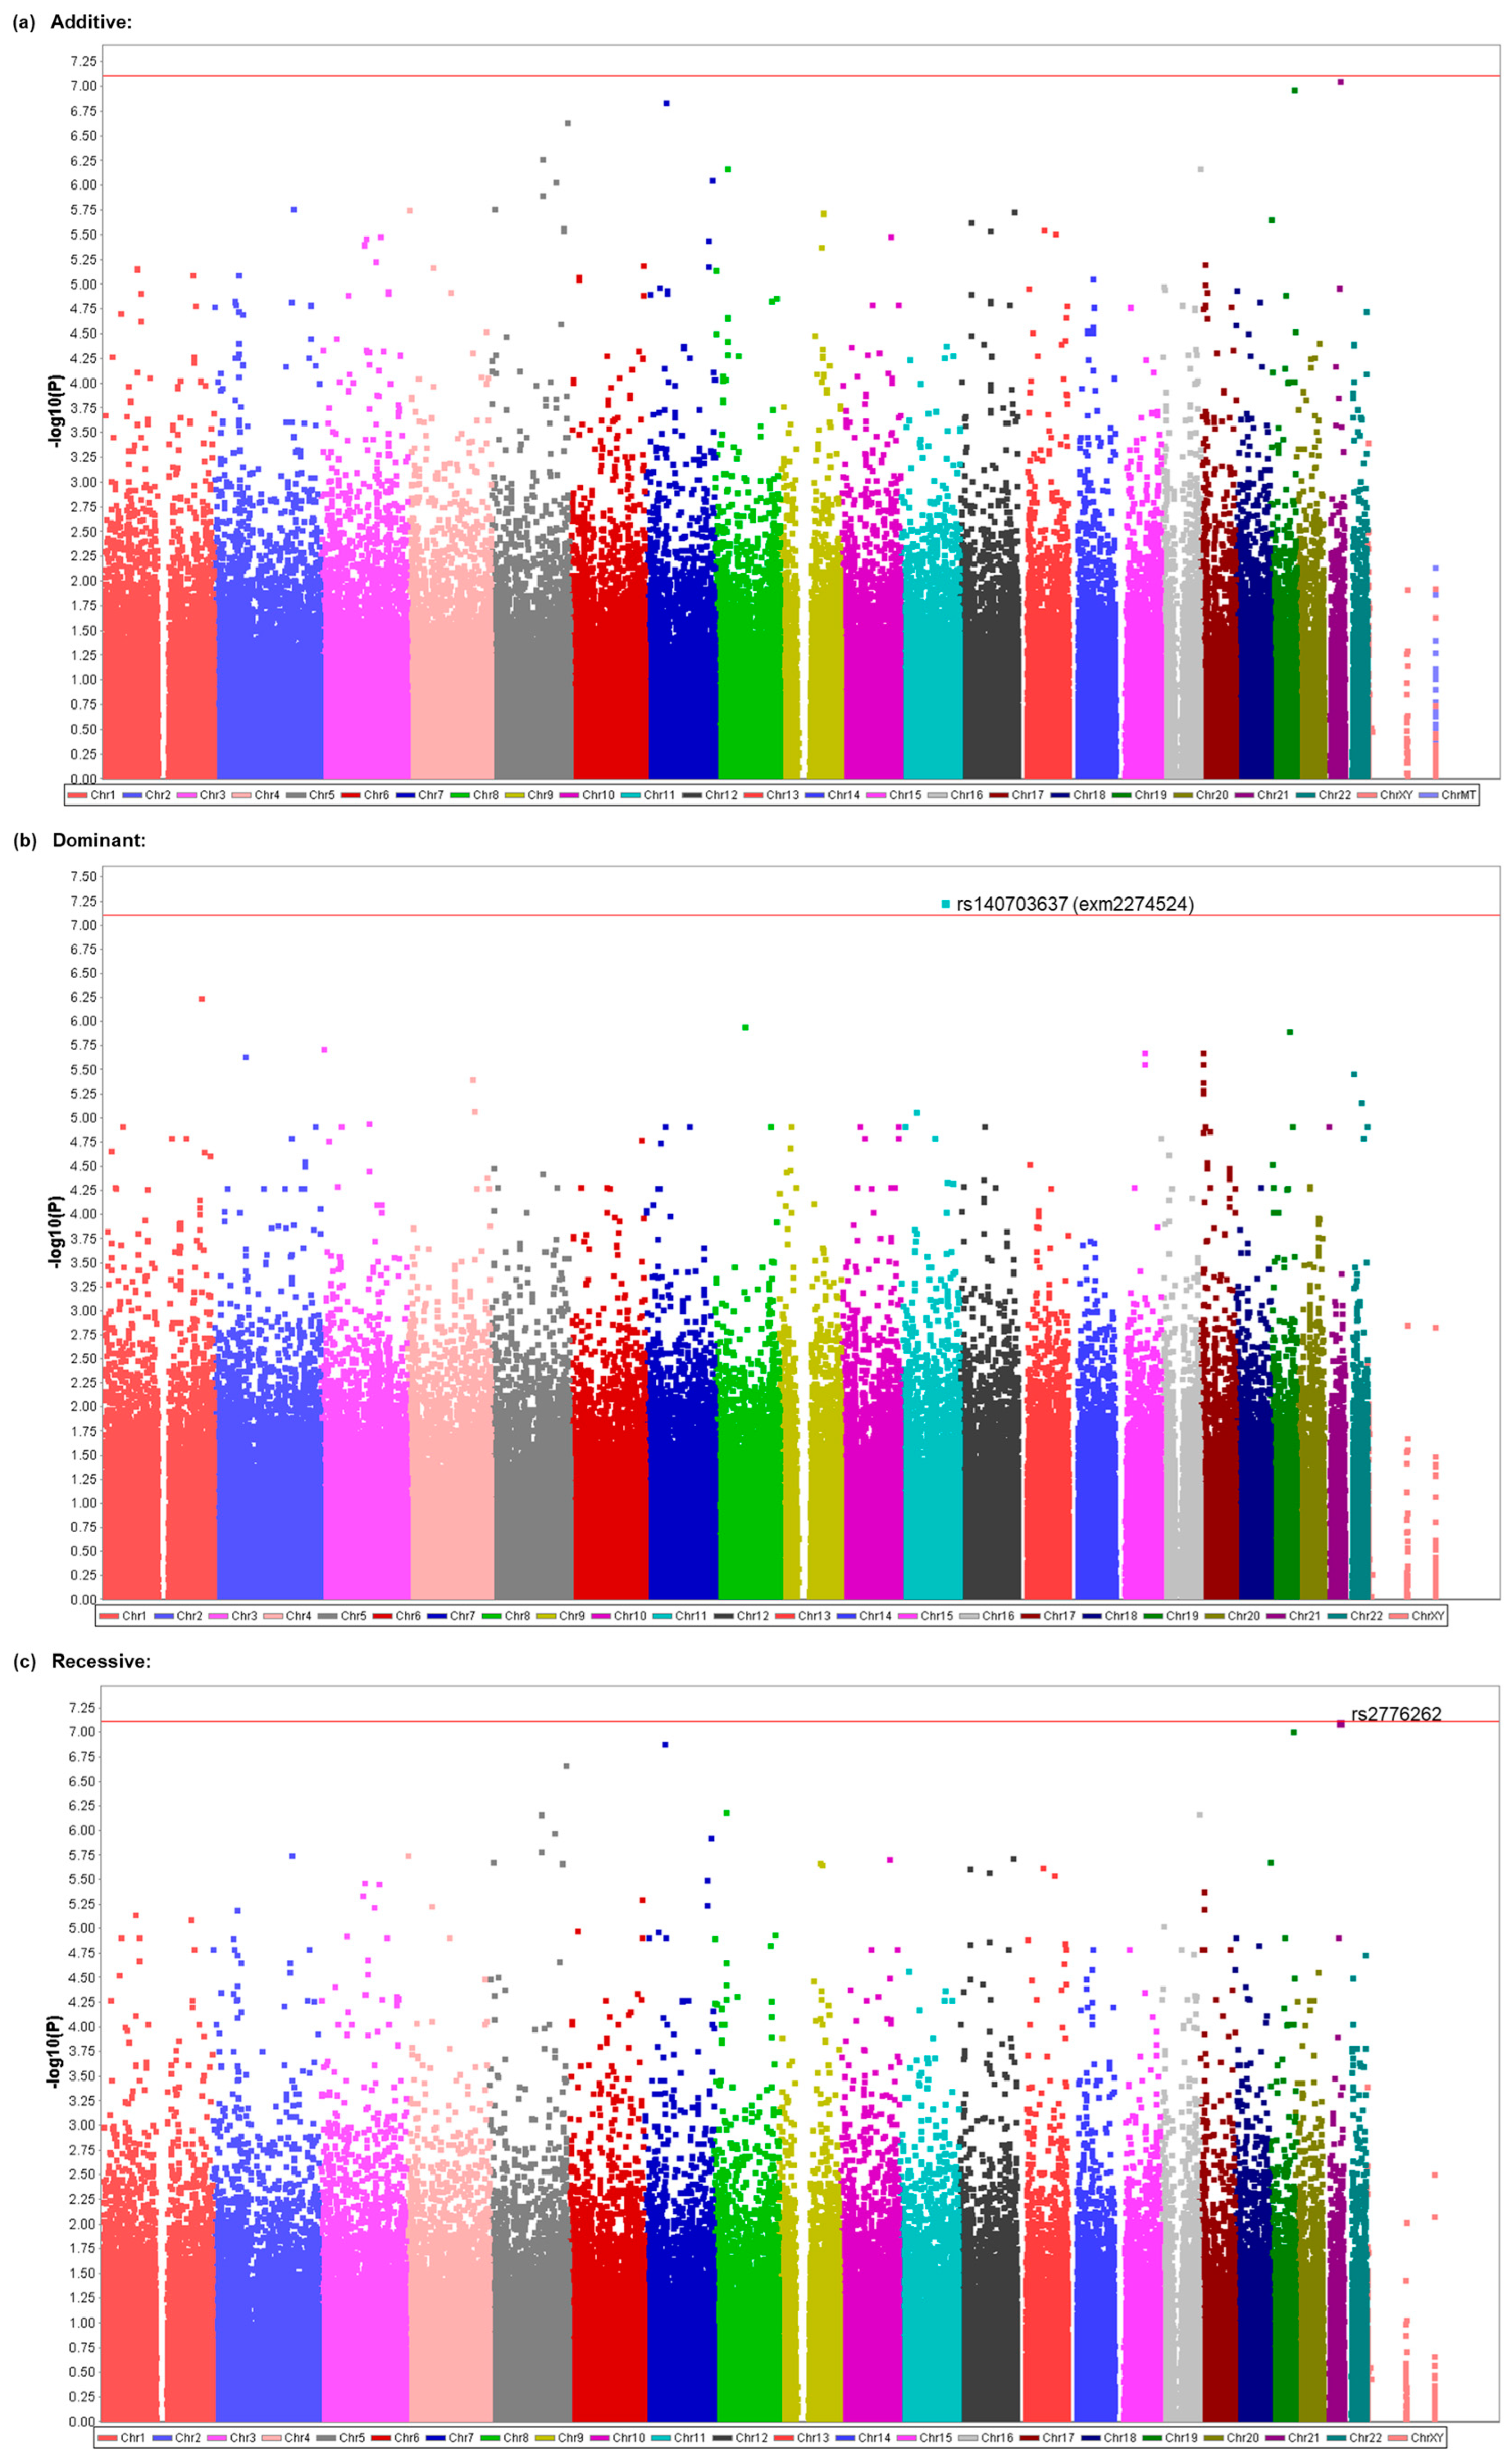
3.2. Identification of Genetic Polymorphisms Associated with PONV in All Patients Who Underwent Elective Surgery under General Anesthesia with Propofol or Desflurane

We comprehensively explored genetic variants that were associated with the presence or absence of nausea, frequency of nausea, presence or absence of vomiting, and presence or absence of PONV in a total of 806 patient subjects of CIH samples. We investigated common genetic factors for PONV by TIVA with propofol or inhalational anesthesia with desflurane. A total of 943,259 SNPs that met the quality control standards in the GWAS of all patients were examined for their relationships with the phenotypes in the trend, additive, dominant, and recessive models. No SNPs showed significant associations with the presence or absence of nausea, presence or absence of vomiting, or presence or absence of PONV (Supplementary Tables S2–S4), but significant associations were found with the frequency of nausea. Significant associations were found for the rs140703637 (exm2274524) SNP on chromosome 11 in the dominant model (p = 5.555 × 10⁻⁸; Table 2, Figure 1b) and the rs2776262 SNP on chromosome 21 in the recessive model (p = 7.573 × 10⁻⁸; Table 2, Figure 1c). Many of the examined SNPs’ computed -log10 p-values (observed p-values), which were based on the null hypothesis of a uniform distribution in the QQ plot, differed from the predicted values (Supplementary Figure S1). The values for SNPs with significant associations in Table 2 (rs140703637 and rs2776262) and other SNPs were obviously higher than the predicted values (Supplementary Figure S1b,c). However, no significant associations were found in the additive model for this phenotype (Table 2, Figure 1a). The rs140703637 SNP is located in the exon region of the contactin 5 (CNTN5) gene, which leads to missense mutation of the gene, and the rs2776262 SNP is located in the intron region of the LOC100506403 gene, which is a non-coding gene that is not characterized well according to the annotation file that was supplied by manufacturer of the BeadChips or NCBI database (Table 3). As shown in Table 2, when the heterozygous and homozygous minor alleles of the rs140703637 and rs2776262 SNPs were carried, respectively, it was associated with a greater frequency of nausea during the 48 h postoperative period. None of the genotype distributions for the SNPs that were significantly associated with the phenotype significantly deviated from theoretical Hardy–Weinberg equilibrium (χ2 = 0.0050, p = 0.9975 for rs140703637; χ2 = 0.2384, p = 0.8876 for rs2776262).

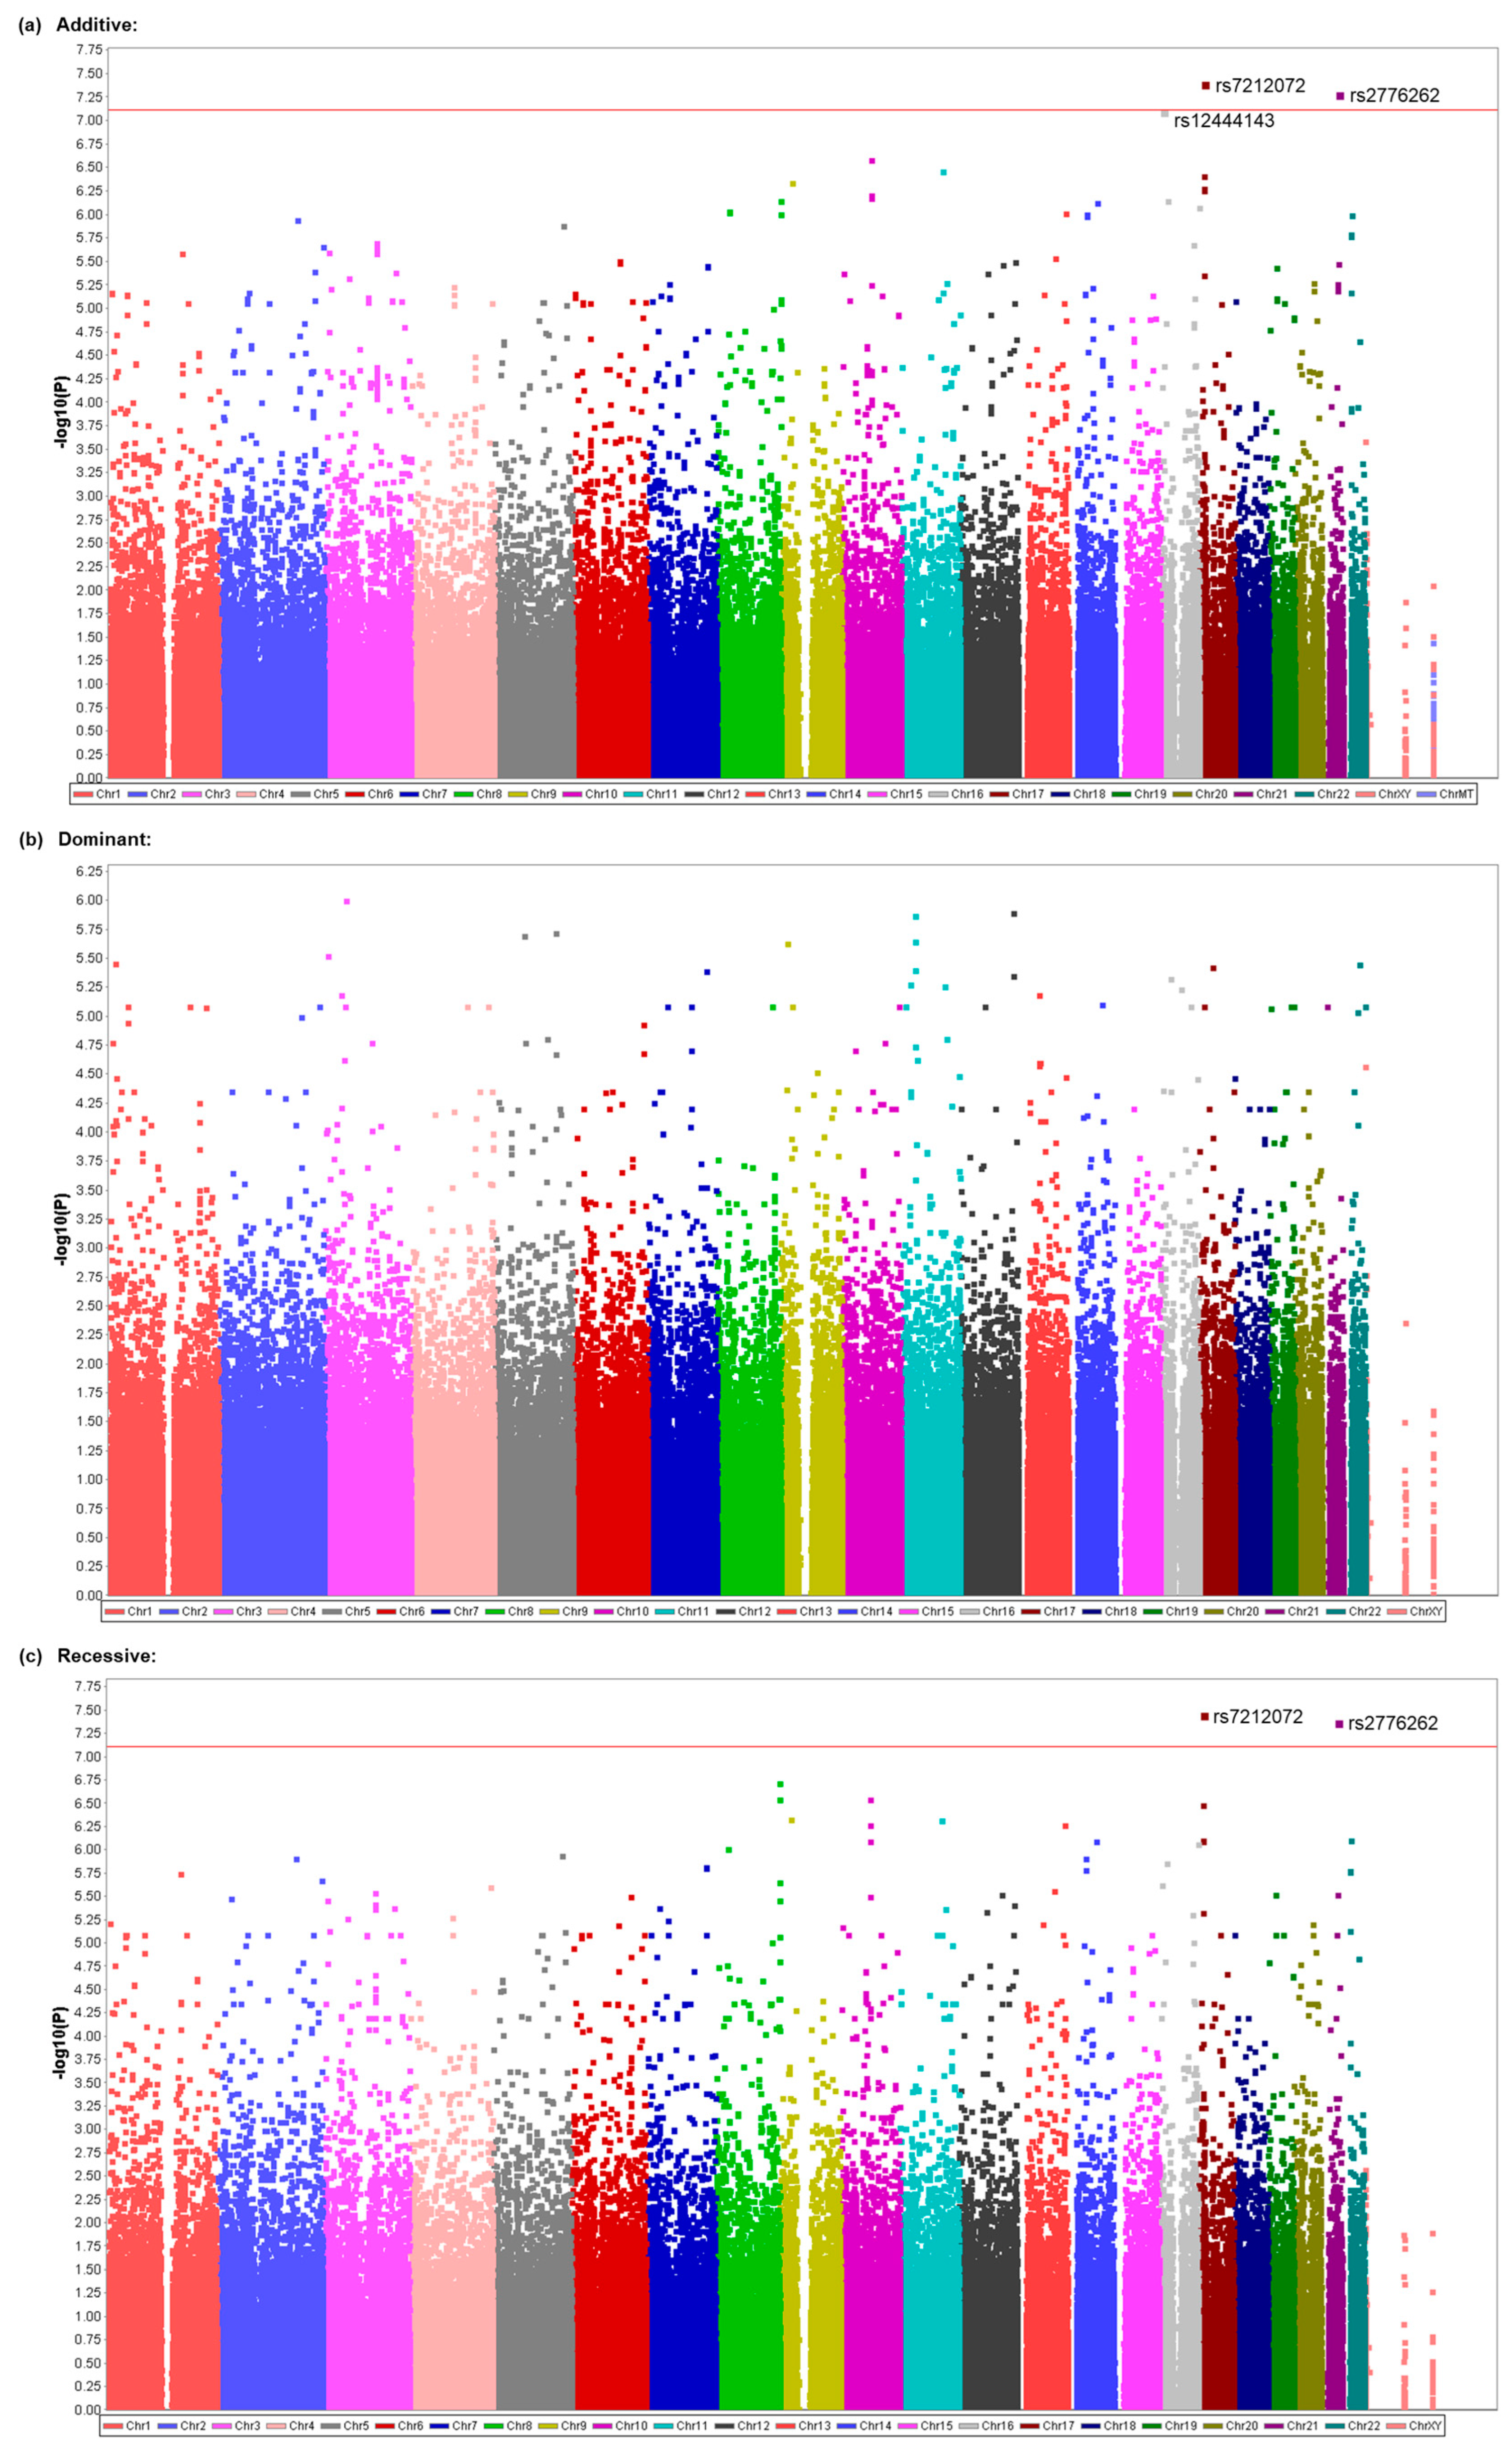
3.3. Identification of Genetic Polymorphisms Associated with PONV in Patients Who Underwent Elective Surgery under General Anesthesia with Propofol

Although two kinds of anesthesia were used in patients who underwent general anesthesia at The Cancer Institute Hospital, the major type of anesthesia was TIVA by propofol (Table 1). Considering the possibility that genetic factors would more greatly contribute to the incidence of PONV without the use of volatile anesthetics compared with the use of volatile anesthetics, which are known to cause PONV more often than i.v. anesthetics, we then conducted another GWAS of the same SNPs by including only a subgroup of 442 patients who underwent general anesthesia by TIVA with propofol in CIH samples (Table 1). No SNPs showed significant associations with the presence or absence of nausea or PONV (Supplementary Tables S5 and S6), but significant associations were found with the frequency of nausea. Significant associations were found for the rs7212072 SNP on chromosome 17 (p = 3.919 × 10⁻⁸), the rs2776262 SNP on chromosome 21 (p = 5.028 × 10⁻⁸), and the rs12444143 SNP on chromosome 16 (p = 7.770 × 10⁻⁸) in the additive model (Table 3, Figure 2a). Associations were also significant for the rs7212072 SNP (p = 3.412 × 10⁻⁸) and rs2776262 SNP (p = 4.121 × 10⁻⁸) in the recessive model (Table 3, Figure 2c). However, no significant associations were found in the dominant model for this phenotype (Table 3, Figure 2b). Many of the examined SNPs’ computed -log10 p values (observed p values) differed from the predicted values (Supplementary Figure S2), and the values for SNPs with significant associations in Table 3 (rs7212072, rs2776262, and rs12444143) and other SNPs were obviously higher than the predicted values (Supplementary Figure S2a,c). Additionally, significant associations were found between the presence or absence of vomiting and the rs45574836 (exm1401859) SNP on chromosome 19 (p = 2.972 × 10⁻⁸) and rs1752136 SNP on chromosome 13 (p = 6.384 × 10⁻⁸) in the trend model (Table 4, Figure 3a). However, significant associations were not found in the dominant or recessive models in this phenotype (Table 4, Figure 3b,c). Many of the examined SNPs’ computed −log10 p values (observed p values) differed from the predicted values (Supplementary Figure S3), and the values for SNPs with significant associations in Table 4 (rs45574836 and rs1752136) and other SNPs were obviously higher than the predicted values (Supplementary Figure S3a). The rs7212072 and rs12444143 SNPs are located in intron regions of genes that encode shisa family member 6 (SHISA6) and RNA binding fox-1 homolog 1 (RBFOX1), respectively (Table 3), and the rs45574836 SNP is located in exon regions of the gene that encodes ATPase phospholipid transporting 8B3 (ATP8B3), which leads to missense mutation of the gene (Table 4). The rs1752136 SNP is located in intron regions of the LOC105370198 gene, which is a non-coding gene that is not characterized well according to the annotation file that was supplied by the manufacturer of the BeadChips or NCBI database (Table 4). As shown in Table 3 and Table 4, the presence of minor alleles of the rs7212072, rs2776262, rs12444143, rs45574836, and rs1752136 SNPs was additively or homozygously associated with a greater frequency of nausea or greater incidence of vomiting during the 48 h postoperative period. None of the genotype distributions for the SNPs that were significantly associated with the phenotypes significantly deviated from the theoretical Hardy–Weinberg equilibrium (χ2 = 3.1493, p = 0.0760 for rs7212072; χ2 = 0.3401, p = 0.5598 for rs2776262; χ2 = 2.8784, p = 0.0898 for rs12444143; χ2 = 0.2499, p = 0.6171 for rs45574836; χ2 = 0.7072, p = 0.4004 for rs1752136).

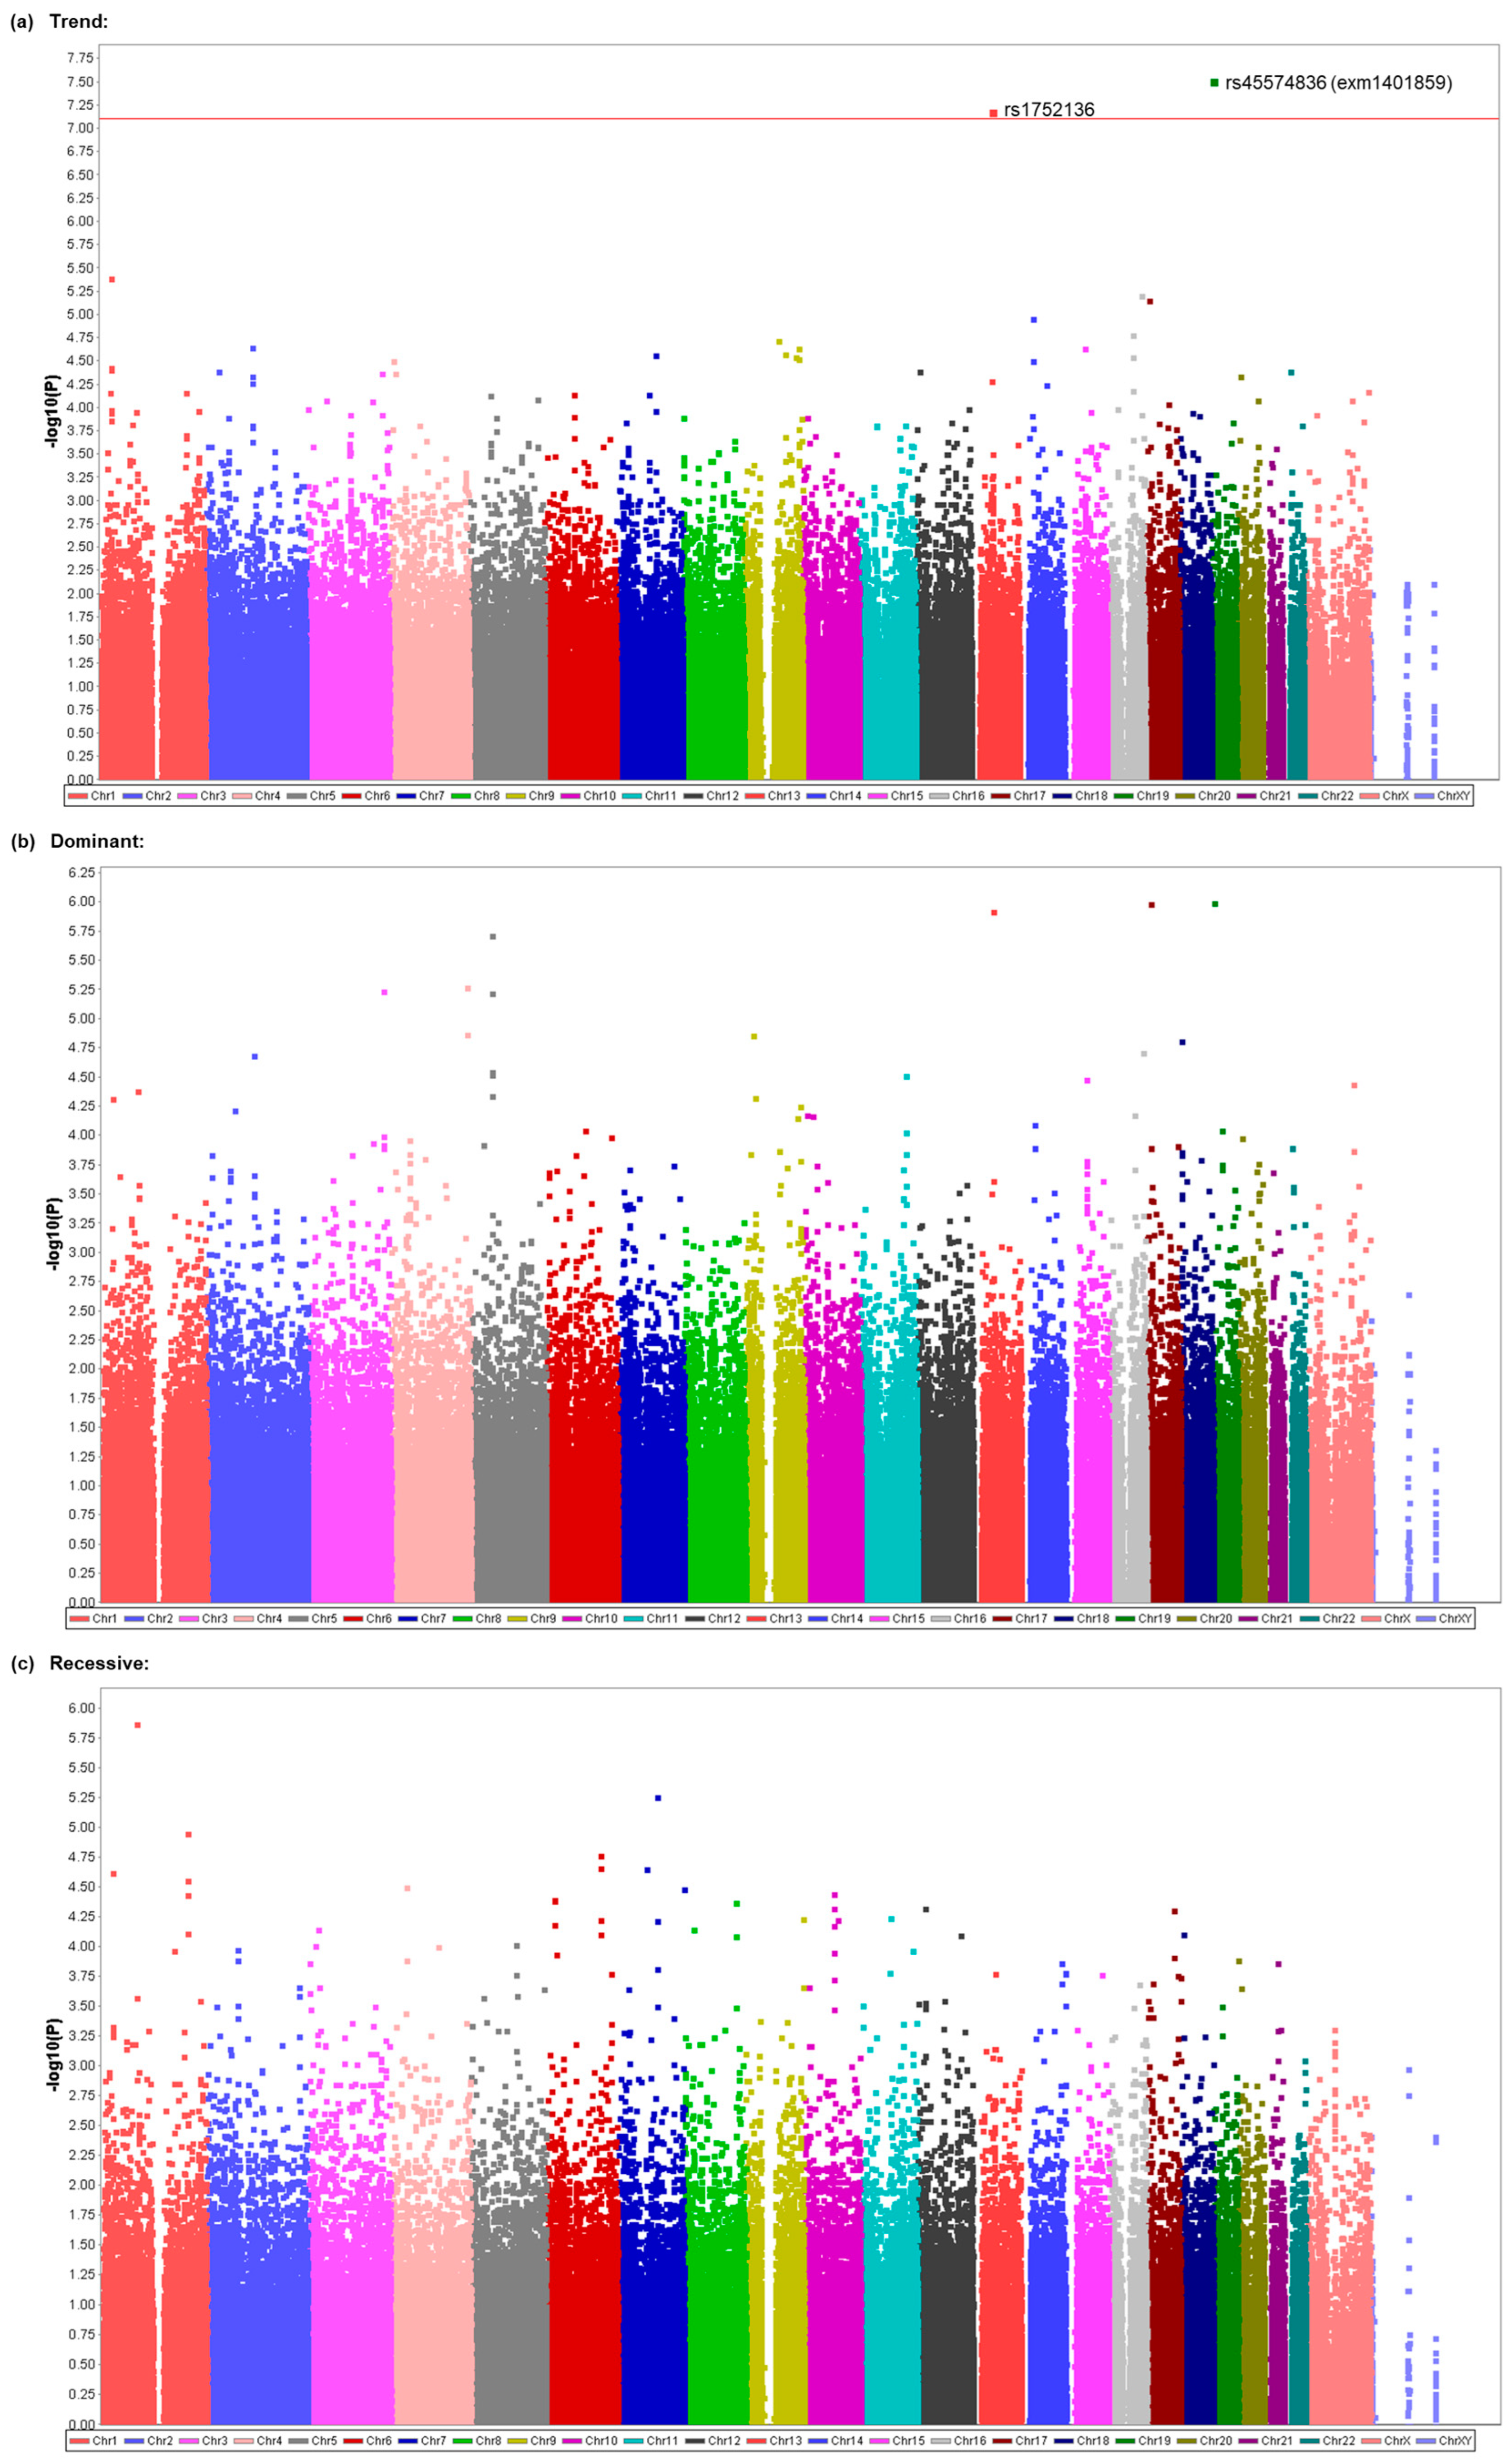
3.4. Replication of Possible Association between the rs45574836 (exm1401859) SNP and Vomiting in Patients Who Underwent Gynecological Laparoscopic Surgery

The observed associations between the rs140703637, rs2776262, rs7212072, and rs12444143 SNPs and the frequency of nausea, as well as between the rs45574836 and rs1752136 SNPs and the presence of vomiting, that were identified in the GWAS of CIH samples suggest that the rs140703637, rs2776262, rs7212072, and rs12444143 SNPs were related to vulnerability to nausea, whereas the rs45574836 and rs1752136 SNPs were related to the vulnerability to vomiting in this cohort. Carriers of risk alleles of these SNPs may have presented higher vulnerability than non-carriers. To examine whether the possible difference between genotypes in the vulnerability to nausea/vomiting could be corroborated in another cohort of patients, we compared phenotypic traits that were related to PONV between genotypes of these SNPs in patients who underwent LGS (JUH samples). Clinical data on the frequency of nausea during the postoperative period were unavailable, but clinical data on the presence/absence of nausea, vomiting, and PONV were available in the JUH samples. Although the probe for the rs1752136 SNP was not included in the SNP array for genotyping in JUH samples, the probe for the rs45574836 SNP was included in the SNP array, and genotype data were available. Therefore, an additional association study for replication of the GWAS results was conducted for this SNP. The association analyses of the presence/absence of nausea, vomiting, and PONV revealed significant associations with vomiting in the trend and dominant models (p = 0.0239 in the trend model; p = 0.0313 in the dominant model; Table 5). Significant associations were also found between this SNP and PONV in the trend and dominant models (p = 0.0464 in trend model; p = 0.0289 in dominant model; Table 5). The association between this SNP and nausea was marginally significant in the dominant model (p = 0.0645), but no significant associations were found in the other analyses (Table 5). As observed in the GWAS of CIH samples, strong associations between this SNP and vomiting in the trend and dominant models were observed in the replication study of JUH samples (Table 5), suggesting that the presence of the minor A allele of this SNP is associated with PONV, especially vomiting. The genotype distributions for this SNP in JUH samples were 263, 67, and 3 for the G/G, G/A, and A/A genotypes, respectively, which did not significantly deviate from the theoretical Hardy–Weinberg equilibrium (χ2 = 0.3158, p = 0.5742).

4. Discussion

To identify potential genetic variants that contribute to the vulnerability to PONV, we conducted a GWAS on patient subjects who underwent general anesthesia by TIVA with propofol or inhalational anesthesia with desflurane (Table 1). Our GWAS identified several potent SNPs that may possibly be associated with the frequency of nausea, including rs2776262, rs7212072, and rs12444143 in the additive and/or recessive models (Table 2 and Table 3; Figure 1 and Figure 2) and rs140703637 (exm2274524) in the dominant model (Table 2; Figure 1). Our GWAS also identified potent SNPs that may possibly be associated with the presence/absence of vomiting, including rs45574836 (exm1401859) and rs1752136 in the trend model (Table 4; Figure 3). Among them, the association between the rs45574836 (exm1401859) SNP and vomiting that was found in CIH samples was replicated in JUH samples (Table 5). The results suggested that carriers of the minor A allele of the rs45574836 SNP in the ATP8B3 gene region that leads to a missense mutation were more vulnerable to vomiting, and, thus, tended to experience vomiting more often than noncarriers during the postoperative period (Table 4 and Table 5). Future studies with larger sample sizes are required in order to corroborate the significant results that were identified in our GWAS.
Previous studies have identified several genetic variants that are associated with phenotypes that are related to PONV [11,12,13,14]. Included in the variants that have been identified in previous candidate gene association studies are the rs33940208, rs1985242, rs10160548, and rs1176713 SNPs of the HTR3A gene [15,16]; the rs34236293, rs45519137, rs3758987, and -100_-102AAG deletion polymorphisms of the HTR3B gene [16,17,18]; the rs1800497 SNP of the DRD2/ANKK1 gene [19,20]; the rs1799971 and rs9397685 SNPs of the OPRM1 gene [21,22]; the rs3755468 SNP of the TACR1 gene [23]; the 5-HTTLPR and rs25531 polymorphisms of the SLC6A4 gene [24]; the rs2032582 and rs1045642 SNPs of the ABCB1 gene [25,26,27]; the rs12208357 SNP of the OCT1 (SLC22A1) gene [28]; and the rs16947, rs35742686, rs1135824, rs3892097, rs5030655, rs5030867, rs5030865, rs5030656, rs1065852, and rs5030863 SNPs of the CYP2D6 gene [12,29,30,31]. Additionally, genetic variants identified in previous GWASs were the rs2165870 SNP of the CHRM3 gene, the rs349358 SNP of the KCNB2 gene, the rs1800497 SNP of the DRD2/ANKK1 gene, the rs1333114 SNP of the PTPRD gene, and the rs11232965 SNP of the MIR4300HG gene [32,33,34,35]. Among these SNPs, the rs10160548 SNP of the HTR3A gene, the rs3758987 SNP of the HTR3B gene, the rs1800497 SNP of the DRD2/ANKK1 gene, the rs1799971 SNP of the OPRM1 gene, the rs3755468 SNP of the TACR1 gene, and the rs2032582 and rs1045642 SNPs of the ABCB1 gene were included in the SNP array that was used in the present study. However, almost none of these SNPs were even nominally significantly associated with PONV-related phenotypes (p > 0.05) according to our association analysis (details not shown), except for the rs10160548 SNP of the HTR3A gene and the rs1799971 SNP of the OPRM1 gene, which showed some associations in patients who received propofol anesthesia (p = 0.03864, nausea in additive model; p = 0.03512, nausea in recessive model; p = 0.02408, PONV in additive model; and p = 0.004705, PONV in the recessive model for the rs10160548 SNP; p = 0.04958, frequency of nausea in the dominant model for the rs1799971 SNP). For the rs10160548 SNP, the results of our association analysis indicated that the minor allele was associated with a lower incidence of nausea/PONV compared with noncarriers in patients who received propofol anesthesia, which appears to be in accordance with the trend that was observed for nausea in a previous report by Lin et al. (2014) [15]. For the rs1799971 SNP, the results of our association analysis indicated that carriers of the G/G genotype were associated with more frequent nausea compared with noncarriers, which appears to be the opposite trend to the results that were reported by Lee et al. (2015), in which patients with the G/G genotype were lower on the PONV scale upon arrival to the post-anesthesia care unit [21]. These different results between the present study and previous studies might indicate the general difficulty of replicating the results of human genetic association studies, likely because of the heterogeneity of the study designs, length of the postoperative period during which PONV was recorded, the severity of PONV, the types of surgery, the types of anesthetics, and the genetic backgrounds of the subjects, among other factors.
Propofol is one of the most commonly used intravenous anesthetics, and inhalational volatile anesthetics, such as sevoflurane and desflurane, are also often used in general anesthesia. Indeed, most previous genetic association studies of PONV-related phenotypes were conducted in patients who underwent general anesthesia with these anesthetics [14,15,18,19,20,21,22,23,25,26,28,30,33,34,35]. In the present study, the subjects who were recruited for the GWAS were patients who underwent general anesthesia with either propofol or desflurane. Given that the use of volatile anesthetics, per se, is known as a strong anesthesia-related risk factor for PONV [8,9,10], one could assume that genetic factors would more greatly contribute to the incidence of PONV without the use of volatile anesthetics compared with that with the use of volatile anesthetics. From this viewpoint, we conducted two kinds of GWASs. One was performed in all subjects to investigate common genetic factors for PONV by TIVA with propofol or inhalational anesthesia with desflurane. The other was performed only in subjects who underwent general anesthesia by TIVA with propofol. As a result, two SNPs were identified to be significantly associated with the frequency of nausea in all subjects (Table 2; Figure 1), and three SNPs were identified to be significantly associated with the same phenotype in the subgroup of subjects who underwent general anesthesia by TIVA with propofol (Table 3; Figure 2), among which one SNP was common in both subject groups (Table 2 and Table 3; Figure 1 and Figure 2). Moreover, the analysis of the subgroup of subjects also identified two SNPs that were significantly associated with the incidence of vomiting (Table 4; Figure 3), which were not identified to be significantly associated with the same phenotype in the analysis of all subjects (Supplementary Table S3), although the sample size in the analysis for the subgroup with propofol was much smaller than that for all subjects (Table 1). These outcomes might suggest the possibility that different genetic variants are involved in the etiology of PONV in the case of propofol and desflurane, as well as suggesting the importance of the homogeneity of samples used in human genetic association studies.
The best candidate SNPs in the present study were rs2776262, rs140703637, rs7212072, and rs12444143 for the frequency of nausea (Table 2 and Table 3; Figure 1 and Figure 2) and rs45574836 and rs1752136 for the presence/absence of vomiting (Table 4; Figure 3). The rs2776262, rs140703637, rs7212072, rs12444143, rs45574836, and rs1752136 SNPs are located in the LOC100506403, CNTN5, SHISA6, RBFOX1, ATP8B3, and LOC105370198 genes, respectively (Table 2, Table 3 and Table 4). Among them, LOC100506403 and LOC105370198 are non-coding genes that do not appear to have been characterized well to date. The CNTN5, SHISA6, RBFOX1, and ATP8B3 genes encode contactin 5, shisa family member 6, RNA binding fox-1 homolog 1, and ATPase phospholipid transporting 8B3, respectively. According to the NCBI database, contactin 5 is a member of the immunoglobulin superfamily and contactin family, which mediate cell surface interactions during nervous system development, and biased expression in the placenta and thyroid, among others, has been observed. Likewise, shisa family member 6 is predicted to enable ionotropic glutamate receptor binding activity and to be involved in several processes, including excitatory chemical synaptic transmission, the regulation of short-term neuronal synaptic plasticity, and the regulation of signal transduction. Biased expression in the brain and endometrium, among others, has been observed. The RNA-binding fox-1 homolog 1 is known as a Fox-1 family of RNA-binding proteins that regulates tissue-specific alternative splicing in metazoa, and biased expression in the brain and heart has been observed. The ATPase phospholipid transporting 8B3 belongs to the family of P-type cation transport ATPases and the subfamily of aminophospholipid-transporting ATPases that transport phosphatidylserine and phosphatidylethanolamine from one side of a bilayer to the other. Biased expression in the testis and endometrium, among others, has been observed.
To date, none of the LOC100506403, CNTN5, SHISA6, RBFOX1, ATP8B3, and LOC105370198 genes have been reported to be involved in mechanisms of nausea or vomiting. Although Cntn5 knockout animals exhibited no behavioral abnormalities, the mice were leaner, with less body mass and lower fat percentages than wildtype animals. Their cardiovascular parameters (heart rate, blood pressure, and blood flow speed) were elevated compared with the controls [45]. According to the PheWeb database [44], the rs140703637 SNP of the CNTN5 gene is significantly associated with Parkinson’s disease, in which the dopamine system is known to be involved in its etiology [46]; it is also known to be involved in the etiology of PONV [47]. To our knowledge, no previous reports have suggested that functional changes are caused by this nonsynonymous polymorphism. Functional changes may not be easily evaluated by structural changes in the protein, which could be predicted from each amino acid sequence by the SWISS-MODEL server (Supplementary Figure S4). However, our database search estimated that the possible impact of the amino-acid substitution from isoleucine to leucine, through a base substitution from A to C in the rs140703637 SNP, on the structure and function of the human protein is predicted to be “deleterious” according to the SIFT tool, suggesting that a dramatic change may be expected to result from this SNP. For SHISA6 and RBFOX1, although no relationships with PONV have been reported, two SNPs in these genes, rs2908972 and rs10500355, respectively, were interestingly shown to be strongly associated with myopia (p = 5.000 × 10⁻²⁴ for rs2908972; p = 2.000 × 10−63 for rs10500355) [48] according to the Phenotype-Genotype Integrator (PheGenI), which is available in the NCBI database. This might imply that these two genes are commonly involved in mechanisms of myopia and nausea. Although our database search in the GTEx portal [43] did not find any significant associations between the best candidate SNPs in the present study, which are mentioned above, and gene expression, the rs2256472 and rs2406801 SNPs, which were strongly linked to rs1752136 (r2 ≥ 0.8) based on HaploReg v. 4.1 [41] and the SNPinfo Web Server [42], were shown to be significantly associated with the expression of two nearby genes, succinate-CoA ligase ADP-forming subunit β (SUCLA2) and long intergenic non-protein coding RNA 562 (LINC00562). This suggests that this SNP is involved in mechanisms of vomiting through the alteration of expression of these genes, although further details are unknown. A role of Atp8b3 in mouse sperm cell capacitation has been suggested [49], but the possible relationship between ATP8B3 and PONV remains unknown. Moreover, the amino acid substitution from alanine to threonine, through a base substitution from G to A in the rs45574836 SNP, seemingly caused no fundamental changes in our predicted protein structures according to the SWISS-MODEL server (Supplementary Figure S5). However, according to the PheWeb database, the rs45574836 SNP is moderately associated with constipation (p = 2.9 × 10⁻³), which is known as a major side effect of opioids, as well as nausea and vomiting [50]. Furthermore, the association between the rs45574836 SNP and vomiting in the CIH samples was replicated in the JUH samples in the same genetic model in the present study (Table 5), suggesting that this is a plausible candidate SNP that contributes to individual differences in the vulnerability to vomiting.
One limitation of the present study was the lack of detailed surgical records in the CIH samples; thus, no details regarding surgical procedures are described in the CIH cohort (Table 1). Given that cholecystectomy, gynecological surgery, and laparoscopic procedures have been observed as surgical risk factors for PONV in addition to other anesthesia-related predictors [8,9,10], the incidence of PONV may be influenced by specific types of surgeries in the subjects, suggesting that the strength of impact of certain types of surgeries as an environmental factor that influences PONV can be different among various surgeries. The lack of surgical information for each patient in the present study hampered our ability to conduct a GWAS in subjects with more homogeneity. In the present study, patients who underwent numerous types of surgeries were recruited, and the GWAS was conducted regardless of type of surgery in the CIH samples. With additional information regarding types of surgeries, further GWASs could be performed in particular subsets of patients, such as only in patients undergoing laparoscopic procedures, which was difficult in the present study because of the lack of such information. These limitations notwithstanding, the present study identified several SNPs that were significantly associated with nausea and vomiting. Regardless of the type of surgery, these SNPs might commonly impact PONV, and they were associated with vulnerability to PONV in our analyses of whole samples.

5. Conclusions

In conclusion, our GWASs revealed that the rs2776262, rs140703637, rs7212072, and rs12444143 SNPs, as well as the rs45574836 and rs1752136 SNPs, were significantly associated with the frequency of nausea and presence/absence of vomiting, respectively, during the postoperative period in patients who underwent elective surgery under general anesthesia with propofol or desflurane. The association between the rs45574836 SNP and vomiting was replicated in patients who underwent laparoscopic gynecological surgery. Although the present results need to be corroborated by more research with larger sample sizes and in other populations, these findings indicate that these SNPs in the LOC100506403, CNTN5, SHISA6, RBFOX1, ATP8B3, and LOC105370198 gene regions could serve as markers that predict the vulnerability to PONV.

Supplementary Materials

The following supporting information can be downloaded at: https://www.mdpi.com/article/10.3390/cancers15194729/s1. Table S1. Demographic and clinical data of patient subjects for the replication study. Table S2. Top 20 candidate SNPs selected from the GWAS for nausea in all patients. Table S3. Top 20 candidate SNPs selected from the GWAS for vomiting in all patients. Table S4. Top 20 candidate SNPs selected from the GWAS for PONV in all patients. Table S5. Top 20 candidate SNPs selected from the GWAS for nausea in patients who received propofol. Table S6. Top 20 candidate SNPs selected from the GWAS for PONV in patients who received propofol. Figure S1. Log quantile-quantile (QQ) p-value plot as a result of the GWAS for the frequency of nausea in all patients. Figure S2. Log quantile-quantile (QQ) p-value plot as a result of the GWAS for the frequency of nausea in patients with propofol. Figure S3. Log quantile-quantile (QQ) p-value plot as a result of the GWAS for vomiting in patients who received propofol. Figure S4. Protein structures of contactin 5 predicted from amino acid sequence (NCBI accession no. NP_001230199.1). Figure S5. Protein structures of ATPase phospholipid transporting 8B3 predicted from amino acid sequence (NCBI accession no. NP_001171473.1).

Author Contributions

Conceptualization, R.M., M.Y. and K.I.; methodology, D.N., J.H., K.N. and Y.E.; software, D.N.; validation, D.N., J.H., K.N. and Y.E.; formal analysis, D.N.; investigation, D.N., S.O. and S.K.; resources, R.M., M.Y., R.I., M.H. and H.S.; data curation, D.N., J.H., K.N. and Y.E.; writing—original draft preparation, D.N.; writing—review and editing, D.N., R.M., S.O. and K.I.; visualization, D.N.; supervision, R.M., M.Y. and K.I.; project administration, K.I.; funding acquisition, D.N. and K.I. All authors have read and agreed to the published version of the manuscript.

Funding

This research was funded by grants from the Japan Society for the Promotion of Science (JSPS) KAKENHI (Nos. 22790518, 23390377, 24790544, 26293347, JP22H04922 [AdAMS], 17H04324, 17K08970, 18K08829, 20K09259, and 21H03028), Ministry of Health, Labour, and Welfare (MHLW) of Japan (No. H26-Kakushintekigan-ippan-060), Japan Agency for Medical Research and Development (AMED; Nos. JP19ek0610011 and JP19dk0307071), Smoking Research Foundation (Tokyo, Japan), Japan Research Foundation for Clinical Pharmacology (JRFCP), and Asahi Kasei Pharma Open Innovation. The article processing charge was funded by the Japan Society for the Promotion of Science (JSPS) KAKENHI.

Institutional Review Board Statement

The study was conducted in accordance with the Declaration of Helsinki and approved by the Institutional Review Board (or Ethics Committee) of The Cancer Institute Hospital (protocol code: 2015-1063, date of approval: 25 November 2015), Juntendo University School of Medicine (protocol code: 2015053, date of approval: 18 September 2015), and Tokyo Metropolitan Institute of Medical Science (protocol code: 21–27, date of approval: 31 March 2021).

Informed Consent Statement

Informed consent was obtained from all subjects involved in the study.

Data Availability Statement

The data that are presented in this study are available upon request from the corresponding author.

Acknowledgments

We thank Michael Arends for editing the manuscript. We are grateful to the volunteers for their participation in the study and to the anesthesiologists and surgeons for collecting the clinical data.

Conflicts of Interest

Kazutaka Ikeda has received support from Asahi Kasei Pharma Corporation and SBI Pharmaceuticals Co. Ltd., and speaker’s and consultant’s fees from MSD K.K., VistaGen Therapeutics, Inc., Atheneum Partners Otsuka Pharmaceutical Co. Ltd., Taisho Pharmaceutical Co. Ltd., Eisai, Daiichi-Sankyo, Inc., Sumitomo Pharma, Japan Tobacco, Inc., EA Pharma Co. Ltd., and Nippon Chemiphar. The authors declare no other conflict of interest. The funders had no role in the design of the study; in the collection, analyses, or interpretation of data; in writing the manuscript; or in the decision to publish the results.

References

  1. Gan, T.J.; Belani, K.G.; Bergese, S.; Chung, F.; Diemunsch, P.; Habib, A.S.; Jin, Z.; Kovac, A.L.; Meyer, T.A.; Urman, R.D.; et al. Fourth consensus guidelines for the management of postoperative nausea and vomiting. Anesth. Analg. 2020, 131, 411–448. [Google Scholar] [CrossRef]
  2. Apfel, C.C.; Laara, E.; Koivuranta, M.; Greim, C.A.; Roewer, N. A simplified risk score for predicting postoperative nausea and vomiting: Conclusions from cross-validations between two centers. Anesthesiology 1999, 91, 693–700. [Google Scholar] [CrossRef]
  3. Gan, T.J.; Diemunsch, P.; Habib, A.S.; Kovac, A.; Kranke, P.; Meyer, T.A.; Watcha, M.; Chung, F.; Angus, S.; Apfel, C.C.; et al. Consensus guidelines for the management of postoperative nausea and vomiting. Anesth. Analg. 2014, 118, 85–113. [Google Scholar] [CrossRef]
  4. Parra-Sanchez, I.; Abdallah, R.; You, J.; Fu, A.Z.; Grady, M.; Cummings, K., 3rd; Apfel, C.; Sessler, D.I. A time-motion economic analysis of postoperative nausea and vomiting in ambulatory surgery. Can. J. Anaesth. 2012, 59, 366–375. [Google Scholar] [CrossRef]
  5. Watcha, M.F.; White, P.F. Postoperative nausea and vomiting: Its etiology, treatment, and prevention. Anesthesiology 1992, 77, 162–184. [Google Scholar] [CrossRef]
  6. Palazzo, M.G.; Strunin, L. Anaesthesia and emesis: I. Etiology. Can. Anaesth. Soc. J. 1984, 31, 178–187. [Google Scholar] [CrossRef]
  7. Camu, F.; Lauwers, M.H.; Verbessem, D. Incidence and aetiology of postoperative nausea and vomiting. Eur. J. Anaesthesiol. Suppl. 1992, 6, 25–31. [Google Scholar]
  8. Apfel, C.C.; Heidrich, F.M.; Jukar-Rao, S.; Jalota, L.; Hornuss, C.; Whelan, R.P.; Zhang, K.; Cakmakkaya, O.S. Evidence-based analysis of risk factors for postoperative nausea and vomiting. Br. J. Anaesth. 2012, 109, 742–753. [Google Scholar] [CrossRef]
  9. Gan, T.J.; Meyer, T.; Apfel, C.C.; Chung, F.; Davis, P.J.; Eubanks, S.; Kovac, A.; Philip, B.K.; Sessler, D.I.; Temo, J.; et al. Consensus guidelines for managing postoperative nausea and vomiting. Anesth. Analg. 2003, 97, 62–71. [Google Scholar] [CrossRef]
  10. Morino, R.; Ozaki, M.; Nagata, O.; Yokota, M. Incidence of and risk factors for postoperative nausea and vomiting at a Japanese Cancer Center: First large-scale study in Japan. J. Anesth. 2013, 27, 18–24. [Google Scholar] [CrossRef]
  11. Klenke, S.; Frey, U.H. Genetic variability in postoperative nausea and vomiting: A systematic review. Eur. J. Anaesthesiol. 2020, 37, 959–968. [Google Scholar] [CrossRef]
  12. Janicki, P.K.; Sugino, S. Genetic factors associated with pharmacotherapy and background sensitivity to postoperative and chemotherapy-induced nausea and vomiting. Exp. Brain Res. 2014, 232, 2613–2625. [Google Scholar] [CrossRef]
  13. Lopez-Morales, P.; Flores-Funes, D.; Sanchez-Migallon, E.G.; Liron-Ruiz, R.J.; Aguayo-Albasini, J.L. Genetic factors associated with postoperative nausea and vomiting: A systematic review. J. Gastrointest. Surg. 2018, 22, 1645–1651. [Google Scholar] [CrossRef]
  14. Klenke, S.; de Vries, G.J.; Schiefer, L.; Seyffert, N.; Bachmann, H.S.; Peters, J.; Frey, U.H. Genetic contribution to PONV risk. Anaesth. Crit. Care Pain Med. 2020, 39, 45–51. [Google Scholar] [CrossRef]
  15. Joy Lin, Y.M.; Hsu, C.D.; Hsieh, H.Y.; Tseng, C.C.; Sun, H.S. Sequence variants of the HTR3A gene contribute to the genetic prediction of postoperative nausea in Taiwan. J. Hum. Genet. 2014, 59, 655–660. [Google Scholar] [CrossRef]
  16. Rueffert, H.; Thieme, V.; Wallenborn, J.; Lemnitz, N.; Bergmann, A.; Rudlof, K.; Wehner, M.; Olthoff, D.; Kaisers, U.X. Do variations in the 5-HT3A and 5-HT3B serotonin receptor genes (HTR3A and HTR3B) influence the occurrence of postoperative vomiting? Anesth. Analg. 2009, 109, 1442–1447. [Google Scholar] [CrossRef]
  17. Ma, X.X.; Chen, Q.X.; Wu, S.J.; Hu, Y.; Fang, X.M. Polymorphisms of the HTR3B gene are associated with post-surgery emesis in a Chinese Han population. J. Clin. Pharm. Ther. 2013, 38, 150–155. [Google Scholar] [CrossRef]
  18. Kim, M.S.; Lee, J.R.; Choi, E.M.; Kim, E.H.; Choi, S.H. Association of 5-HT3B receptor gene polymorphisms with the efficacy of ondansetron for postoperative nausea and vomiting. Yonsei Med. J. 2015, 56, 1415–1420. [Google Scholar] [CrossRef]
  19. Frey, U.H.; Schnee, C.; Achilles, M.; Silvanus, M.T.; Esser, J.; Peters, J. Postoperative nausea and vomiting: The role of the dopamine D2 receptor TaqIA polymorphism. Eur. J. Anaesthesiol. 2016, 33, 84–89. [Google Scholar] [CrossRef]
  20. Nakagawa, M.; Kuri, M.; Kambara, N.; Tanigami, H.; Tanaka, H.; Kishi, Y.; Hamajima, N. Dopamine D2 receptor Taq IA polymorphism is associated with postoperative nausea and vomiting. J. Anesth. 2008, 22, 397–403. [Google Scholar] [CrossRef]
  21. Lee, S.H.; Kim, J.D.; Park, S.A.; Oh, C.S.; Kim, S.H. Effects of μ-opioid receptor gene polymorphism on postoperative nausea and vomiting in patients undergoing general anesthesia with remifentanil: Double blinded randomized trial. J. Korean Med. Sci. 2015, 30, 651–657. [Google Scholar] [CrossRef]
  22. Sugino, S.; Hayase, T.; Higuchi, M.; Saito, K.; Moriya, H.; Kumeta, Y.; Kurosawa, N.; Namiki, A.; Janicki, P.K. Association of μ-opioid receptor gene (OPRM1) haplotypes with postoperative nausea and vomiting. Exp. Brain Res. 2014, 232, 2627–2635. [Google Scholar] [CrossRef]
  23. Hayase, T.; Sugino, S.; Moriya, H.; Yamakage, M. TACR1 gene polymorphism and sex differences in postoperative nausea and vomiting. Anaesthesia 2015, 70, 1148–1159. [Google Scholar] [CrossRef] [PubMed]
  24. Wesmiller, S.W.; Bender, C.M.; Sereika, S.M.; Ahrendt, G.; Bonaventura, M.; Bovbjerg, D.H.; Conley, Y. Association between serotonin transport polymorphisms and postdischarge nausea and vomiting in women following breast cancer surgery. Oncol. Nurs. Forum 2014, 41, 195–202. [Google Scholar] [CrossRef]
  25. Choi, E.M.; Lee, M.G.; Lee, S.H.; Choi, K.W.; Choi, S.H. Association of ABCB1 polymorphisms with the efficacy of ondansetron for postoperative nausea and vomiting. Anaesthesia 2010, 65, 996–1000. [Google Scholar] [CrossRef] [PubMed]
  26. Farhat, K.; Iqbal, J.; Waheed, A.; Mansoor, Q.; Ismail, M.; Pasha, A.K. Association of anti-emetic efficacy of ondansetron with G2677T polymorphism in a drug transporter gene ABCB1 in Pakistani population. J. Coll. Physicians Surg. Pak. 2015, 25, 486–490. [Google Scholar] [PubMed]
  27. Dzambazovska-Trajkovska, V.; Nojkov, J.; Kartalov, A.; Kuzmanovska, B.; Spiroska, T.; Seljmani, R.; Trajkovski, G.; Matevska-Geshkovska, N.; Dimovski, A. Association of single-nucleotide polymorhism C3435T in the ABCB1 gene with opioid sensitivity in treatment of postoperative pain. Pril 2016, 37, 73–80. [Google Scholar] [CrossRef]
  28. Balyan, R.; Zhang, X.; Chidambaran, V.; Martin, L.J.; Mizuno, T.; Fukuda, T.; Vinks, A.A.; Sadhasivam, S. OCT1 genetic variants are associated with postoperative morphine-related adverse effects in children. Pharmacogenomics 2017, 18, 621–629. [Google Scholar] [CrossRef] [PubMed]
  29. Candiotti, K.A.; Birnbach, D.J.; Lubarsky, D.A.; Nhuch, F.; Kamat, A.; Koch, W.H.; Nikoloff, M.; Wu, L.; Andrews, D. The impact of pharmacogenomics on postoperative nausea and vomiting: Do CYP2D6 allele copy number and polymorphisms affect the success or failure of ondansetron prophylaxis? Anesthesiology 2005, 102, 543–549. [Google Scholar] [CrossRef] [PubMed]
  30. Janicki, P.K.; Schuler, H.G.; Jarzembowski, T.M.; Rossi, M., 2nd. Prevention of postoperative nausea and vomiting with granisetron and dolasetron in relation to CYP2D6 genotype. Anesth. Analg. 2006, 102, 1127–1133. [Google Scholar] [CrossRef]
  31. Wesmiller, S.W.; Henker, R.A.; Sereika, S.M.; Donovan, H.S.; Meng, L.; Gruen, G.S.; Tarkin, I.S.; Conley, Y.P. The association of CYP2D6 genotype and postoperative nausea and vomiting in orthopedic trauma patients. Biol. Res. Nurs. 2013, 15, 382–389. [Google Scholar] [CrossRef]
  32. Janicki, P.K.; Vealey, R.; Liu, J.; Escajeda, J.; Postula, M.; Welker, K. Genome-wide association study using pooled DNA to identify candidate markers mediating susceptibility to postoperative nausea and vomiting. Anesthesiology 2011, 115, 54–64. [Google Scholar] [CrossRef]
  33. Klenke, S.; de Vries, G.J.; Schiefer, L.; Seyffert, N.; Bachmann, H.S.; Peters, J.; Frey, U.H. CHRM3 rs2165870 polymorphism is independently associated with postoperative nausea and vomiting, but combined prophylaxis is effective. Br. J. Anaesth. 2018, 121, 58–65. [Google Scholar] [CrossRef] [PubMed]
  34. Ahlstrom, S.E.; Bergman, P.H.; Jokela, R.M.; Olkkola, K.T.; Kaunisto, M.A.; Kalso, E.A. Clinical and genetic factors associated with post-operative nausea and vomiting after propofol anaesthesia. Acta Anaesthesiol. Scand. 2023, 67, 1018–1027. [Google Scholar] [CrossRef] [PubMed]
  35. Sugino, S.; Konno, D.; Kawai, Y.; Nagasaki, M.; Endo, Y.; Hayase, T.; Yamazaki-Higuchi, M.; Kumeta, Y.; Tachibana, S.; Saito, K.; et al. Long non-coding RNA MIR4300HG polymorphisms are associated with postoperative nausea and vomiting: A genome-wide association study. Hum. Genom. 2020, 14, 31. [Google Scholar] [CrossRef] [PubMed]
  36. Watanabe, K.; Taskesen, E.; van Bochoven, A.; Posthuma, D. Functional mapping and annotation of genetic associations with FUMA. Nat. Commun. 2017, 8, 1826. [Google Scholar] [CrossRef]
  37. Yeo, I.; Johnson, R. A new family of power transformations to improve normality or symmetry. Biometrika 2000, 87, 954–959. [Google Scholar] [CrossRef]
  38. Purcell, S.; Neale, B.; Todd-Brown, K.; Thomas, L.; Ferreira, M.A.; Bender, D.; Maller, J.; Sklar, P.; de Bakker, P.I.; Daly, M.J.; et al. PLINK: A tool set for whole-genome association and population-based linkage analyses. Am. J. Hum. Genet. 2007, 81, 559–575. [Google Scholar] [CrossRef]
  39. Barrett, J.C.; Fry, B.; Maller, J.; Daly, M.J. Haploview: Analysis and visualization of LD and haplotype maps. Bioinformatics 2005, 21, 263–265. [Google Scholar] [CrossRef]
  40. Faul, F.; Erdfelder, E.; Lang, A.G.; Buchner, A. G*Power 3: A flexible statistical power analysis program for the social, behavioral, and biomedical sciences. Behav. Res. Methods 2007, 39, 175–191. [Google Scholar] [CrossRef]
  41. Ward, L.D.; Kellis, M. HaploReg: A resource for exploring chromatin states, conservation, and regulatory motif alterations within sets of genetically linked variants. Nucleic Acids Res. 2012, 40, D930–D934. [Google Scholar] [CrossRef]
  42. Xu, Z.; Taylor, J.A. SNPinfo: Integrating GWAS and candidate gene information into functional SNP selection for genetic association studies. Nucleic Acids Res. 2009, 37, W600–W605. [Google Scholar] [CrossRef]
  43. GTEx Consortium. The Genotype-Tissue Expression (GTEx) project. Nat. Genet. 2013, 45, 580–585. [Google Scholar] [CrossRef] [PubMed]
  44. Sakaue, S.; Kanai, M.; Tanigawa, Y.; Karjalainen, J.; Kurki, M.; Koshiba, S.; Narita, A.; Konuma, T.; Yamamoto, K.; Akiyama, M.; et al. A cross-population atlas of genetic associations for 220 human phenotypes. Nat. Genet. 2021, 53, 1415–1424. [Google Scholar] [CrossRef] [PubMed]
  45. Smirnov, A.V.; Kontsevaya, G.V.; Feofanova, N.A.; Anisimova, M.V.; Serova, I.A.; Gerlinskaya, L.A.; Battulin, N.R.; Moshkin, M.P.; Serov, O.L. Unexpected phenotypic effects of a transgene integration causing a knockout of the endogenous Contactin-5 gene in mice. Transgenic Res. 2018, 27, 1–13. [Google Scholar] [CrossRef]
  46. Kalia, L.V.; Lang, A.E. Parkinson’s disease. Lancet 2015, 386, 896–912. [Google Scholar] [CrossRef] [PubMed]
  47. Moon, Y.E. Postoperative nausea and vomiting. Korean J. Anesthesiol. 2014, 67, 164–170. [Google Scholar] [CrossRef] [PubMed]
  48. Pickrell, J.K.; Berisa, T.; Liu, J.Z.; Segurel, L.; Tung, J.Y.; Hinds, D.A. Detection and interpretation of shared genetic influences on 42 human traits. Nat. Genet. 2016, 48, 709–717. [Google Scholar] [CrossRef]
  49. Folmer, D.E.; Oude Elferink, R.P.J.; Paulusma, C.C. P4 ATPases: Lipid flippases and their role in disease. Biochim. Biophys. Acta 2009, 1791, 628–635. [Google Scholar] [CrossRef]
  50. Benyamin, R.; Trescot, A.M.; Datta, S.; Buenaventura, R.; Adlaka, R.; Sehgal, N.; Glaser, S.E.; Vallejo, R. Opioid complications and side effects. Pain Physician 2008, 11 (Suppl. 2), S105–S120. [Google Scholar] [CrossRef]
Figure 1. Manhattan plot as a result of the GWAS for the frequency of nausea in all patients. (a) Plot of the results from the additive model. (b) Plot of the results from the dominant model. (c) Plot of the results from the recessive model. The highest part of each dot represents the calculated value. The red line indicates the threshold for a significant association.
Cancers 15 04729 g001
Figure 2. Manhattan plot as a result of the GWAS for the frequency of nausea in patients who received propofol. (a) Plot of the results from the additive model. (b) Plot of the results from the dominant model. (c) Plot of the results from the recessive model. The highest part of each dot represents the calculated value. The red line indicates the threshold for a significant association.
Cancers 15 04729 g002
Figure 3. Manhattan plot as a result of the GWAS for vomiting in patients who received propofol. (a) Plot of the results from the trend model. (b) Plot of the results from the dominant model. (c) Plot of the results from the recessive model. The highest point of each dot represents the calculated value. The red line indicates the threshold for a significant association.
Cancers 15 04729 g003
Table 1. Demographic and clinical data of patient subjects for the GWAS.
Demographic Data:nMinimumMaximumMeanSDMedian
Gender
 male432
 female374
Age [years]806239358.80 13.25 60.00
Height [cm]806140.8184.9162.39 8.16 161.90
Weight [kg]80631.5109.159.01 11.15 57.65
Body mass index (BMI) [kg/m2]80614.46 39.05 22.29 3.39 22.02
History of smoking806
 absence453
 presence353
Frequency of alcohol drinking per week806072.65 7.00 1.00
History of motion sickness806
 absence495
 presence311
History of PONV806
 absence722
 presence84
Surgery and clinical data for postoperative period:nMinimumMaximumMeanSDMedian
Duration of anaesthesia [min]806301050258.62 1050.00 214.50
Duration of surgery [min]8064977203.34 977.00 163.00
Type of anesthesia806
 TIVA (propofol)442
 inhalational anesthesia (desflurane)364
Total dose of remifentanil [μg]806024,3003135.61 24,300.00 2500.00
Total dose of fentanyl [μg]8060800198.26 800.00 200.00
Postoperative administration of narcotic drugs806
 absence427
 presence379
Postoperative administration of opioids including pentazocine806
 absence340
 presence466
Experience of pain806
 absence250
 presence556
Frequency of pain8060152.90 15.00 2.00
PONV:nMinimumMaximumMeanSDMedian
Nausea806
 absence541
 presence265
Frequency of nausea8060100.83 10.00 0.00
Vomiting806
 absence657
 presence149
PONV806
 absence526
 presence280
Table 2. Top 20 candidate SNPs selected from the GWAS for the frequency of nausea in all patients.
ModelRankCHRSNPPositionpRelated Gene Genotype (Patients)Genotype (Mean)
A/A A/B B/BA/A A/B B/B
Additive121rs2776262369401580.00000008533 (LOC100506403)2957094.1450.3130.556
Additive219rs12609817538591820.0000001055 41096932.8820.4860.531
Additive37rs921634478728450.0000001393PKD1L191456522.2930.4790.525
Additive45rs15871761748511900.0000002228 51726282.7610.5520.515
Additive55rs100614081172927760.0000005159 61096912.4460.610.508
Additive65rs100717771172868310.000000524 61096902.4460.610.509
Additive78rs6558049280930410.0000006488 51096922.7470.5080.525
Additive816rs7192373900321490.0000006522DEF82587463.6120.5880.524
Additive97rs171737931535233450.0000008597 21116913.7660.7070.499
Additive105rs131590911480673370.0000008984 21007043.8080.6380.513
Additive115rs174143261172972580.000001209 2687363.6460.7080.512
Additive125rs115765285656380.000001661 211935921.5720.5430.497
Additive132rs31129761804404370.000001666ZNF385B21186863.4490.5950.518
Additive144exm226581750231120.000001687 2647403.8080.570.525
Additive144rs1093761550231120.000001687 2647403.8080.570.525
Additive1612exm-rs110578301253070530.000001762SCARB131206832.9860.5230.528
Additive179exm-rs7551091006962030.000001821HEMGN131766171.7130.5420.51
Additive189rs14756961006913970.000001857HEMGN131756181.7130.540.511
Additive1919rs1108495026573970.000002102GNG721047003.7660.5030.532
Additive2012rs2137547262618730.000002264 3917123.0180.6030.517
Dominant111exm22745241002215800.00000005555 *CNTN504801NA2.9130.52
Dominant21exm17628082208239720.0000005544MARK102802NA3.7660.53
Dominant38rs10087234687353130.000001101 07799NA2.2050.522
Dominant419exm1473939429379530.000001221CXCL171779802.640.519
Dominant53rs16446487490120.000001845 02803NA3.5530.53
Dominant63rs24105587387900.000001855 02804NA3.5530.529
Dominant63rs1249749887514900.000001855 02804NA3.5530.529
Dominant63rs1704945987519840.000001855 02804NA3.5530.529
Dominant915rs16948440652551680.000002007 02790NA3.6120.524
Dominant917rs22284371459810.000002007 1213733110.4380.3840.759
Dominant112rs2075225710630660.00000221 1063733260.4510.3920.727
Dominant1217exm128631771637390.000002647CLDN71213743110.4380.3850.756
Dominant1315rs34636936652972610.000002663MTFMT02804NA3.6120.529
Dominant1422rs1210829203088000.000003367 212115690.5230.8180.437
Dominant154rs22042061497138720.000003862 2073742250.410.4710.761
Dominant1617rs22283571341290.000004137DVL21203623240.4810.3650.749
Dominant1717rs22283771325560.000004902DVL21183633250.4770.3680.746
Dominant1817rs73966971223770.000005338DLG41183623260.4770.3690.744
Dominant1922exm2010161384744060.000006687SLC16A802804NA3.2780.53
Dominant204rs117345181522131130.000008271 1073773220.7050.6420.356
Recessive121rs2776262369401580.00000007573 * (LOC100506403)2957094.1450.3130.556
Recessive219rs12609817538591820.00000009569 41096932.8820.4860.531
Recessive37rs921634478728450.0000001274PKD1L191456522.2930.4790.525
Recessive45rs15871761748511900.0000002107 51726282.7610.5520.515
Recessive58rs6558049280930410.0000006248 51096922.7470.5080.525
Recessive65rs100614081172927760.0000006556 61096912.4460.610.508
Recessive716rs7192373900321490.0000006607DEF82587463.6120.5880.524
Recessive85rs100717771172868310.0000006649 61096902.4460.610.509
Recessive95rs131590911480673370.000001017 21007043.8080.6380.513
Recessive107rs171737931535233450.00000114 21116913.7660.7070.499
Recessive115rs174143261172972580.000001587 2687363.6460.7080.512
Recessive124exm226581750231120.000001705 2647403.8080.570.525
Recessive124rs1093761550231120.000001705 2647403.8080.570.525
Recessive142rs31129761804404370.00000171ZNF385B21186863.4490.5950.518
Recessive1512exm-rs110578301253070530.00000185SCARB131206832.9860.5230.528
Recessive1610rs13422731119733390.00000187MXI1121596351.8150.410.544
Recessive175rs115765285656380.000001997 211935921.5720.5430.497
Recessive1819rs1108495026573970.00000201GNG721047003.7660.5030.532
Recessive195rs25915801654066070.000002074 121656291.8010.4380.538
Recessive209rs10115047966312870.000002086 252385431.4570.470.523
Model, the genetic model in which candidate SNPs were selected by the GWAS; CHR, chromosome number; Position, chromosomal position (bp); *, significant after Bonferroni correction for multiple comparisons (p < 7.812 × 10⁻⁸); Related gene, the nearest gene from the SNP site; A/A, homozygote for the minor allele for each SNP; A/B, heterozygote for each SNP; B/B, homozygote for the major allele for each SNP; NA, not available.
Table 3. Top 20 candidate SNPs selected from the GWAS for the frequency of nausea in patients who received propofol.
ModelRankCHRSNPPositionpRelated Gene Genotype (Patients)Genotype (Mean)
A/A A/B B/BA/A A/B B/B
Additive117rs7212072113105000.00000003919 *SHISA6131582712.020.5230.504
Additive221rs2776262369401580.00000005028 *(LOC100506403)2453954.1450.3420.562
Additive316rs1244414360719100.0000000777 *RBFOX1841971610.9810.5720.312
Additive410rs2499891666804440.000000254 211732481.4990.5860.454
Additive511rs7110244959105070.0000003371MAML23613783.2620.710.509
Additive617rs1513743113062680.000000375SHISA6141592691.8750.520.508
Additive79rs1937955257215000.0000004509 2603803.8080.5590.538
Additive817rs4293419113060430.0000005146SHISA63963433.4130.6460.505
Additive917rs1034899113066600.000000536SHISA63963423.4130.6460.507
Additive1010rs7911209667268650.0000006068 201762451.5010.5730.467
Additive1110rs10733810667236800.0000006447 201682541.5010.5950.455
Additive128rs17351761460742810.0000006883 181642591.7330.4430.547
Additive1316rs11649132170327870.0000006937 151382891.5870.6010.48
Additive1414rs1256520657371930.0000007361 2813594.1620.6060.524
Additive1414rs1256526657399050.0000007361 2813594.1620.6060.524
Additive1616rs7192373900321490.0000008101DEF82294113.6120.6770.532
Additive178rs2322976281061410.0000009019 2573833.8080.6010.532
Additive188rs6558049280930410.0000009166 2593813.8080.580.534
Additive1913rs8169581085228950.0000009365 14963311.8780.4660.527
Additive208exm7341311460767080.0000009716COMMD5181642601.6870.4480.545
Additive208rs12098791460767080.0000009716COMMD5181642601.6870.4480.545
Dominant13rs13100791496410490.0000009768BSN04438NA2.6290.536
Dominant13exm315855497379540.0000009768RNF12304438NA2.6290.536
Dominant13exm316496498694550.0000009768TRAIP04438NA2.6290.536
Dominant412exm10469261233405420.000001253HIP1R02440NA3.8080.541
Dominant511rs7933966328755970.000001333PRRG4942241240.5010.3790.915
Dominant511exm-rs10767971328956640.000001333 942241240.5010.3790.915
Dominant511rs10767971328956640.000001333 942241240.5010.3790.915
Dominant85rs2521101413395220.000001858 08433NA2.2090.523
Dominant95rs34221525687981180.000001959OCLN07435NA2.1650.529
Dominant1011rs4755454329032630.000002224 962251210.490.3920.911
Dominant119rs17725257162161020.000002292 06436NA2.4270.53
Dominant123rs24105587387900.000002929 02440NA3.5530.542
Dominant123rs16446487490120.000002929 02440NA3.5530.542
Dominant123rs1249749887514900.000002929 02440NA3.5530.542
Dominant123rs1704945987519840.000002929 02440NA3.5530.542
Dominant161rs198412119004370.000003433CLCN6,NPPA-AS104438NA2.9640.533
Dominant1722exm2010161384744060.000003506SLC16A802440NA3.2780.543
Dominant1817rs17780388306063010.000003661RHBDL305437NA2.6710.531
Dominant1911rs197697328344160.000003879 922241260.5030.3830.901
Dominant207rs19824361344706320.000003965CALD1101283040.4140.9180.407
Recessive117rs7212072113105000.00000003412 *SHISA6131582712.020.5230.504
Recessive221rs2776262369401580.00000004121 *(LOC100506403)2453954.1450.3420.562
Recessive38rs17351761460742810.0000001881 181642591.7330.4430.547
Recessive410rs2499891666804440.0000002799 211732481.4990.5860.454
Recessive58exm7341311460767080.0000002805COMMD5181642601.6870.4480.545
Recessive58rs12098791460767080.0000002805COMMD5181642601.6870.4480.545
Recessive717rs1513743113062680.0000003181SHISA6141592691.8750.520.508
Recessive89rs1937955257215000.0000004615 2603803.8080.5590.538
Recessive911rs7110244959105070.0000004699MAML23613783.2620.710.509
Recessive1013rs8169581085228950.000000523 14963311.8780.4660.527
Recessive1110rs7911209667268650.0000005299 201762451.5010.5730.467
Recessive1217rs4293419113060430.0000007621SHISA63963433.4130.6460.505
Recessive1322rs8142156196927510.0000007685 4643742.5990.3670.566
Recessive1322rs9618670196943330.0000007685 4633752.5990.3730.564
Recessive1514rs1256520657371930.0000007818 2813594.1620.6060.524
Recessive1514rs1256526657399050.0000007818 2813594.1620.6060.524
Recessive1710rs10733810667236800.0000007878 201682541.5010.5950.455
Recessive1817rs1034899113066600.0000007904SHISA63963423.4130.6460.507
Recessive1916rs7192373900321490.0000008464DEF82294113.6120.6770.532
Recessive208rs6558049280930410.0000009534 2593813.8080.580.534
Recessive208rs2322976281061410.0000009534 2573833.8080.6010.532
Model, the genetic model in which candidate SNPs were selected by the GWAS; CHR, chromosome number; Position, chromosomal position (bp); *, significant after Bonferroni correction of multiple comparisons (p < 7.812 × 10⁻⁸); Related gene, the nearest gene from the SNP site; A/A, homozygote for the minor allele in each SNP; A/B, heterozygote in each SNP; B/B, homozygote for the major allele in each SNP; NA, not available.
Table 4. Top 20 candidate SNPs selected from the GWAS for vomiting in patients who received propofol.
ModelRankCHRSNPPositionpRelated Gene Genotype
(Vomiting +)
Genotype
(Vomiting −)
A/A A/B B/BA/A A/B B/B
Trend119exm140185918066670.00000002972 *ATP8B343162144300
Trend213rs1752136487262190.00000006384 *(LOC105370198)02077014331
Trend31rs6675501246726410.000003994GRHL342411473165107
Trend416rs16954219809257810.000006147 44350483258
Trend517rs16944600112450990.000006816SHISA64237027167151
Trend614rs10438059330262710.00001081AKAP613483616123205
Trend716rs12928123611782790.00001632 53359560280
Trend716rs9929283611823420.00001632 53359560280
Trend99rs10867734839331980.00001865 21481016329
Trend102exm-rs67266391127530970.00002221MERTK31461565132131
Trend1115rs765480356850.00002252SEMA6D7494111106228
Trend129rs78506971310951120.00002275COQ42415438189118
Trend129rs70301211311019190.00002275 2415438189118
Trend149rs12684445988052600.00002621 11473914117214
Trend157rs12704714939307130.00002643 32392642164138
Trend1616rs12445491611459470.00002755 83059666273
Trend179rs3067721240923550.00002782GSN13264151293
Trend189rs22409601310392500.00002911SWI54375639186118
Trend194rs208643195097910.00003047 42865349293
Trend2014rs17098983328688730.00003088AKAP60207719128198
Dominant119exm140185918066670.0000009938ATP8B343162144300
Dominant217rs16944600112450990.000001015SHISA64237027167151
Dominant313rs1752136487262190.000001177 02077014331
Dominant45rs7715247503185500.000001902 7226831167147
Dominant54rs119468981819265180.000005267 23621265157123
Dominant63rs15245111796420670.000005693PEX5L10533423111211
Dominant75rs622304502798570.000005922 7207027159159
Dominant84rs126424931819330560.00001346 23601464153128
Dominant99rs3808657191278770.00001358 11246147167131
Dominant1018rs809322720784410.00001524 11622434140171
Dominant1116rs16954219809257810.00001919 44350483258
Dominant122exm-rs67266391127530970.00002021MERTK31461565132131
Dominant135rs250216502813580.00002777 4217219152174
Dominant145rs13175573502975170.00002949 5236922161162
Dominant1511rs6245841073447240.00003038 4128112122211
Dominant1615rs765480356850.00003277SEMA6D7494111106228
Dominant1723rs126883091137961710.00003574 0881579199
Dominant181rs12027987852067740.00004063 8315853167125
Dominant195rs12659587502694100.00004483 4217219150176
Dominant209rs9792672230879260.00004684 1492473268
Recessive11rs1195866816782540.00000133 1428555117219
Recessive27rs12704714939307130.000005402 32392642164138
Recessive31rs7345912034496150.00001109PRELP4329257217499
Recessive46rs48974271308109540.00001688 29343338177130
Recessive56rs94926051307963960.00002139 24314227154162
Recessive67rs2904188685040500.00002176 112165496245
Recessive67rs2869745685399770.00002176 112264498243
Recessive81rs6675501246726410.00002366GRHL342411473165107
Recessive91rs8808782034357180.00002728 4330247617297
Recessive104rs16994732387179530.00003138 82762189255
Recessive117rs126982191581456060.0000321PTPRN291870265278
Recessive1210rs7895191702212670.00003529DNA20465141143161
Recessive1210rs12220316702308400.00003529DNA20465141143161
Recessive141rs37669022034783700.00003617 39362265158122
Recessive156rs4395717208262810.00003964CDKAL1759308917482
Recessive166rs4077405208766830.00004018CDKAL1760308817483
Recessive178exm7191031244401740.00004181WDYHV128442538181126
Recessive178rs69992341244401740.00004181WDYHV128442538181126
Recessive178exm7191201244487360.00004181WDYHV128442538181126
Recessive178rs70146781244487360.00004181WDYHV128442538181126
Recessive178exm7191221244488040.00004181WDYHV128442538181126
Recessive178exm7191251244494660.00004181WDYHV128442538181126
Recessive178rs38242501244494660.00004181WDYHV128442538181126
Recessive178rs132692871244536620.00004181WDYHV128442538181126
Recessive178rs78220611244567270.00004181 28442538181126
Model, the genetic model in which candidate SNPs were selected by the GWAS; CHR, chromosome number; Position, chromosomal position (bp); *, significant after Bonferroni correction of multiple comparisons (p < 7.812 × 10⁻⁸); Related gene, the nearest gene from the SNP site; A/A, homozygote for the minor allele for each SNP; A/B, heterozygote for each SNP; B/B, homozygote for the major allele for each SNP.
Table 5. Results of the replication study for the rs45574836 (exm1401859) SNP, selected in the GWAS for vomiting in patients who received propofol.
Phenotype
(+/−)
GWASReplication Study
GenotypepppGenotypeppp
G/GG/AA/A(Trend)(Dominant)(Recessive)G/GG/AA/A(Trend)(Dominant)(Recessive)
Nausea (−)2523920.0014560.0024970.34092365430.10100.064521
Nausea (+)11036327130
Vomiting (−)3004412.972 × 10−8 †9.938 × 10−70.0091672535930.02389 *0.03131 *1
Vomiting (+)623141080
PONV (−)2443710.00035220.0012150.059932345230.04636 *0.02885 *1
PONV (+)11838429150
, significant in GWAS (p < 7.812 × 10⁻⁸); *, significant in replication study (p < 0.05).
Disclaimer/Publisher’s Note: The statements, opinions and data contained in all publications are solely those of the individual author(s) and contributor(s) and not of MDPI and/or the editor(s). MDPI and/or the editor(s) disclaim responsibility for any injury to people or property resulting from any ideas, methods, instructions or products referred to in the content.

