
Serum Metabolite Biomarkers for Pancreatic Tumors: Neuroendocrine and Pancreatic Ductal Adenocarcinomas—A Preliminary Study
 , , , , ,
Abstract
:Simple Summary
Abstract
1. Introduction
2. Materials and Methods
2.1. Patients and Study Design
2.2. Quantification of Serum Metabolites
2.2.1. Chemicals
2.2.2. Sample Preparation
2.2.3. LC-MS Analyses
2.3. Statistical Analysis
3. Results
3.1. Serum Metabolites Concentrations
3.2. Analysis of Metabolic Profiles
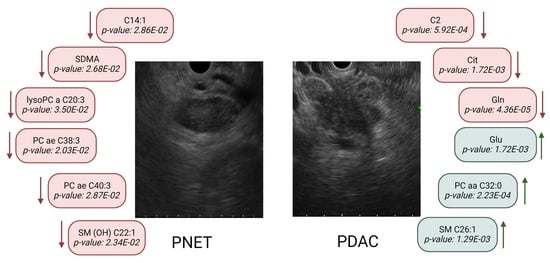
3.2.1. Control vs. PDAC
3.2.2. Control vs. PNET
3.2.3. PNET vs. PDAC
3.3. Metabolic Pathway Analysis of Serum Metabolites
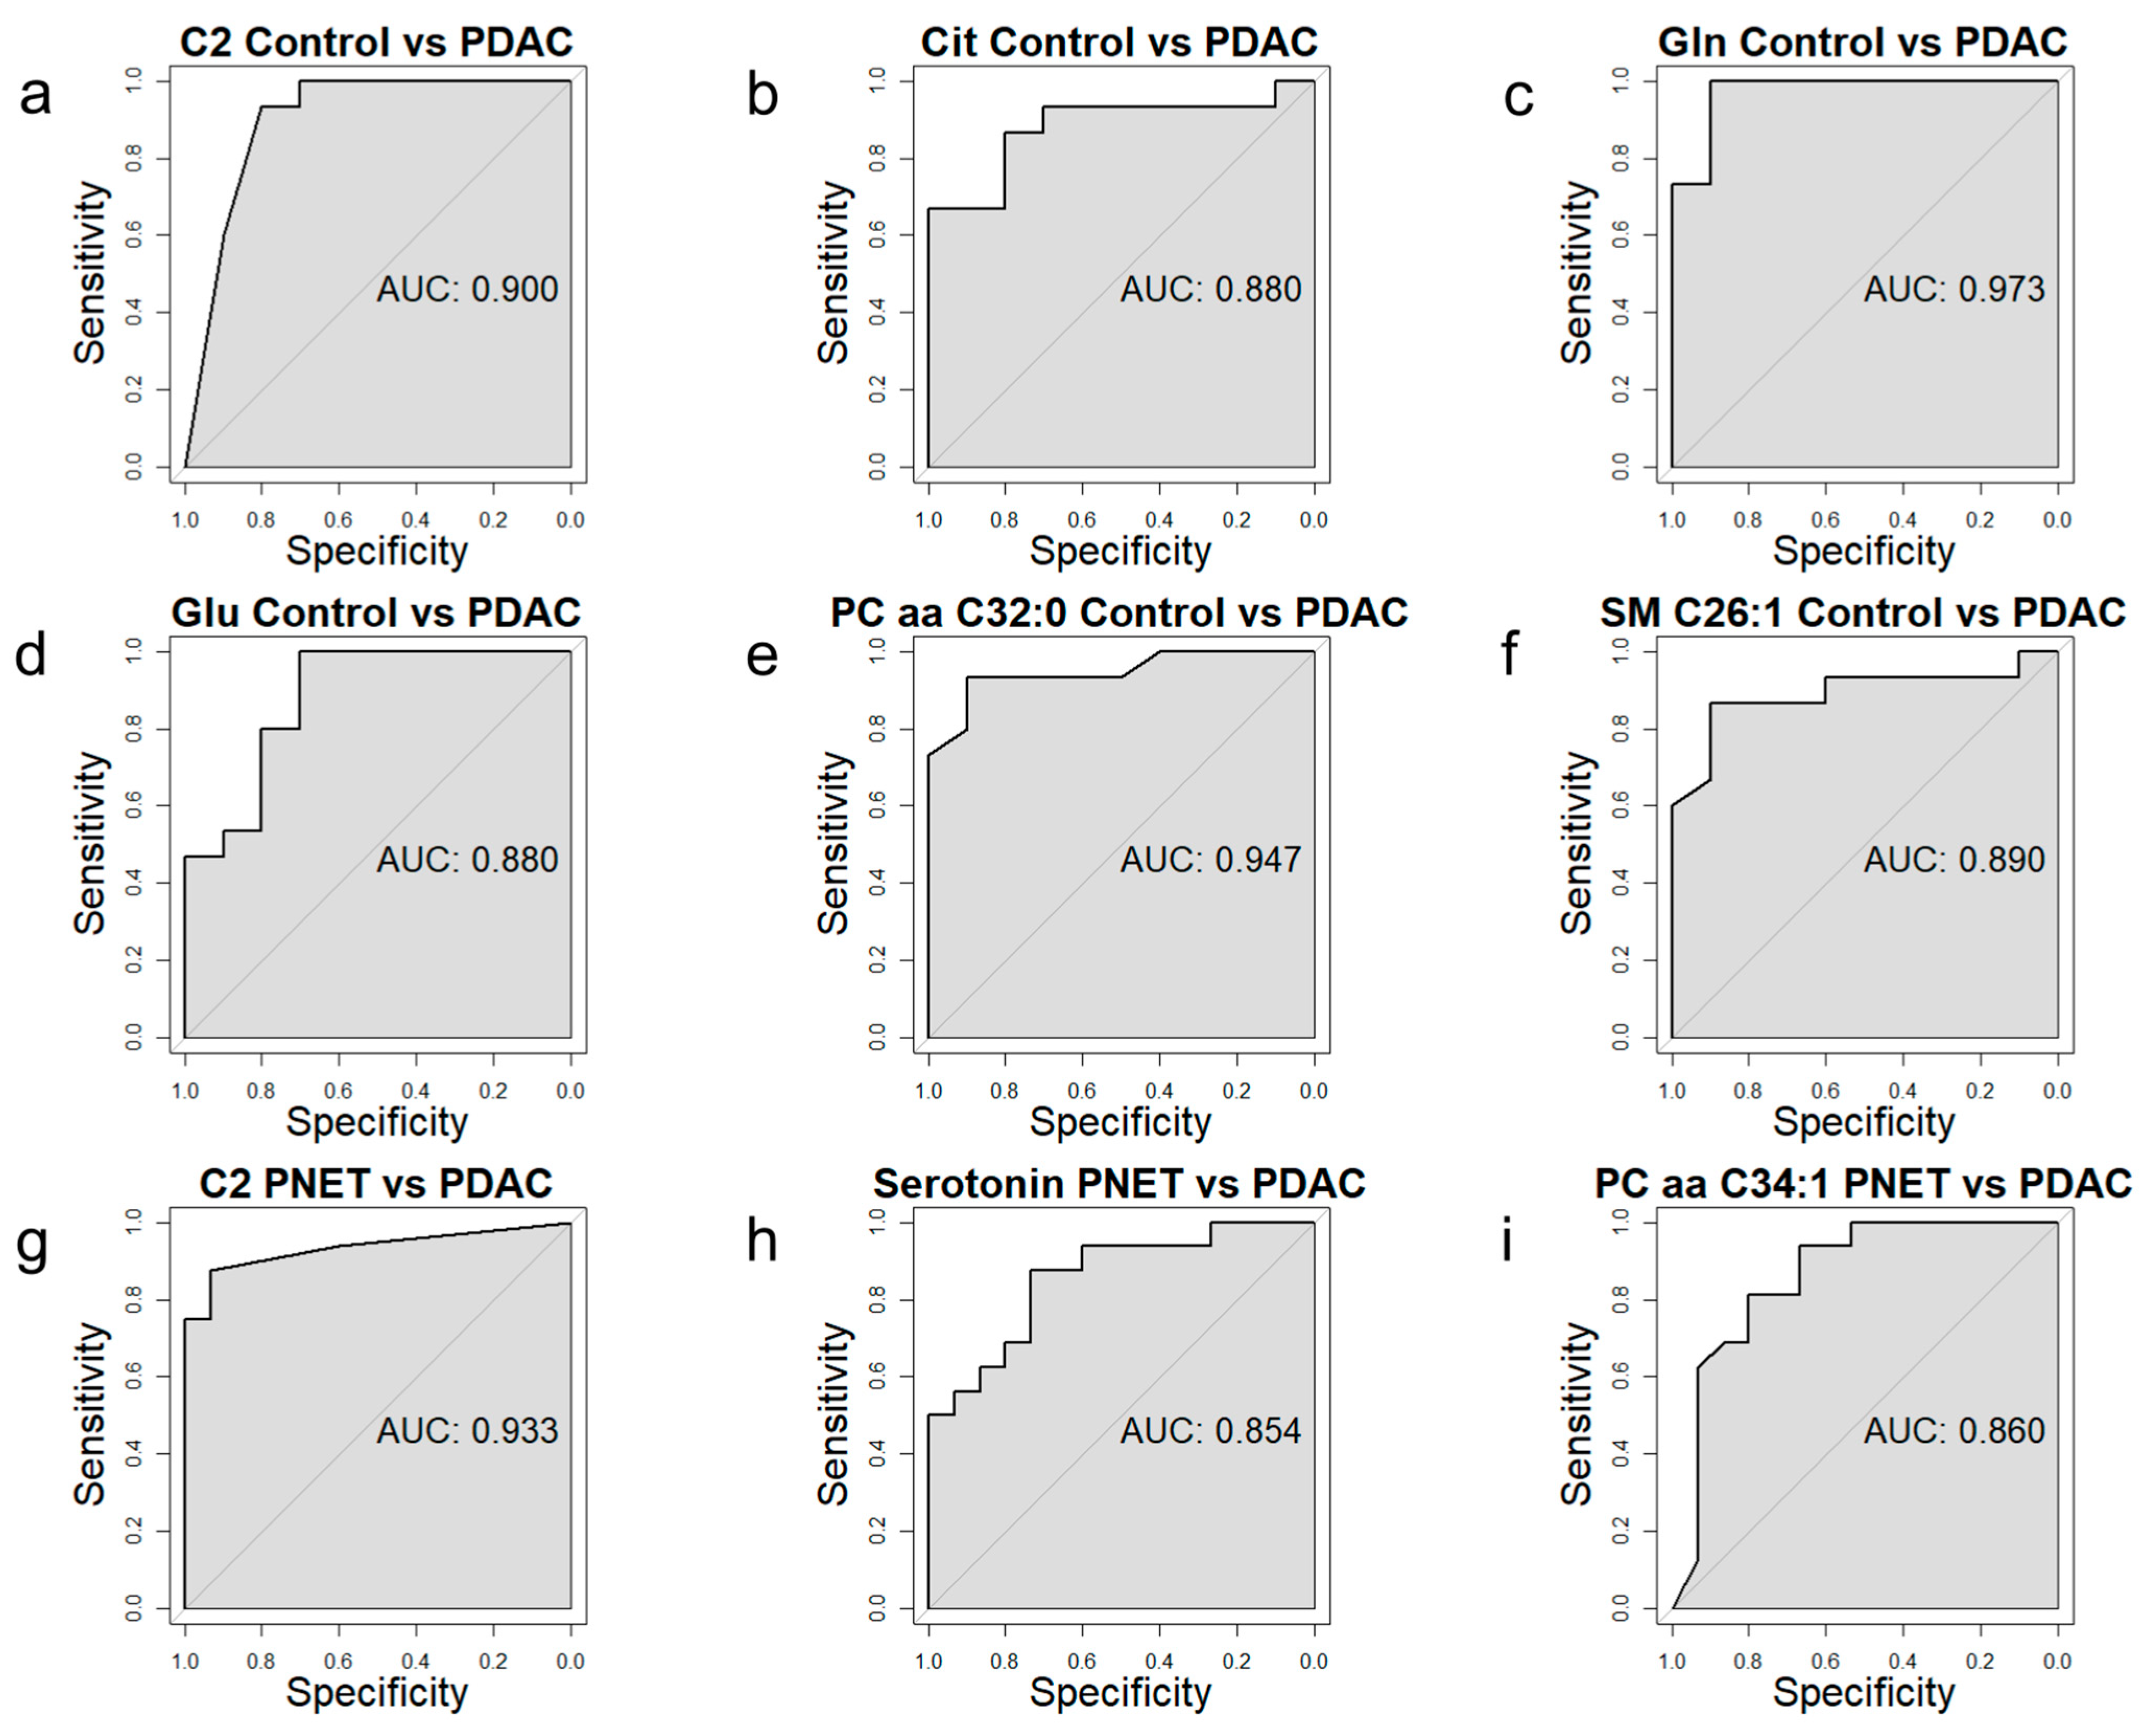
3.4. Receiver Operating Characteristic Curve Analysis for Specific Metabolites
3.5. Correlation Analysis
4. Discussion
5. Conclusions
Supplementary Materials
Author Contributions
Funding
Institutional Review Board Statement
Informed Consent Statement
Data Availability Statement
Acknowledgments
Conflicts of Interest
Abbreviations
| 5-HT | 5-hydroxytryptamine |
| Ala | alanine |
| Asn | asparagine |
| Asp | aspartic acid |
| AUC | area under the curves |
| BD | benign disease |
| C14:1 | tetradecenoylcarnitine |
| C14:2 | tetradecadienylcarnitine |
| C14:2-OH | hydroxytetradecadienylcarnitine |
| C16:2-OH | hydroxyhexadecadienoylcarnitine |
| C16-OH | hydroxyhexadecanoylcarnitine |
| C18:1 | octadecenoylcarnitine |
| C18:2 | octadecadienylcarnitine |
| C2 | acetylcarnitine |
| C3-DC (C4-OH) | malonylcarnitine |
| CgA | chromogranin A |
| Cit | citrulline |
| DES | diffuse endocrine system |
| FIA | flow-injection analysis |
| Gln | glutamine |
| Glu | glutamic acid |
| Gly | glycine |
| H1 | hexose |
| HILIC | hydrophilic interaction liquid chromatography |
| Ile | isoleucine |
| IS | internal standard |
| LC-MS | liquid chromatography–mass spectrometry |
| LOD | limit of detection |
| LOQ | limit of quantification |
| lysoPC a C16:0 | lysophosphatidylcholine a C16:0 |
| lysoPC a C17:0 | lysophosphatidylcholine a C17:0 |
| lysoPC a C18:0 | lysophosphatidylcholine a C18:0 |
| lysoPC a C18:1 | lysophosphatidylcholine a C18:1 |
| lysoPC a C18:2 | lysophosphatidylcholine a C18:2 |
| lysoPC a C20:3 | lysophosphatidylcholine a C20:3 |
| lysoPC a C24:0 | lysophosphatidylcholine a C24:0 |
| lysoPC a C26:0 | lysophosphatidylcholine a C26:0 |
| lysoPC a C26:1 | lysophosphatidylcholine a C26:1 |
| lysoPC a C28:0 | lysophosphatidylcholine a C28:0 |
| lysoPC a C28:1 | lysophosphatidylcholine a C28:1 |
| Met SO | methionine-sulfoxide |
| MSEA | metabolite set enrichment analysis |
| NETs | neuroendocrine tumors |
| PA | pancreatic cancer |
| PC aa C24:0 | phosphatidylcholine aa C24:0 |
| PC aa C32:0 | phosphatidylcholine aa C32:0 |
| PC aa C32:1 | phosphatidylcholine aa C32:1 |
| PC aa C32:2 | phosphatidylcholine aa C32:2 |
| PC aa C34:1 | phosphatidylcholine aa C34:1 |
| PC aa C34:2 | phosphatidylcholine aa C34:2 |
| PC aa C34:4 | phosphatidylcholine aa C34:4 |
| PC aa C36:0 | phosphatidylcholine aa C36:0 |
| PC aa C36:1 | phosphatidylcholine aa C36:1 |
| PC aa C36:2 | phosphatidylcholine aa C36:2 |
| PC aa C36:5 | phosphatidylcholine aa C36:5 |
| PC aa C36:6 | phosphatidylcholine aa C36:6 |
| PC aa C38:5 | phosphatidylcholine aa C38:5 |
| PC aa C40:1 | phosphatidylcholine aa C40:1 |
| PC aa C40:3 | phosphatidylcholine aa C40:3 |
| PC aa C40:4 | phosphatidylcholine aa C40:4 |
| PC aa C40:5 | phosphatidylcholine aa C40:5 |
| PC aa C40:6 | phosphatidylcholine aa C40:6 |
| PC aa C42:0 | phosphatidylcholine aa C42:0 |
| PC aa C42:1 | phosphatidylcholine aa C42:1 |
| PC aa C42:2 | phosphatidylcholine aa C42:2 |
| PC aa C42:4 | phosphatidylcholine aa C42:4 |
| PC aa C42:6 | phosphatidylcholine aa C42:6 |
| PC ae C30:2 | phosphatidylcholine ae C30:2 |
| PC ae C34:3 | phosphatidylcholine ae C34:3 |
| PC ae C36:0 | phosphatidylcholine ae C36:0 |
| PC ae C38:0 | phosphatidylcholine ae C38:0 |
| PC ae C38:1 | phosphatidylcholine ae C38:1 |
| PC ae C38:2 | phosphatidylcholine ae C38:2 |
| PC ae C38:3 | phosphatidylcholine ae C38:3 |
| PC ae C40:1 | phosphatidylcholine ae C40:1 |
| PC ae C40:3 | phosphatidylcholine ae C40:3 |
| PC ae C40:5 | phosphatidylcholine ae C40:5 |
| PC ae C42:1 | phosphatidylcholine ae C42:1 |
| PC ae C42:2 | phosphatidylcholine ae C42:2 |
| PC ae C42:2 | phosphatidylcholine ae C42:2 |
| PC ae C42:3 | phosphatidylcholine ae C42:3 |
| PC ae C44:3 | phosphatidylcholine ae C44:3 |
| PDAC | pancreatic ductal adenocarcinoma |
| Phe | phenylalanine |
| PITC | pyridine and phenyl isothiocyanate |
| PNET | neuroendocrine pancreatic tumor |
| RCTs | randomized controlled trials |
| ROC | receiver operating characteristic |
| RPLC | reversed-phase liquid chromatography |
| SAP | severe acute pancreatitis |
| SDMA | symmetric dimethylarginine |
| Serotonin | serotonin |
| SM (OH) C14:1 | hydroxysphingomyelin C14:1 |
| SM (OH) C16:1 | hydroxysphingomyelin C16:1 |
| SM (OH) C22:1 | hydroxysphingomyelin C22:1 |
| SM C16:0 | sphingomyelin C16:0 |
| SM C16:1 | sphingomyelin C16:1 |
| SM C18:0 | sphingomyelin C18:0 |
| SM C18:1 | sphingomyelin C18:1 |
| SM C20:2 | sphingomyelin C20:2 |
| SM C24:0 | sphingomyelin C24:0 |
| SM C24:1 | sphingomyelin C24:1 |
| SM C26:0 | sphingomyelin C26:0 |
| SM C26:1 | sphingomyelin C26:1 |
| t4-OH-Pro | trans-4-Hydroxyproline |
| u5-HIAA | urinary 5-hydroxyindoleacetic acid |
| ULOQ | upper limit of quantification |
References
- Cao, Y.; Zhao, R.; Guo, K.; Ren, S.; Zhang, Y.; Lu, Z.; Tian, L.; Li, T.; Chen, X.; Wang, Z. Potential Metabolite Biomarkers for Early Detection of Stage-I Pancreatic Ductal Adenocarcinoma. Front. Oncol. 2021, 11, 744667. [Google Scholar] [CrossRef]
- Maisonneuve, P. Epidemiology and Burden of Pancreatic Cancer. Presse Med. 2019, 48, e113–e123. [Google Scholar] [CrossRef]
- Halbrook, C.J.; Lyssiotis, C.A. Employing Metabolism to Improve the Diagnosis and Treatment of Pancreatic Cancer. Cancer Cell 2017, 31, 5–19. [Google Scholar] [CrossRef] [PubMed] [Green Version]
- McGuigan, A.; Kelly, P.; Turkington, R.C.; Jones, C.; Coleman, H.G.; McCain, R.S. Pancreatic Cancer: A Review of Clinical Diagnosis, Epidemiology, Treatment and Outcomes. World J. Gastroenterol. 2018, 24, 4846–4861. [Google Scholar] [CrossRef]
- Qin, C.; Yang, G.; Yang, J.; Ren, B.; Wang, H.; Chen, G.; Zhao, F.; You, L.; Wang, W.; Zhao, Y. Metabolism of Pancreatic Cancer: Paving the Way to Better Anticancer Strategies. Mol. Cancer 2020, 19, 50. [Google Scholar] [CrossRef] [PubMed] [Green Version]
- Zhang, X.; Shi, X.; Lu, X.; Li, Y.; Zhan, C.; Akhtar, M.L.; Yang, L.; Bai, Y.; Zhao, J.; Wang, Y.; et al. Novel Metabolomics Serum Biomarkers for Pancreatic Ductal Adenocarcinoma by the Comparison of Pre-, Postoperative and Normal Samples. J. Cancer 2020, 11, 4641–4651. [Google Scholar] [CrossRef]
- Mayerle, J.; Kalthoff, H.; Reszka, R.; Kamlage, B.; Peter, E.; Schniewind, B.; González Maldonado, S.; Pilarsky, C.; Heidecke, C.-D.; Schatz, P.; et al. Metabolic Biomarker Signature to Differentiate Pancreatic Ductal Adenocarcinoma from Chronic Pancreatitis. Gut 2018, 67, 128–137. [Google Scholar] [CrossRef] [PubMed] [Green Version]
- Stolzenberg-Solomon, R.; Derkach, A.; Moore, S.; Weinstein, S.J.; Albanes, D.; Sampson, J. Associations between Metabolites and Pancreatic Cancer Risk in a Large Prospective Epidemiological Study. Gut 2020, 69, 2008–2015. [Google Scholar] [CrossRef]
- Vincent, A.; Herman, J.; Schulick, R.; Hruban, R.H.; Goggins, M. Pancreatic Cancer. Lancet 2011, 378, 607–620. [Google Scholar] [CrossRef]
- Zhou, Q.; Melton, D.A. Pancreas Regeneration. Nature 2018, 557, 351–358. [Google Scholar] [CrossRef]
- Suzuki, T.; Otsuka, M.; Seimiya, T.; Iwata, T.; Kishikawa, T.; Koike, K. The Biological Role of Metabolic Reprogramming in Pancreatic Cancer. MedComm 2020, 1, 302–310. [Google Scholar] [CrossRef] [PubMed]
- Mpilla, G.B.; Philip, P.A.; El-Rayes, B.; Azmi, A.S. Pancreatic Neuroendocrine Tumors: Therapeutic Challenges and Research Limitations. World J. Gastroenterol. 2020, 26, 4036–4054. [Google Scholar] [CrossRef] [PubMed]
- Rossi, R.E.; Ciafardini, C.; Sciola, V.; Conte, D.; Massironi, S. Chromogranin A in the Follow-up of Gastroenteropancreatic Neuroendocrine Neoplasms: Is It Really Game Over? A Systematic Review and Meta-Analysis. Pancreas 2018, 47, 1249–1255. [Google Scholar] [CrossRef] [PubMed]
- Malczewska, A.; Witkowska, M.; Wójcik-Giertuga, M.; Kuśnierz, K.; Bocian, A.; Walter, A.; Rydel, M.; Robek, A.; Pierzchała, S.; Malczewska, M.; et al. Prospective Evaluation of the NETest as a Liquid Biopsy for Gastroenteropancreatic and Bronchopulmonary Neuroendocrine Tumors: An ENETS Center of Excellence Experience. Neuroendocrinology 2021, 111, 304–319. [Google Scholar] [CrossRef]
- Modlin, I.M.; Kidd, M.; Falconi, M.; Filosso, P.L.; Frilling, A.; Malczewska, A.; Toumpanakis, C.; Valk, G.; Pacak, K.; Bodei, L.; et al. A Multigenomic Liquid Biopsy Biomarker for Neuroendocrine Tumor Disease Outperforms CgA and Has Surgical and Clinical Utility. Ann. Oncol. 2021, 32, 1425–1433. [Google Scholar] [CrossRef]
- Alexandraki, K.I.; Spyroglou, A.; Kykalos, S.; Daskalakis, K.; Kyriakopoulos, G.; Sotiropoulos, G.C.; Kaltsas, G.A.; Grossman, A.B. Changing Biological Behaviour of NETs during the Evolution of the Disease: Progress on Progression. Endocr. Relat. Cancer 2021, 28, R121–R140. [Google Scholar] [CrossRef]
- Guadagno, E.; D’Avella, E.; Cappabianca, P.; Colao, A.; Del Basso De Caro, M. Ki67 in Endocrine Neoplasms: To Count or Not to Count, This Is the Question! A Systematic Review from the English Language Literature. J. Endocrinol. Investig. 2020, 43, 1429–1445. [Google Scholar] [CrossRef]
- Lea, D.; Gudlaugsson, E.G.; Skaland, I.; Lillesand, M.; Søreide, K.; Søreide, J.A. Digital Image Analysis of the Proliferation Markers Ki67 and Phosphohistone H3 in Gastroenteropancreatic Neuroendocrine Neoplasms: Accuracy of Grading Compared With Routine Manual Hot Spot Evaluation of the Ki67 Index. Appl. Immunohistochem. Mol. Morphol. 2021, 29, 499–505. [Google Scholar] [CrossRef]
- Dambrova, M.; Makrecka-Kuka, M.; Kuka, J.; Vilskersts, R.; Nordberg, D.; Attwood, M.M.; Smesny, S.; Sen, Z.D.; Guo, A.C.; Oler, E.; et al. Acylcarnitines: Nomenclature, Biomarkers, Therapeutic Potential, Drug Targets, and Clinical Trials. Pharmacol. Rev. 2022, 74, 506–551. [Google Scholar] [CrossRef]
- Wang, Y.; Chen, Y.; Guan, L.; Zhang, H.; Huang, Y.; Johnson, C.H.; Wu, Z.; Gonzalez, F.J.; Yu, A.; Huang, P.; et al. Carnitine Palmitoyltransferase 1C Regulates Cancer Cell Senescence through Mitochondria-Associated Metabolic Reprograming. Cell Death Differ. 2018, 25, 735–748. [Google Scholar] [CrossRef] [Green Version]
- Fujiwara, N.; Nakagawa, H.; Enooku, K.; Kudo, Y.; Hayata, Y.; Nakatsuka, T.; Tanaka, Y.; Tateishi, R.; Hikiba, Y.; Misumi, K.; et al. CPT2 Downregulation Adapts HCC to Lipid-Rich Environment and Promotes Carcinogenesis via Acylcarnitine Accumulation in Obesity. Gut 2018, 67, 1493–1504. [Google Scholar] [CrossRef] [PubMed]
- Bruls, Y.M.; de Ligt, M.; Lindeboom, L.; Phielix, E.; Havekes, B.; Schaart, G.; Kornips, E.; Wildberger, J.E.; Hesselink, M.K.; Muoio, D.; et al. Carnitine Supplementation Improves Metabolic Flexibility and Skeletal Muscle Acetylcarnitine Formation in Volunteers with Impaired Glucose Tolerance: A Randomised Controlled Trial. EBioMedicine 2019, 49, 318–330. [Google Scholar] [CrossRef] [PubMed] [Green Version]
- Askarpour, M.; Hadi, A.; Miraghajani, M.; Symonds, M.E.; Sheikhi, A.; Ghaedi, E. Beneficial Effects of L-Carnitine Supplementation for Weight Management in Overweight and Obese Adults: An Updated Systematic Review and Dose-Response Meta-Analysis of Randomized Controlled Trials. Pharmacol. Res. 2020, 151, 104554. [Google Scholar] [CrossRef] [PubMed]
- Wu, C.; Zhu, M.; Lu, Z.; Zhang, Y.; Li, L.; Li, N.; Yin, L.; Wang, H.; Song, W.; Xu, H. L-Carnitine Ameliorates the Muscle Wasting of Cancer Cachexia through the AKT/FOXO3a/MaFbx Axis. Nutr. Metab. 2021, 18, 98. [Google Scholar] [CrossRef]
- Takagi, A.; Hawke, P.; Tokuda, S.; Toda, T.; Higashizono, K.; Nagai, E.; Watanabe, M.; Nakatani, E.; Kanemoto, H.; Oba, N. Serum Carnitine as a Biomarker of Sarcopenia and Nutritional Status in Preoperative Gastrointestinal Cancer Patients. J. Cachexia Sarcopenia Muscle 2022, 13, 287–295. [Google Scholar] [CrossRef]
- Mochamat; Cuhls, H.; Marinova, M.; Kaasa, S.; Stieber, C.; Conrad, R.; Radbruch, L.; Mücke, M. A Systematic Review on the Role of Vitamins, Minerals, Proteins, and Other Supplements for the Treatment of Cachexia in Cancer: A European Palliative Care Research Centre Cachexia Project. J. Cachexia Sarcopenia Muscle 2017, 8, 25–39. [Google Scholar] [CrossRef] [Green Version]
- Mock-Ohnesorge, J.; Mock, A.; Hackert, T.; Fröhling, S.; Schenz, J.; Poschet, G.; Jäger, D.; Büchler, M.W.; Uhle, F.; Weigand, M.A. Perioperative Changes in the Plasma Metabolome of Patients Receiving General Anesthesia for Pancreatic Cancer Surgery. Oncotarget 2021, 12, 996–1010. [Google Scholar] [CrossRef]
- Li, T.; Le, A. Glutamine Metabolism in Cancer. Adv. Exp. Med. Biol. 2018, 1063, 13–32. [Google Scholar] [CrossRef]
- Dunphy, M.P.S.; Harding, J.J.; Venneti, S.; Zhang, H.; Burnazi, E.M.; Bromberg, J.; Omuro, A.M.; Hsieh, J.J.; Mellinghoff, I.K.; Staton, K.; et al. In Vivo PET Assay of Tumor Glutamine Flux and Metabolism: In-Human Trial of 18F-(2S,4R)-4-Fluoroglutamine. Radiology 2018, 287, 667–675. [Google Scholar] [CrossRef] [PubMed] [Green Version]
- Jiang, X.; Pei, L.-Y.; Guo, W.-X.; Qi, X.; Lu, X.-G. Glutamine Supported Early Enteral Therapy for Severe Acute Pancreatitis: A Systematic Review and Meta-Analysis. Asia Pac. J. Clin. Nutr. 2020, 29, 253–261. [Google Scholar] [CrossRef]
- Schiliro, C.; Firestein, B.L. Mechanisms of Metabolic Reprogramming in Cancer Cells Supporting Enhanced Growth and Proliferation. Cells 2021, 10, 1056. [Google Scholar] [CrossRef] [PubMed]
- Chang, X.; Liu, X.; Wang, H.; Yang, X.; Gu, Y. Glycolysis in the Progression of Pancreatic Cancer. Am. J. Cancer Res. 2022, 12, 861–872. [Google Scholar] [PubMed]
- Yang, J.; Ren, B.; Yang, G.; Wang, H.; Chen, G.; You, L.; Zhang, T.; Zhao, Y. The Enhancement of Glycolysis Regulates Pancreatic Cancer Metastasis. Cell. Mol. Life Sci. 2020, 77, 305–321. [Google Scholar] [CrossRef]
- Liu, C.; Deng, S.; Xiao, Z.; Lu, R.; Cheng, H.; Feng, J.; Shen, X.; Ni, Q.; Wu, W.; Yu, X.; et al. Glutamine Is a Substrate for Glycosylation and CA19-9 Biosynthesis through Hexosamine Biosynthetic Pathway in Pancreatic Cancer. Discov. Oncol. 2023, 14, 20. [Google Scholar] [CrossRef]
- Dong, S.; Zhao, Z.; Li, X.; Chen, Z.; Jiang, W.; Zhou, W. Efficacy of Glutamine in Treating Severe Acute Pancreatitis: A Systematic Review and Meta-Analysis. Front. Nutr. 2022, 9, 865102. [Google Scholar] [CrossRef]
- Arutla, M.; Raghunath, M.; Deepika, G.; Jakkampudi, A.; Murthy, H.V.V.; Rao, G.V.; Reddy, D.N.; Talukdar, R. Efficacy of Enteral Glutamine Supplementation in Patients with Severe and Predicted Severe Acute Pancreatitis—A Randomized Controlled Trial. Indian J. Gastroenterol. 2019, 38, 338–347. [Google Scholar] [CrossRef]
- Zhou, J.; Xue, Y.; Liu, Y.; Li, X.K.; Tong, Z.H.; Li, W.Q. The Effect of Immunonutrition in Patients with Acute Pancreatitis: A Systematic Review and Meta-Analysis. J. Hum. Nutr. Diet. 2021, 34, 429–439. [Google Scholar] [CrossRef] [PubMed]
- Zhou, S.; Jin, L.-R.; He, C. Effects of Imipenem Combined with Glutamine in the Treatment of Severe Acute Pancreatitis with Abdominal Infection in Mainland China: A Meta-Analysis. Rev. Assoc. Med. Bras. 2022, 68, 395–399. [Google Scholar] [CrossRef]
- Long, N.P.; Yoon, S.J.; Anh, N.H.; Nghi, T.D.; Lim, D.K.; Hong, Y.J.; Hong, S.-S.; Kwon, S.W. A Systematic Review on Metabolomics-Based Diagnostic Biomarker Discovery and Validation in Pancreatic Cancer. Metabolomics 2018, 14, 109. [Google Scholar] [CrossRef]
- Xiong, Y.; Shi, C.; Zhong, F.; Liu, X.; Yang, P. LC-MS/MS and SWATH Based Serum Metabolomics Enables Biomarker Discovery in Pancreatic Cancer. Clin. Chim. Acta 2020, 506, 214–221. [Google Scholar] [CrossRef]
- Borroto-Escuela, D.O.; Ambrogini, P.; Chruścicka, B.; Lindskog, M.; Crespo-Ramirez, M.; Hernández-Mondragón, J.C.; Perez de la Mora, M.; Schellekens, H.; Fuxe, K. The Role of Central Serotonin Neurons and 5-HT Heteroreceptor Complexes in the Pathophysiology of Depression: A Historical Perspective and Future Prospects. Int. J. Mol. Sci. 2021, 22, 1927. [Google Scholar] [CrossRef]
- Paredes, S.; Cantillo, S.; Candido, K.D.; Knezevic, N.N. An Association of Serotonin with Pain Disorders and Its Modulation by Estrogens. Int. J. Mol. Sci. 2019, 20, 5729. [Google Scholar] [CrossRef] [PubMed] [Green Version]
- Stasi, C.; Sadalla, S.; Milani, S. The Relationship Between the Serotonin Metabolism, Gut-Microbiota and the Gut-Brain Axis. Curr. Drug Metab. 2019, 20, 646–655. [Google Scholar] [CrossRef] [PubMed] [Green Version]
- Balakrishna, P.; George, S.; Hatoum, H.; Mukherjee, S. Serotonin Pathway in Cancer. Int. J. Mol. Sci. 2021, 22, 1268. [Google Scholar] [CrossRef]
- Joish, V.N.; Shah, S.; Tierce, J.C.; Patel, D.; McKee, C.; Lapuerta, P.; Zacks, J. Serotonin Levels and 1-Year Mortality in Patients with Neuroendocrine Tumors: A Systematic Review and Meta-Analysis. Future Oncol. 2019, 15, 1397–1406. [Google Scholar] [CrossRef] [PubMed] [Green Version]
- Karmakar, S.; Lal, G. Role of Serotonin Receptor Signaling in Cancer Cells and Anti-Tumor Immunity. Theranostics 2021, 11, 5296–5312. [Google Scholar] [CrossRef]
- Sherman, S.K.; Maxwell, J.E.; O’Dorisio, M.S.; O’Dorisio, T.M.; Howe, J.R. Pancreastatin Predicts Survival in Neuroendocrine Tumors. Ann. Surg. Oncol. 2014, 21, 2971–2980. [Google Scholar] [CrossRef] [Green Version]
- Shu, X.; Zheng, W.; Yu, D.; Li, H.-L.; Lan, Q.; Yang, G.; Cai, H.; Ma, X.; Rothman, N.; Gao, Y.-T.; et al. Prospective Metabolomics Study Identifies Potential Novel Blood Metabolites Associated with Pancreatic Cancer Risk. Int. J. Cancer 2018, 143, 2161–2167. [Google Scholar] [CrossRef] [Green Version]
- Manzo, T.; Prentice, B.M.; Anderson, K.G.; Raman, A.; Schalck, A.; Codreanu, G.S.; Nava Lauson, C.B.; Tiberti, S.; Raimondi, A.; Jones, M.A.; et al. Accumulation of Long-Chain Fatty Acids in the Tumor Microenvironment Drives Dysfunction in Intrapancreatic CD8+ T Cells. J. Exp. Med. 2020, 217, e20191920. [Google Scholar] [CrossRef]
- Ketavarapu, V.; Ravikanth, V.; Sasikala, M.; Rao, G.V.; Devi, C.V.; Sripadi, P.; Bethu, M.S.; Amanchy, R.; Murthy, H.V.V.; Pandol, S.J.; et al. Integration of Metabolites from Meta-Analysis with Transcriptome Reveals Enhanced SPHK1 in PDAC with a Background of Pancreatitis. BMC Cancer 2022, 22, 792. [Google Scholar] [CrossRef]
- Wedekind, R.; Rothwell, J.A.; Viallon, V.; Keski-Rahkonen, P.; Schmidt, J.A.; Chajes, V.; Katzke, V.; Johnson, T.; Santucci de Magistris, M.; Krogh, V.; et al. Determinants of Blood Acylcarnitine Concentrations in Healthy Individuals of the European Prospective Investigation into Cancer and Nutrition. Clin. Nutr. 2022, 41, 1735–1745. [Google Scholar] [CrossRef] [PubMed]
- Feig, C.; Gopinathan, A.; Neesse, A.; Chan, D.S.; Cook, N.; Tuveson, D.A. The Pancreas Cancer Microenvironment. Clin. Cancer Res. 2012, 18, 4266–4276. [Google Scholar] [CrossRef] [PubMed] [Green Version]
- Stopa, K.B.; Kusiak, A.A.; Szopa, M.D.; Ferdek, P.E.; Jakubowska, M.A. Pancreatic Cancer and Its Microenvironment—Recent Advances and Current Controversies. Int. J. Mol. Sci. 2020, 21, 3218. [Google Scholar] [CrossRef]
- Wei, Z.; Liu, X.; Cheng, C.; Yu, W.; Yi, P. Metabolism of Amino Acids in Cancer. Front. Cell Dev. Biol. 2021, 8, 603837. [Google Scholar] [CrossRef] [PubMed]
- Wang, W.; Cui, J.; Ma, H.; Lu, W.; Huang, J. Targeting Pyrimidine Metabolism in the Era of Precision Cancer Medicine. Front. Oncol. 2021, 11, 684961. [Google Scholar] [CrossRef]
- Zang, Q.; Sun, C.; Chu, X.; Li, L.; Gan, W.; Zhao, Z.; Song, Y.; He, J.; Zhang, R.; Abliz, Z. Spatially Resolved Metabolomics Combined with Multicellular Tumor Spheroids to Discover Cancer Tissue Relevant Metabolic Signatures. Anal. Chim. Acta 2021, 1155, 338342. [Google Scholar] [CrossRef]
- Zemanova, M.; Vecka, M.; Petruželka, L.; Staňková, B.; Žák, A.; Zeman, M. Plasma Phosphatidylcholines Fatty Acids in Men with Squamous Cell Esophageal Cancer: Chemoradiotherapy Improves Abnormal Profile. Med. Sci. Monit. 2016, 22, 4092–4099. [Google Scholar] [CrossRef] [Green Version]
- Zang, B.; Wang, W.; Wang, Y.; Li, P.; Xia, T.; Liu, X.; Chen, D.; Piao, H.-L.; Qi, H.; Ma, Y. Metabolomic Characterization Reveals ILF2 and ILF3 Affected Metabolic Adaptions in Esophageal Squamous Cell Carcinoma. Front. Mol. Biosci. 2021, 8, 721990. [Google Scholar] [CrossRef]
- Molendijk, J.; Kolka, C.M.; Cairns, H.; Brosda, S.; Mohamed, A.; Shah, A.K.; Brown, I.; Hodson, M.P.; Hennessy, T.; Liu, G.; et al. Elevation of Fatty Acid Desaturase 2 in Esophageal Adenocarcinoma Increases Polyunsaturated Lipids and May Exacerbate Bile Acid-Induced DNA Damage. Clin. Transl. Med. 2022, 12, e810. [Google Scholar] [CrossRef]
- Mir, S.A.; Rajagopalan, P.; Jain, A.P.; Khan, A.A.; Datta, K.K.; Mohan, S.V.; Lateef, S.S.; Sahasrabuddhe, N.; Somani, B.L.; Keshava Prasad, T.S.; et al. LC-MS-Based Serum Metabolomic Analysis Reveals Dysregulation of Phosphatidylcholines in Esophageal Squamous Cell Carcinoma. J. Proteom. 2015, 127, 96–102. [Google Scholar] [CrossRef]
- Nishiumi, S.; Fujigaki, S.; Kobayashi, T.; Kojima, T.; Ito, Y.; Daiko, H.; Kato, K.; Shoji, H.; Kodama, Y.; Honda, K.; et al. Metabolomics-Based Discovery of Serum Biomarkers to Predict the Side-Effects of Neoadjuvant Chemoradiotherapy for Esophageal Squamous Cell Carcinoma. Anticancer Res. 2019, 39, 519–526. [Google Scholar] [CrossRef]
- Ma, W.; Wang, S.; Zhang, T.; Zhang, E.Y.; Zhou, L.; Hu, C.; Yu, J.J.; Xu, G. Activation of Choline Kinase Drives Aberrant Choline Metabolism in Esophageal Squamous Cell Carcinomas. J. Pharm. Biomed. Anal. 2018, 155, 148–156. [Google Scholar] [CrossRef] [PubMed]
- Corona, G.; Cannizzaro, R.; Miolo, G.; Caggiari, L.; De Zorzi, M.; Repetto, O.; Steffan, A.; De Re, V. Use of Metabolomics as a Complementary Omic Approach to Implement Risk Criteria for First-Degree Relatives of Gastric Cancer Patients. Int. J. Mol. Sci. 2018, 19, 750. [Google Scholar] [CrossRef] [PubMed] [Green Version]
- Jin, X.; Li, H.; Li, B.; Zhang, C.; He, Y. Knockdown and Inhibition of Hydroxytryptamine Receptor 1D Suppress Proliferation and Migration of Gastric Cancer Cells. Biochem. Biophys. Res. Commun. 2022, 620, 143–149. [Google Scholar] [CrossRef]
- Khin, P.P.; Po, W.W.; Thein, W.; Sohn, U.D. Apoptotic Effect of Fluoxetine through the Endoplasmic Reticulum Stress Pathway in the Human Gastric Cancer Cell Line AGS. Naunyn-Schmiedeberg’s Arch. Pharmacol. 2020, 393, 537–549. [Google Scholar] [CrossRef] [PubMed]
- Niu, Q.; Li, L.; Zhang, C.; Qi, C.; He, Q.; Zhu, Y. Expression of 5-HT Relates to Stem Cell Marker LGR5 in Patients with Gastritis and Gastric Cancer. Dig. Dis. Sci. 2023, 68, 1864–1872. [Google Scholar] [CrossRef] [PubMed]
- Zou, L.; Guo, L.; Zhu, C.; Lai, Z.; Li, Z.; Yang, A. Serum Phospholipids Are Potential Biomarkers for the Early Diagnosis of Gastric Cancer. Clin. Chim. Acta 2021, 519, 276–284. [Google Scholar] [CrossRef]
- Zou, L.; Wang, L.; Guo, L.; Zhou, W.; Lai, Z.; Zhu, C.; Wu, X.; Li, Z.; Yang, A. Small Molecules as Potential Biomarkers of Early Gastric Cancer: A Mass Spectrometry Imaging Approach. Clin. Chim. Acta 2022, 534, 35–42. [Google Scholar] [CrossRef]
- Uehara, T.; Kikuchi, H.; Miyazaki, S.; Iino, I.; Setoguchi, T.; Hiramatsu, Y.; Ohta, M.; Kamiya, K.; Morita, Y.; Tanaka, H.; et al. Overexpression of Lysophosphatidylcholine Acyltransferase 1 and Concomitant Lipid Alterations in Gastric Cancer. Ann. Surg. Oncol. 2016, 23 (Suppl. 2), S206–S213. [Google Scholar] [CrossRef] [Green Version]
- Guo, Y.; Ren, J.; Li, X.; Liu, X.; Liu, N.; Wang, Y.; Li, Z. Simultaneous Quantification of Serum Multi-Phospholipids as Potential Biomarkers for Differentiating Different Pathophysiological States of Lung, Stomach, Intestine, and Pancreas. J. Cancer 2017, 8, 2191–2204. [Google Scholar] [CrossRef] [Green Version]
- Huang, Q.; Tan, Y.; Yin, P.; Ye, G.; Gao, P.; Lu, X.; Wang, H.; Xu, G. Metabolic Characterization of Hepatocellular Carcinoma Using Nontargeted Tissue Metabolomics. Cancer Res. 2013, 73, 4992–5002. [Google Scholar] [CrossRef] [PubMed] [Green Version]
- Okubo, H.; Ando, H.; Ishizuka, K.; Kitagawa, R.; Okubo, S.; Saito, H.; Kokubu, S.; Miyazaki, A.; Ikejima, K.; Shiina, S.; et al. Carnitine Insufficiency Is Associated with Fatigue during Lenvatinib Treatment in Patients with Hepatocellular Carcinoma. PLoS ONE 2020, 15, e0229772. [Google Scholar] [CrossRef] [PubMed] [Green Version]
- Padickakudy, R.; Pereyra, D.; Offensperger, F.; Jonas, P.; Oehlberger, L.; Schwarz, C.; Haegele, S.; Assinger, A.; Brostjan, C.; Gruenberger, T.; et al. Bivalent Role of Intra-Platelet Serotonin in Liver Regeneration and Tumor Recurrence in Humans. J. Hepatol. 2017, 67, 1243–1252. [Google Scholar] [CrossRef] [PubMed]
- Niture, S.; Gyamfi, M.A.; Kedir, H.; Arthur, E.; Ressom, H.; Deep, G.; Kumar, D. Serotonin Induced Hepatic Steatosis Is Associated with Modulation of Autophagy and Notch Signaling Pathway. Cell Commun. Signal. 2018, 16, 78. [Google Scholar] [CrossRef] [PubMed] [Green Version]
- Yang, Q.; Yan, C.; Yin, C.; Gong, Z. Serotonin Activated Hepatic Stellate Cells Contribute to Sex Disparity in Hepatocellular Carcinoma. Cell. Mol. Gastroenterol. Hepatol. 2017, 3, 484–499. [Google Scholar] [CrossRef] [PubMed] [Green Version]
- Abdel-Hamid, N.M.; Shehata, D.E.; Abdel-Ghany, A.A.; Ragaa, A.; Wahid, A. Serum Serotonin as Unexpected Potential Marker for Staging of Experimental Hepatocellular Carcinoma. Biomed. Pharmacother. 2016, 83, 407–411. [Google Scholar] [CrossRef]
- Mamdouh, F.; Abdel Alem, S.; Abdo, M.; Abdelaal, A.; Salem, A.; Rabiee, A.; Elsisi, O. Serum Serotonin as a Potential Diagnostic Marker for Hepatocellular Carcinoma. J. Interferon Cytokine Res. 2019, 39, 780–785. [Google Scholar] [CrossRef]
- Lai, S.-W.; Hwang, B.-F.; Liu, C.-S.; Liao, K.-F. Selective Serotonin Reuptake Inhibitor Use and the Risk of Hepatocellular Carcinoma. Eur. J. Clin. Pharmacol. 2022, 78, 1197–1198. [Google Scholar] [CrossRef] [PubMed]
- Huang, Y.-H.; Yeh, C.-T. Anticancer Effects of Antidepressants in Hepatocellular Carcinoma Cells. Anticancer Res. 2023, 43, 1201–1206. [Google Scholar] [CrossRef] [PubMed]
- Abdel-Razik, A.; Elhelaly, R.; Elzehery, R.; El-Diasty, A.; Abed, S.; Elhammady, D.; Tawfik, A. Could Serotonin Be a Potential Marker for Hepatocellular Carcinoma? A Prospective Single-Center Observational Study. Eur. J. Gastroenterol. Hepatol. 2016, 28, 599–605. [Google Scholar] [CrossRef]
- Yu, L.; Zeng, Z.; Tan, H.; Feng, Q.; Zhou, Q.; Hu, J.; Li, Y.; Wang, J.; Yang, W.; Feng, J.; et al. Significant Metabolic Alterations in Patients with Hepatitis B Virus Replication Observed via Serum Untargeted Metabolomics Shed New Light on Hepatitis B Virus Infection. J. Drug Target. 2022, 30, 442–449. [Google Scholar] [CrossRef] [PubMed]
- Kwee, S.A.; Sato, M.M.; Kuang, Y.; Franke, A.; Custer, L.; Miyazaki, K.; Wong, L.L. [18F]Fluorocholine PET/CT Imaging of Liver Cancer: Radiopathologic Correlation with Tissue Phospholipid Profiling. Mol. Imaging Biol. 2017, 19, 446–455. [Google Scholar] [CrossRef] [PubMed]
- Hall, Z.; Chiarugi, D.; Charidemou, E.; Leslie, J.; Scott, E.; Pellegrinet, L.; Allison, M.; Mocciaro, G.; Anstee, Q.M.; Evan, G.I.; et al. Lipid Remodeling in Hepatocyte Proliferation and Hepatocellular Carcinoma. Hepatology 2021, 73, 1028–1044. [Google Scholar] [CrossRef] [PubMed]
- Hou, G.; Ding, D.; Tian, T.; Dong, W.; Sun, D.; Liu, G.; Yang, Y.; Zhou, W. Metabolomics-Based Classification Reveals Subtypes of Hepatocellular Carcinoma. Mol. Carcinog. 2022, 61, 989–1001. [Google Scholar] [CrossRef]
- Li, Z.; Guan, M.; Lin, Y.; Cui, X.; Zhang, Y.; Zhao, Z.; Zhu, J. Aberrant Lipid Metabolism in Hepatocellular Carcinoma Revealed by Liver Lipidomics. Int. J. Mol. Sci. 2017, 18, 2550. [Google Scholar] [CrossRef] [Green Version]
- Cotte, A.K.; Cottet, V.; Aires, V.; Mouillot, T.; Rizk, M.; Vinault, S.; Binquet, C.; de Barros, J.-P.P.; Hillon, P.; Delmas, D. Phospholipid Profiles and Hepatocellular Carcinoma Risk and Prognosis in Cirrhotic Patients. Oncotarget 2019, 10, 2161–2172. [Google Scholar] [CrossRef] [PubMed]
- Ismail, I.T.; Elfert, A.; Helal, M.; Salama, I.; El-Said, H.; Fiehn, O. Remodeling Lipids in the Transition from Chronic Liver Disease to Hepatocellular Carcinoma. Cancers 2020, 13, 88. [Google Scholar] [CrossRef]
- Ala, M. Tryptophan Metabolites Modulate Inflammatory Bowel Disease and Colorectal Cancer by Affecting Immune System. Int. Rev. Immunol. 2022, 41, 326–345. [Google Scholar] [CrossRef]
- Dahabiyeh, L.A.; Hudaib, F.; Hourani, W.; Darwish, W.; Abu-Irmaileh, B.; Deb, P.K.; Venugopala, K.N.; Mohanlall, V.; Chandrashekharappa, S.; Abu-Dahab, R.; et al. Mass Spectrometry-Based Metabolomics Approach and in Vitro Assays Revealed Promising Role of 2,3-Dihydroquinazolin-4(1H)-One Derivatives against Colorectal Cancer Cell Lines. Eur. J. Pharm. Sci. 2023, 182, 106378. [Google Scholar] [CrossRef]
- Huang, Y.-W.; Lin, C.-W.; Pan, P.; Echeveste, C.E.; Dong, A.; Oshima, K.; Yearsley, M.; Yu, J.; Wang, L.-S. Dysregulated Free Fatty Acid Receptor 2 Exacerbates Colonic Adenoma Formation in Apc Min/+ Mice: Relation to Metabolism and Gut Microbiota Composition. J. Cancer Prev. 2021, 26, 32–40. [Google Scholar] [CrossRef]
- Wang, X.; Wang, J.; Wang, Z.; Wang, Q.; Li, H. Dynamic Monitoring of Plasma Amino Acids and Carnitine during Chemotherapy of Patients with Alimentary Canal Malignancies and Its Clinical Value. OncoTargets Ther. 2015, 8, 1989–1996. [Google Scholar] [CrossRef] [PubMed] [Green Version]
- Kannen, V.; Bader, M.; Sakita, J.Y.; Uyemura, S.A.; Squire, J.A. The Dual Role of Serotonin in Colorectal Cancer. Trends Endocrinol. Metab. 2020, 31, 611–625. [Google Scholar] [CrossRef]
- Mao, L.; Xin, F.; Ren, J.; Xu, S.; Huang, H.; Zha, X.; Wen, X.; Gu, G.; Yang, G.; Cheng, Y.; et al. 5-HT2B-Mediated Serotonin Activation in Enterocytes Suppresses Colitis-Associated Cancer Initiation and Promotes Cancer Progression. Theranostics 2022, 12, 3928–3945. [Google Scholar] [CrossRef]
- Shen, Y.; Sun, M.; Zhu, J.; Wei, M.; Li, H.; Zhao, P.; Wang, J.; Li, R.; Tian, L.; Tao, Y.; et al. Tissue Metabolic Profiling Reveals Major Metabolic Alteration in Colorectal Cancer. Mol. Omics 2021, 17, 464–471. [Google Scholar] [CrossRef] [PubMed]
- Zhu, P.; Lu, T.; Chen, Z.; Liu, B.; Fan, D.; Li, C.; Wu, J.; He, L.; Zhu, X.; Du, Y.; et al. 5-Hydroxytryptamine Produced by Enteric Serotonergic Neurons Initiates Colorectal Cancer Stem Cell Self-Renewal and Tumorigenesis. Neuron 2022, 110, 2268–2282.e4. [Google Scholar] [CrossRef] [PubMed]
- Elmallah, M.I.Y.; Ortega-Deballon, P.; Hermite, L.; Pais-De-Barros, J.-P.; Gobbo, J.; Garrido, C. Lipidomic Profiling of Exosomes from Colorectal Cancer Cells and Patients Reveals Potential Biomarkers. Mol. Oncol. 2022, 16, 2710–2718. [Google Scholar] [CrossRef]
- Peng, S.; Li, Y.; Huang, M.; Tang, G.; Xie, Y.; Chen, D.; Hu, Y.; Yu, T.; Cai, J.; Yuan, Z.; et al. Metabolomics Reveals That CAF-Derived Lipids Promote Colorectal Cancer Peritoneal Metastasis by Enhancing Membrane Fluidity. Int. J. Biol. Sci. 2022, 18, 1912–1932. [Google Scholar] [CrossRef]
- Hang, D.; Zeleznik, O.A.; Lu, J.; Joshi, A.D.; Wu, K.; Hu, Z.; Shen, H.; Clish, C.B.; Liang, L.; Eliassen, A.H.; et al. Plasma Metabolomic Profiles for Colorectal Cancer Precursors in Women. Eur. J. Epidemiol. 2022, 37, 413–422. [Google Scholar] [CrossRef]
- Choi, S.; Yoo, Y.J.; Kim, H.; Lee, H.; Chung, H.; Nam, M.-H.; Moon, J.-Y.; Lee, H.S.; Yoon, S.; Kim, W.-Y. Clinical and Biochemical Relevance of Monounsaturated Fatty Acid Metabolism Targeting Strategy for Cancer Stem Cell Elimination in Colon Cancer. Biochem. Biophys. Res. Commun. 2019, 519, 100–105. [Google Scholar] [CrossRef]
- Mika, A.; Pakiet, A.; Czumaj, A.; Kaczynski, Z.; Liakh, I.; Kobiela, J.; Perdyan, A.; Adrych, K.; Makarewicz, W.; Sledzinski, T. Decreased Triacylglycerol Content and Elevated Contents of Cell Membrane Lipids in Colorectal Cancer Tissue: A Lipidomic Study. J. Clin. Med. 2020, 9, 1095. [Google Scholar] [CrossRef] [Green Version]
- Chen, L.; Zhang, C.; Gui, Q.; Chen, Y.; Yang, Y. Ultra-performance Liquid Chromatography Coupled with Quadrupole Time-of-flight Mass Spectrometry-based Metabolic Profiling of Human Serum Prior to and Following Radical Resection of Colorectal Carcinoma. Mol. Med. Rep. 2015, 12, 6879–6886. [Google Scholar] [CrossRef] [PubMed] [Green Version]


| PDAC | PNET | |
|---|---|---|
| age (years) | 66 (58.0–75.5) | 62 (42.0–70.5) |
| weight (kg) | 62 (50.0–71.5) | 77 (67.5–86.0) |
| height (cm) | 165.0 (158.0–171.0) | 176 (171.2–181.0) |
| tumor size (mm) | 40 (35–52.2) | 20 (17–30) |
| stage at diagnosis, no | ||
| T1/T2/T3/T4 | 1/2/1/9 | 7/2/3/1 |
| N0/N1 | 10/3 | 12/1 |
| M0/M1 | 12/1 | 9/4 |
| localization: | ||
| head | 13 | 6 |
| corpus | 1 | 2 |
| tail | 0 | 6 |
| other/unknown | 1 | 2 |
| metastasis no/%: | ||
| yes | 6/40% | 5/31% |
| no | 9/60% | 11/69% |
| WBC (thou/uL) | 7.0 (5.9–9.2) | 6.6 (5.8–7.2) |
| RBC (mil/uL) | 4.2 (3.8–4.6) | 4.7 (4.5–4.9) |
| PLT (thou/uL) | 228.5 (148.2–276.2) | 211.0 (188.2–261.0) |
| CRP (mg/L) | 29.4 (10.8–86.1) | 1.8 (1.0–3.2) |
| CA19-9 (U/mL) | 534.5 (165.0–2172.5) | 3.3 (3.0–6.9) |
| Control vs. PDAC | ||||||
|---|---|---|---|---|---|---|
| Class | Metabolite | Name | p-Value | p.adj | FC | Up ↑/Down ↓- Control/PDAC |
| Acylcarnitines | C2 | Acetylcarnitine | 6.0 × 10⁴ | 0.03 | 8.84 | ↑ |
| Amino acids | Asn | Asparagine | 0.038 | 0.29 | 1.50 | ↑ |
| Cit | Citrulline | 1.7 × 10³ | 0.04 | 2.21 | ↑ | |
| Gln | Glutamine | 4.4 × 10⁵ | 6.7 × 10³ | 8.37 | ↑ | |
| Glu | Glutamic Acid | 1.7 × 10³ | 0.04 | −1.56 | ↓ | |
| Phe | Phenylalanine | 0.013 | 0.21 | −1.32 | ↓ | |
| Biogenic amines | SDMA | Symmetric dimethylarginine | 0.016 | 0.25 | 1.33 | ↑ |
| Glycerophospholipids | lysoPC a C16:0 | Lysophosphatidylcholine a C16:0 | 0.020 | 0.25 | −1.37 | ↓ |
| lysoPC a C18:1 | Lysophosphatidylcholine a C18:1 | 0.033 | 0.28 | −1.32 | ↓ | |
| PC aa C32:0 | Phosphatidylcholine aa C32:0 | 2.0 × 10⁴ | 1.7 × 10² | −2.56 | ↓ | |
| PC aa C34:1 | Phosphatidylcholine aa C34:1 | 0.046 | 0.32 | −1.16 | ↓ | |
| PC aa C42:0 | Phosphatidylcholine aa C42:0 | 0.026 | 0.28 | 1.27 | ↑ | |
| PC aa C42:1 | Phosphatidylcholine aa C42:1 | 0.019 | 0.25 | 1.40 | ↑ | |
| PC aa C42:2 | Phosphatidylcholine aa C42:2 | 0.048 | 0.32 | 1.35 | ↑ | |
| PC ae C40:1 | Phosphatidylcholine ae C40:1 | 0.026 | 0.28 | 1.42 | ↑ | |
| PC ae C42:2 | Phosphatidylcholine ae C42:2 | 0.035 | 0.28 | 1.35 | ↑ | |
| PC ae C42:3 | Phosphatidylcholine ae C42:3 | 0.043 | 0.31 | 1.32 | ↑ | |
| Sphingolipids | SM (OH) C22:1 | Hydroxysphingomyelin C22:1 | 0.013 | 0.21 | 1.32 | ↑ |
| SM C16:0 | Sphingomyelin C16:0 | 0.031 | 0.28 | −1.32 | ↓ | |
| SM C18:0 | Sphingomyelin C18:0 | 0.033 | 0.28 | −1.52 | ↓ | |
| SM C24:1 | Sphingomyelin C24:1 | 0.004 | 0.09 | −1.35 | ↓ | |
| SM C26:1 | Sphingomyelin C26:1 | 1.3 × 10³ | 0.04 | −1.49 | ↓ | |
| Monosaccharides | H1 | Hexoses | 0.031 | 0.28 | −1.49 | ↓ |
| Control vs. PNET | ||||||
|---|---|---|---|---|---|---|
| Class | Metabolite | Name | p-Value | p.adj | FC | Up ↑/Down ↓- Control/PNET |
| Acylcarnitines | C14:1 | Tetradecenoylcarnitine | 0.029 | 0.72 | 1.21 | ↑ |
| C14:2 | Tetradecadienylcarnitine | 0.048 | 0.72 | 1.07 | ↑ | |
| Amino acids | Cit | Citrulline | 0.048 | 0.72 | 1.40 | ↑ |
| Biogenic amines | SDMA | Symmetric dimethylarginine | 0.027 | 0.72 | 1.15 | ↑ |
| Glycerophospholipids | lysoPC a C20:3 | Lysophosphatidylcholine a C20:3 | 0.035 | 0.72 | −1.43 | ↓ |
| PC aa C34:2 | Phosphatidylcholine aa C34:2 | 0.040 | 0.72 | 1.16 | ↑ | |
| PC ae C38:3 | Phosphatidylcholine ae C38:3 | 0.020 | 0.72 | 1.06 | ↑ | |
| PC ae C40:3 | Phosphatidylcholine ae C40:3 | 0.029 | 0.72 | 1.12 | ↑ | |
| Sphingolipids | SM (OH) C22:1 | Hydroxysphingomyelin C22:1 | 0.023 | 0.72 | 1.31 | ↑ |
| PNET vs. PDAC | ||||||
|---|---|---|---|---|---|---|
| Class | Metabolite | Name | p-Value | p.adj | FC | Up/Down- PNET/PNET |
| Acylcarnitines | C2 | Acetylcarnitine | 3.0 × 10⁵ | 4.6 × 10³ | 8.67 | ↑ |
| C3-DC (C4-OH) | Malonylcarnitine | 0.034 | 0.16 | −1.09 | ↓ | |
| C14:2 | Tetradecadienylcarnitine | 0.028 | 0.14 | −1.14 | ↓ | |
| C16-OH | Hydroxyhexadecanoylcarnitine | 0.020 | 0.12 | 1.19 | ↑ | |
| C16:2-OH | Hydroxyhexadecadienoylcarnitine | 0.015 | 0.11 | −1.01 | ↓ | |
| C18:1 | Octadecenoylcarnitine | 0.014 | 0.11 | −1.30 | ↓ | |
| C18:2 | Octadecadienylcarnitine | 0.034 | 0.16 | −1.01 | ↓ | |
| Amino acids | Asn | Asparagine | 0.015 | 0.11 | 1.65 | ↑ |
| Asp | Aspartic acid | 0.040 | 0.17 | −1.43 | ↓ | |
| Gln | Glutamine | 2.8E−03 | 0.06 | 6.09 | ↑ | |
| Glu | Glutamic Acid | 0.044 | 0.18 | −1.28 | ↓ | |
| Phe | Phenylalanine | 0.013 | 0.11 | −1.33 | ↓ | |
| Biogenic amines | Serotonin | Serotonin | 8.0 × 10⁴ | 0.04 | 2.68 | ↑ |
| Glycerophospholipids | lysoPC a C16:0 | Lysophosphatidylcholine a C16:0 | 3.2 × 10³ | 0.06 | −1.37 | ↓ |
| lysoPC a C17:0 | Lysophosphatidylcholine a C17:0 | 0.012 | 0.11 | −1.19 | ↓ | |
| lysoPC a C18:0 | Lysophosphatidylcholine a C18:0 | 0.042 | 0.17 | −1.39 | ↓ | |
| lysoPC a C20:3 | Lysophosphatidylcholine a C20:3 | 0.014 | 0.11 | 1.53 | ↑ | |
| PC aa C32:0 | Phosphatidylcholine aa C32:0 | 1.5 × 10³ | 0.05 | −1.12 | ↓ | |
| PC aa C34:1 | Phosphatidylcholine aa C34:1 | 7.0 × 10⁴ | 0.04 | −1.46 | ↓ | |
| PC aa C34:2 | Phosphatidylcholine aa C34:2 | 0.028 | 0.14 | −1.20 | ↓ | |
| PC aa C36:2 | Phosphatidylcholine aa C36:2 | 0.028 | 0.14 | −1.35 | ↓ | |
| PC aa C36:6 | Phosphatidylcholine aa C36:6 | 8.1 × 10³ | 0.09 | 1.90 | ↑ | |
| PC aa C38:5 | Phosphatidylcholine aa C38:5 | 0.046 | 0.18 | 1.85 | ↑ | |
| PC aa C40:1 | Phosphatidylcholine aa C40:1 | 0.049 | 0.19 | 1.32 | ↑ | |
| PC aa C42:0 | Phosphatidylcholine aa C42:0 | 0.031 | 0.15 | 1.30 | ↑ | |
| PC aa C42:1 | Phosphatidylcholine aa C42:1 | 6.4 × 10³ | 0.08 | 1.46 | ↑ | |
| PC aa C42:2 | Phosphatidylcholine aa C42:2 | 0.019 | 0.12 | 1.36 | ↑ | |
| PC aa C42:6 | Phosphatidylcholine aa C42:6 | 0.016 | 0.11 | 1.45 | ↑ | |
| PC ae C36:0 | Phosphatidylcholine ae C36:0 | 8.1 × 10³ | 0.09 | −1.19 | ↓ | |
| PC ae C40:1 | Phosphatidylcholine ae C40:1 | 4.7 × 10³ | 0.07 | 1.51 | ↑ | |
| PC ae C42:1 | Phosphatidylcholine ae C42:1 | 0.040 | 0.17 | 1.34 | ↑ | |
| PC ae C42:2 | Phosphatidylcholine ae C42:2 | 1.8 × 10³ | 0.05 | 1.50 | ↑ | |
| PC ae C42:3 | Phosphatidylcholine ae C42:3 | 4.7 × 10³ | 0.07 | 1.33 | ↑ | |
| Sphingolipids | SM C16:0 | Sphingomyelin C16:0 | 0.010 | 0.10 | −1.23 | ↓ |
| SM C16:1 | Sphingomyelin C16:1 | 0.026 | 0.14 | −1.22 | ↓ | |
| SM C18:0 | Sphingomyelin C18:0 | 0.015 | 0.11 | −1.33 | ↓ | |
| SM C18:1 | Sphingomyelin C18:1 | 0.030 | 0.15 | −1.32 | ↓ | |
| SM C20:2 | Sphingomyelin C20:2 | 0.024 | 0.14 | −1.43 | ↓ | |
| SM C24:1 | Sphingomyelin C24:1 | 2.2 × 10³ | 0.06 | −1.79 | ↓ | |
| SM C26:1 | Sphingomyelin C26:1 | 5.6 × 10³ | 0.08 | −1.23 | ↓ | |
| (a) | |||
| Metabolic Pathway | Total. Cmpd | Hits | p-Value |
| Pyrimidine Metabolism | 59 | 1 | 3.36 × 10−³ |
| Phenylacetate Metabolism | 9 | 1 | 3.36 × 10−³ |
| Amino Sugar Metabolism | 33 | 2 | 9.47 × 10−³ |
| Nicotinate and Nicotinamide Metabolism | 37 | 2 | 9.47 × 10−³ |
| Urea Cycle | 29 | 7 | 9.58 × 10−³ |
| Aspartate Metabolism | 35 | 6 | 9.70 × 10−³ |
| Glutamate Metabolism | 49 | 5 | 1.25 × 10⁻² |
| Purine Metabolism | 74 | 4 | 1.30 × 10⁻² |
| Ammonia Recycling | 32 | 7 | 1.37 × 10⁻² |
| Phenylalanine and Tyrosine Metabolism | 28 | 3 | 3.14 × 10⁻² |
| Beta-Alanine Metabolism | 34 | 3 | 3.26 × 10⁻² |
| Malate-Aspartate Shuttle | 10 | 2 | 3.32 × 10⁻² |
| Tyrosine Metabolism | 72 | 3 | 3.36 × 10⁻² |
| Histidine Metabolism | 43 | 2 | 3.41 × 10⁻² |
| Cysteine Metabolism | 26 | 1 | 3.47 × 10⁻² |
| Folate Metabolism | 29 | 1 | 3.47 × 10⁻² |
| Arachidonic Acid Metabolism | 69 | 2 | 3.47 × 10⁻² |
| Lysine Degradation | 30 | 2 | 3.56 × 10⁻² |
| Propanoate Metabolism | 42 | 2 | 3.72 × 10⁻² |
| Valine, Leucine, and Isoleucine Degradation | 60 | 4 | 4.05 × 10⁻² |
| Tryptophan Metabolism | 60 | 5 | 4.09 × 10⁻² |
| Arginine and Proline Metabolism | 53 | 7 | 4.86 × 10⁻² |
| Phospholipid Biosynthesis | 29 | 2 | 4.94 × 10⁻² |
| Glutathione Metabolism | 21 | 3 | 5.48 × 10⁻² |
| Alanine Metabolism | 17 | 3 | 5.48 × 10⁻² |
| (b) | |||
| Metabolic Pathway | Total. Cmpd | Hits | p-Value |
| Pyrimidine Metabolism | 59 | 1 | 5.06 × 10⁻⁶ |
| Phenylacetate Metabolism | 9 | 1 | 5.06 × 10⁻⁶ |
| Aspartate Metabolism | 35 | 6 | 4.64 × 10⁻⁵ |
| Amino Sugar Metabolism | 33 | 2 | 4.95 × 10⁻⁵ |
| Nicotinate and Nicotinamide Metabolism | 37 | 2 | 4.95 × 10⁻⁵ |
| Urea Cycle | 29 | 7 | 6.06 × 10⁻⁵ |
| Purine Metabolism | 74 | 4 | 6.36 × 10⁻⁵ |
| Ammonia Recycling | 32 | 7 | 6.68 × 10⁻⁵ |
| Glutamate Metabolism | 49 | 5 | 7.95 × 10⁻⁵ |
| Lysine Degradation | 30 | 2 | 6.69 × 10⁻⁵ |
| Valine, Leucine, and Isoleucine Degradation | 60 | 4 | 6.69 × 10⁻⁴ |
| Phenylalanine and Tyrosine Metabolism | 28 | 3 | 6.72 × 10⁻⁴ |
| Propanoate Metabolism | 42 | 2 | 6.79 × 10⁻⁴ |
| Histidine Metabolism | 43 | 2 | 6.93 × 10⁻⁴ |
| Beta-Alanine Metabolism | 34 | 3 | 7.09 × 10⁻⁴ |
| Cysteine Metabolism | 26 | 1 | 7.17 × 10⁻⁴ |
| Folate Metabolism | 29 | 1 | 7.17 × 10⁻⁴ |
| Arachidonic Acid Metabolism | 69 | 2 | 7.17 × 10⁻⁴ |
| Malate-Aspartate Shuttle | 10 | 2 | 7.34 × 10⁻⁴ |
| Tyrosine Metabolism | 72 | 3 | 7.41 × 10⁻⁴ |
| Tryptophan Metabolism | 60 | 5 | 1.07 × 10⁻³ |
| Arginine and Proline Metabolism | 53 | 7 | 1.37 × 10⁻³ |
| Glutathione Metabolism | 21 | 3 | 1.70 × 10⁻³ |
| Alanine Metabolism | 17 | 3 | 1.70 × 10⁻³ |
| Glycine and Serine Metabolism | 59 | 8 | 2.29 × 10⁻³ |
| Phospholipid Biosynthesis | 29 | 2 | 1.70 × 10⁻³ |
| Patients | Class | CRP | CA19-9 | Stage (1/2/3/4) | Metastasis (yes/no) | ||||
|---|---|---|---|---|---|---|---|---|---|
| Metabolite | Correlation Coefficient | Metabolite | Correlation Coefficient | Metabolite | Correlation Coefficient | Metabolite | Correlation Coefficient | ||
| PDAC | Glyceropfospholipids | PC ae C38:0 | −0.6 | lysoPC a C24:0 | 0.63 | lysoPC a C24:0 | 0.57 | ||
| PC ae C40:5 | −0.56 | lysoPC a C26:0 | 0.73 | lysoPC a C26:0 | 0.62 | ||||
| lysoPC a C26:1 | 0.71 | lysoPC a C28:0 | 0.59 | ||||||
| lysoPC a C28:0 | 0.7 | PC aa C24:0 | 0.58 | ||||||
| lysoPC a C28:1 | 0.71 | PC aa C36:0 | 0.57 | ||||||
| PC aa C24:0 | 0.65 | PC ae C40:3 | 0.58 | ||||||
| PC aa C42:0 | 0.63 | ||||||||
| PC aa C42:1 | 0.68 | ||||||||
| PC ae C30:2 | 0.65 | ||||||||
| PC ae C42:2 | 0.61 | ||||||||
| Sphingolipids | SM OH C14:1 | 0.69 | SM C18:0 | 0.6 | SM OH C14:1 | 0.57 | |||
| SM OH C16:1 | 0.57 | ||||||||
| Acylcarnitines | C18:1 | 0.59 | C16-OH | 0.71 | C14:1 | 0.61 | C3-DC (C4 OH) | 0.54 | |
| C4:1 | 0.55 | ||||||||
| C14:2 | 0.63 | ||||||||
| C16-OH | 0.58 | ||||||||
| Amino acids | Ala | −0.54 | Phe | 0.63 | |||||
| Phe | 0.59 | ||||||||
| Biogenic amines | t4-OH-Pro | −0.55 | |||||||
| PNET | Glyceropfospholipids | lysoPC a C26:0 | −0.84 | PC aa C32:2 | −0.83 | PC aa C32:1 | 0.57 | ||
| lysoPC a C28:0 | −0.88 | PC aa C34:1 | −0.79 | PC aa C32:2 | 0.54 | ||||
| lysoPC a C28:1 | −0.72 | PC aa C34:4 | −0.9 | PC ae C34:3 | 0.51 | ||||
| PC aa C24:0 | −0.84 | PC aa C36:1 | −0.81 | ||||||
| PC ae C38:1 | −0.71 | PC aa C36:2 | −0.75 | ||||||
| PC ae C38:2 | −0.85 | PC aa C36:5 | −0.83 | ||||||
| PC aa C36:6 | −0.86 | ||||||||
| PC aa C38:5 | −0.81 | ||||||||
| PC aa C40:3 | −0.76 | ||||||||
| PC aa C40:4 | −0.81 | ||||||||
| PC aa C40:5 | −0.83 | ||||||||
| PC aa C40:6 | −0.86 | ||||||||
| PC aa C42:4 | −0.71 | ||||||||
| PC ae C44:3 | −0.74 | ||||||||
| Sphingolipids | SM OH C22:1 | −0.76 | SM C20:2 | 0.56 | |||||
| SM C24:0 | −0.74 | SM C26:0 | 0.59 | ||||||
| Acylcarnitines | C2 | 0.61 | C3-DC C4-OH | 0.56 | |||||
| C3-DC (C4 OH) | 0.56 | ||||||||
| C14:2-OH | 0.62 | ||||||||
| Amino acids | Asn | 0.69 | Orn | 0.71 | Asn Gly | 0.63 0.55 | |||
| Biogenic amines | Kynurenine | −0.56 | |||||||
| Met SO | 0.92 | t4-OH-Pro | 0.64 | ||||||
Disclaimer/Publisher’s Note: The statements, opinions and data contained in all publications are solely those of the individual author(s) and contributor(s) and not of MDPI and/or the editor(s). MDPI and/or the editor(s) disclaim responsibility for any injury to people or property resulting from any ideas, methods, instructions or products referred to in the content. |
© 2023 by the authors. Licensee MDPI, Basel, Switzerland. This article is an open access article distributed under the terms and conditions of the Creative Commons Attribution (CC BY) license (https://creativecommons.org/licenses/by/4.0/).
Share and Cite
Skubisz, K.; Dąbkowski, K.; Samborowska, E.; Starzyńska, T.; Deskur, A.; Ambrozkiewicz, F.; Karczmarski, J.; Radkiewicz, M.; Kusnierz, K.; Kos-Kudła, B.; et al. Serum Metabolite Biomarkers for Pancreatic Tumors: Neuroendocrine and Pancreatic Ductal Adenocarcinomas—A Preliminary Study. Cancers 2023, 15, 3242. https://doi.org/10.3390/cancers15123242
Skubisz K, Dąbkowski K, Samborowska E, Starzyńska T, Deskur A, Ambrozkiewicz F, Karczmarski J, Radkiewicz M, Kusnierz K, Kos-Kudła B, et al. Serum Metabolite Biomarkers for Pancreatic Tumors: Neuroendocrine and Pancreatic Ductal Adenocarcinomas—A Preliminary Study. Cancers. 2023; 15(12):3242. https://doi.org/10.3390/cancers15123242
Chicago/Turabian StyleSkubisz, Karolina, Krzysztof Dąbkowski, Emilia Samborowska, Teresa Starzyńska, Anna Deskur, Filip Ambrozkiewicz, Jakub Karczmarski, Mariusz Radkiewicz, Katarzyna Kusnierz, Beata Kos-Kudła, and et al. 2023. "Serum Metabolite Biomarkers for Pancreatic Tumors: Neuroendocrine and Pancreatic Ductal Adenocarcinomas—A Preliminary Study" Cancers 15, no. 12: 3242. https://doi.org/10.3390/cancers15123242