
Discordant and Converting Receptor Expressions in Brain Metastases from Breast Cancer: MRI-Based Non-Invasive Receptor Status Tracking
 , , , ,
Abstract
:Simple Summary
Abstract
1. Introduction
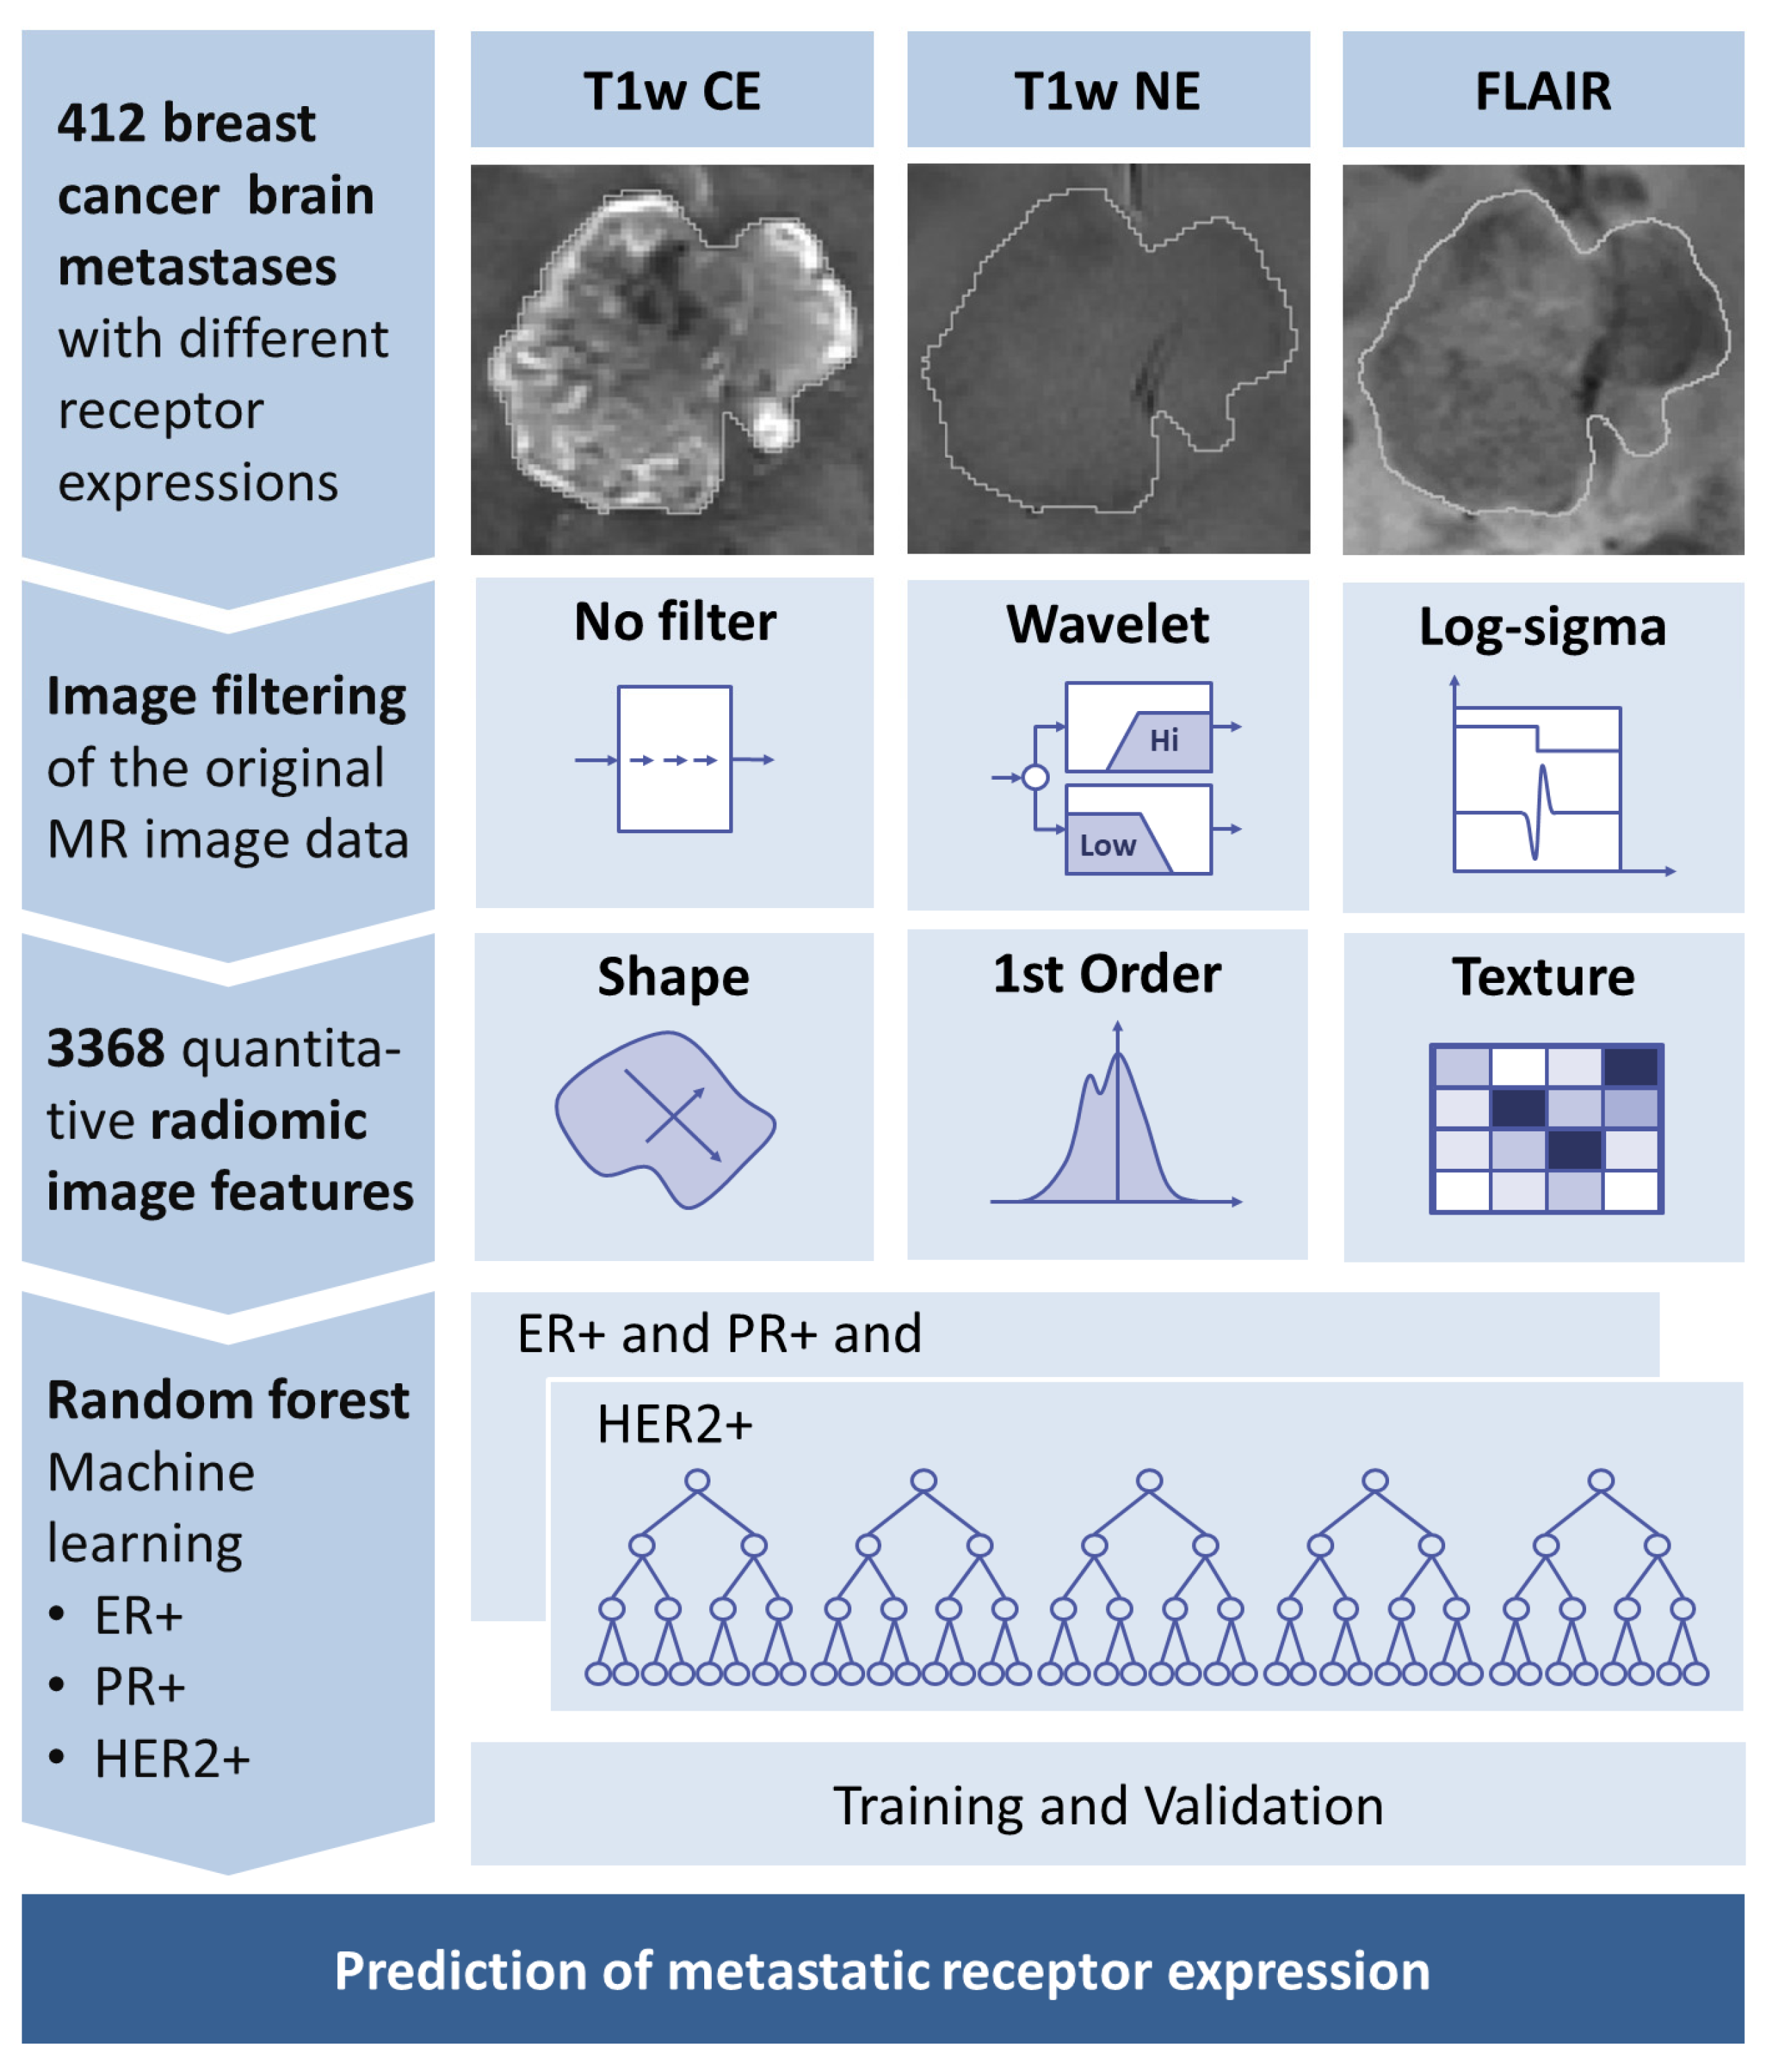
2. Materials and Methods
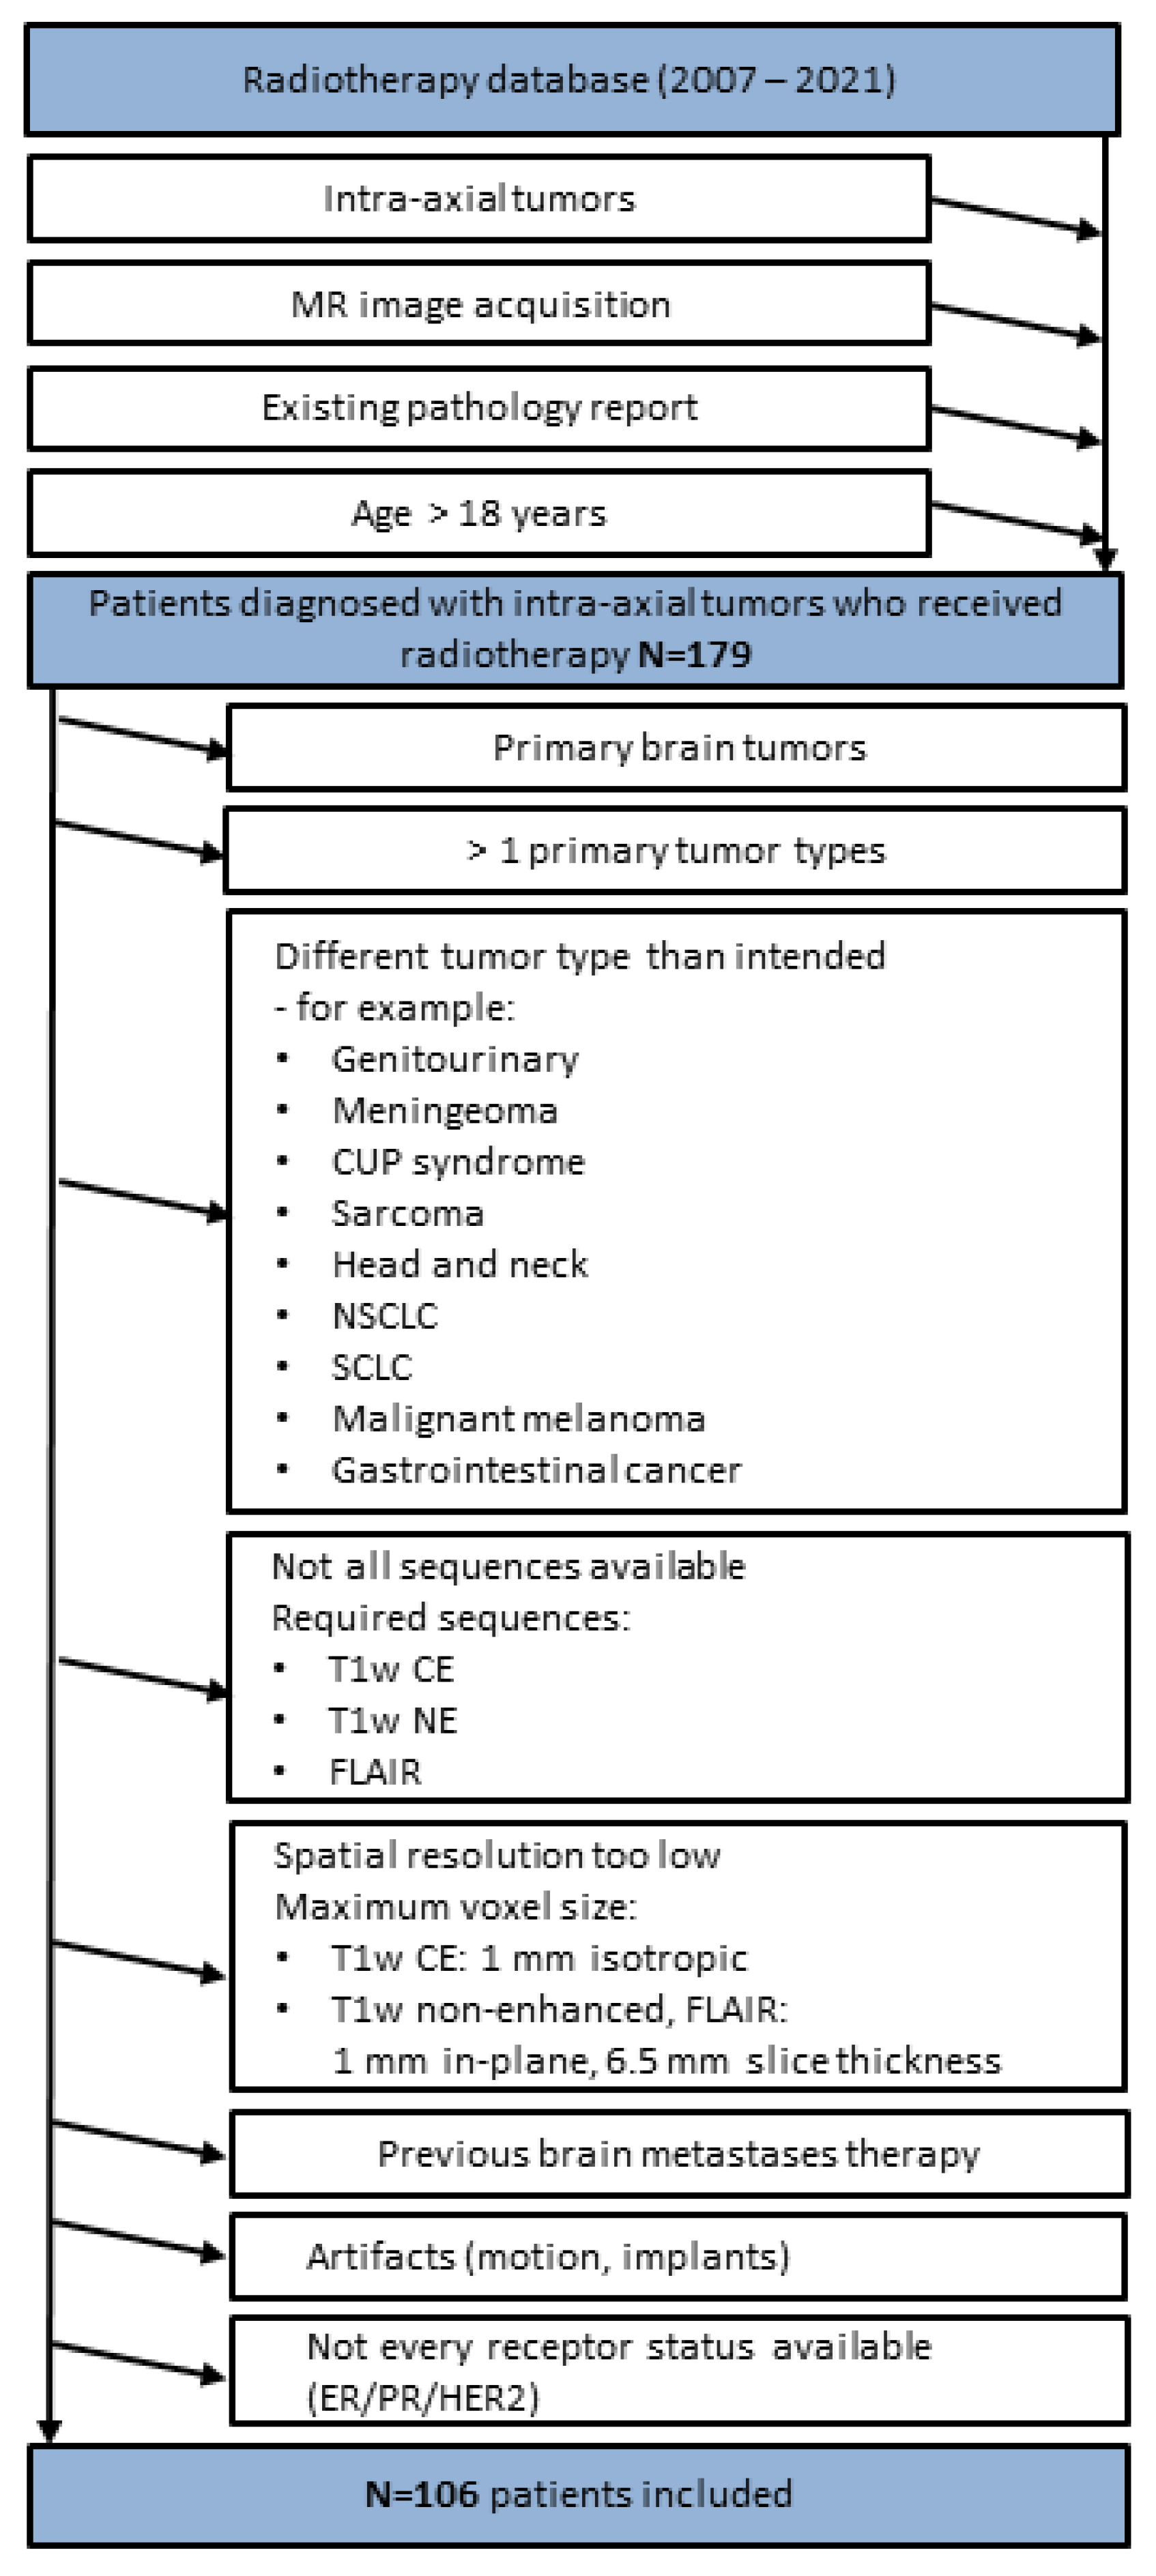
2.1. Patients
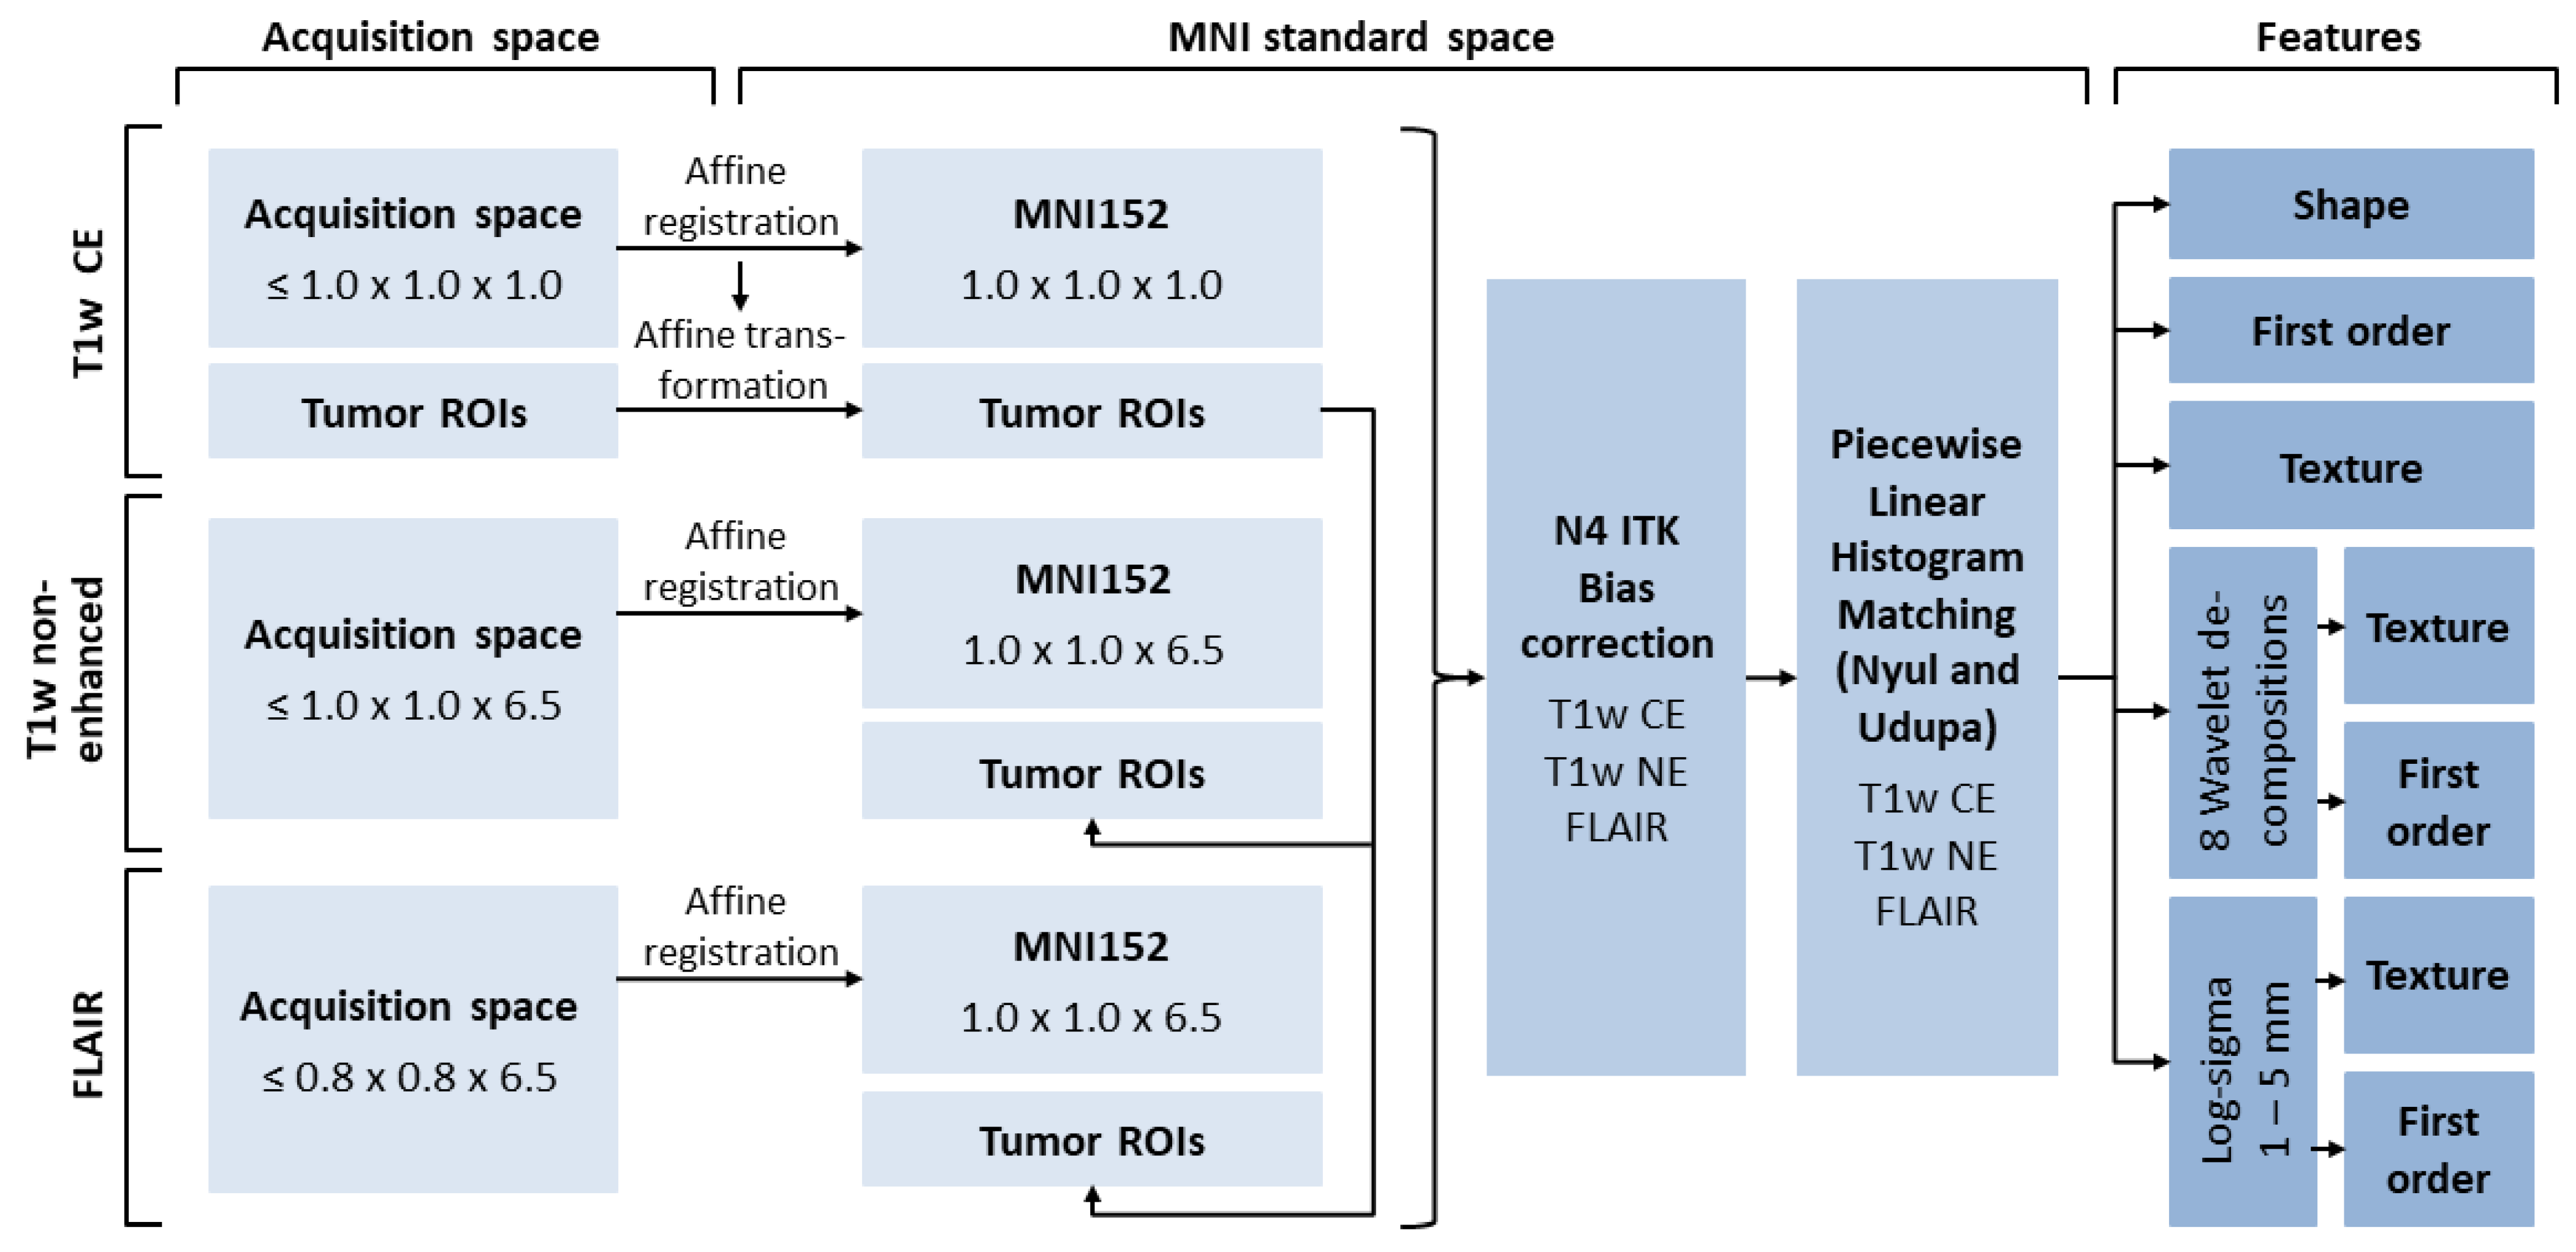
2.2. Image Acquisition
2.3. Tumor Segmentation
2.4. Image Post-Processing
2.5. Feature Extraction
2.6. Machine Learning
2.7. Feature Selection
2.8. Model Hyperparameters, Training, and Testing
2.9. Statistics
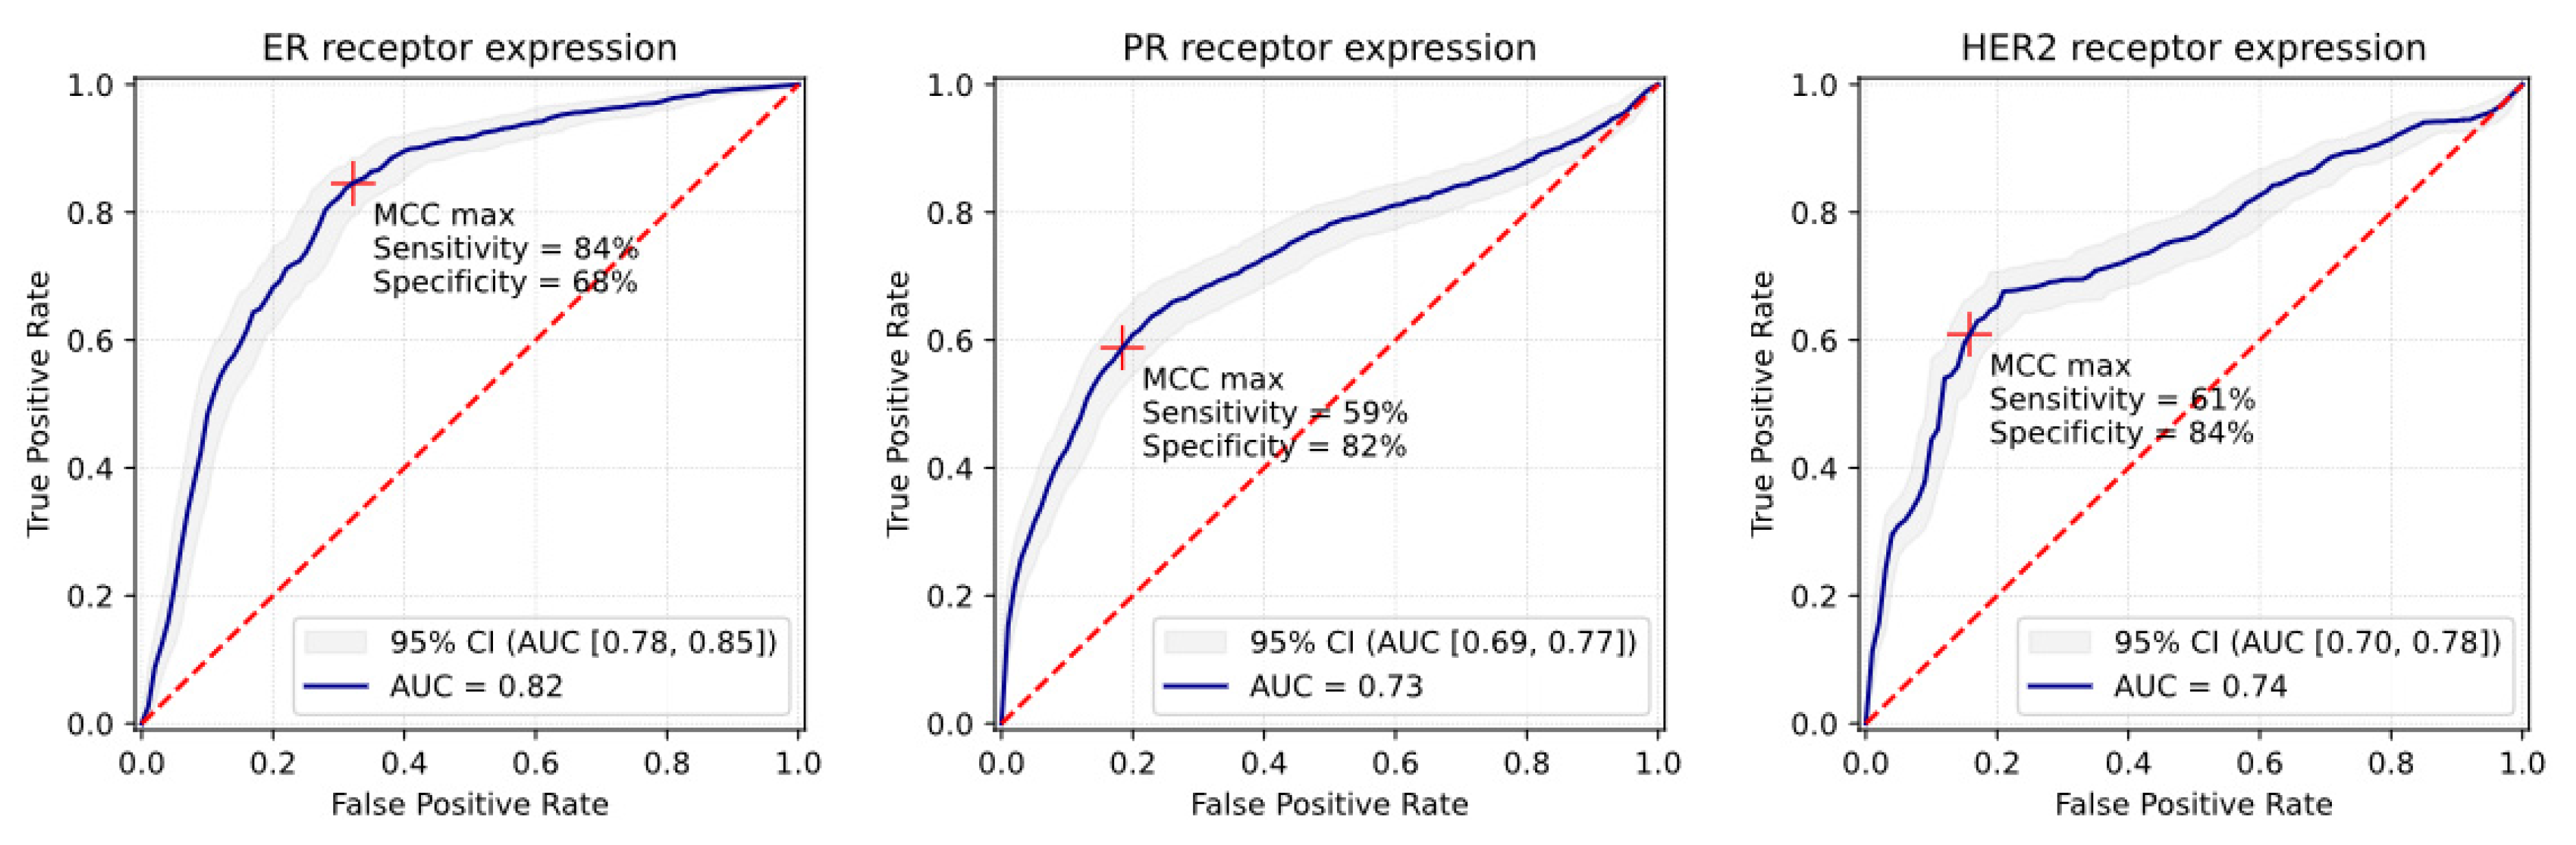
3. Results
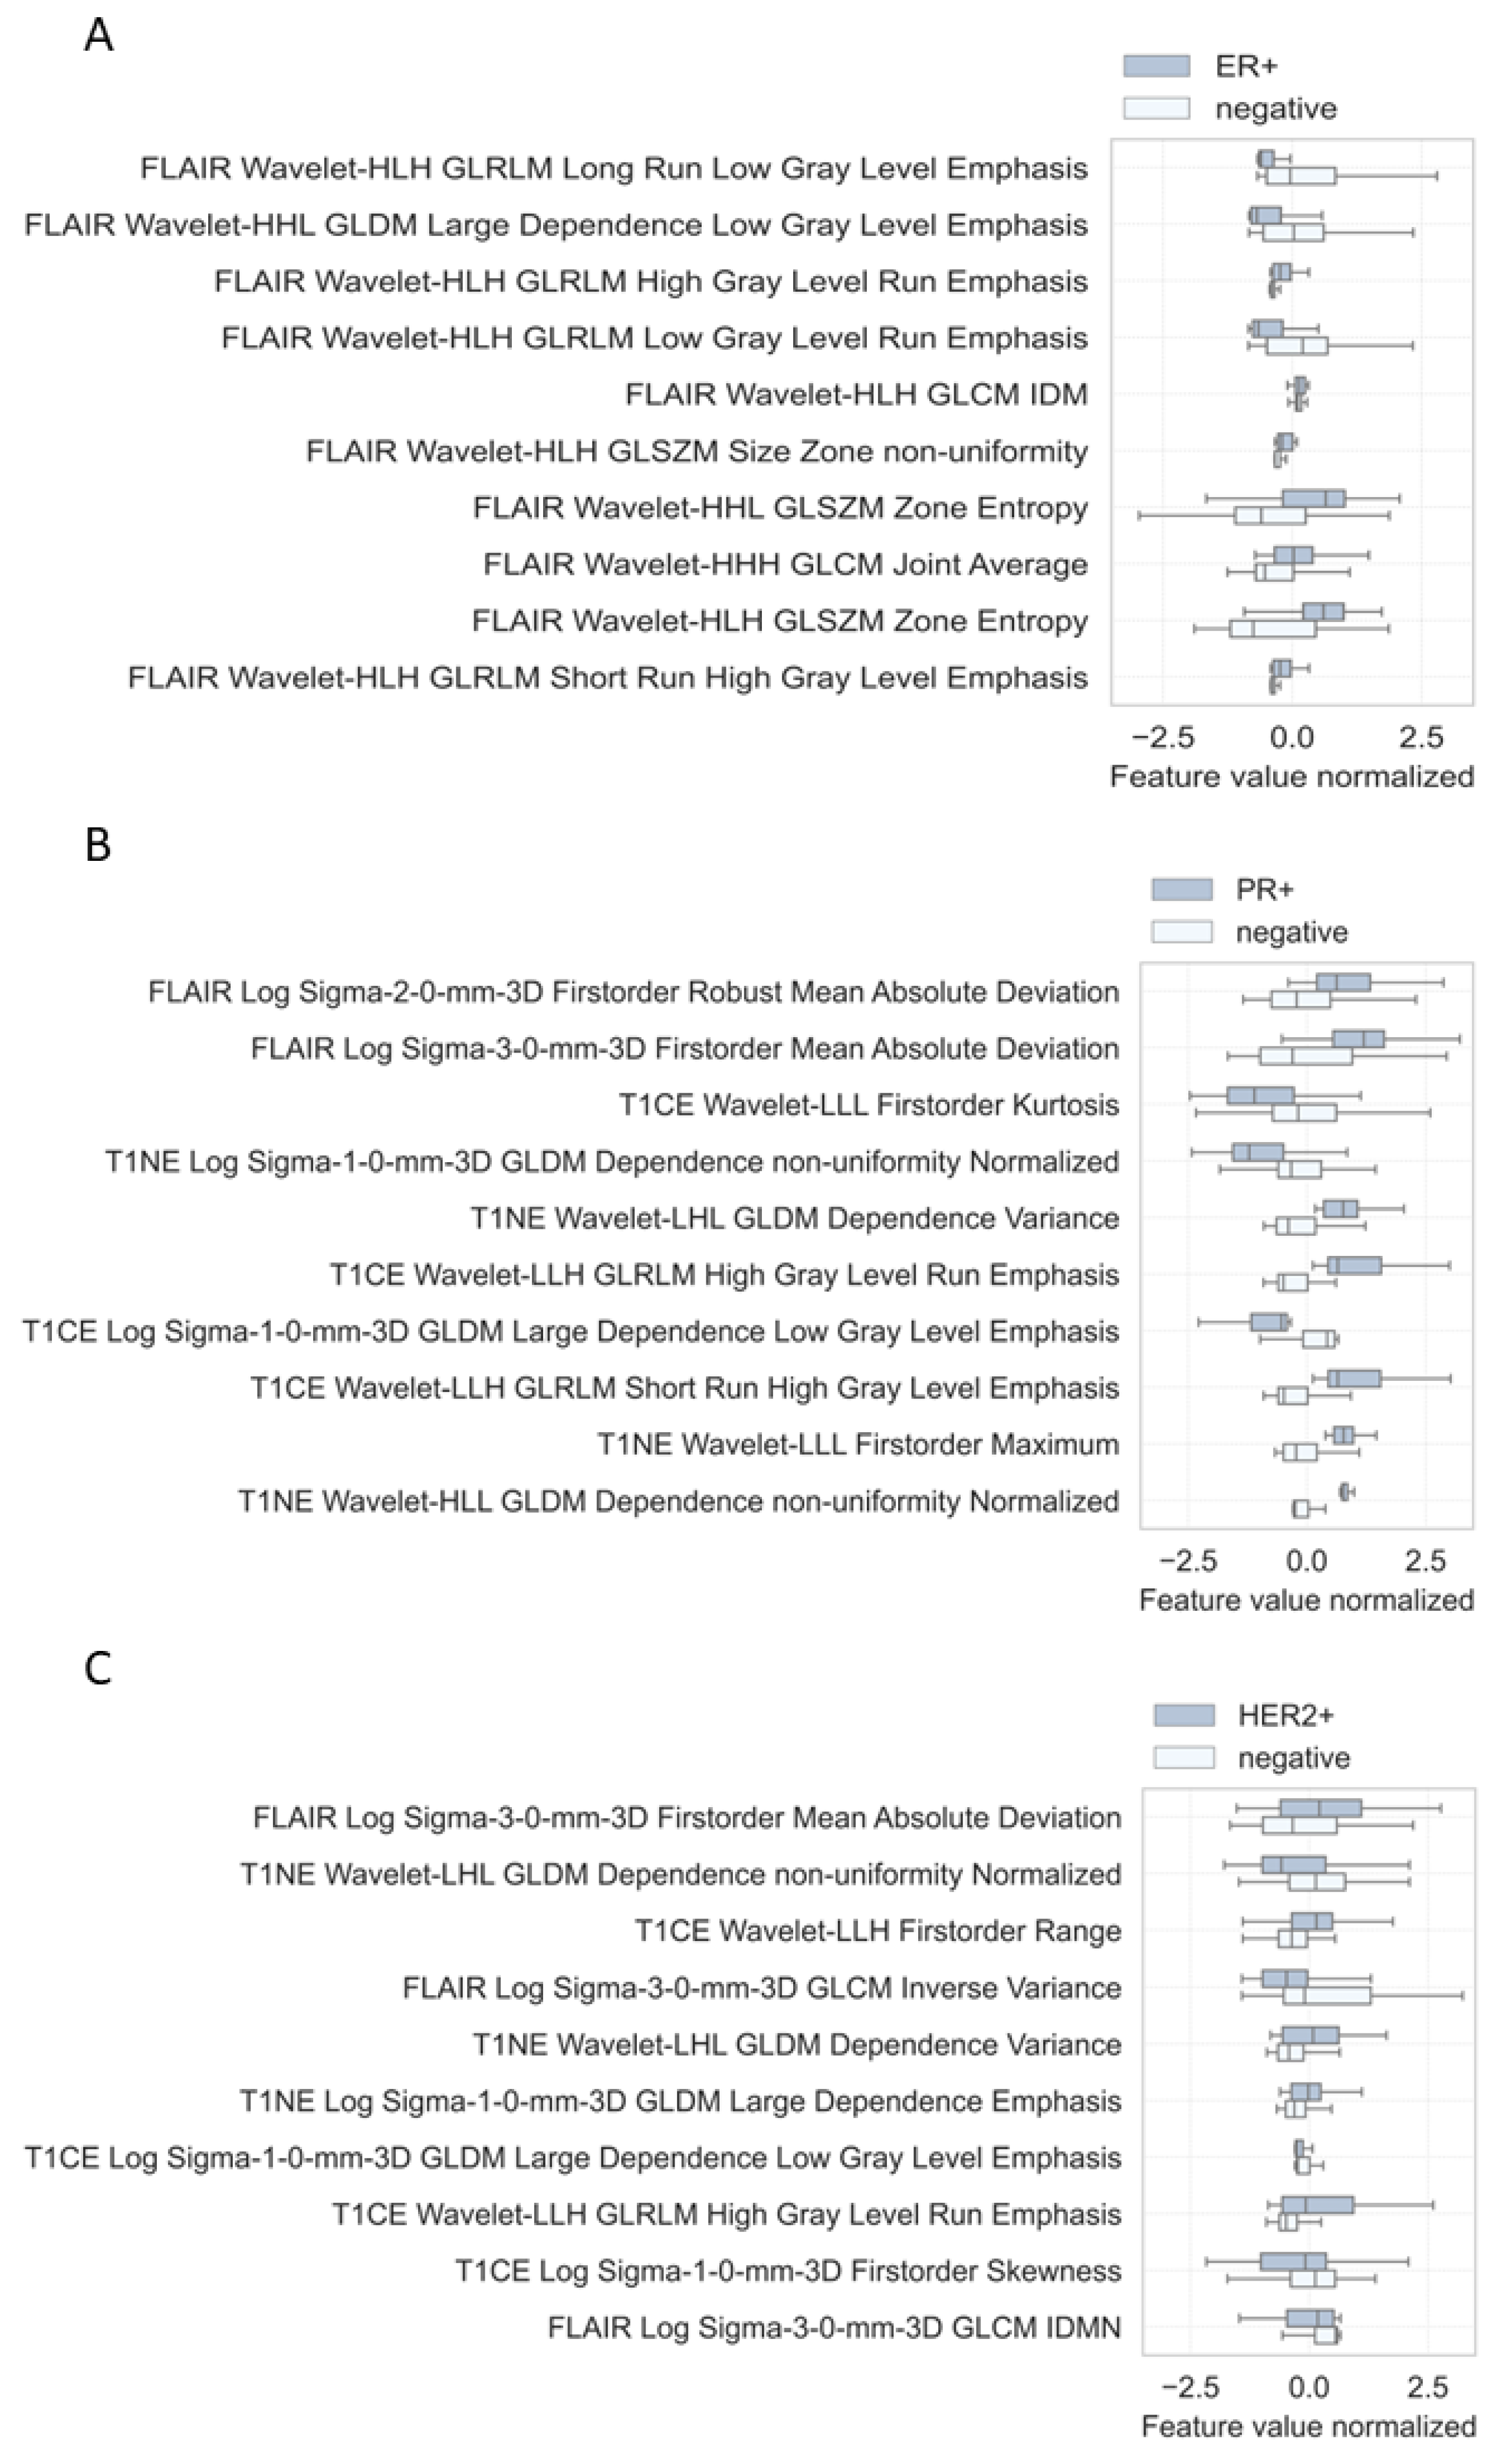
3.1. ER Receptor
3.2. PR Receptor
3.3. HER2 Receptor
3.4. Triple-Negative
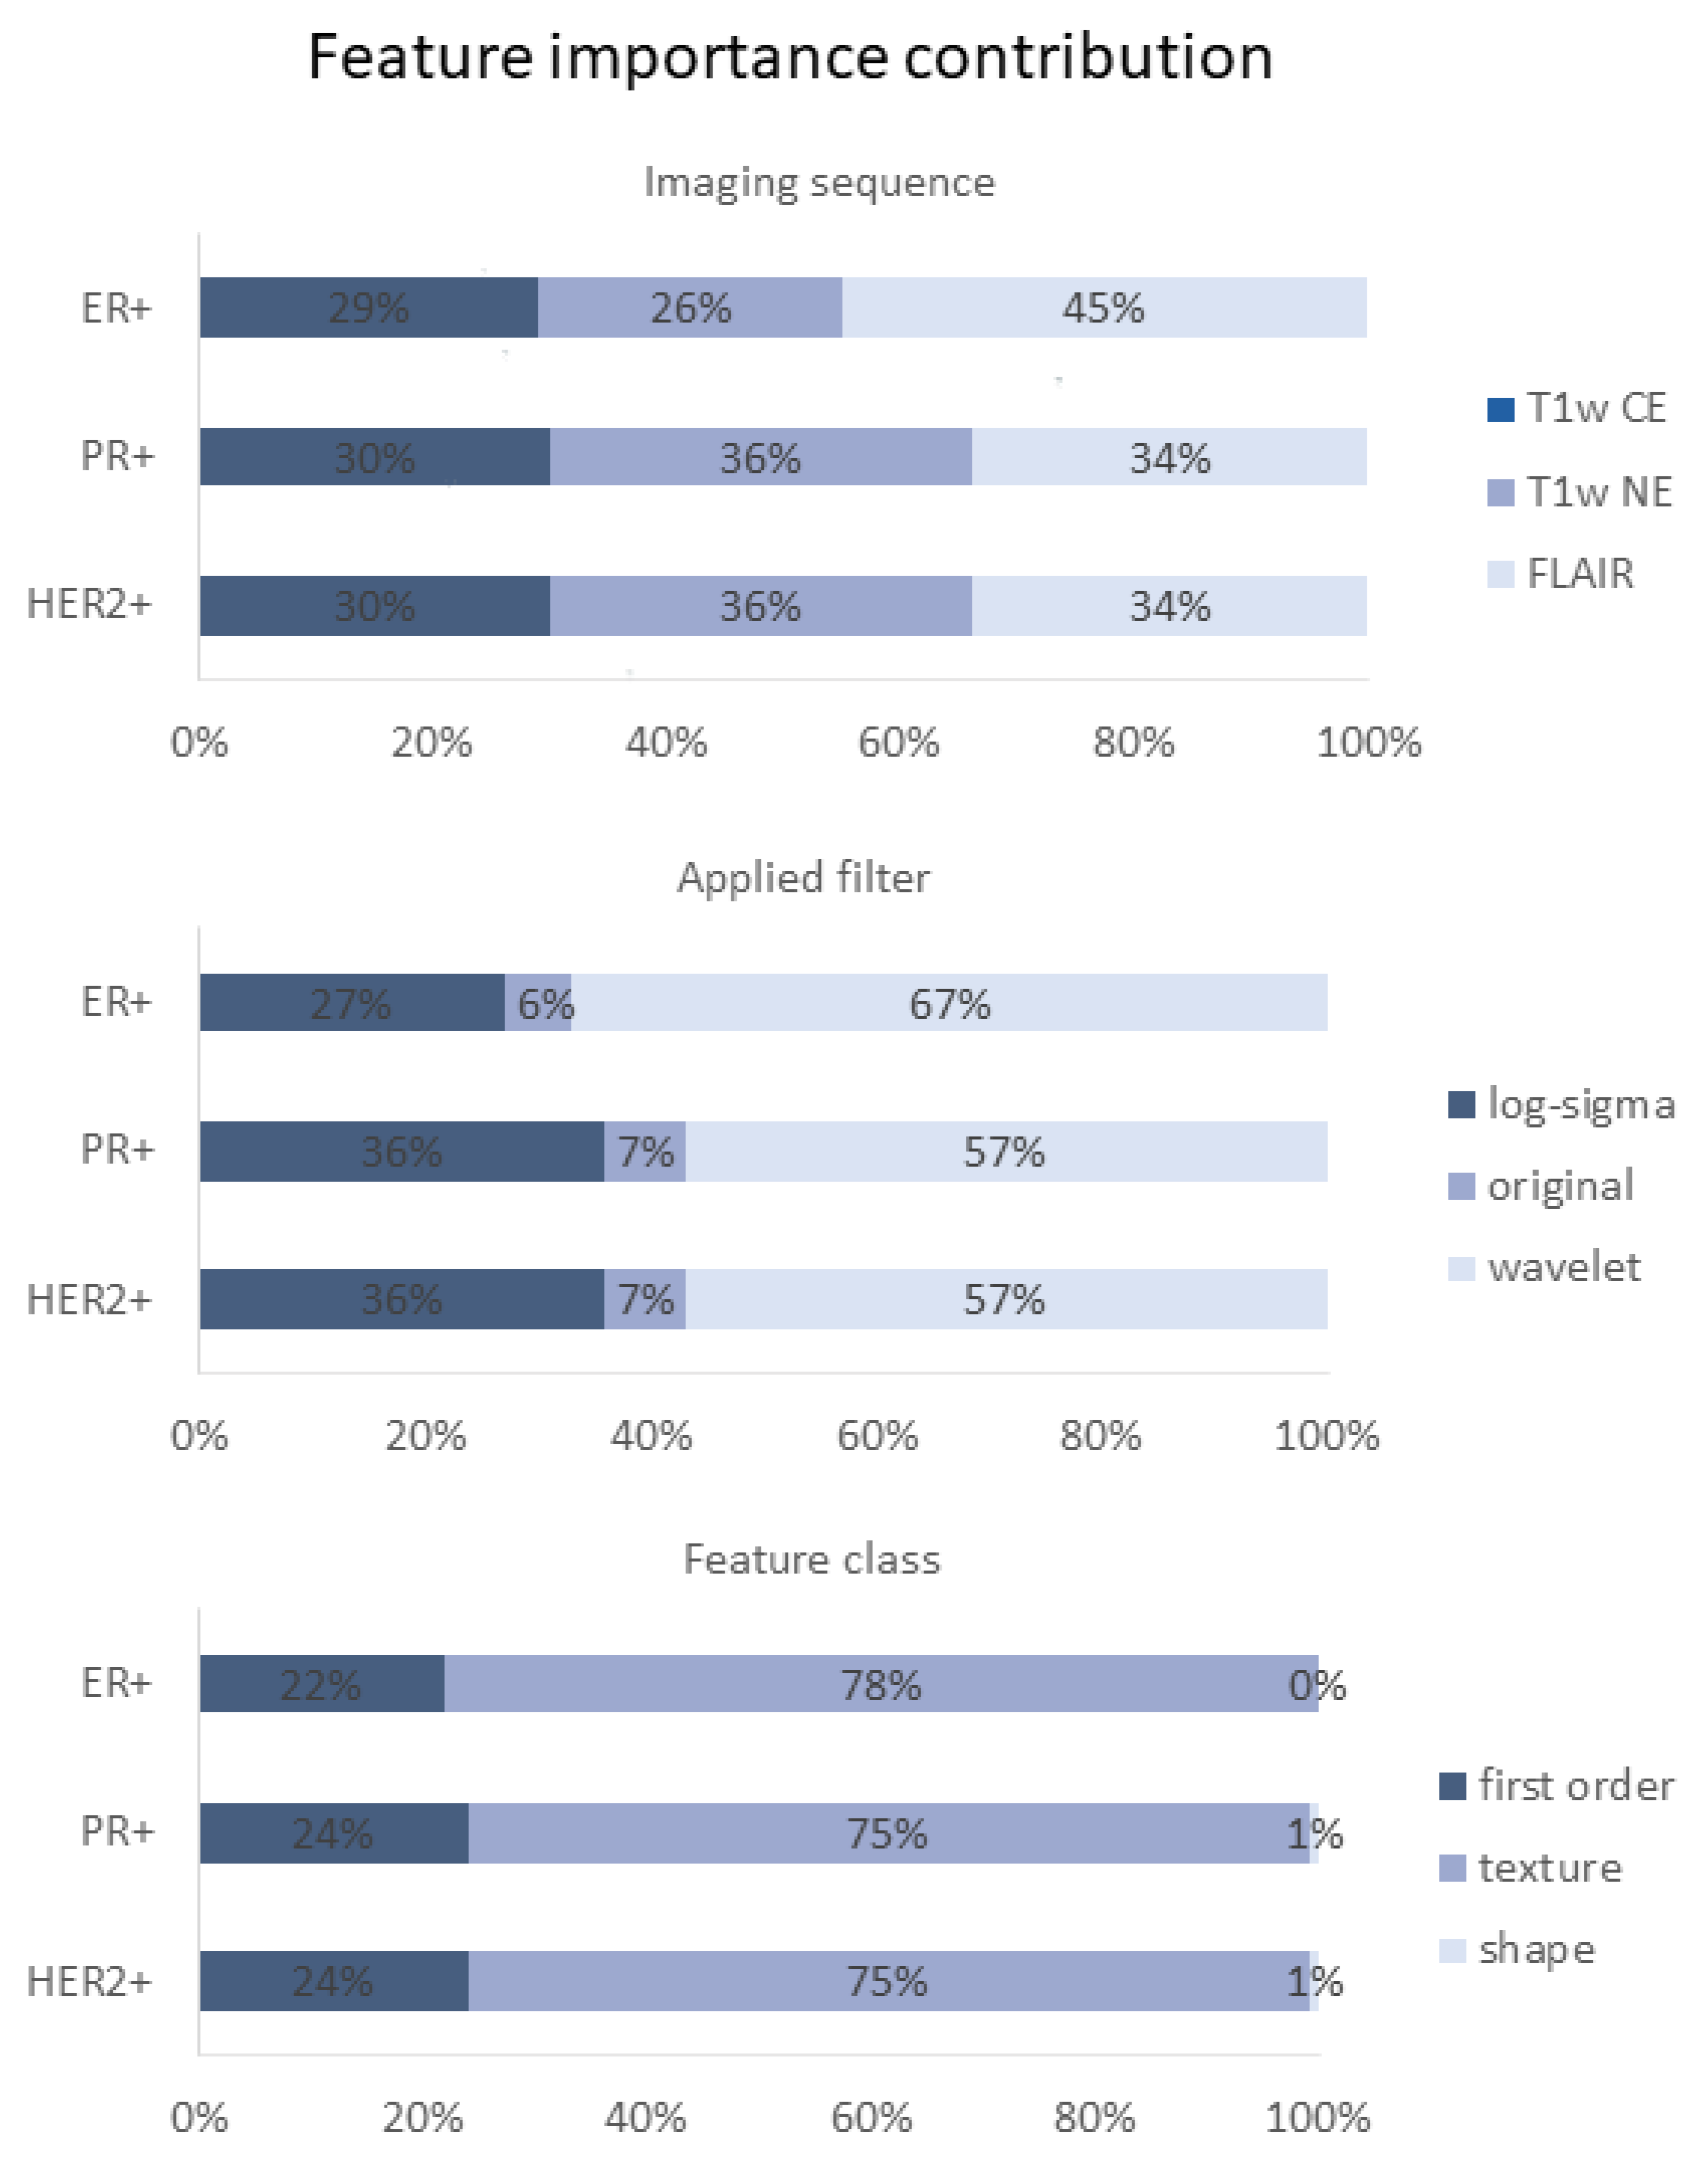
3.5. Feature Importance
4. Discussion
5. Conclusions
Author Contributions
Funding
Institutional Review Board Statement
Informed Consent Statement
Data Availability Statement
Conflicts of Interest
References
- Cardoso, F.; Paluch-Shimon, S.; Senkus, E.; Curigliano, G.; Aapro, M.S.; Andre, F.; Barrios, C.H.; Bergh, J.; Bhattacharyya, G.S.; Biganzoli, L.; et al. 5th ESO-ESMO international consensus guidelines for advanced breast cancer (ABC 5). Ann. Oncol. 2020, 31, 1623–1649. [Google Scholar] [CrossRef] [PubMed]
- Wang, Y.; Ye, F.; Liang, Y.; Yang, Q. Breast cancer brain metastasis: Insight into molecular mechanisms and therapeutic strategies. Br. J. Cancer 2021, 125, 1056–1067. [Google Scholar] [CrossRef] [PubMed]
- Chamberlain, M.C.; Baik, C.S.; Gadi, V.K.; Bhatia, S.; Chow, L.Q. Systemic therapy of brain metastases: Non-small cell lung cancer, breast cancer, and melanoma. Neuro Oncol. 2017, 19, i1–i24. [Google Scholar] [CrossRef] [PubMed]
- Hosonaga, M.; Saya, H.; Arima, Y. Molecular and cellular mechanisms underlying brain metastasis of breast cancer. Cancer Metastasis Rev. 2020, 39, 711–720. [Google Scholar] [CrossRef]
- Gennari, A.; Andre, F.; Barrios, C.H.; Cortes, J.; de Azambuja, E.; DeMichele, A.; Dent, R.; Fenlon, D.; Gligorov, J.; Hurvitz, S.A.; et al. ESMO Clinical Practice Guideline for the diagnosis, staging and treatment of patients with metastatic breast cancer. Ann. Oncol. 2021, 32, 1475–1495. [Google Scholar] [CrossRef]
- Schrijver, W.; Selenica, P.; Lee, J.Y.; Ng, C.K.Y.; Burke, K.A.; Piscuoglio, S.; Berman, S.H.; Reis-Filho, J.S.; Weigelt, B.; van Diest, P.J.; et al. Mutation Profiling of Key Cancer Genes in Primary Breast Cancers and Their Distant Metastases. Cancer Res. 2018, 78, 3112–3121. [Google Scholar] [CrossRef]
- Schrijver, W.; Suijkerbuijk, K.P.M.; van Gils, C.H.; van der Wall, E.; Moelans, C.B.; van Diest, P.J. Receptor Conversion in Distant Breast Cancer Metastases: A Systematic Review and Meta-analysis. J. Natl. Cancer Inst. 2018, 110, 568–580. [Google Scholar] [CrossRef]
- Hoefnagel, L.D.; van der Groep, P.; van de Vijver, M.J.; Boers, J.E.; Wesseling, P.; Wesseling, J.; Dutch Distant Breast Cancer Metastases, C.; van der Wall, E.; van Diest, P.J. Discordance in ERalpha, PR and HER2 receptor status across different distant breast cancer metastases within the same patient. Ann. Oncol. 2013, 24, 3017–3023. [Google Scholar] [CrossRef]
- Kroigard, A.B.; Larsen, M.J.; Thomassen, M.; Kruse, T.A. Molecular Concordance Between Primary Breast Cancer and Matched Metastases. Breast J. 2016, 22, 420–430. [Google Scholar] [CrossRef]
- Michel, A.; Oppong, M.D.; Rauschenbach, L.; Pierscianek, D.; Dinger, T.F.; Schmidt, T.; Hense, J.; Pottgen, C.; Kimmig, R.; Ahmadipour, Y.; et al. HER2 Receptor Conversion Is a strong Survival Predictor in Patients with Breast Cancer Brain Metastases. World Neurosurg. 2021, 152, e332–e343. [Google Scholar] [CrossRef]
- Yi, Z.B.; Yu, P.; Zhang, S.; Wang, W.N.; Han, Y.Q.; Ouyang, Q.C.; Yan, M.; Wang, X.J.; Hu, X.C.; Jiang, Z.F.; et al. Profile and outcome of receptor conversion in breast cancer metastases: A nation-wide multicenter epidemiological study. Int. J. Cancer 2021, 148, 692–701. [Google Scholar] [CrossRef] [PubMed]
- Aurilio, G.; Monfardini, L.; Rizzo, S.; Sciandivasci, A.; Preda, L.; Bagnardi, V.; Disalvatore, D.; Pruneri, G.; Munzone, E.; Della Vigna, P.; et al. Discordant hormone receptor and human epidermal growth factor receptor 2 status in bone metastases compared to primary breast cancer. Acta Oncol. 2013, 52, 1649–1656. [Google Scholar] [CrossRef]
- Zhao, W.; Sun, L.; Dong, G.; Wang, X.; Jia, Y.; Tong, Z. Receptor conversion impacts outcomes of different molecular subtypes of primary breast cancer. Ther. Adv. Med. Oncol. 2021, 13, 17588359211012982. [Google Scholar] [CrossRef]
- Yang, M.; Forbes, M.E.; Bitting, R.L.; O’Neill, S.S.; Chou, P.C.; Topaloglu, U.; Miller, L.D.; Hawkins, G.A.; Grant, S.C.; DeYoung, B.R.; et al. Incorporating blood-based liquid biopsy information into cancer staging: Time for a TNMB system? Ann. Oncol. 2018, 29, 311–323. [Google Scholar] [CrossRef] [PubMed]
- Nofech-Mozes, S.; Vella, E.T.; Dhesy-Thind, S.; Hagerty, K.L.; Mangu, P.B.; Temin, S.; Hanna, W.M. Systematic review on hormone receptor testing in breast cancer. Appl. Immunohistochem. Mol. Morphol. 2012, 20, 214–263. [Google Scholar] [CrossRef] [PubMed]
- Nofech-Mozes, S.; Vella, E.T.; Dhesy-Thind, S.; Hanna, W.M. Cancer care Ontario guideline recommendations for hormone receptor testing in breast cancer. Clin. Oncol. 2012, 24, 684–696. [Google Scholar] [CrossRef]
- Wolff, A.C.; Hammond, M.E.; Hayes, D.F. Re: Predictability of adjuvant trastuzumab benefit in N9831 patients using the ASCO/CAP HER2-positivity criteria. J. Natl. Cancer Inst. 2012, 104, 957–958. [Google Scholar] [CrossRef]
- Iglesias, J.E.; Liu, C.Y.; Thompson, P.M.; Tu, Z. Robust brain extraction across datasets and comparison with publicly available methods. IEEE Trans. Med. Imaging 2011, 30, 1617–1634. [Google Scholar] [CrossRef]
- Fonov, V.; Evans, A.C.; Botteron, K.; Almli, C.R.; McKinstry, R.C.; Collins, D.L.; Brain Development Cooperative Group. Unbiased average age-appropriate atlases for pediatric studies. Neuroimage 2011, 54, 313–327. [Google Scholar] [CrossRef]
- Modat, M.; Cash, D.M.; Daga, P.; Winston, G.P.; Duncan, J.S.; Ourselin, S. Global image registration using a symmetric block-matching approach. J. Med. Imaging 2014, 1, 024003. [Google Scholar] [CrossRef]
- Tustison, N.J.; Avants, B.B.; Cook, P.A.; Zheng, Y.; Egan, A.; Yushkevich, P.A.; Gee, J.C. N4ITK: Improved N3 bias correction. IEEE Trans. Med. Imaging 2010, 29, 1310–1320. [Google Scholar] [CrossRef] [PubMed]
- Reinhold, J.C.; Dewey, B.E.; Carass, A.; Prince, J.L. Evaluating the Impact of Intensity Normalization on MR Image Synthesis. In Proceedings of the SPIE Medical Imaging, San Diego, CA, USA, 16–21 February 2019; Volume 10949. [Google Scholar] [CrossRef]
- van Griethuysen, J.J.M.; Fedorov, A.; Parmar, C.; Hosny, A.; Aucoin, N.; Narayan, V.; Beets-Tan, R.G.H.; Fillion-Robin, J.C.; Pieper, S.; Aerts, H. Computational Radiomics System to Decode the Radiographic Phenotype. Cancer Res. 2017, 77, e104–e107. [Google Scholar] [CrossRef] [PubMed]
- Abraham, A.; Pedregosa, F.; Eickenberg, M.; Gervais, P.; Mueller, A.; Kossaifi, J.; Gramfort, A.; Thirion, B.; Varoquaux, G. Machine learning for neuroimaging with scikit-learn. Front. Neuroinform. 2014, 8, 14. [Google Scholar] [CrossRef] [PubMed]
- Breiman, L. Random forests. Mach. Learn. 2001, 45, 5–32. [Google Scholar] [CrossRef]
- Sarica, A.; Cerasa, A.; Quattrone, A. Random Forest Algorithm for the Classification of Neuroimaging Data in Alzheimer’s Disease: A Systematic Review. Front. Aging Neurosci. 2017, 9, 329. [Google Scholar] [CrossRef] [PubMed]
- Karpievitch, Y.V.; Hill, E.G.; Leclerc, A.P.; Dabney, A.R.; Almeida, J.S. An introspective comparison of random forest-based classifiers for the analysis of cluster-correlated data by way of RF++. PLoS ONE 2009, 4, e7087. [Google Scholar] [CrossRef]
- Louppe, G. Understanding variable importances in forests of randomized trees. In Proceedings of the Advances in Neural Information Processing Systems 26, Lake Tahoe, NV, USA, 5–8 December 2013. [Google Scholar]
- Gresser, E.; Schachtner, B.; Stuber, A.T.; Solyanik, O.; Schreier, A.; Huber, T.; Froelich, M.F.; Magistro, G.; Kretschmer, A.; Stief, C.; et al. Performance variability of radiomics machine learning models for the detection of clinically significant prostate cancer in heterogeneous MRI datasets. Quant. Imaging Med. Surg. 2022, 12, 4990–5003. [Google Scholar] [CrossRef]
- Rigatti, S.J. Random forest. J. Insur. Med. 2017, 47, 31–39. [Google Scholar] [CrossRef]
- Limkin, E.J.; Sun, R.; Dercle, L.; Zacharaki, E.I.; Robert, C.; Reuze, S.; Schernberg, A.; Paragios, N.; Deutsch, E.; Ferte, C. Promises and challenges for the implementation of computational medical imaging (radiomics) in oncology. Ann. Oncol. 2017, 28, 1191–1206. [Google Scholar] [CrossRef]
- Reps, J.M.; Ryan, P.; Rijnbeek, P.R. Investigating the impact of development and internal validation design when training prognostic models using a retrospective cohort in big US observational healthcare data. BMJ Open 2021, 11, e050146. [Google Scholar] [CrossRef]
- Mason, S.J.; Graham, N.E. Areas beneath the relative operating characteristics (ROC) and relative operating levels (ROL) curves: Statistical significance and interpretation. Q. J. R. Meteorol. Soc. 2002, 128, 2145–2166. [Google Scholar] [CrossRef]
- Matthews, B.W. Comparison of the predicted and observed secondary structure of T4 phage lysozyme. Biochim. Biophys. Acta 1975, 405, 442–451. [Google Scholar] [CrossRef] [PubMed]
- Powers, D.M. Evaluation: From precision, recall and F-measure to ROC, informedness, markedness and correlation. arXiv 2020, arXiv:2010.16061. [Google Scholar]
- Robin, X.; Turck, N.; Hainard, A.; Tiberti, N.; Lisacek, F.; Sanchez, J.C.; Muller, M. pROC: An open-source package for R and S+ to analyze and compare ROC curves. BMC Bioinform. 2011, 12, 77. [Google Scholar] [CrossRef]
- Senkus, E.; Kyriakides, S.; Ohno, S.; Penault-Llorca, F.; Poortmans, P.; Rutgers, E.; Zackrisson, S.; Cardoso, F.; Committee, E.G. Primary breast cancer: ESMO Clinical Practice Guidelines for diagnosis, treatment and follow-up. Ann. Oncol. 2015, 26 (Suppl. 5), v8–v30. [Google Scholar] [CrossRef]
- Lev, S. Targeted therapy and drug resistance in triple-negative breast cancer: The EGFR axis. Biochem. Soc. Trans. 2020, 48, 657–665. [Google Scholar] [CrossRef]
- Carlson, R.W.; Allred, D.C.; Anderson, B.O.; Burstein, H.J.; Edge, S.B.; Farrar, W.B.; Forero, A.; Giordano, S.H.; Goldstein, L.J.; Gradishar, W.J.; et al. Metastatic breast cancer, version 1.2012: Featured updates to the NCCN guidelines. J. Natl. Compr. Cancer Netw. 2012, 10, 821–829. [Google Scholar] [CrossRef]
- Catalano, O.A.; Horn, G.L.; Signore, A.; Iannace, C.; Lepore, M.; Vangel, M.; Luongo, A.; Catalano, M.; Lehman, C.; Salvatore, M.; et al. PET/MR in invasive ductal breast cancer: Correlation between imaging markers and histological phenotype. Br. J. Cancer 2017, 116, 893–902. [Google Scholar] [CrossRef]
- Incoronato, M.; Grimaldi, A.M.; Cavaliere, C.; Inglese, M.; Mirabelli, P.; Monti, S.; Ferbo, U.; Nicolai, E.; Soricelli, A.; Catalano, O.A.; et al. Relationship between functional imaging and immunohistochemical markers and prediction of breast cancer subtype: A PET/MRI study. Eur. J. Nucl. Med. Mol. Imaging 2018, 45, 1680–1693. [Google Scholar] [CrossRef]
- Saha, A.; Harowicz, M.R.; Grimm, L.J.; Kim, C.E.; Ghate, S.V.; Walsh, R.; Mazurowski, M.A. A machine learning approach to radiogenomics of breast cancer: A study of 922 subjects and 529 DCE-MRI features. Br. J. Cancer 2018, 119, 508–516. [Google Scholar] [CrossRef]
- Luo, X.; Xie, H.; Yang, Y.; Zhang, C.; Zhang, Y.; Li, Y.; Yang, Q.; Wang, D.; Luo, Y.; Mai, Z.; et al. Radiomic Signatures for Predicting Receptor Status in Breast Cancer Brain Metastases. Front. Oncol. 2022, 12, 878388. [Google Scholar] [CrossRef]
- Cao, R.; Pang, Z.; Wang, X.; Du, Z.; Chen, H.; Liu, J.; Yue, Z.; Wang, H.; Luo, Y.; Jiang, X. Radiomics evaluates the EGFR mutation status from the brain metastasis: A multi-center study. Phys. Med. Biol. 2022, 67, 125003. [Google Scholar] [CrossRef]
- Hohm, A.; Karremann, M.; Gielen, G.H.; Pietsch, T.; Warmuth-Metz, M.; Vandergrift, L.A.; Bison, B.; Stock, A.; Hoffmann, M.; Pham, M.; et al. Magnetic Resonance Imaging Characteristics of Molecular Subgroups in Pediatric H3 K27M Mutant Diffuse Midline Glioma. Clin. Neuroradiol. 2022, 32, 249–258. [Google Scholar] [CrossRef]
- Krawczyk, N.; Fehm, T.; Banys-Paluchowski, M.; Janni, W.; Schramm, A. Liquid Biopsy in Metastasized Breast Cancer as Basis for Treatment Decisions. Oncol. Res. Treat. 2016, 39, 112–116. [Google Scholar] [CrossRef]
- Foda, A.; Kellner, E.; Gunawardana, A.; Gao, X.; Janz, M.; Kufner, A.; Khalil, A.A.; Geran, R.; Mekle, R.; Fiebach, J.B.; et al. Differentiation of Cerebral Neoplasms with Vessel Size Imaging (VSI). Clin. Neuroradiol. 2022, 32, 239–248. [Google Scholar] [CrossRef]
- Zhou, M.; Scott, J.; Chaudhury, B.; Hall, L.; Goldgof, D.; Yeom, K.W.; Iv, M.; Ou, Y.; Kalpathy-Cramer, J.; Napel, S.; et al. Radiomics in Brain Tumor: Image Assessment, Quantitative Feature Descriptors, and Machine-Learning Approaches. Am. J. Neuroradiol. 2018, 39, 208–216. [Google Scholar] [CrossRef]
- Cho, N. Molecular subtypes and imaging phenotypes of breast cancer. Ultrasonography 2016, 35, 281–288. [Google Scholar] [CrossRef]
- Youk, J.H.; Son, E.J.; Chung, J.; Kim, J.A.; Kim, E.K. Triple-negative invasive breast cancer on dynamic contrast-enhanced and diffusion-weighted MR imaging: Comparison with other breast cancer subtypes. Eur. Radiol. 2012, 22, 1724–1734. [Google Scholar] [CrossRef]
- Aerts, H.J. The Potential of Radiomic-Based Phenotyping in Precision Medicine: A Review. JAMA Oncol. 2016, 2, 1636–1642. [Google Scholar] [CrossRef]
- Lambin, P.; Leijenaar, R.T.; Deist, T.M.; Peerlings, J.; De Jong, E.E.; Van Timmeren, J.; Sanduleanu, S.; Larue, R.T.; Even, A.J.; Jochems, A. Radiomics: The bridge between medical imaging and personalized medicine. Nat. Rev. Clin. Oncol. 2017, 14, 749–762. [Google Scholar] [CrossRef]
- GGillies, R.; Kinahan, P.; Hricak, H. Radiomics: Images Are More than Pictures, They Are Data. Radiology 2016, 278, 563–577. [Google Scholar] [CrossRef]
- Kniep, H.C.; Madesta, F.; Schneider, T.; Hanning, U.; Schonfeld, M.H.; Schon, G.; Fiehler, J.; Gauer, T.; Werner, R.; Gellissen, S. Radiomics of Brain MRI: Utility in Prediction of Metastatic Tumor Type. Radiology 2019, 290, 479–487. [Google Scholar] [CrossRef]
- Coates, A.S.; Winer, E.P.; Goldhirsch, A.; Gelber, R.D.; Gnant, M.; Piccart-Gebhart, M.; Thürlimann, B.; Senn, H.-J.; Members, P.; André, F. Tailoring therapies—Improving the management of early breast cancer: St Gallen International Expert Consensus on the Primary Therapy of Early Breast Cancer 2015. Ann. Oncol. 2015, 26, 1533–1546. [Google Scholar] [CrossRef]
- Parmar, C.; Rios Velazquez, E.; Leijenaar, R.; Jermoumi, M.; Carvalho, S.; Mak, R.H.; Mitra, S.; Shankar, B.U.; Kikinis, R.; Haibe-Kains, B. Robust radiomics feature quantification using semiautomatic volumetric segmentation. PLoS ONE 2014, 9, e102107. [Google Scholar] [CrossRef]
- Yip, S.S.; Aerts, H.J. Applications and limitations of radiomics. Phys. Med. Biol. 2016, 61, R150. [Google Scholar] [CrossRef]


| Number of | Age of Sample Patient | Number of Metastases of Sample Patient | ||||||
|---|---|---|---|---|---|---|---|---|
| Metastases | Patients | Mean | Min | Max | Mean | Min | Max | |
| All patients | 412 | 106 30 * 76 ** | 55.9 | 33 | 84 | 5.4 | 1 | 66 |
| Classifier 1 (ER) | Total samples | |||||||
| ER+ | 190 | 53 | 58.3 | 33 | 76 | 4 | 1 | 63 |
| ER− | 222 | 53 | 53.9 | 36 | 79 | 5.9 | 1 | 66 |
| Classifier 2 (PR) | Total samples | |||||||
| PR+ | 147 | 37 | 59.5 | 39 | 76 | 4.5 | 1 | 63 |
| PR− | 265 | 69 | 53.9 | 33 | 84 | 5.7 | 1 | 66 |
| Classifier 3 (HER) | Total samples | |||||||
| HER+ | 169 | 45 | 54.5 | 36 | 81 | 4.1 | 1 | 63 |
| HER− | 243 | 61 | 56.9 | 33 | 84 | 6.1 | 1 | 66 |
| Matthews Correlation Coefficient (MCC) Maximum Operating Point | |||||||
|---|---|---|---|---|---|---|---|
| Receptor Status | AUC [95% CI] | Sensitivity [95% CI] | Specificity [95% CI] | PPV [95% CI] | NPV [95% CI] | Accuracy [95% CI] | MCC [95% CI] |
| 5-fold cross-validation (n = 412 samples) | |||||||
| ER+ | 0.82 [0.78; 0.85] | 84% [81%; 88%] | 68% [65%; 71%] | 69% [67%; 72%] | 84% [82%; 88%] | 76% [73%; 78%] | 0.53 [0.49; 0.58] |
| PR+ | 0.73 [0.69; 0.77] | 59% [56%; 64%] | 82% [77%; 85%] | 69% [67%; 76%] | 74% [70%; 76%] | 72% [69%; 75%] | 0.42 [0.37; 0.48] |
| HER2+ | 0.74 [0.70; 0.78] | 61% [57%; 65%] | 84% [81%; 88%] | 73% [72%; 80%] | 76% [74%; 78%] | 75% [73%; 76%] | 0.47 [0.45; 0.52] |
Disclaimer/Publisher’s Note: The statements, opinions and data contained in all publications are solely those of the individual author(s) and contributor(s) and not of MDPI and/or the editor(s). MDPI and/or the editor(s) disclaim responsibility for any injury to people or property resulting from any ideas, methods, instructions or products referred to in the content. |
© 2023 by the authors. Licensee MDPI, Basel, Switzerland. This article is an open access article distributed under the terms and conditions of the Creative Commons Attribution (CC BY) license (https://creativecommons.org/licenses/by/4.0/).
Share and Cite
Heitkamp, A.; Madesta, F.; Amberg, S.; Wahaj, S.; Schröder, T.; Bechstein, M.; Meyer, L.; Broocks, G.; Hanning, U.; Gauer, T.; et al. Discordant and Converting Receptor Expressions in Brain Metastases from Breast Cancer: MRI-Based Non-Invasive Receptor Status Tracking. Cancers 2023, 15, 2880. https://doi.org/10.3390/cancers15112880
Heitkamp A, Madesta F, Amberg S, Wahaj S, Schröder T, Bechstein M, Meyer L, Broocks G, Hanning U, Gauer T, et al. Discordant and Converting Receptor Expressions in Brain Metastases from Breast Cancer: MRI-Based Non-Invasive Receptor Status Tracking. Cancers. 2023; 15(11):2880. https://doi.org/10.3390/cancers15112880
Chicago/Turabian StyleHeitkamp, Alexander, Frederic Madesta, Sophia Amberg, Schohla Wahaj, Tanja Schröder, Matthias Bechstein, Lukas Meyer, Gabriel Broocks, Uta Hanning, Tobias Gauer, and et al. 2023. "Discordant and Converting Receptor Expressions in Brain Metastases from Breast Cancer: MRI-Based Non-Invasive Receptor Status Tracking" Cancers 15, no. 11: 2880. https://doi.org/10.3390/cancers15112880