
Role of Machine Learning (ML)-Based Classification Using Conventional 18F-FDG PET Parameters in Predicting Postsurgical Features of Endometrial Cancer Aggressiveness
 , ,
, , 
Abstract
:Simple Summary
Abstract
1. Introduction
2. Materials and Methods
2.1. Patients
2.2. 18F-FDG PET Protocols
2.3. 18F-FDG PET Qualitative and Semiquantitative Image Analysis
2.4. Surgery and Histopathological Analysis
2.5. Statistical Analysis
2.6. Machine Learning
3. Results
3.1. Patients’ Population
3.2. Predictive PET and Clinical Parameters
3.3. Machine Learning
4. Discussion
5. Conclusions
Author Contributions
Funding
Institutional Review Board Statement
Informed Consent Statement
Data Availability Statement
Conflicts of Interest
Appendix A

References
- Koskas, M.; Amant, F.; Mirza, M.R.; Creutzberg, C.L. Cancer of the corpus uteri: 2021 update. Int. J. Gynecol. Obstet. 2021, 155, 45–60. [Google Scholar] [CrossRef] [PubMed]
- Poole, E.M.; Lin, W.T.; Kvaskoff, M.; De Vivo, I.; Terry, K.L.; Missmer, S.A. Endometriosis and risk of ovarian and endometrial cancers in a large prospective cohort of U.S. nurses. Cancer Causes Control 2017, 28, 437–445. [Google Scholar] [CrossRef] [PubMed] [Green Version]
- Ali, A.T. Risk factors for endometrial cancer. Ceska Gynekol. 2013, 78, 448–459. [Google Scholar] [PubMed]
- Ferlay, J.; Shin, H.R.; Bray, F.; Forman, D.; Mathers, C.; Parkin, D.M. Estimates of worldwide burden of cancer in 2008: GLOBOCAN 2008. Int. J. Cancer 2010, 127, 2893–2917. [Google Scholar] [CrossRef]
- Morice, P.; Leary, A.; Creutzberg, C.; Abu–Rustum, N.; Darai, E. Endometrial cancer. Lancet 2016, 387, 1094–1108. [Google Scholar] [CrossRef]
- Makker, V.; Taylor, M.H.; Aghajanian, C.; Oaknin, A.; Mier, J.; Cohn, A.L.; Romeo, M.; Bratos, R.; Brose, M.S.; DiSimone, C.; et al. Lenvatinib Plus Pembrolizumab in Patients with Advanced Endometrial Cancer. J. Clin. Oncol. 2020, 38, 2981–2992. [Google Scholar] [CrossRef]
- Noriega–Álvarez, E.; García Vicente, A.M.; Jiménez Londoño, G.A.; Martínez Bravo, W.R.; González García, B.; Soriano Castrejón, Á.M. A systematic review about the role of preoperative 18F–FDG PET/CT for prognosis and risk stratification in patients with endometrial cancer. Rev. Española Med. Nucl. Imagen Mol. (Engl. Ed.) 2021, in press. [Google Scholar] [CrossRef]
- Giampaolino, P.; Cafasso, V.; Boccia, D.; Ascione, M.; Mercorio, A.; Viciglione, F.; Palumbo, M.; Serafino, P.; Buonfantino, C.; De Angelis, M.C.; et al. Fertility–Sparing Approach in Patients with Endometrioid Endometrial Cancer Grade 2 Stage IA (FIGO): A Qualitative Systematic Review. Biomed. Res. Int. 2022, 2022, 4070368. [Google Scholar] [CrossRef]
- Mutlu, L.; Manavella, D.D.; Gullo, G.; McNamara, B.; Santin, A.D.; Patrizio, P. Endometrial Cancer in Reproductive Age: Fertility–Sparing Approach and Reproductive Outcomes. Cancers 2022, 14, 5187. [Google Scholar] [CrossRef]
- Zaami, S.; Stark, M.; Signore, F.; Gullo, G.; Marinelli, E. Fertility preservation in female cancer sufferers: (only) a moral obligation? Eur. J. Contracept. Reprod. Health Care 2022, 27, 335–340. [Google Scholar] [CrossRef]
- Berman, M.L.; Ballon, S.C.; Lagasse, L.D.; Watring, W.G. Prognosis and treatment of endometrial cancer. Am. J. Obstet. Gynecol. 1980, 136, 679–688. [Google Scholar] [CrossRef]
- Larson, D.; Connor, G.; Broste, S.; Krawisz, B.; Johnson, K. Prognostic significance of gross myometrial invasion with endometrial cancer. Obstet. Gynecol. 1996, 88, 394–398. [Google Scholar] [CrossRef] [PubMed]
- Boronow, R.C.; Morrow, C.P.; Creasman, W.T.; Disaia, P.J.; Silverberg, S.G.; Miller, A.; Blessing, J.A. Surgical staging in endometrial cancer: Clinical–pathologic findings of a prospective study. Obstet. Gynecol. 1984, 63, 825–832. [Google Scholar]
- Rizzo, S.; Femia, M.; Buscarino, V.; Franchi, D.; Garbi, A.; Zanagnolo, V.; Del Grande, M.; Manganaro, L.; Alessi, S.; Giannitto, C.; et al. Endometrial cancer: An overview of novelties in treatment and related imaging keypoints for local staging. Cancer Imaging 2018, 18, 45. [Google Scholar] [CrossRef] [PubMed]
- Tanos, P.; Dimitriou, S.; Gullo, G.; Tanos, V. Biomolecular and Genetic Prognostic Factors That Can Facilitate Fertility–Sparing Treatment (FST) Decision Making in Early Stage Endometrial Cancer (ES–EC): A Systematic Review. Int. J. Mol. Sci. 2022, 23, 2653. [Google Scholar] [CrossRef] [PubMed]
- Eritja, N.; Navaridas, R.; Ruiz–Mitjana, A.; Vidal–Sabanés, M.; Egea, J.; Encinas, M.; Matias–Guiu, X.; Dolcet, X. Endometrial PTEN Deficiency Leads to SMAD2/3 Nuclear Translocation. Cancers 2021, 13, 4990. [Google Scholar] [CrossRef]
- Yang, H.; Han, F.; Hu, R.; Liu, J.; Sui, J.; Xiang, X.; Wang, F.; Chu, L.; Song, S. PTEN gene mutations correlate to poor prognosis in glioma patients: A meta–analysis. OncoTargets Ther. 2016, 2016, 3485. [Google Scholar] [CrossRef] [Green Version]
- Boussios, S.; Rassy, E.; Shah, S.; Ioannidou, E.; Sheriff, M.; Pavlidis, N. Aberrations of DNA repair pathways in prostate cancer: A cornerstone of precision oncology. Expert Opin. Ther. Targets 2021, 25, 329–333. [Google Scholar] [CrossRef]
- Daix, M.; Aida Angeles, M.; Migliorelli, F.; Kakkos, A.; Martinez Gomez, C.; Delbecque, K.; Mery, E.; Tock, S.; Gabiache, E.; Decuypere, M.; et al. Concordance between preoperative ESMO–ESGO–ESTRO risk classification and final histology in early–stage endometrial cancer. J. Gynecol. Oncol. 2021, 32, e48. [Google Scholar] [CrossRef]
- Helpman, L.; Kupets, R.; Covens, A.; Saad, R.S.; Khalifa, M.A.; Ismiil, N.; Ghorab, Z.; Dubé, V.; Nofech–Mozes, S. Assessment of endometrial sampling as a predictor of final surgical pathology in endometrial cancer. Br. J. Cancer 2014, 110, 609–615. [Google Scholar] [CrossRef] [Green Version]
- Dou, Y.; Kawaler, E.A.; Cui Zhou, D.; Gritsenko, M.A.; Huang, C.; Blumenberg, L.; Karpova, A.; Petyuk, V.A.; Savage, S.R.; Satpathy, S.; et al. Proteogenomic Characterization of Endometrial Carcinoma. Cell 2020, 180, 729–748.e26. [Google Scholar] [CrossRef]
- Bezzi, C.; Zambella, E.; Ghezzo, S.; Fallanca, F.; Samanes Gajate, A.M.; Franchini, A.; Ironi, G.; Bergamini, A.; Monaco, L.; Evangelista, L.; et al. 18F–FDG PET/MRI in endometrial cancer: Systematic review and meta–analysis. Clin. Transl. Imaging 2021, 10, 45–58. [Google Scholar] [CrossRef]
- Capozzi, V.A.; Rosati, A.; Rumolo, V.; Ferrari, F.; Gullo, G.; Karaman, E.; Karaaslan, O.; Hacioğlu, L. Novelties of ultrasound imaging for endometrial cancer preoperative workup. Minerva Med. 2021, 112, 3–11. [Google Scholar] [CrossRef] [PubMed]
- Colombo, N.; Creutzberg, C.; Amant, F.; Bosse, T.; González–Martón, A.; Ledermann, J.; Marth, C.; Nout, R.; Querleu, D.; Mirza, M.R.; et al. ESMO–ESGO–ESTRO consensus conference on endometrial cancer: Diagnosis, treatment and follow-up. Ann. Oncol. 2016, 27, 16–41. [Google Scholar] [CrossRef]
- Concin, N.; Matias–Guiu, X.; Vergote, I.; Cibula, D.; Mirza, M.R.; Marnitz, S.; Ledermann, J.; Bosse, T.; Chargari, C.; Fagotti, A.; et al. ESGO/ESTRO/ESP guidelines for the management of patients with endometrial carcinoma. Int. J. Gynecol. Cancer 2021, 31, 12–39. [Google Scholar] [CrossRef]
- Faria, S.C.; Devine, C.E.; Rao, B.; Sagebiel, T.; Bhosale, P. Imaging and Staging of Endometrial Cancer. Semin. Ultrasound CT MRI 2019, 40, 287–294. [Google Scholar] [CrossRef] [PubMed]
- Picchio, M.; Mangili, G.; Samanes Gajate, A.M.; De Marzi, P.; Spinapolice, E.G.; Mapelli, P.; Giovacchini, G.; Sigismondi, C.; Viganò, R.; Sironi, S.; et al. High–grade endometrial cancer: Value of [18F]FDG PET/CT in preoperative staging. Nucl. Med. Commun. 2010, 31, 506–512. [Google Scholar] [CrossRef]
- Gee, M.S.; Atri, M.; Bandos, A.I.; Mannel, R.S.; Gold, M.A.; Lee, S.I. Identification of distant metastatic disease in uterine cervical and endometrial cancers with FDG PET/CT: Analysis from the ACRIN 6671/GOG 0233 Multicenter Trial. Radiology 2018, 287, 176–184. [Google Scholar] [CrossRef]
- Mapelli, P.; Ironi, G.; Bergamini, A.; Mangili, G.; Paola, R.; Taccagni, G.L.; Venturini, E.; Petrone, M.; Nisi, V.; Fallanca, F.; et al. Synergic role of preoperative 18F–fluorodeoxyglucose PET and MRI parameters in predicting histopathological features of endometrial cancer. Nucl. Med. Commun. 2020, 41, 1073–1080. [Google Scholar] [CrossRef]
- Ironi, G.; Mapelli, P.; Bergamini, A.; Fallanca, F.; Candotti, G.; Gnasso, C.; Taccagni, G.L.; Sant’Angelo, M.; Scifo, P.; Bezzi, C.; et al. Hybrid PET/MRI in Staging Endometrial Cancer. Clin. Nucl. Med. 2022, 47, 221–229. [Google Scholar] [CrossRef]
- Sollini, M.; Bandera, F.; Kirienko, M. Quantitative imaging biomarkers in nuclear medicine: From SUV to image mining studies. Highlights from annals of nuclear medicine 2018. Eur. J. Nucl. Med. Mol. Imaging 2019, 46, 2737–2745. [Google Scholar] [CrossRef]
- Gillies, R.J.; Kinahan, P.E.; Hricak, H. Radiomics: Images are more than pictures, they are data. Radiology 2016, 278, 563–577. [Google Scholar] [CrossRef] [PubMed] [Green Version]
- Mapelli, P.; Partelli, S.; Salgarello, M.; Doraku, J.; Muffatti, F.; Schiavo Lena, M.; Pasetto, S.; Bezzi, C.; Bettinardi, V.; Andreasi, V.; et al. Dual tracer 68ga–dotatoc and 18f–fdg pet improve preoperative evaluation of aggressiveness in resectable pancreatic neuroendocrine neoplasms. Diagnostics 2021, 11, 192. [Google Scholar] [CrossRef] [PubMed]
- Christensen, T.N.; Andersen, P.K.; Langer, S.W.; Fischer, B.M.B. Prognostic Value of 18F–FDG–PET Parameters in Patients with Small Cell Lung Cancer: A Meta–Analysis and Review of Current Literature. Diagnostics 2021, 11, 174. [Google Scholar] [CrossRef] [PubMed]
- Wang, H.; Dai, H.; Li, Q.; Shen, G.; Shi, L.; Tian, R. Investigating 18F–FDG PET/CT Parameters as Prognostic Markers for Differentiated Thyroid Cancer: A Systematic Review. Front. Oncol. 2021, 11, 648658. [Google Scholar] [CrossRef]
- Bezzi, C.; Monaco, L.; Ghezzo, S.; Mathoux, G.; Bergamini, A.; Zambella, E.; Fallanca, F.; Samanes Gajate, A.M.; Presotto, L.; Sabetta, G.; et al. 18F–FDG PET/CT May Predict Tumor Type and Risk Score in Gestational Trophoblastic Disease. Clin. Nucl. Med. 2022, 47, 525–531. [Google Scholar] [CrossRef] [PubMed]
- Ngiam, K.Y.; Khor, I.W. Big data and machine learning algorithms for health–care delivery. Lancet Oncol. 2019, 20, e262–e273. [Google Scholar] [CrossRef]
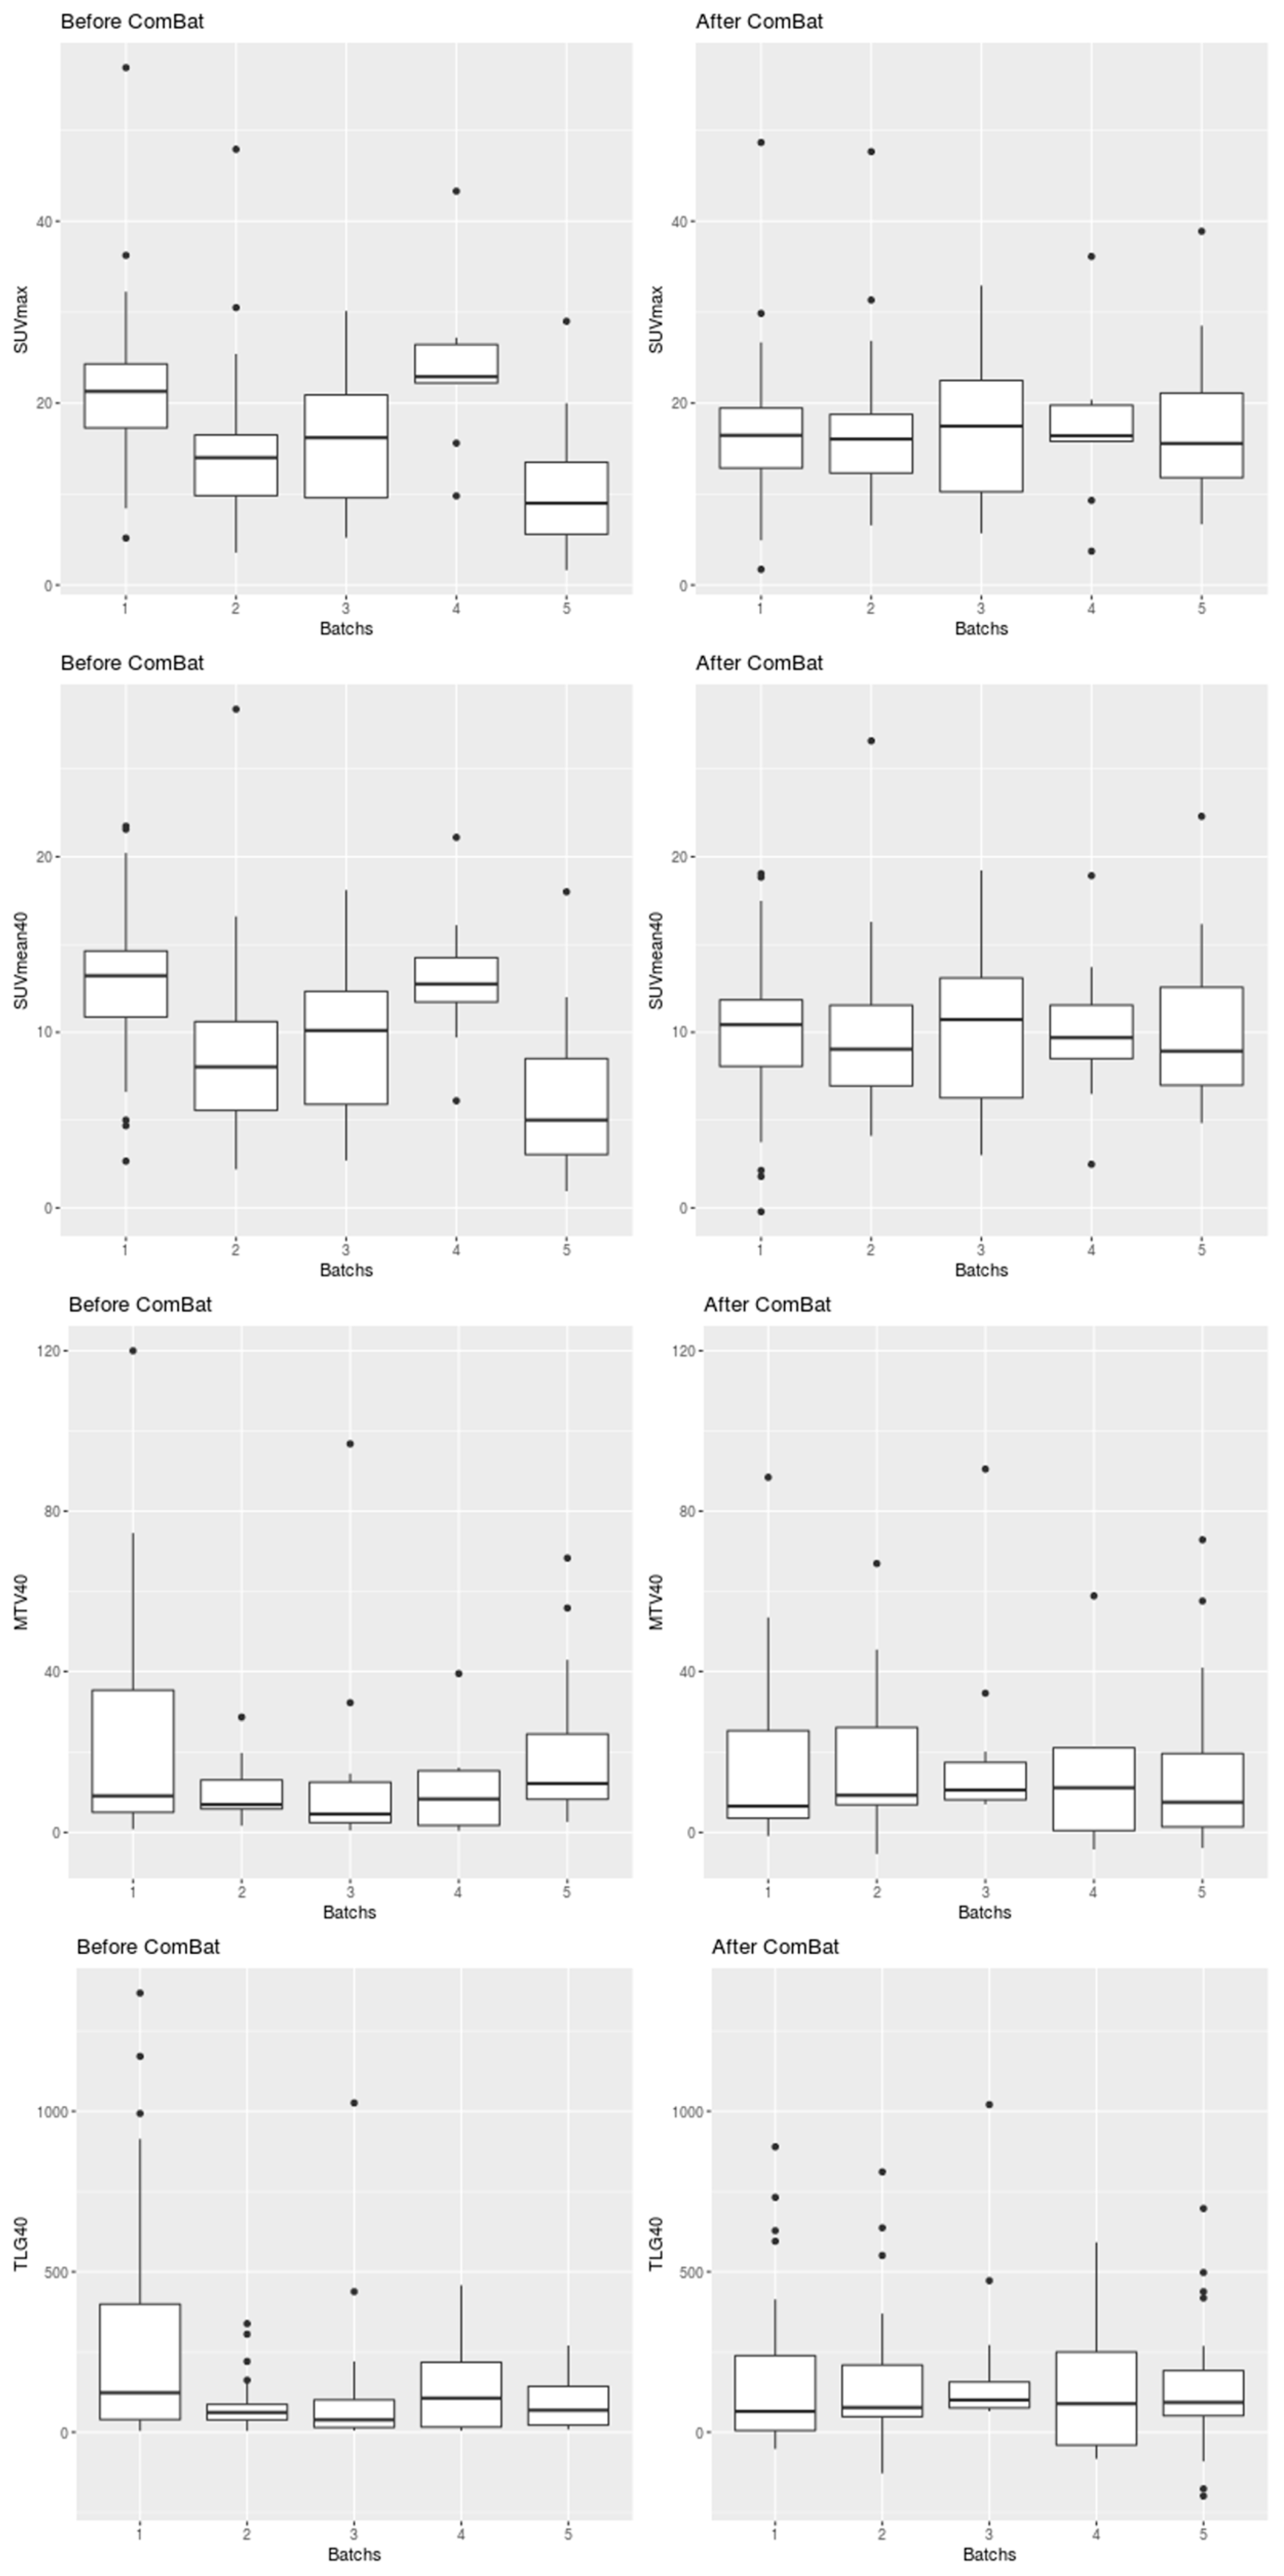
- Orlhac, F.; Eertink, J.J.; Cottereau, A.-S.; Zijlstra, J.M.; Thieblemont, C.; Meignan, M.; Boellaard, R.; Buvat, I. A Guide to ComBat Harmonization of Imaging Biomarkers in Multicenter Studies. J. Nucl. Med. 2022, 63, 172–179. [Google Scholar] [CrossRef]
- Pedregosa Fabianpedregosa, F.; Alexandre Gramfort, N.; Michel, V.; Thirion Bertrandthirion, B.; Grisel, O.; Blondel, M.; Prettenhofer Peterprettenhofer, P.; Weiss, R.; Dubourg, V.; Vanderplas Vanderplas, J.; et al. Scikit–learn: Machine Learning in Python Gaël Varoquaux. J. Mach. Learn. Res. 2011, 12, 2825–2830. [Google Scholar]
- Bettinardi, V.; Danna, M.; Savi, A.; Lecchi, M.; Castiglioni, I.; Gilardi, M.C.; Bammer, H.; Lucignani, G.; Fazio, F. Performance evaluation of the new whole–body PET/CT scanner: Discovery ST. Eur. J. Nucl. Med. Mol. Imaging 2004, 31, 867–881. [Google Scholar] [CrossRef]
- Tarantola, G.; Zito, F.; Gerundini, P. PET instrumentation and reconstruction algorithms in whole–body applications. J. Nucl. Med. 2003, 44, 756–769. [Google Scholar]
- Sathiakumar, C.; Som, S.; Eberl, S.; Lin, P. NEMA NU 2–2001 performance testing of a philips gemini GXL PET/CT scanner. Australas. Phys. Eng. Sci. Med. 2010, 33, 199–209. [Google Scholar] [CrossRef] [PubMed]
- Bettinardi, V.; Presotto, L.; Rapisarda, E.; Picchio, M.; Gianolli, L.; Gilardi, M.C. Physical Performance of the new hybrid PETCT Discovery–690. Med. Phys. 2011, 38, 5394–5411. [Google Scholar] [CrossRef] [PubMed]
- Ghooshkhanei, H.; Treglia, G.; Sabouri, G.; Davoodi, R.; Sadeghi, R. Risk stratification and prognosis determination using 18F–FDG PET imaging in endometrial cancer patients: A systematic review and meta–analysis. Gynecol. Oncol. 2014, 132, 669–676. [Google Scholar] [CrossRef] [PubMed]
- Torizuka, T.; Nakamura, F.; Takekuma, M.; Kanno, T.; Ogusu, T.; Yoshikawa, E.; Okada, H.; Maeda, M.; Ouchi, Y. FDG PET for the assessment of myometrial infiltration in clinical stage I uterine corpus cancer. Nucl. Med. Commun. 2006, 27, 481–487. [Google Scholar] [CrossRef] [PubMed]
- Walentowicz–Sadłecka, M.; Sadłecki, P.; Małecki, B.; Walentowicz, P.; Marszałek, A.; Domaracki, P.; Grabiec, M. SUVmax measured by 18F FDG PET/CT in the primary tumor in relations to clinical and pathological features of endometrial cancer. Pol. Gynaecol. 2013, 84, 748–753. [Google Scholar] [CrossRef] [PubMed]
- Crivellaro, C.; Signorelli, M.; Guerra, L.; De Ponti, E.; Pirovano, C.; Fruscio, R.; Elisei, F.; Montanelli, L.; Buda, A.; Messa, C. Tailoring systematic lymphadenectomy in high–risk clinical early stage endometrial cancer: The role of 18F–FDG PET/CT. Gynecol. Oncol. 2013, 130, 306–311. [Google Scholar] [CrossRef]
- Perrone, E.; De Felice, F.; Capasso, I.; Distefano, E.; Lorusso, D.; Nero, C.; Arciuolo, D.; Zannoni, G.F.; Scambia, G.; Fanfani, F. The immunohistochemical molecular risk classification in endometrial cancer: A pragmatic and high–reproducibility method. Gynecol. Oncol. 2022, 165, 585–593. [Google Scholar] [CrossRef]
- Stanzione, A.; Cuocolo, R.; Del Grosso, R.; Nardiello, A.; Romeo, V.; Travaglino, A.; Raffone, A.; Bifulco, G.; Zullo, F.; Insabato, L.; et al. Deep Myometrial Infiltration of Endometrial Cancer on MRI: A Radiomics–Powered Machine Learning Pilot Study. Acad. Radiol. 2021, 28, 737–744. [Google Scholar] [CrossRef]
- Otani, S.; Himoto, Y.; Nishio, M.; Fujimoto, K.; Moribata, Y.; Yakami, M.; Kurata, Y.; Hamanishi, J.; Ueda, A.; Minamiguchi, S.; et al. Radiomic machine learning for pretreatment assessment of prognostic risk factors for endometrial cancer and its effects on radiologists’ decisions of deep myometrial invasion. Magn. Reson. Imaging 2022, 85, 161–167. [Google Scholar] [CrossRef]
- Rodríguez–Ortega, A.; Alegre, A.; Lago, V.; Carot–Sierra, J.M.; Ten–Esteve, A.; Montoliu, G.; Domingo, S.; Alberich–Bayarri, Á.; Martí–Bonmatí, L. Machine Learning–Based Integration of Prognostic Magnetic Resonance Imaging Biomarkers for Myometrial Invasion Stratification in Endometrial Cancer. J. Magn. Reson. Imaging 2021, 54, 987–995. [Google Scholar] [CrossRef]
- Yang, L.Y.; Siow, T.Y.; Lin, Y.C.; Wu, R.C.; Lu, H.Y.; Chiang, H.J.; Ho, C.Y.; Huang, Y.T.; Huang, Y.L.; Pan, Y.B.; et al. Computer–aided segmentation and machine learning of integrated clinical and diffusion–weighted imaging parameters for predicting lymph node metastasis in endometrial cancer. Cancers 2021, 13, 1406. [Google Scholar] [CrossRef]
- Nakajo, M.; Jinguji, M.; Tani, A.; Kikuno, H.; Hirahara, D.; Togami, S.; Kobayashi, H.; Yoshiura, T. Application of a Machine Learning Approach for the Analysis of Clinical and Radiomic Features of Pretreatment [18F]–FDG PET/CT to Predict Prognosis of Patients with Endometrial Cancer. Mol. Imaging Biol. 2021, 23, 756–765. [Google Scholar] [CrossRef]


| Characteristic | Value |
|---|---|
| Number of patients | 123 |
| Mean age. years (SD) | 65 (10.74) |
| BMI. mean (SD) | 27 (5.42) |
| FIGO stage. n (%): I II III IV | 82/123 (66.7%) 12/123 (9.7%) 23/123 (18.7%) 6/123 (4.8%) |
| Histological subtype. n (%): endometrioid EC non-endometrioid EC | 85/123 (69%) 38/123 (31%) |
| Myometrial Invasion. n (%): <50% >50% | 53/115 (46.1%) 62/115 (53.9%) |
| EC risk group. n (%): low and intermediate risk groups high-intermediate and high-risk groups | 43/119 (36.1%) 76/119 (63.9%) |
| LN involvement. n (%) yes no | 14/90 (15.6%) 76/90 (84.4%) |
| p53 expression. n (%) overexpression null | 37/51 (72.5%) 14/51 (27.5%) |
| 18F-FDG PET finding. n (%) pathological uptake non-pathological uptake | 119/123 (96.7%) 4/123 (3.3%) |
| Feature of EC Aggressiveness | SUVmax | SUVmean | MTV | TLG | Age | BMI |
|---|---|---|---|---|---|---|
| Histological Subtype | ||||||
| p-value | 0.080 | 0.134 | 0.556 | 0.389 | 0.405 | 0.432 |
| adjusted p-value | 0.402 | 0.402 | 0.556 | 0.518 | 0.518 | 0.518 |
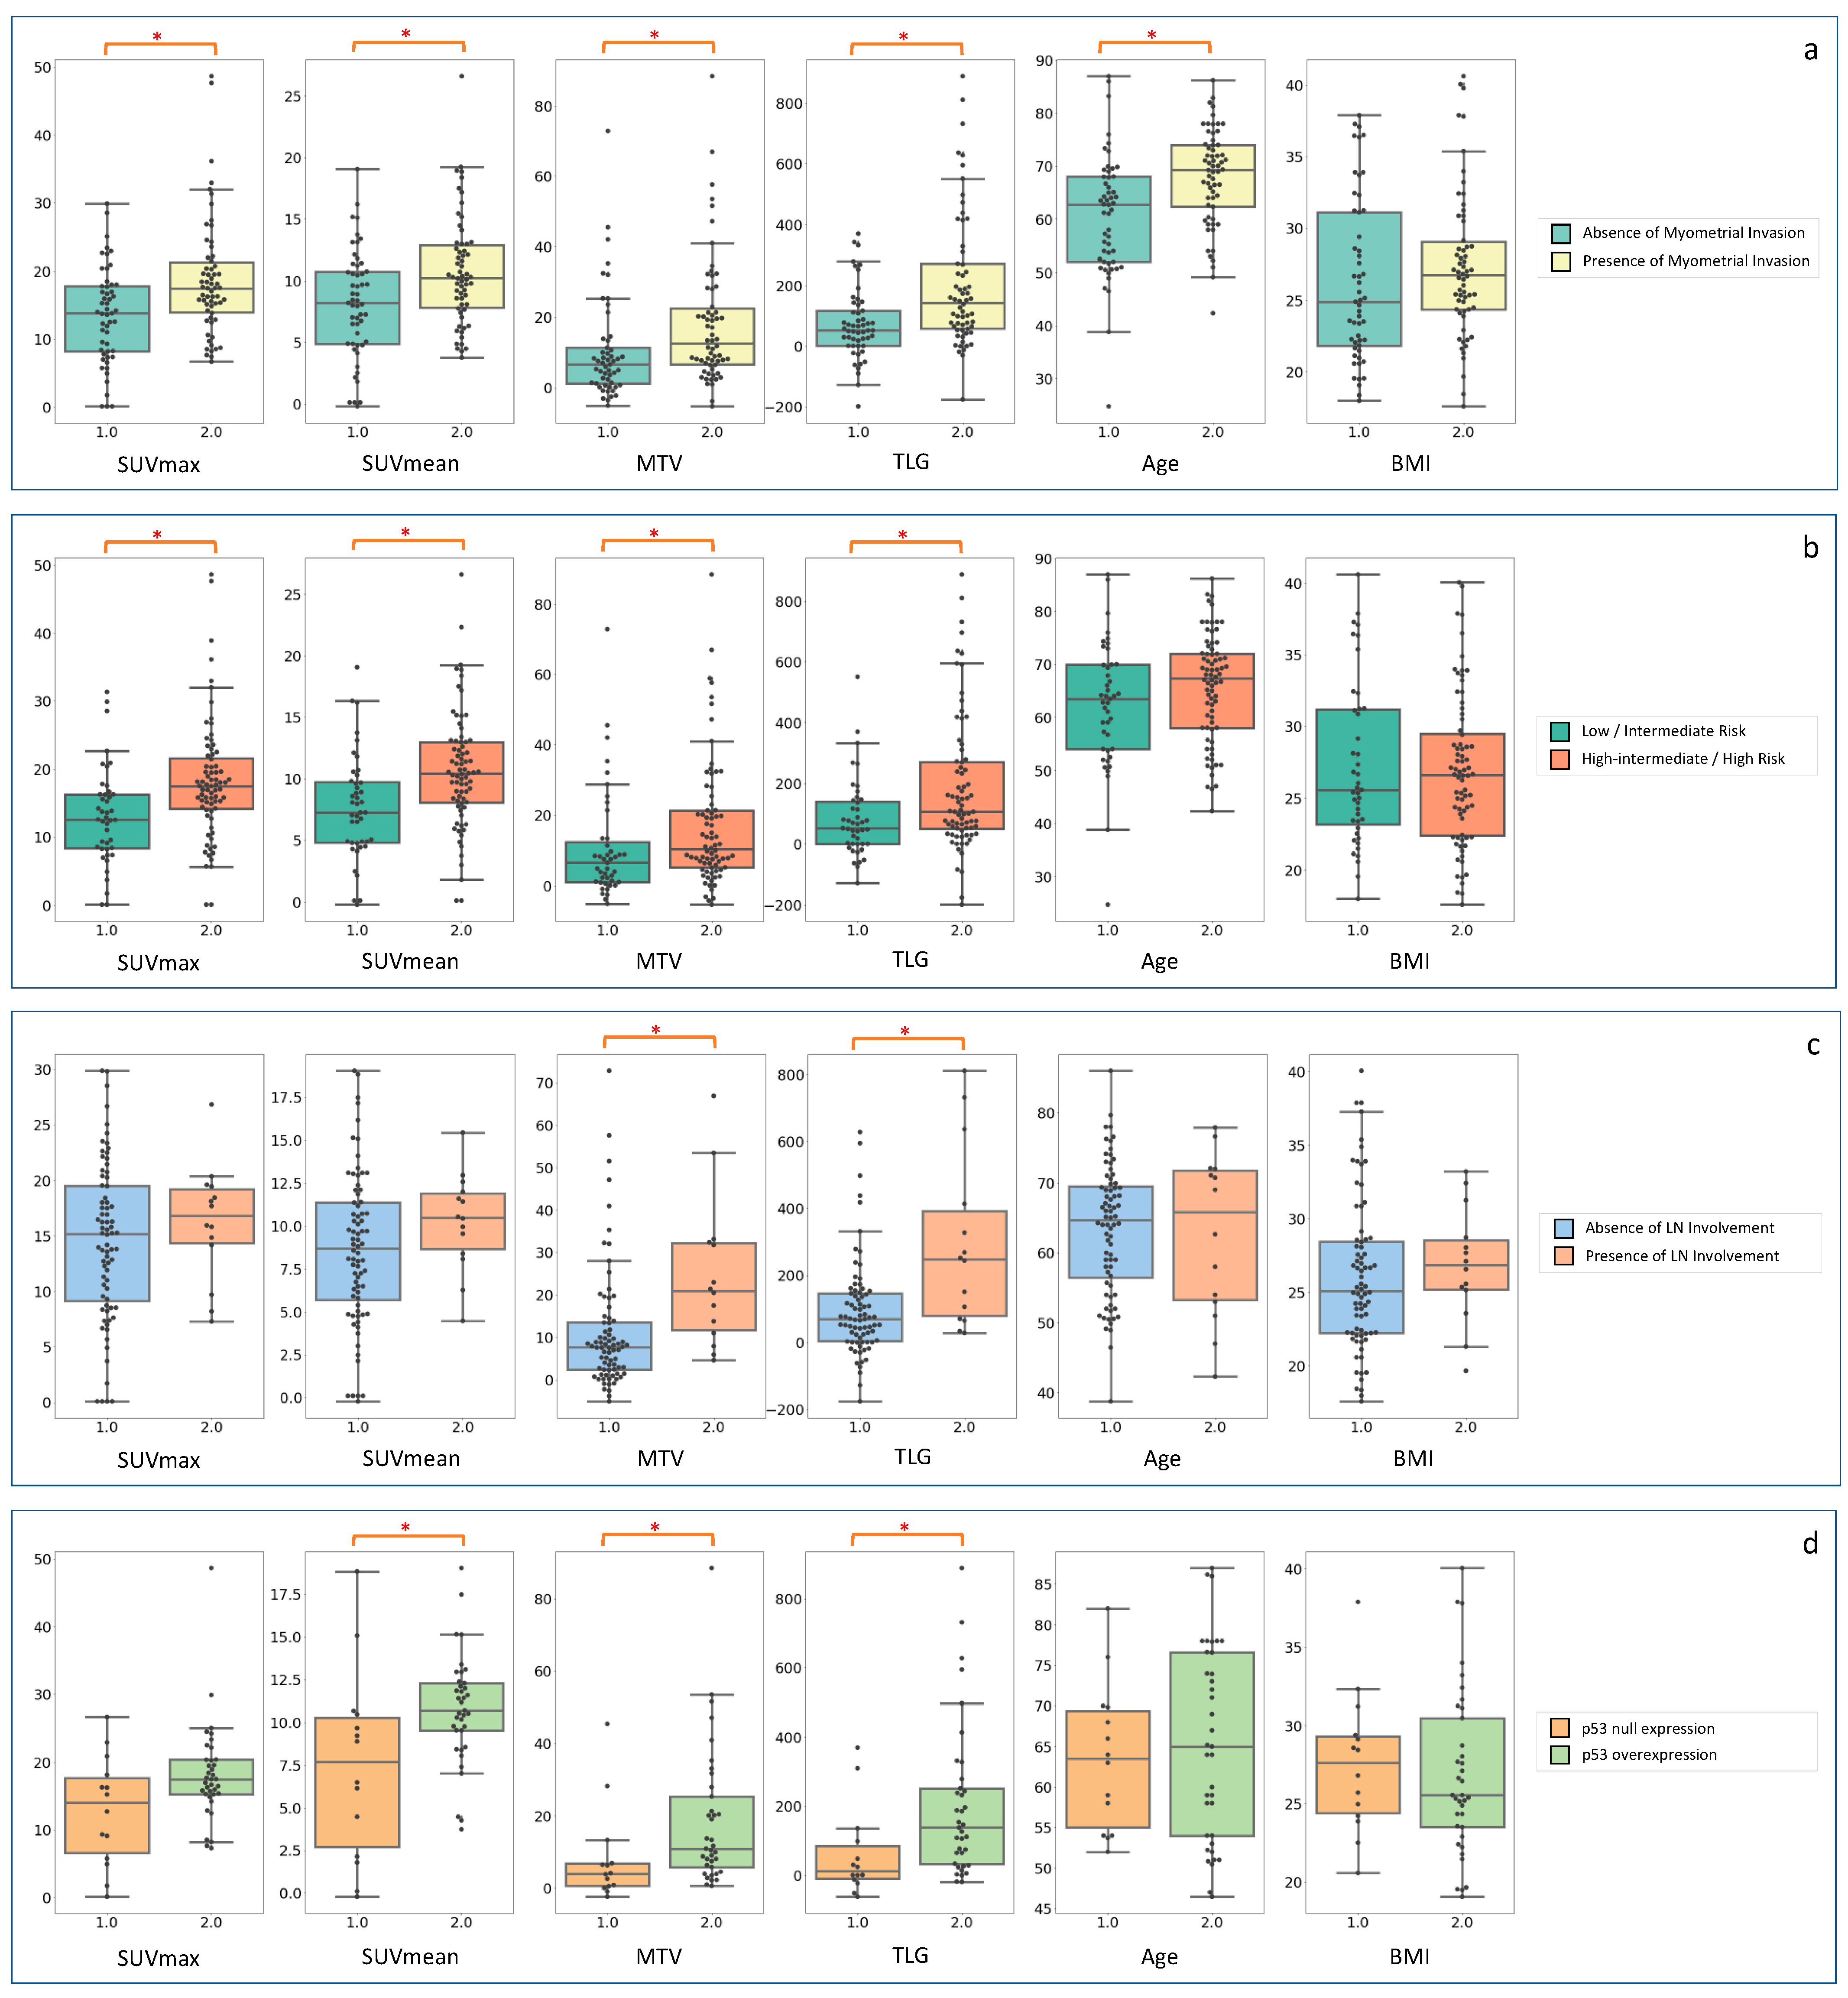
| Myometrial Invasion | ||||||
| p-value | 0.001 * | 0.007 * | 0.002 * | <0.001 * | <0.001 * | 0.117 |
| adjusted p-value | 0.002 * | 0.008 * | 0.003 * | 0.001 * | 0.001 * | 0.117 |
| EC Risk Group | ||||||
| p-value | <0.001 * | <0.001 * | 0.016 * | 0.005 * | 0.109 | 0.991 |
| adjusted p-value | <0.001 * | <0.001 * | 0.024 * | 0.010 * | 0.131 | 0.991 |
| LN Involvement | ||||||
| p-value | 0.341 | 0.126 | 0.001 * | 0.003 * | 0.929 | 0.316 |
| adjusted p-value | 0.409 | 0.252 | 0.006 * | 0.009 * | 0.929 | 0.409 |
| p53 Expression | ||||||
| p-value | 0.051 | 0.013 * | 0.008 * | 0.006 * | 0.704 | 0.499 |
| adjusted p-value | 0.076 | 0.026 * | 0.024 * | 0.024 * | 0.704 | 0.599 |
| Features of EC Aggressiveness | SUVmax | SUVmean | MTV | TLG | AGE | BMI |
|---|---|---|---|---|---|---|
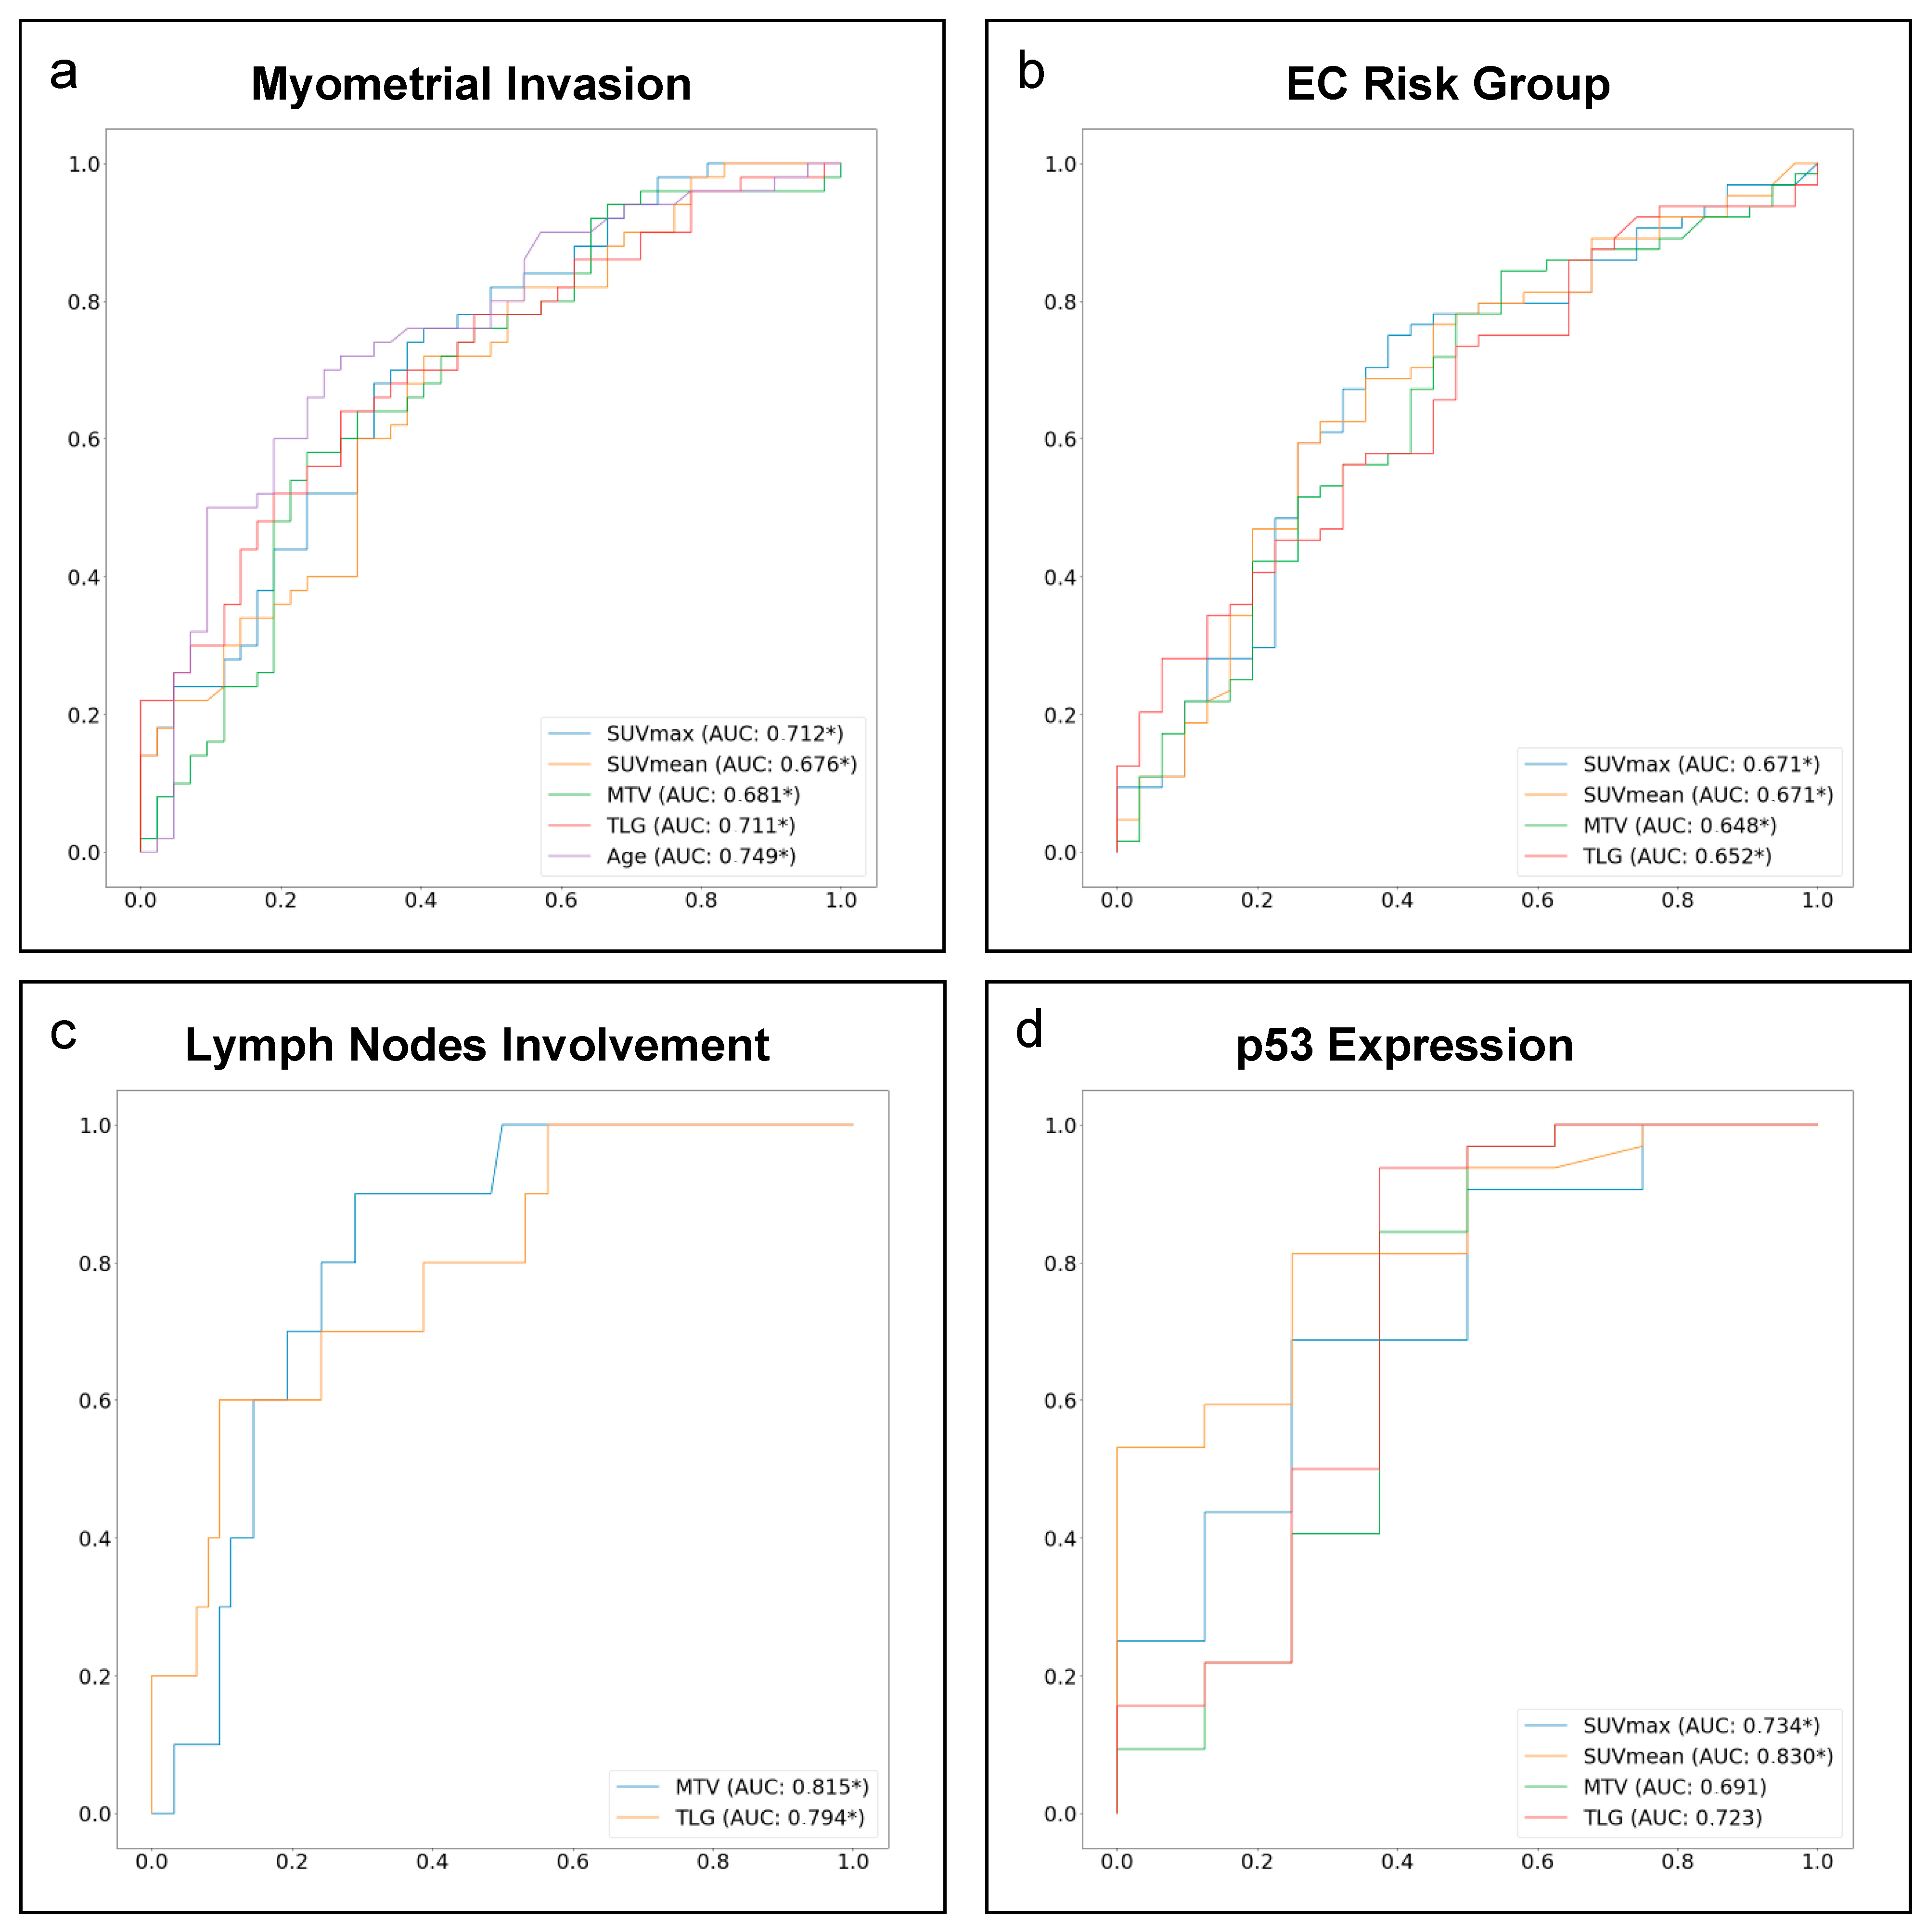
| Histological subtype AUC 95% CI Optimal cut–off Sensitivity Specificity | 0.421 0.29–0.55 / / / | 0.458 0.33–0.59 / / / | 0.473 0.35–0.60 / / / | 0.469 0.35–0.59 / / / | 0.418 0.29–0.55 / / / | 0.566 0.45–0.69 / / / |
| Myometrial invasion AUC 95% CI Optimal cut–off Sensitivity Specificity | 0.712 0.60–0.81 * 14.850 74% 62% | 0.676 0.56–0.79 * 8.556 72% 60% | 0.681 0.57–0.79 * 10.980 58% 76% | 0.711 0.60–0.81 * 96.125 64% 71% | 0.749 0.64–0.85 * 66.449 70% 73% | 0.564 0.44–0.69 / / / |
| EC risk group AUC 95% CI Optimal cut–off Sensitivity Specificity | 0.671 0.55–0.79 * 14.188 75% 61% | 0.671 0.55–0.79 * 9.694 63% 71% | 0.648 0.52–0.77 * 5.133 78% 52% | 0.652 0.53–0.77 * 96.125 56% 68% | 0.602 0.48–0.72 / / / | 0.482 0.35–0.61 / / / |
| LN involvement AUC 95% CI Optimal cut–off Sensitivity Specificity | 0.577 0.40–0.74 / / / | 0.611 0.42–0.78 / / / | 0.815 0.70–0.91 * 10.980 90% 71% | 0.794 0.64–0.93 * 251.823 60% 90% | 0.523 0.29–0.75 / / / | 0.579 0.38–0.76 / / / |
| p53 expression AUC 95% CI Optimal cut–off Sensitivity Specificity | 0.734 0.52–0.93 * 16.286 69% 75% | 0.830 0.67–0.96 * 9.536 81% 75% | 0.691 0.41–0.96 / / / | 0.723 0.43–0.99 / / / | 0.533 0.31–0.74 / / / | 0.455 0.23–0.68 / / / |
| Features of EC Aggressiveness | SUVmax | SUVmean | MTV | TLG | Age | RFC |
|---|---|---|---|---|---|---|
| Myometrial invasion | ||||||
| th: 14.85 | th: 8.56 | th: 10.98 | th: 96.13 | th: 66.45 | RFCMI | |
| Accuracy | 52% | 52% | 52% | 61% | 48% | 87% |
| Sensitivity | 67% | 67% | 42% | 58% | 42% | 100% |
| Specificity | 36% | 36% | 64% | 64% | 55% | 73% |
| PPV | 53% | 53% | 56% | 64% | 50% | 80% |
| NPV | 50% | 50% | 50% | 58% | 46% | 100% |
| EC risk group | ||||||
| th: 14.19 | th: 9.69 | th: 5.13 | th: 96.13 | RFCRG | ||
| Accuracy | 71% | 67% | 54% | 62% | / | 79% |
| Sensitivity | 75% | 50% | 67% | 58% | / | 92% |
| Specificity | 67% | 83% | 42% | 67% | / | 67% |
| PPV | 69% | 75% | 53% | 64% | / | 73% |
| NPV | 73% | 62% | 56% | 62% | / | 89% |
| LN involvement | ||||||
| th: 10.98 | th: 251.82 | RFCLN | ||||
| Accuracy | / | / | 61% | 72% | / | 83% |
| Sensitivity | / | / | 50% | 25% | / | 25% |
| Specificity | / | / | 64% | 86% | / | 100% |
| PPV | / | / | 29% | 33% | / | 100% |
| NPV | / | / | 82% | 80% | / | 82% |
| p53 expression | ||||||
| th: 16.29 | th: 9.54 | RFCp53 | ||||
| Accuracy | 45% | 45% | / | / | / | 73% |
| Sensitivity | 20% | 40% | / | / | / | 100% |
| Specificity | 67% | 50% | / | / | / | 50% |
| PPV | 33% | 40% | / | / | / | 63% |
| NPV | 50% | 50% | / | / | / | 100% |
| Hyperparameters | Myometrial Invasion | EC Risk Group | Lymph Node Involvement | p53 Expression |
|---|---|---|---|---|
| n_estimators | 24 | 22 | 2 | 5 |
| max_depth | None | None | None | None |
| min_samples_split | 5 | 2 | 2 | 2 |
| min_samples_leaf | 2 | 4 | 1 | 1 |
| max_features | auto | auto | auto | Auto |
| bootstrap | True | True | True | True |
| class_weight | 1:1 | 1:2 | 1:1.5 | 1:1 |
Disclaimer/Publisher’s Note: The statements, opinions and data contained in all publications are solely those of the individual author(s) and contributor(s) and not of MDPI and/or the editor(s). MDPI and/or the editor(s) disclaim responsibility for any injury to people or property resulting from any ideas, methods, instructions or products referred to in the content. |
© 2023 by the authors. Licensee MDPI, Basel, Switzerland. This article is an open access article distributed under the terms and conditions of the Creative Commons Attribution (CC BY) license (https://creativecommons.org/licenses/by/4.0/).
Share and Cite
Bezzi, C.; Bergamini, A.; Mathoux, G.; Ghezzo, S.; Monaco, L.; Candotti, G.; Fallanca, F.; Gajate, A.M.S.; Rabaiotti, E.; Cioffi, R.; et al. Role of Machine Learning (ML)-Based Classification Using Conventional 18F-FDG PET Parameters in Predicting Postsurgical Features of Endometrial Cancer Aggressiveness. Cancers 2023, 15, 325. https://doi.org/10.3390/cancers15010325
Bezzi C, Bergamini A, Mathoux G, Ghezzo S, Monaco L, Candotti G, Fallanca F, Gajate AMS, Rabaiotti E, Cioffi R, et al. Role of Machine Learning (ML)-Based Classification Using Conventional 18F-FDG PET Parameters in Predicting Postsurgical Features of Endometrial Cancer Aggressiveness. Cancers. 2023; 15(1):325. https://doi.org/10.3390/cancers15010325
Chicago/Turabian StyleBezzi, Carolina, Alice Bergamini, Gregory Mathoux, Samuele Ghezzo, Lavinia Monaco, Giorgio Candotti, Federico Fallanca, Ana Maria Samanes Gajate, Emanuela Rabaiotti, Raffaella Cioffi, and et al. 2023. "Role of Machine Learning (ML)-Based Classification Using Conventional 18F-FDG PET Parameters in Predicting Postsurgical Features of Endometrial Cancer Aggressiveness" Cancers 15, no. 1: 325. https://doi.org/10.3390/cancers15010325