
An Explainable AI-Enabled Framework for Interpreting Pulmonary Diseases from Chest Radiographs
 , , and
Abstract
:Simple Summary
Abstract
1. Introduction
2. Literature Survey
- In this research, an explainable AI framework is developed for detecting pulmonary diseases where the classification model gives extra attention throughout the classification task using chest radiographs.
- For the classification task, transfer-learning-based Resnet50 architecture is used. This developed system secures superior classification accuracies compared to the existing approaches by achieving 93% and 97% of pulmonary disease COVID-19.
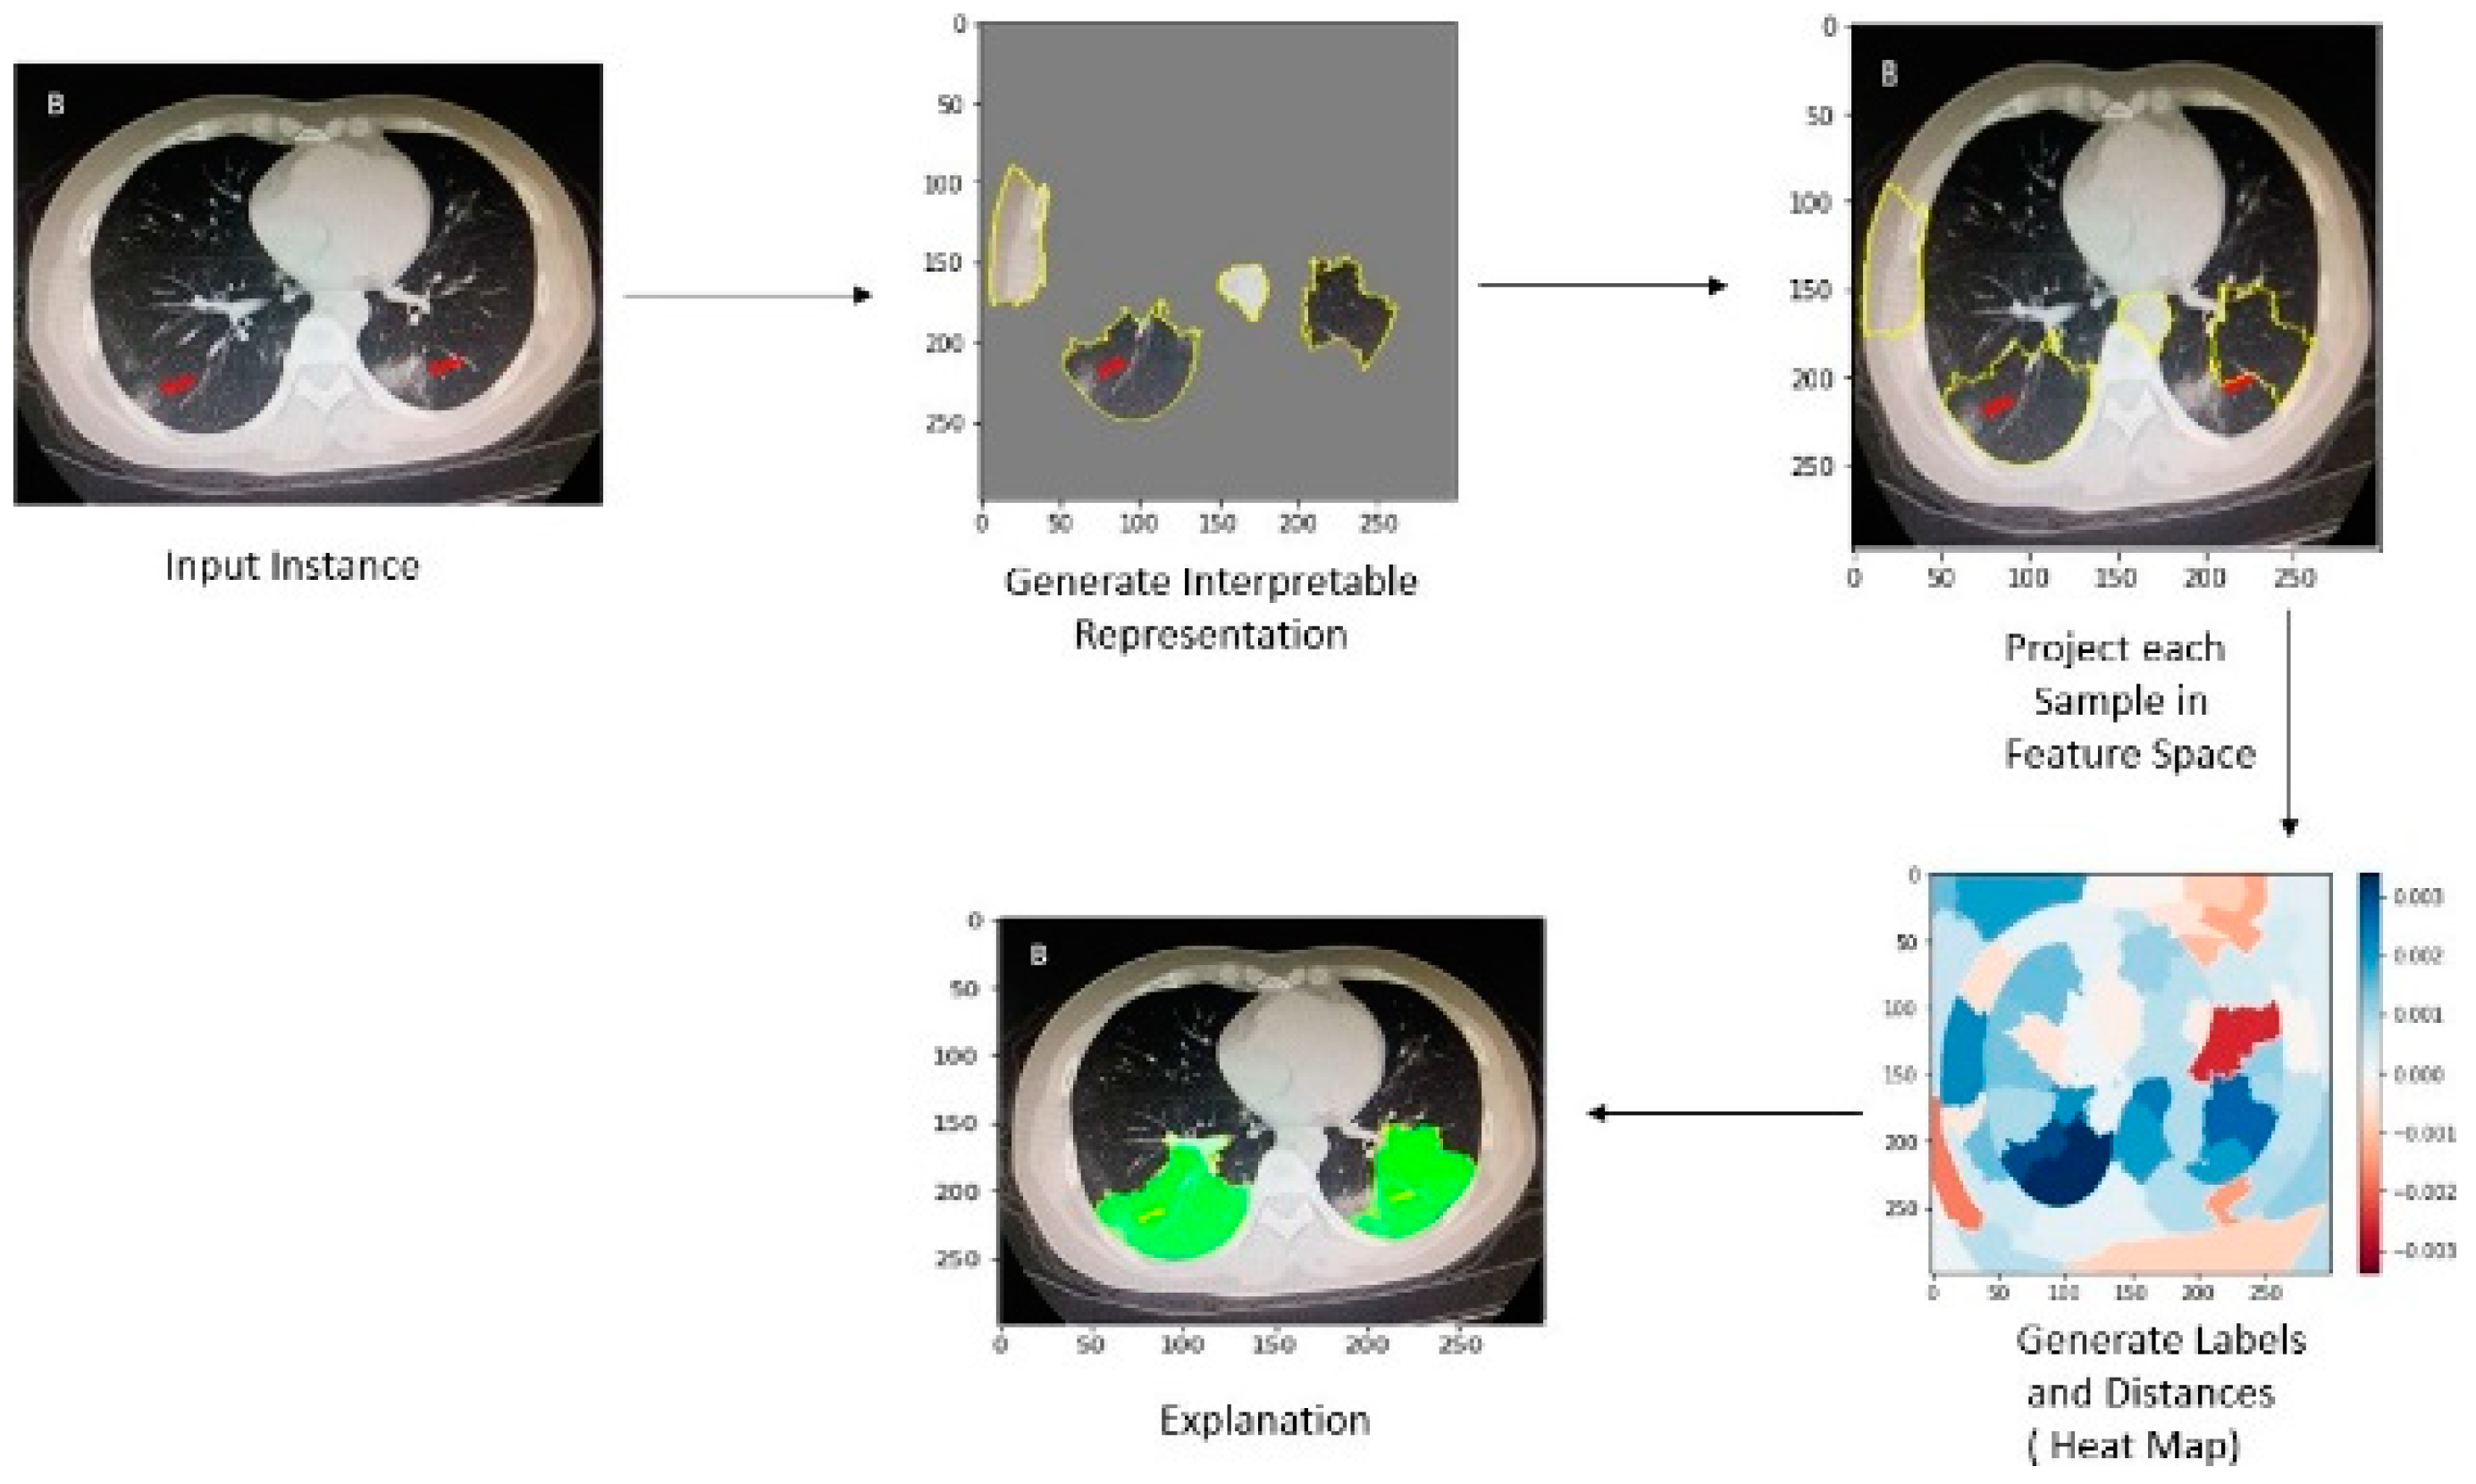
- Interpretable Model-agnostic Explanations (LIME) are used to explain the classification results. This unique explanation method may explain any classifier’s predictions in a comprehensible manner that provides the explanation in the form of highlighted regions in the input image in which part of the image is used in the classification result.
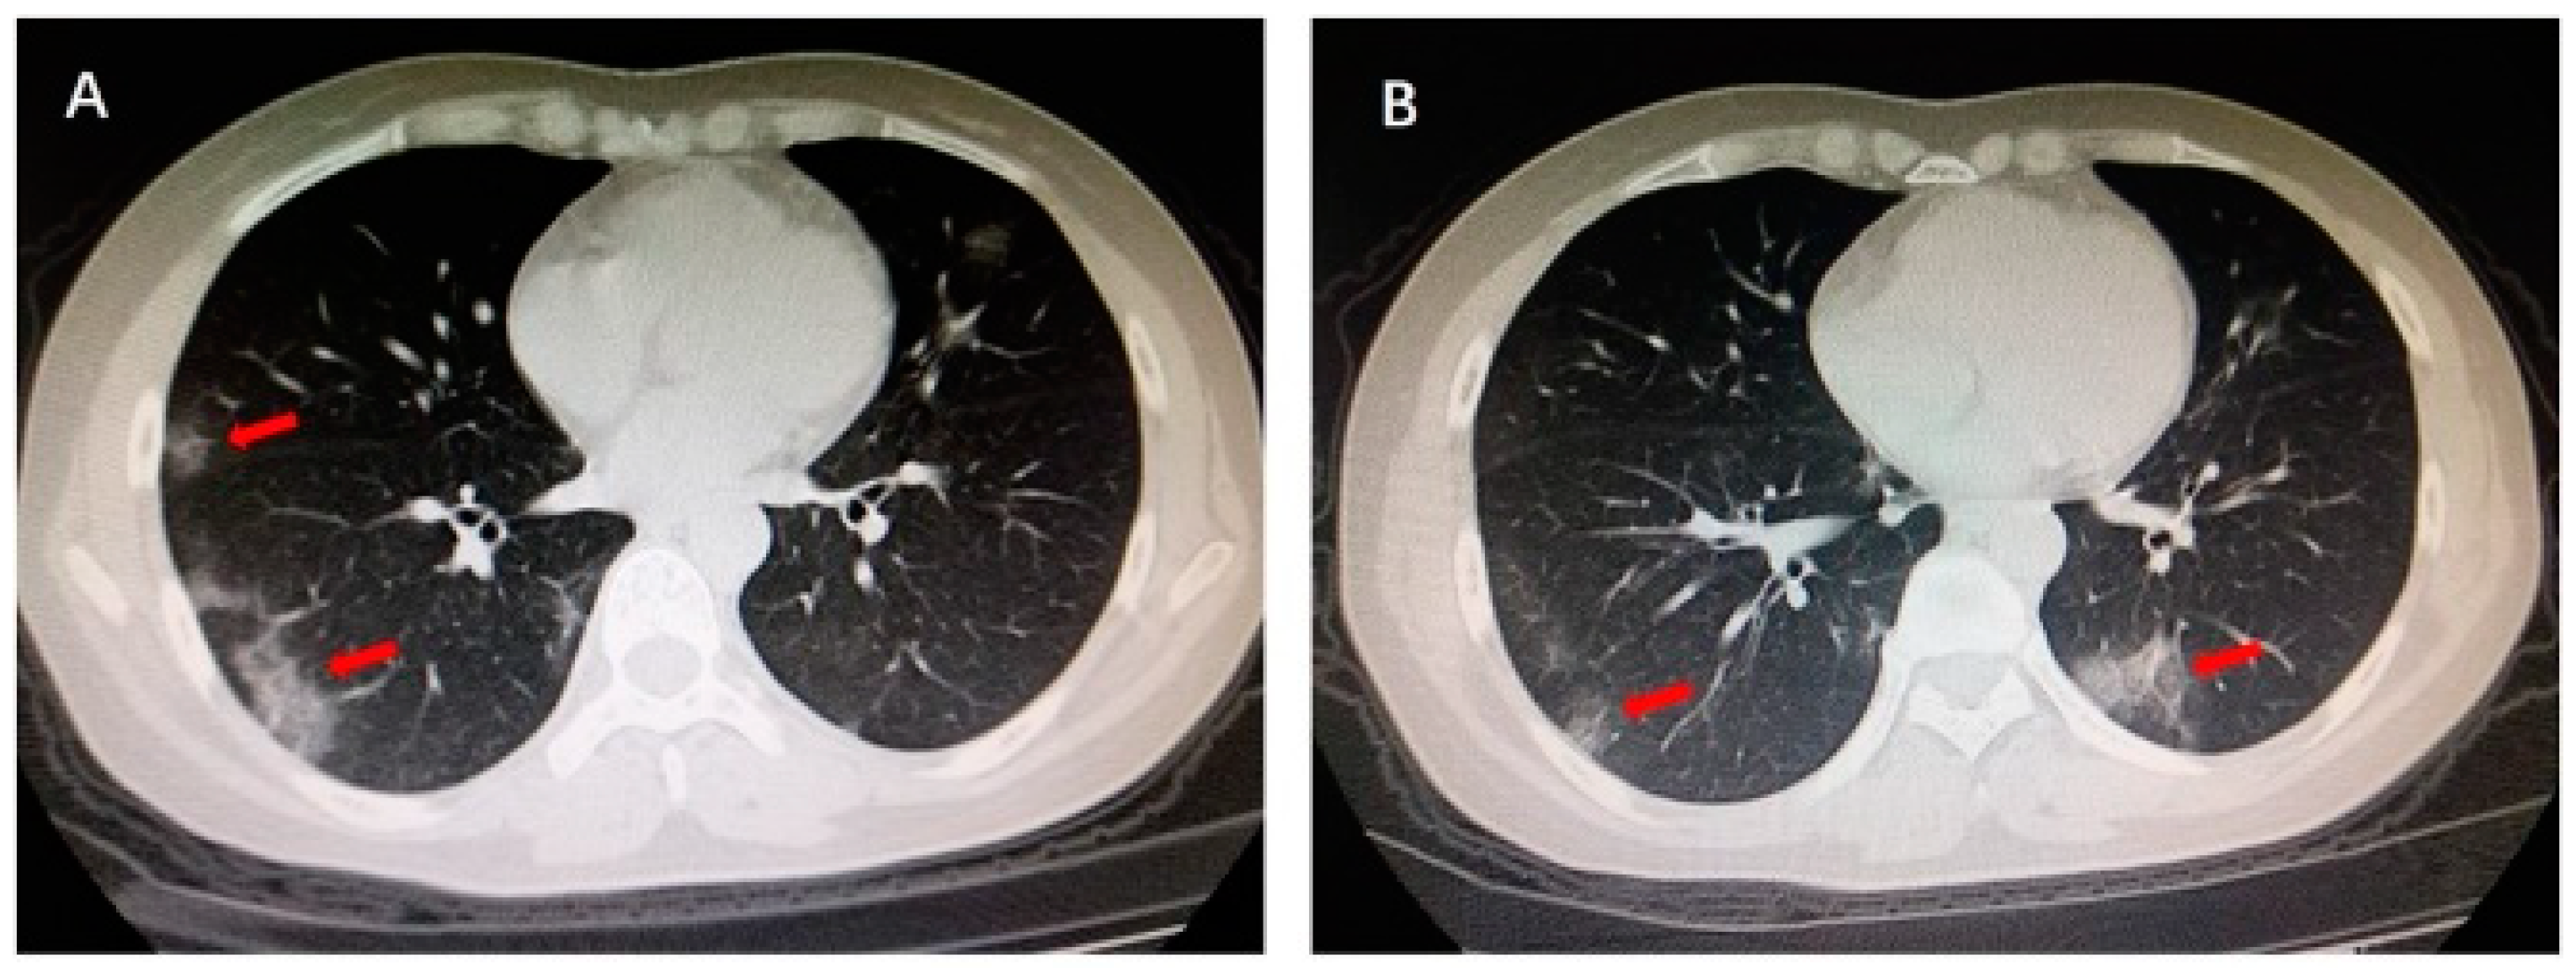
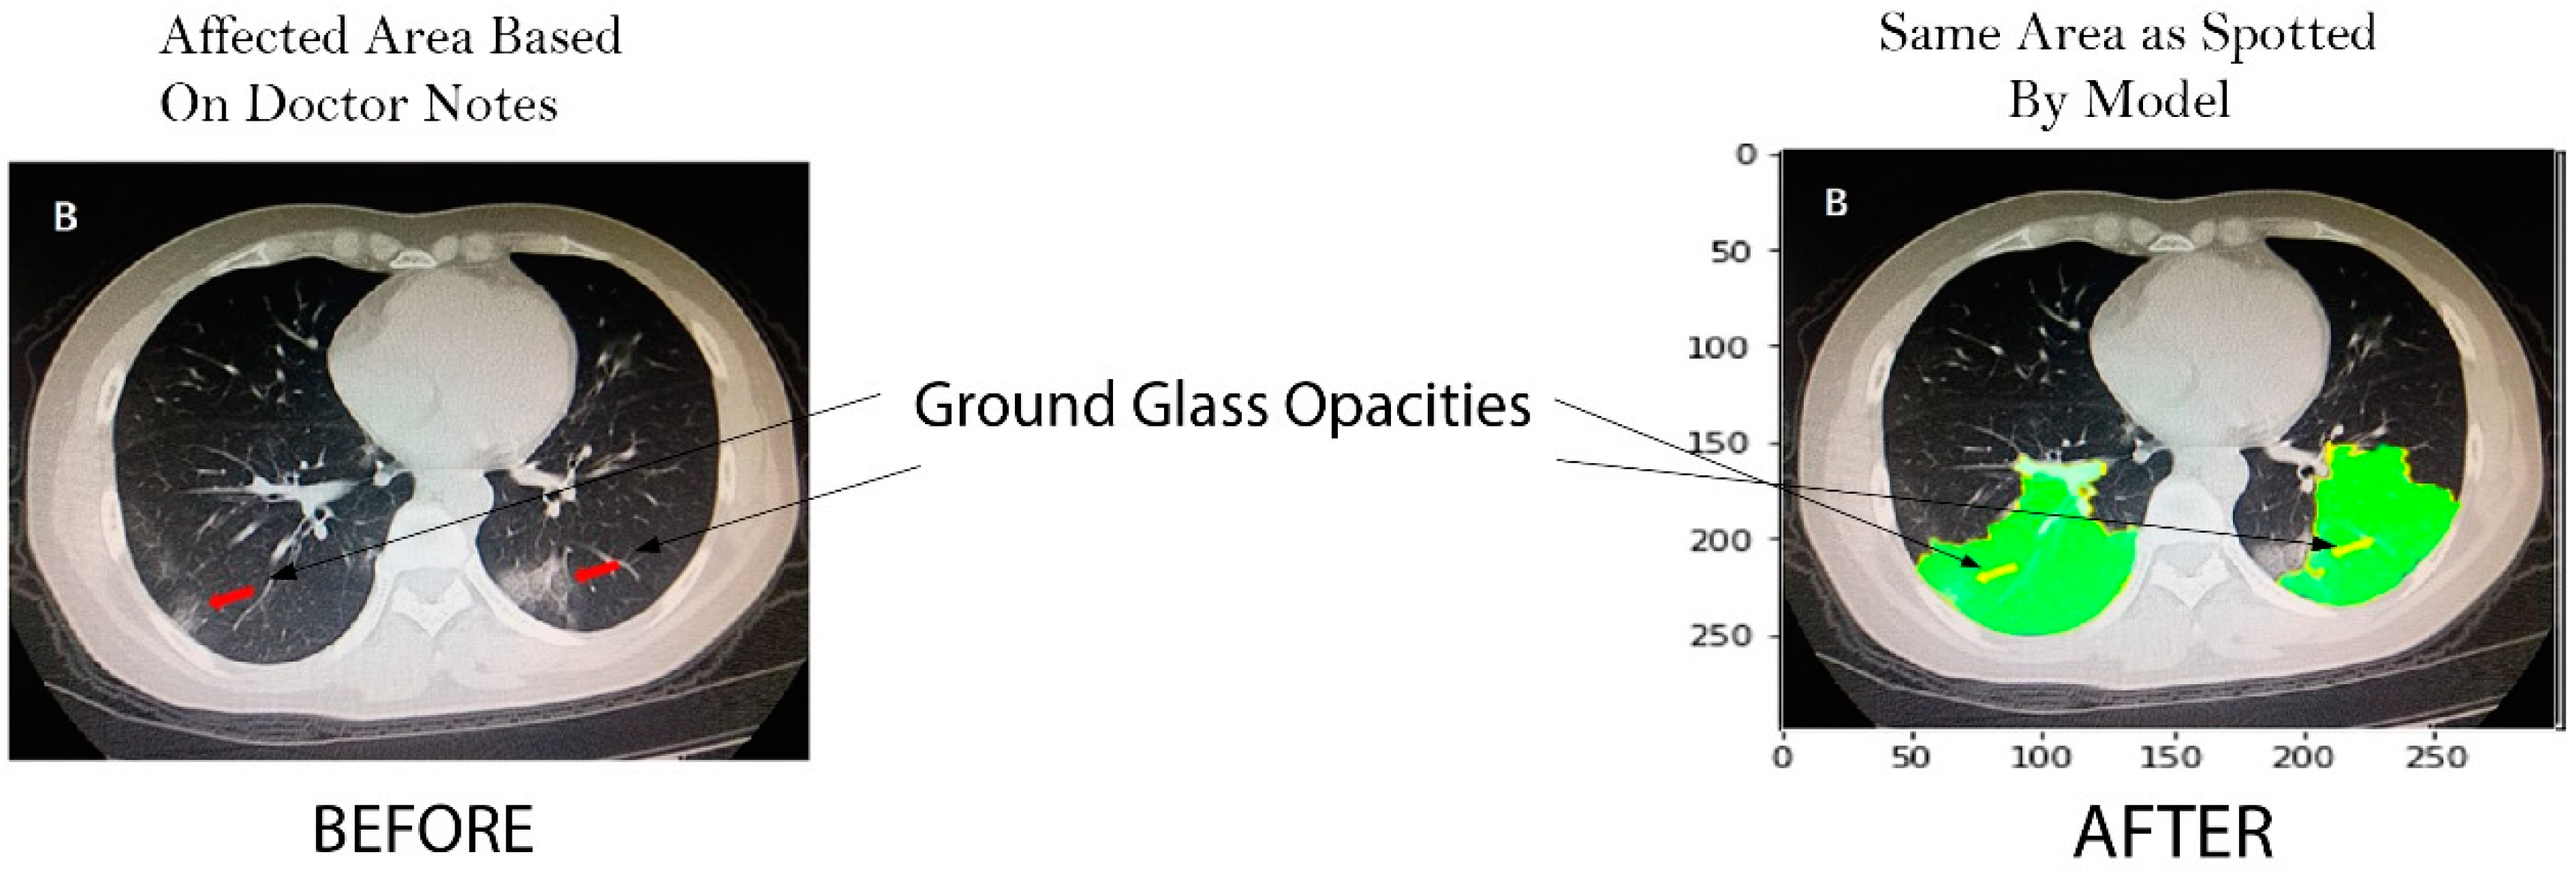
- For the evaluation of the explanation task, two CT images from a journal [38] are used that are diagnosed and highlighted by a verified doctor. This research paper shows that the interpretable model explains the same region that is highlighted by a doctor.
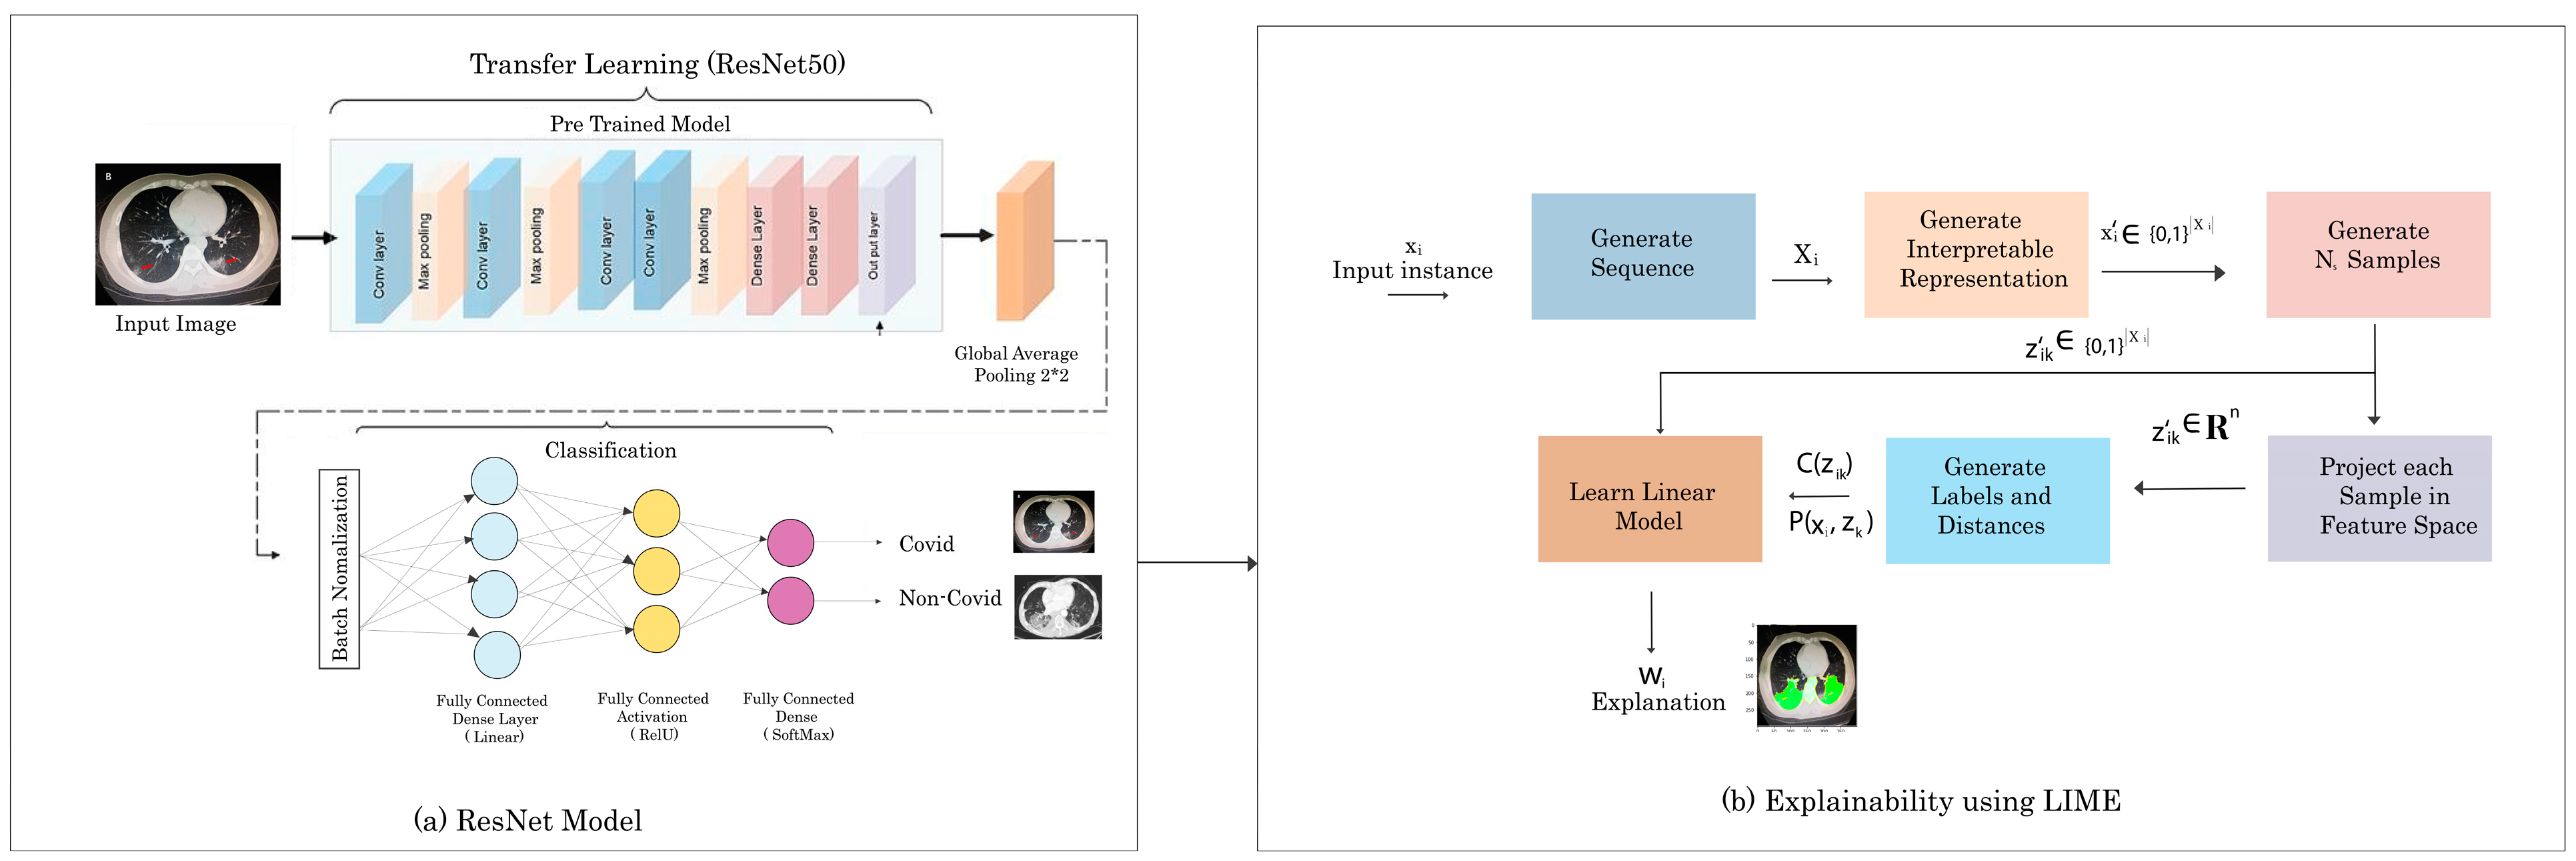
3. Proposed Methodology
3.1. Dataset
3.2. Proposed CNN Model
| Pseudocode ResNet50 |
| Input: Chest Radiographs Output: classification results: Covid Or Normal Start lr ← 1 × 10⁻⁴ ▷ lr is Initial_Learning_rate Batch_Size ← 32 Number_of_Epochs ← 28 Base_Model ← ResNet50(weights ← “imagenet”, include_top ← False, input_tensor ← Input (shape ← (224, 224, 3))) ▷ ResNet50 is the base Model headModel ← baseModel.output headModel ← AveragePooling2D(pool_size ← (7, 7))(headModel) headModel ← Flatten(name ← “flatten”)(headModel) headModel ← Dense(256, activation ← “relu”)(headModel) headModel ← Dropout(0.5)(headModel) headModel ← Dense(len(CLASSES), activation ← “softmax”)(headModel) model ← Model(inputs ← baseModel.input, outputs ← headModel) for layer in baseModel.layers: layer.trainable ← True end for opt ← optimizers.Adam (lr ← INIT_LR, decay ← INIT_LR/Number_of_Epochs) model.compile (loss ← “binary_crossentropy”, optimizer ← opt, metrics ← [“Accuracy”]) H ← model.fit_generator (trainGen, steps_per_epoch ← totalTrain, validation_data ← valGen, validation_steps ← totalVal, epochs ← Number_of_Epochs) End |
3.3. Classification and Explanation
| Algorithm 1. LIME |
| Require: Classifier f, Number of samples N Require: Instance x, and its interpretable version Require: Similarity kernel πx, Length of explanation K ← {} for i ∈ {1, 2, 3,..., N} do ← Sample around () ← ∪ (, f), ()) end for w ← K-Lasso(Z, K) ▷ with as features, f(z) as target return w |
4. Results and Discussion
4.1. Experimental Setup
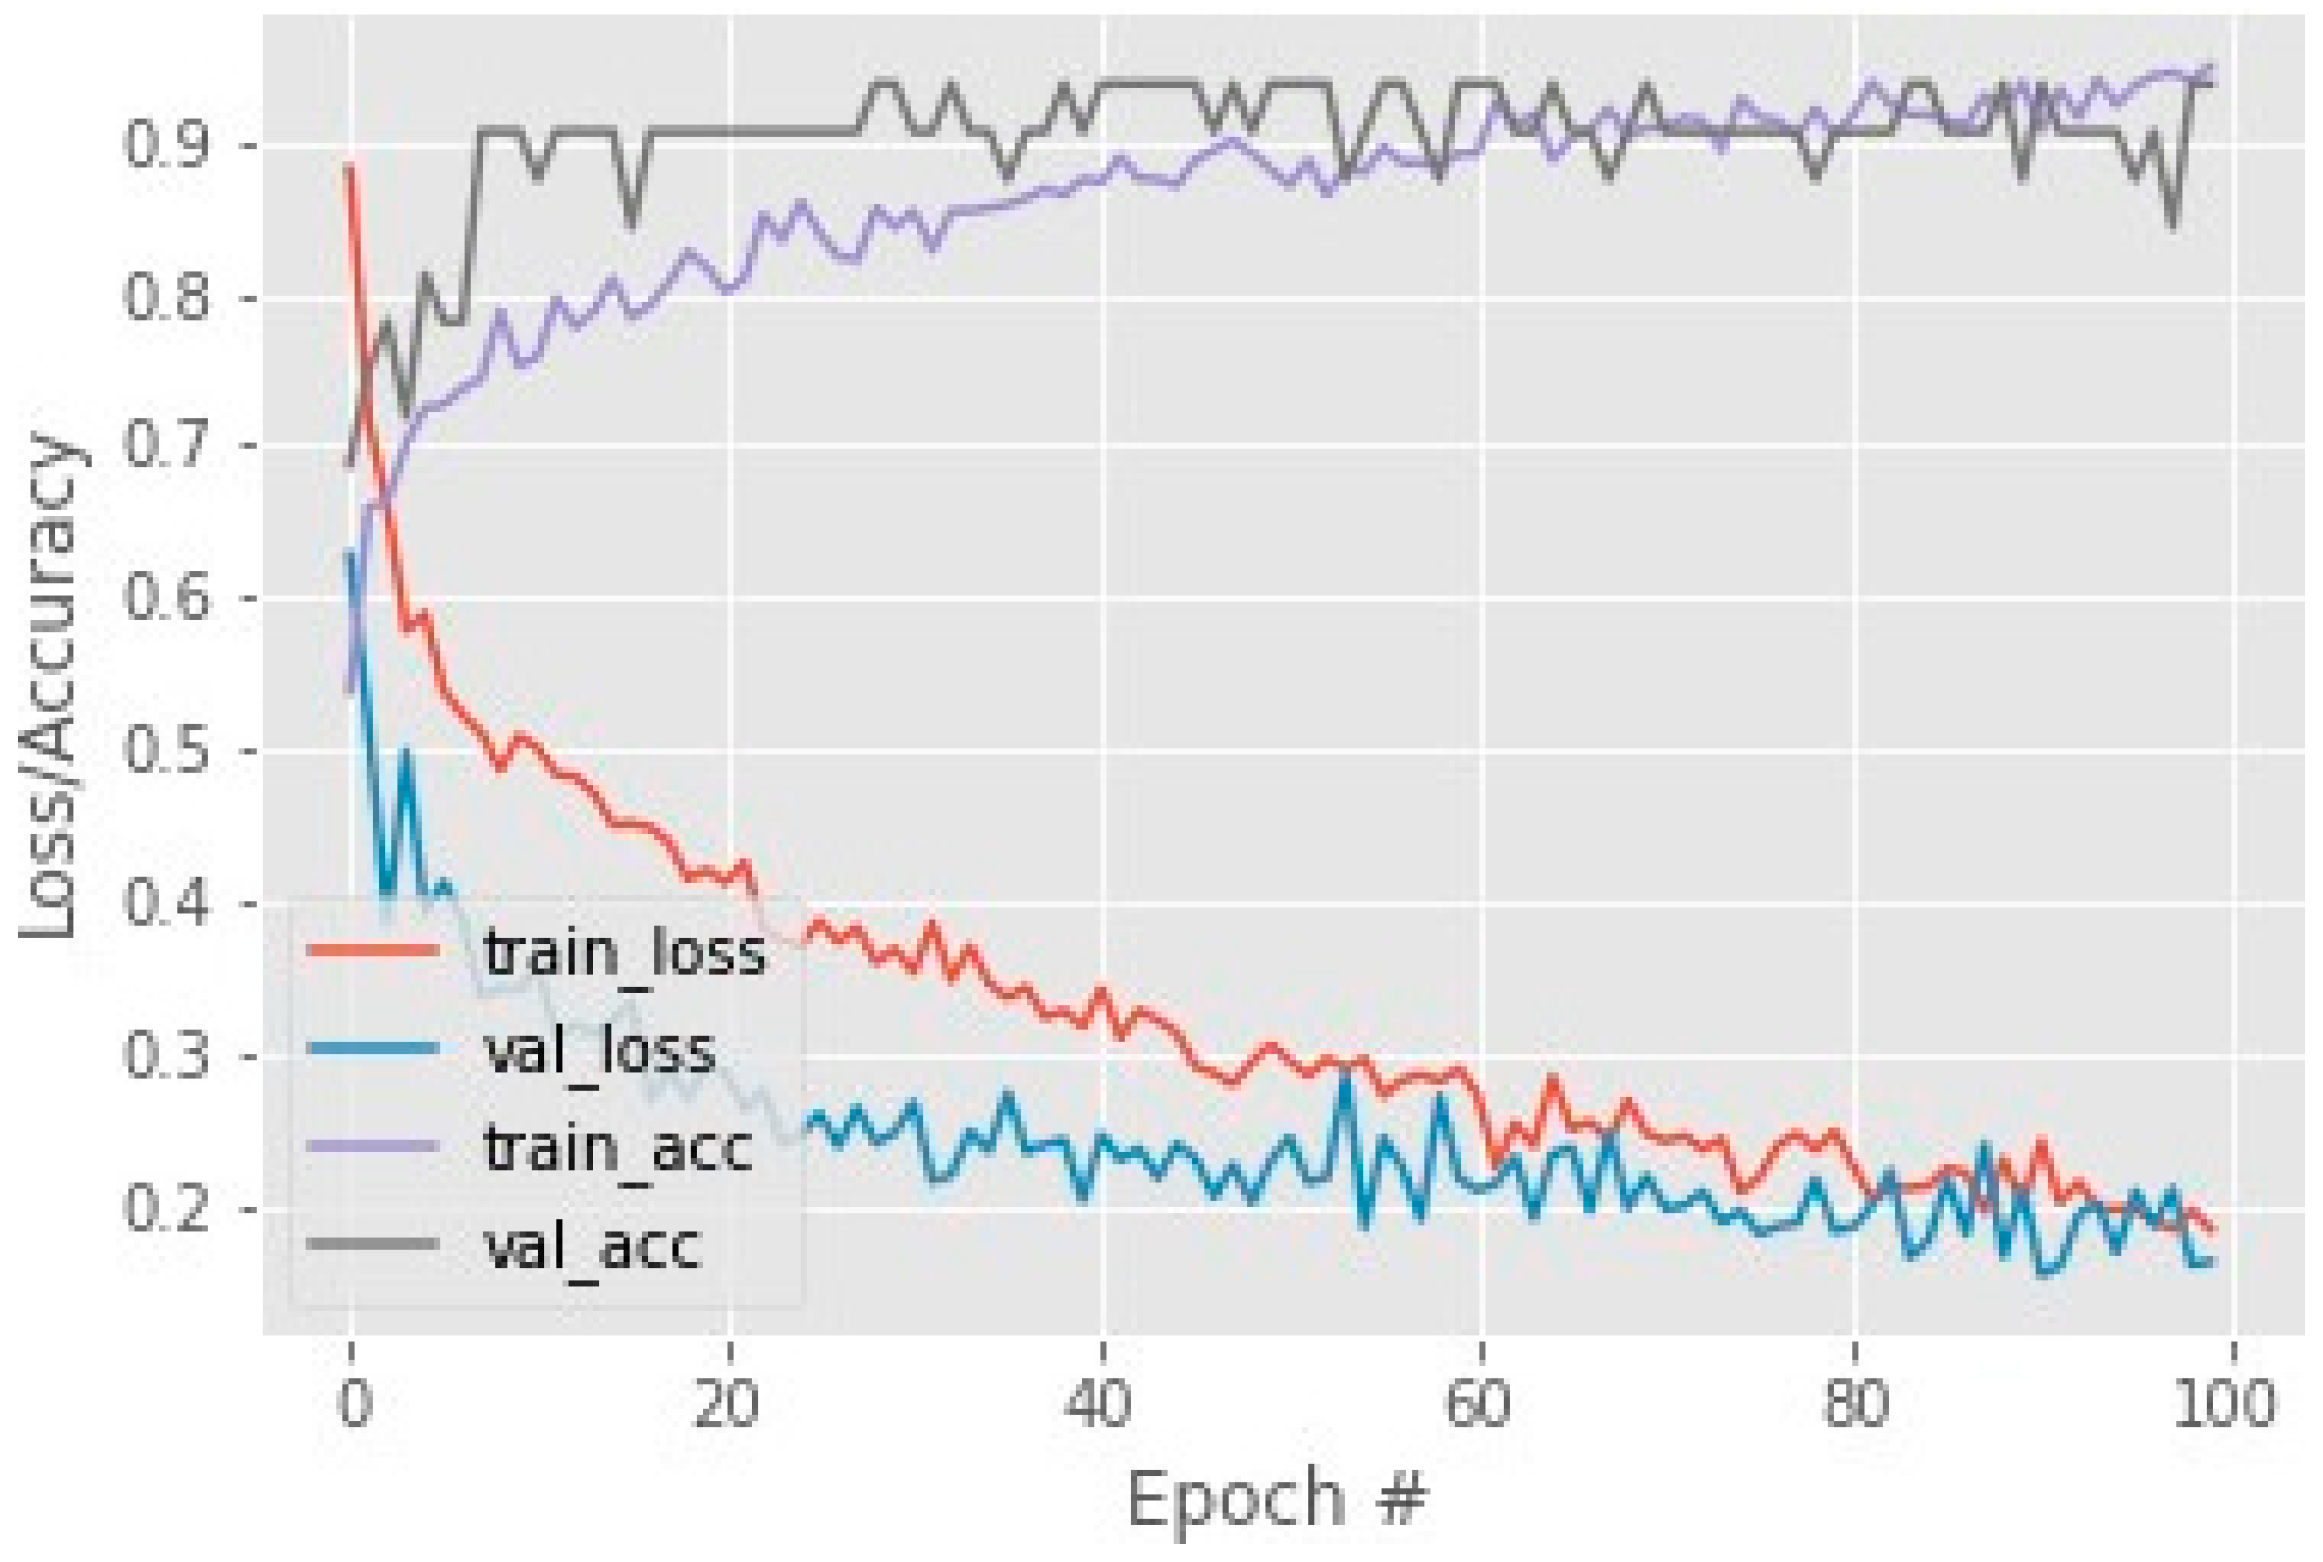
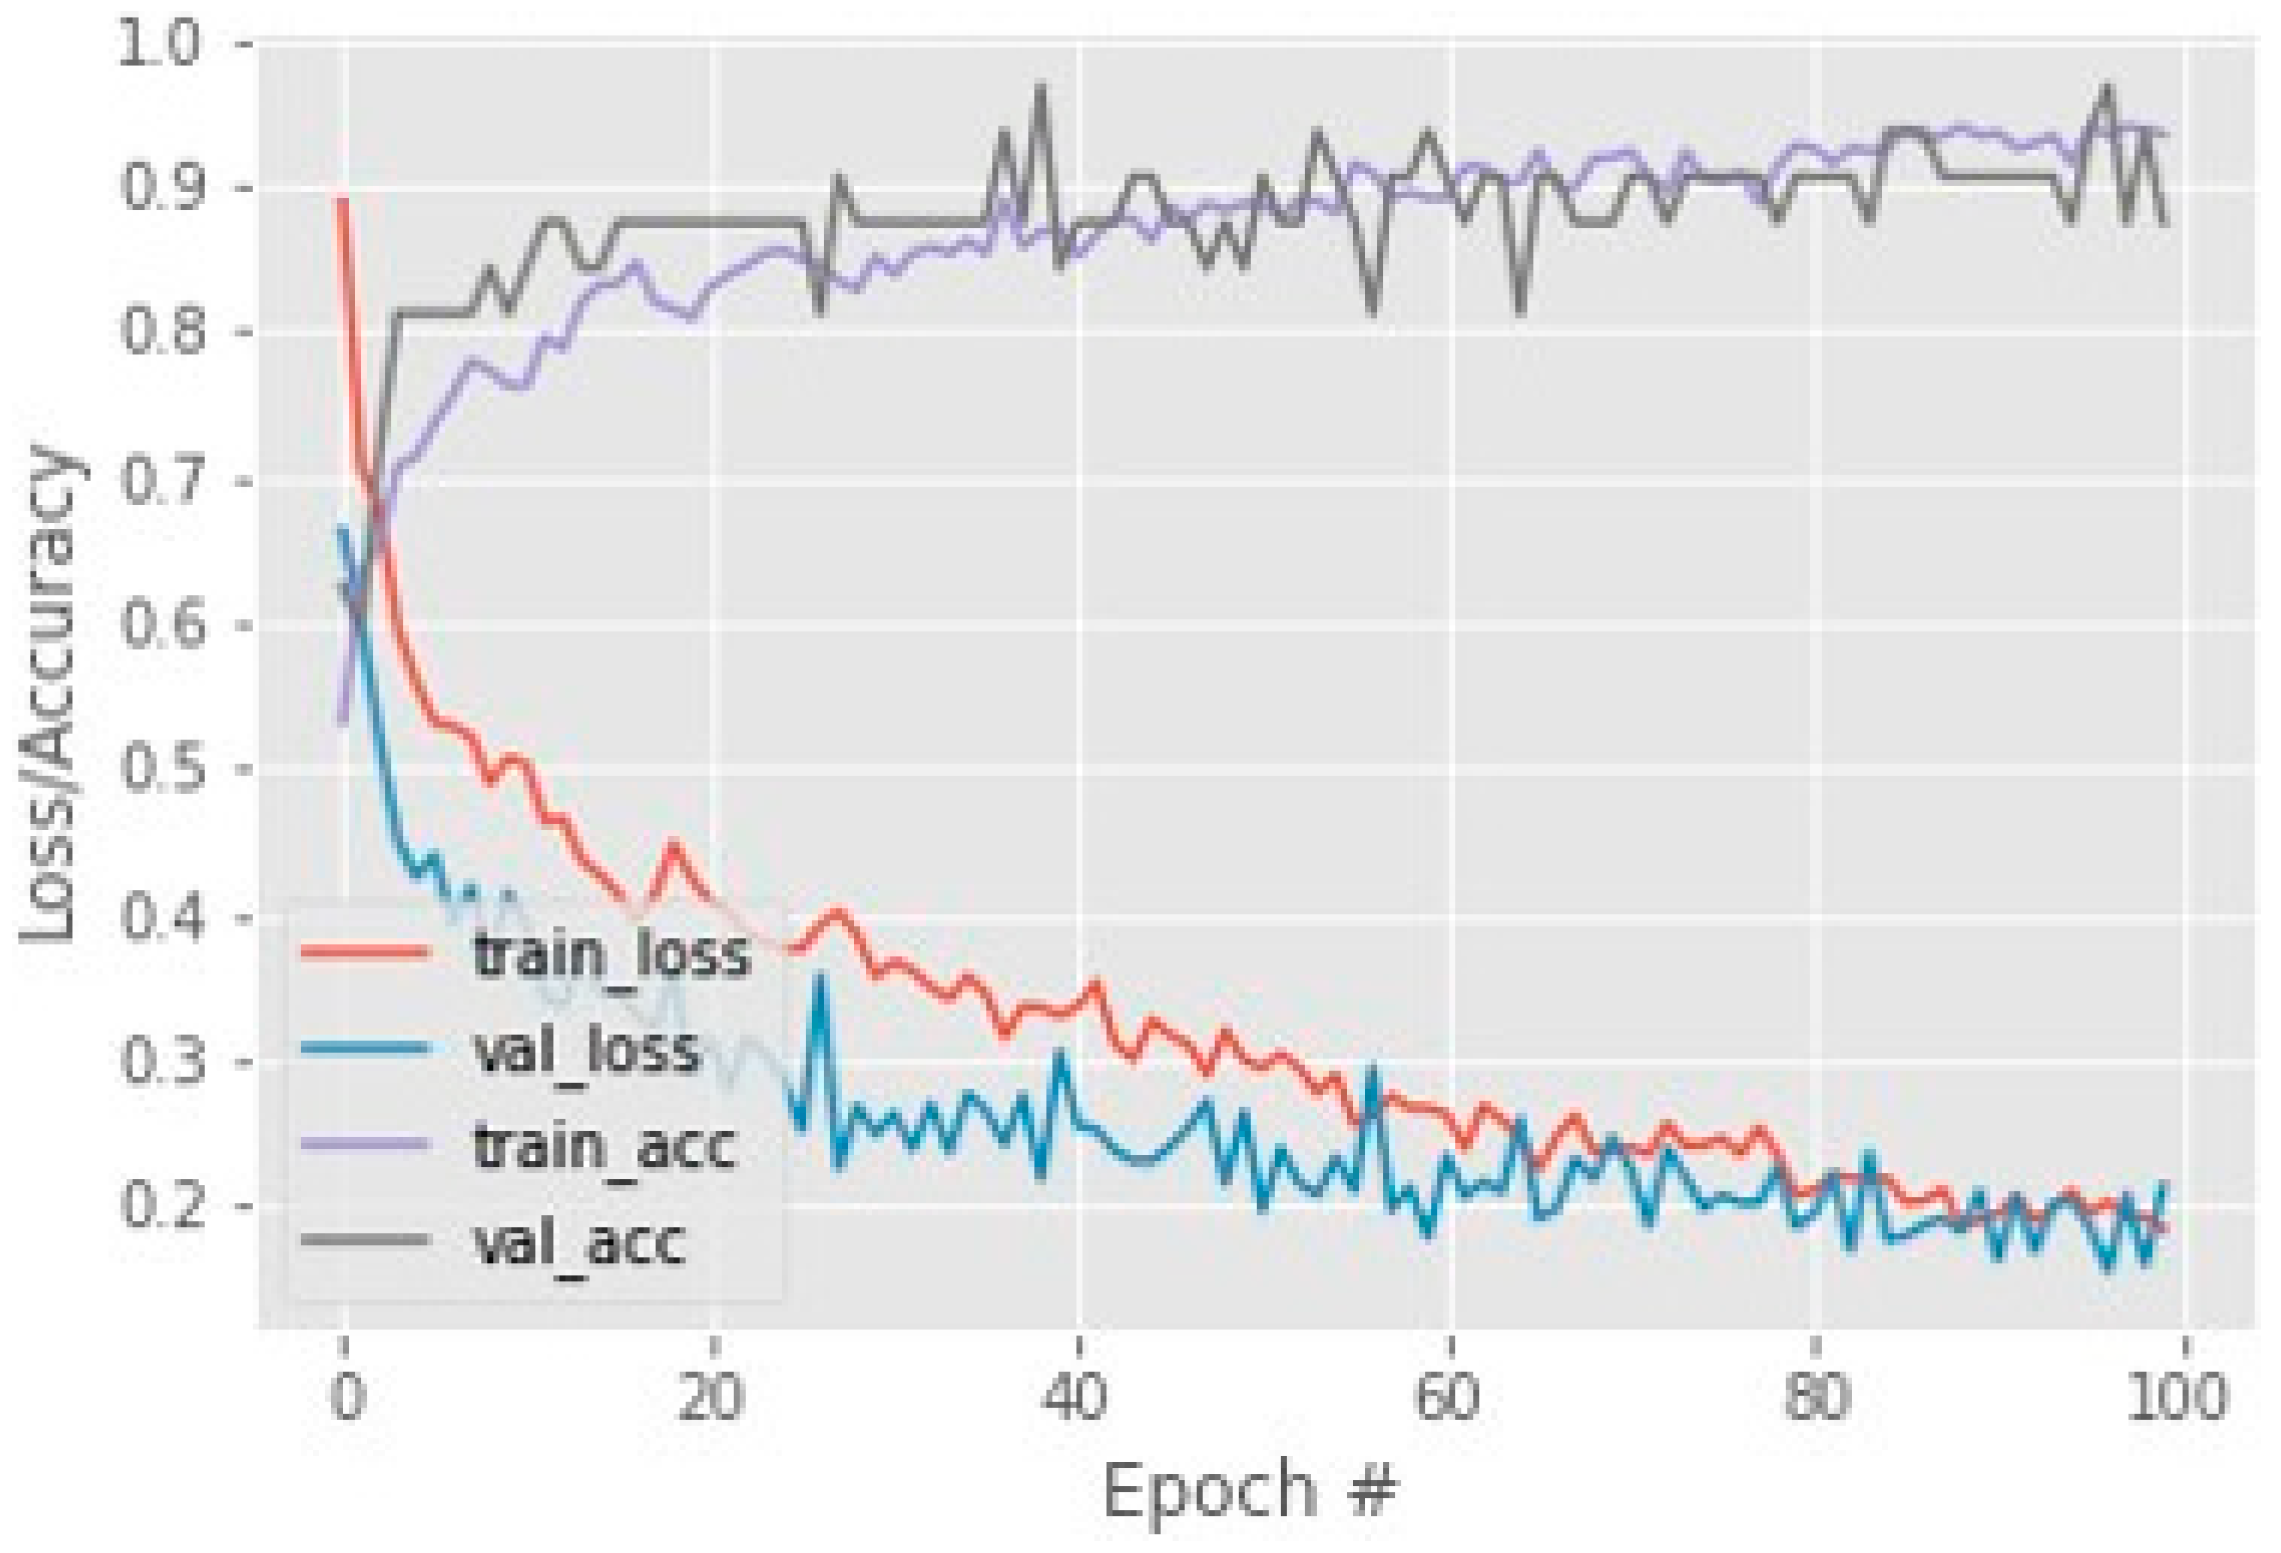
4.2. Performance Matrices
4.3. Comparative Analysis
5. Conclusions
Author Contributions
Funding
Institutional Review Board Statement
Informed Consent Statement
Data Availability Statement
Acknowledgments
Conflicts of Interest
References
- Saba, T. Automated lung nodule detection and classification based on multiple classifiers voting. Microsc. Res. Tech. 2019, 82, 1601–1609. [Google Scholar] [CrossRef] [PubMed]
- Centers for Disease Control and Prevention. Pneumonia Can Be Prevented—Vaccines Can Help; Centers for Disease Control and Prevention: Atlanta, GA, USA, 2012.
- Saba, T.; Sameh, A.; Khan, F.; Shad, S.A.; Sharif, M. Lung nodule detection based on ensemble of hand crafted and deep features. J. Med. Syst. 2019, 43, 332. [Google Scholar] [CrossRef] [PubMed]
- Wood, S.; Fuzaylov, G. Acute Pulmonary Edema Due to Occult Air Embolism Detected on an Automated Anesthesia Record: Illustrative Case. J. Neurosurg. Case Lessons 2021, 1, CASE2075. [Google Scholar] [CrossRef] [PubMed]
- Kumar, V.; Abbas, A.K.; Aster, J.C. Kumar: Robbins Basic Pathology; Elsevier: Amsterdam, The Netherlands, 2017. [Google Scholar]
- Haque, M.S.; Uddin, S.; Sayem, S.M.; Mohib, K.M. Coronavirus disease 2019 (COVID-19) induced waste scenario: A short overview. J. Environ. Chem. Eng. 2021, 9, 104660. [Google Scholar] [CrossRef] [PubMed]
- Rehman, A.; Saba, T.; Tariq, U.; Ayesha, N. Deep learning-based COVID-19 detection using CT and X-ray images: Current analytics and comparisons. IT Prof. 2021, 23, 63–68. [Google Scholar] [CrossRef]
- Javed, R.; Rahim, M.S.M.; Saba, T.; Rehman, A. A comparative study of features selection for skin lesion detection from dermoscopic images. Netw. Model. Anal. Health Inform. Bioinform. 2020, 9, 4. [Google Scholar] [CrossRef]
- Besekar, S.M.; Sayed, S. The beneficial effect of Nintedanib in the COVID-19 Patient with the Complication of Idiopathic Pulmonary Fibrosis: A Case report. Int. J. Case Rep. Health Sci. 2022, 12–18. Available online: http://ijcrhs.com/ijcrhs/article/view/3 (accessed on 10 August 2022).
- Ksibi, A.; Zakariah, M.; Ayadi, M.; Elmannai, H.; Shukla, P.K.; Awal, H.; Hamdi, M. Improved Analysis of COVID-19 Influenced Pneumonia from the Chest X-Rays Using Fine-Tuned Residual Networks. Comput. Intell. Neurosci. 2022, 2022, 9414567. [Google Scholar] [CrossRef]
- Abunadi, I.; Albraikan, A.A.; Alzahrani, J.S.; Eltahir, M.M.; Hilal, A.M.; Eldesouki, M.I.; Motwakel, A.; Yaseen, I. An Automated Glowworm Swarm Optimization with an Inception-Based Deep Convolutional Neural Network for COVID-19 Diagnosis and Classification. Healthcare 2022, 10, 697. [Google Scholar] [CrossRef]
- Abunadi, I.; Senan, E.M. Multi-Method Diagnosis of Blood Microscopic Sample for Early Detection of Acute Lymphoblastic Leukemia Based on Deep Learning and Hybrid Techniques. Sensors 2022, 22, 1629. [Google Scholar] [CrossRef]
- Pereira, R.M.; Bertolini, D.; Teixeira, L.O.; Silla, C.N.; Costa, Y.M.G. COVID-19 identification in chest X-ray images on flat and hierarchical classification scenarios. Comput. Methods Programs Biomed. 2020, 194, 105532. [Google Scholar] [CrossRef] [PubMed]
- Lella, K.K.; Pja, A. Automatic diagnosis of COVID-19 disease using a deep convolutional neural network with multi-feature channel from respiratory sound data: Cough, voice, and breath. Alex. Eng. J. 2022, 61, 1319–1334. [Google Scholar] [CrossRef]
- Hemdan, E.E.D.; El-Shafai, W.; Sayed, A. CR19: A framework for preliminary detection of COVID-19 in cough audio signals using machine learning algorithms for automated medical diagnosis applications. J. Ambient. Intell. Humaniz. Comput. 2022, 1–13. [Google Scholar] [CrossRef] [PubMed]
- Doornenbal, B.M.; Spisak, B.R.; van der Laken, P.A. Opening the black box: Uncovering the leader trait paradigm through machine learning. Leadersh. Q. 2022, 33, 101515. [Google Scholar] [CrossRef]
- Khan, S.A.; Nazir, M.; Khan, M.A.; Saba, T.; Javed, K.; Rehman, A.; Akram, T.; Awais, M. Lungs nodule detection framework from computed tomography images using support vector machine. Microsc. Res. Tech. 2019, 82, 1256–1266. [Google Scholar] [CrossRef] [PubMed]
- Ye, Q.; Xia, J.; Yang, G. Explainable AI for COVID-19 CT Classifiers: An Initial Comparison Study. In Proceedings of the 2021 IEEE 34th International Symposium on Computer-Based Medical Systems (CBMS), Aveiro, Portugal, 7–9 June 2021; Available online: https://ieeexplore.ieee.org/abstract/document/9474739/ (accessed on 2 August 2022).
- Garg, P.K. Overview of Artificial Intelligence. In Artificial Intelligence; Chapman and Hall/CRC: London, UK, 2021; pp. 3–18. [Google Scholar] [CrossRef]
- Yang, G.; Ye, Q.; Xia, J. Unbox the black-box for the medical explainable AI via multi-modal and multi-centre data fusion: A mini-review, two showcases and beyond. Inf. Fusion 2022, 77, 29–52. [Google Scholar] [CrossRef]
- Das, A.; Rad, P. Opportunities and Challenges in Explainable Artificial Intelligence (XAI): A Survey. arXiv 2020, arXiv:2006.11371. Available online: http://arxiv.org/abs/2006.11371 (accessed on 2 August 2022).
- Rajpurkar, P.; Irvin, J.; Zhu, K.; Yang, B.; Mehta, H.; Duan, T.; Ding, D.; Bagul, A.; Langlotz, C.; Shpanskaya, K. Chexnet: Radiologist-Level Pneumonia Detection on Chest X-rays with Deep Learning. arXiv 2017, arXiv:1711.05225. Available online: https://arxiv.org/abs/1711.05225 (accessed on 27 September 2022).
- Sirshar, M.; Hassan, T.; Akram, M.U.; Khan, S.A. An incremental learning approach to automatically recognize pulmonary diseases from the multi-vendor chest radiographs. Comput. Biol. Med. 2021, 134, 104435. [Google Scholar] [CrossRef]
- Teixeira, L.O.; Pereira, R.M.; Bertolini, D.; Oliveira, L.S.; Nanni, L.; Cavalcanti, G.D.; Costa, Y.M. Impact of Lung Segmentation on the Diagnosis and Explanation of COVID-19 in Chest X-ray Images. Sensors 2021, 21, 7116. [Google Scholar] [CrossRef]
- Ribeiro, M.T.; Singh, S.; Guestrin, C. ‘Why Should I Trust You?’ Explaining the Predictions of Any Classifier. In Proceedings of the 22nd ACM SIGKDD International Conference on Knowledge Discovery and Data Mining, San Francisco, CA, USA, 13–17 August 2016. [Google Scholar] [CrossRef]
- Ahsan, M.M.; Gupta, K.D.; Islam, M.M.; Sen, S.; Rahman, M.L.; Hossain, M.S. COVID-19 Symptoms Detection Based on NasNetMobile with Explainable AI Using Various Imaging Modalities. Mach. Learn. Knowl. Extr. 2020, 2, 490–504. [Google Scholar] [CrossRef]
- Wang, L.; Lin, Z.Q.; Wong, A. COVID-Net: A tailored deep convolutional neural network design for detection of COVID-19 cases from chest X-ray images. Sci. Rep. 2020, 10, 19549. [Google Scholar] [CrossRef] [PubMed]
- Zou, L.; Goh, H.L.; Liew, C.J.Y.; Quah, J.L.; Gu, G.T.; Chew, J.J.; Kumar, M.P.; Ang, C.G.L.; Ta, A. Ensemble image explainable AI (XAI) algorithm for severe community-acquired pneumonia and COVID-19 respiratory infections. IEEE Trans. Artif. Intell. 2022, 1. [Google Scholar] [CrossRef]
- Karim, M.R.; Dohmen, T.; Cochez, M.; Beyan, O.; Rebholz-Schuhmann, D.; Decker, S. DeepCOVIDExplainer: Explainable COVID-19 Diagnosis from Chest X-ray Images. In Proceedings of the 2020 IEEE International Conference on Bioinformatics and Biomedicine, BIBM 2020, Seoul, Republic of Korea, 16–19 December 2022; pp. 1034–1037. [Google Scholar] [CrossRef]
- Yang, X.; He, X.; Zhao, J.; Zhang, Y.; Zhang, S.; Xie, P. COVID-CT-Dataset: A CT Scan Dataset about COVID-19. arXiv 2020, arXiv:2003.13865. Available online: http://arxiv.org/abs/2003.13865 (accessed on 26 July 2022).
- Hall, L.O.; Paul, R.; Goldgof, D.B.; Goldgof, G.M. Finding Covid-19 from Chest X-rays using Deep Learning on a Small Dataset. arXiv 2020, arXiv:2004.02060. Available online: http://arxiv.org/abs/2004.02060 (accessed on 10 January 2022).
- Pandit, M.K.; Banday, S.A. SARS n-CoV2-19 detection from chest x-ray images using deep neural networks. Int. J. Pervasive Comput. Commun. 2020, 16, 419–427. [Google Scholar] [CrossRef]
- Singh, M.; Bansal, S.; Ahuja, S.; Dubey, R.K.; Panigrahi, B.K.; Dey, N. Transfer learning based ensemble support vector machine model for automated COVID-19 detection using lung computerized tomography scan data. Med. Biol. Eng. Comput. 2021, 5, 825–839. [Google Scholar] [CrossRef]
- Mahmud, T.; Rahman, M.A.; Fattah, S.A. CovXNet: A multi-dilation convolutional neural network for automatic COVID-19 and other pneumonia detection from chest X-ray images with transferable multi-receptive feature optimization. Comput. Biol. Med. 2020, 122, 103869. [Google Scholar] [CrossRef]
- Aleem, M.; Raj, R.; Khan, A. Comparative performance analysis of the ResNet backbones of Mask RCNN to segment the signs of COVID-19 in chest CT scans. arXiv 2020, arXiv:2008.09713. Available online: http://arxiv.org/abs/2008.09713 (accessed on 10 January 2021).
- Soin, K.S. Detection and Diagnosis of COVID-19 via SVM-Based Analyses of X-ray Images and Their Embeddings. 2020. Available online: www.ijisrt.com644 (accessed on 10 January 2021).
- Pandit, M.; Banday, S.; Naaz, R.; Chishti, M. Automatic detection of COVID-19 from chest radiographs using deep learning. Radiography 2021, 27, 483–489. Available online: https://www.sciencedirect.com/science/article/pii/S1078817420302285 (accessed on 9 January 2021). [CrossRef]
- Chen, D.; Xu, W.; Lei, Z.; Huang, Z.; Liu, J.; Gao, Z.; Peng, L. Recurrence of positive SARS-CoV-2 RNA in COVID-19: A case report. Int. J. Infect. Dis. 2020, 93, 297–299. [Google Scholar] [CrossRef] [PubMed]


| Methodology | Dataset | Explainability Models | Accuracy % |
|---|---|---|---|
| ResNet 101 [18] | 897 CT Scans | CAM, LIME | 85% |
| U-Net CNN [24] | 1478 X-rays | Grad-CAM, LIME | 83% |
| VGG16, ResNet [27] | 3975 CXRs | GSInquire | 83% |
| Xception [28] | 2235 chest X-rays | SHAP, Grad-CAM++ | 87% |
| DenseNet, ResNet, VGGNet [29] | 5959 CXRs | Grad-CAM++, LRP | 90% |
| DenseNet169 [30] | 787 CT Scans | Not Used | 85% |
| Proposed Mode | 787 CT Scans, 10,000 CXRs Scans | LIME | 93%, 97% |
| Methodology | Dataset | Accuracy % |
|---|---|---|
| VGG16 [31] | 455 X-rays | 82.2% |
| VGG-16 [32] | 1428 X-ray | 92% |
| VGG16, SVM [33] | 718 CT scans | 83.5% |
| CovXNets [34] | 305 X-rays | 80.2% |
| RCNN, ResNet, ResNet101 [35] | 669 CT scans | 83% |
| SVM [36] | 1380 CT scans | 63% |
| VGG-16 [37] | 1428 CT scans | 82.5% |
| Dataset | Total | Classes |
|---|---|---|
| COVID-CT | 800 | 2 |
| COVID-NET | 19,000 | 3 |
| Type | Non-COVID | COVID |
|---|---|---|
| Train | 234 | 191 |
| Test | 58 | 60 |
| Validate | 105 | 98 |
| CNN Model | Accuracy % |
|---|---|
| DenseNet169 | 85 |
| MobileNet | 83 |
| COVID LargeNet | 88 |
| Our Model | 93 |
| Measures | COVID-CT Dataset | COVID Net Dataset |
|---|---|---|
| COVID or NON-COVID | COVID or NON-COVID | |
| Precision | 87-93 | 98-93 |
| Recall | 92-88 | 92-98 |
| F1 Measure | 90-90 | 95-95 |
| Accuracy | 93 | 97 |
| XAI Methods | XAI Clinical Features | Agnostic or Specific | Global/Local |
|---|---|---|---|
| GSInquire [24] | Absorption Area | Specific | Local |
| SHAP, Grad-CAM++ [25] | Glass Opacities | Specific | Local |
| Grad-CAM, LIME [21] | Glass Opacities | Specific | Global |
| DeepCOVIDExplainer [29] | Lesion Dissipation | Agnostic | Local |
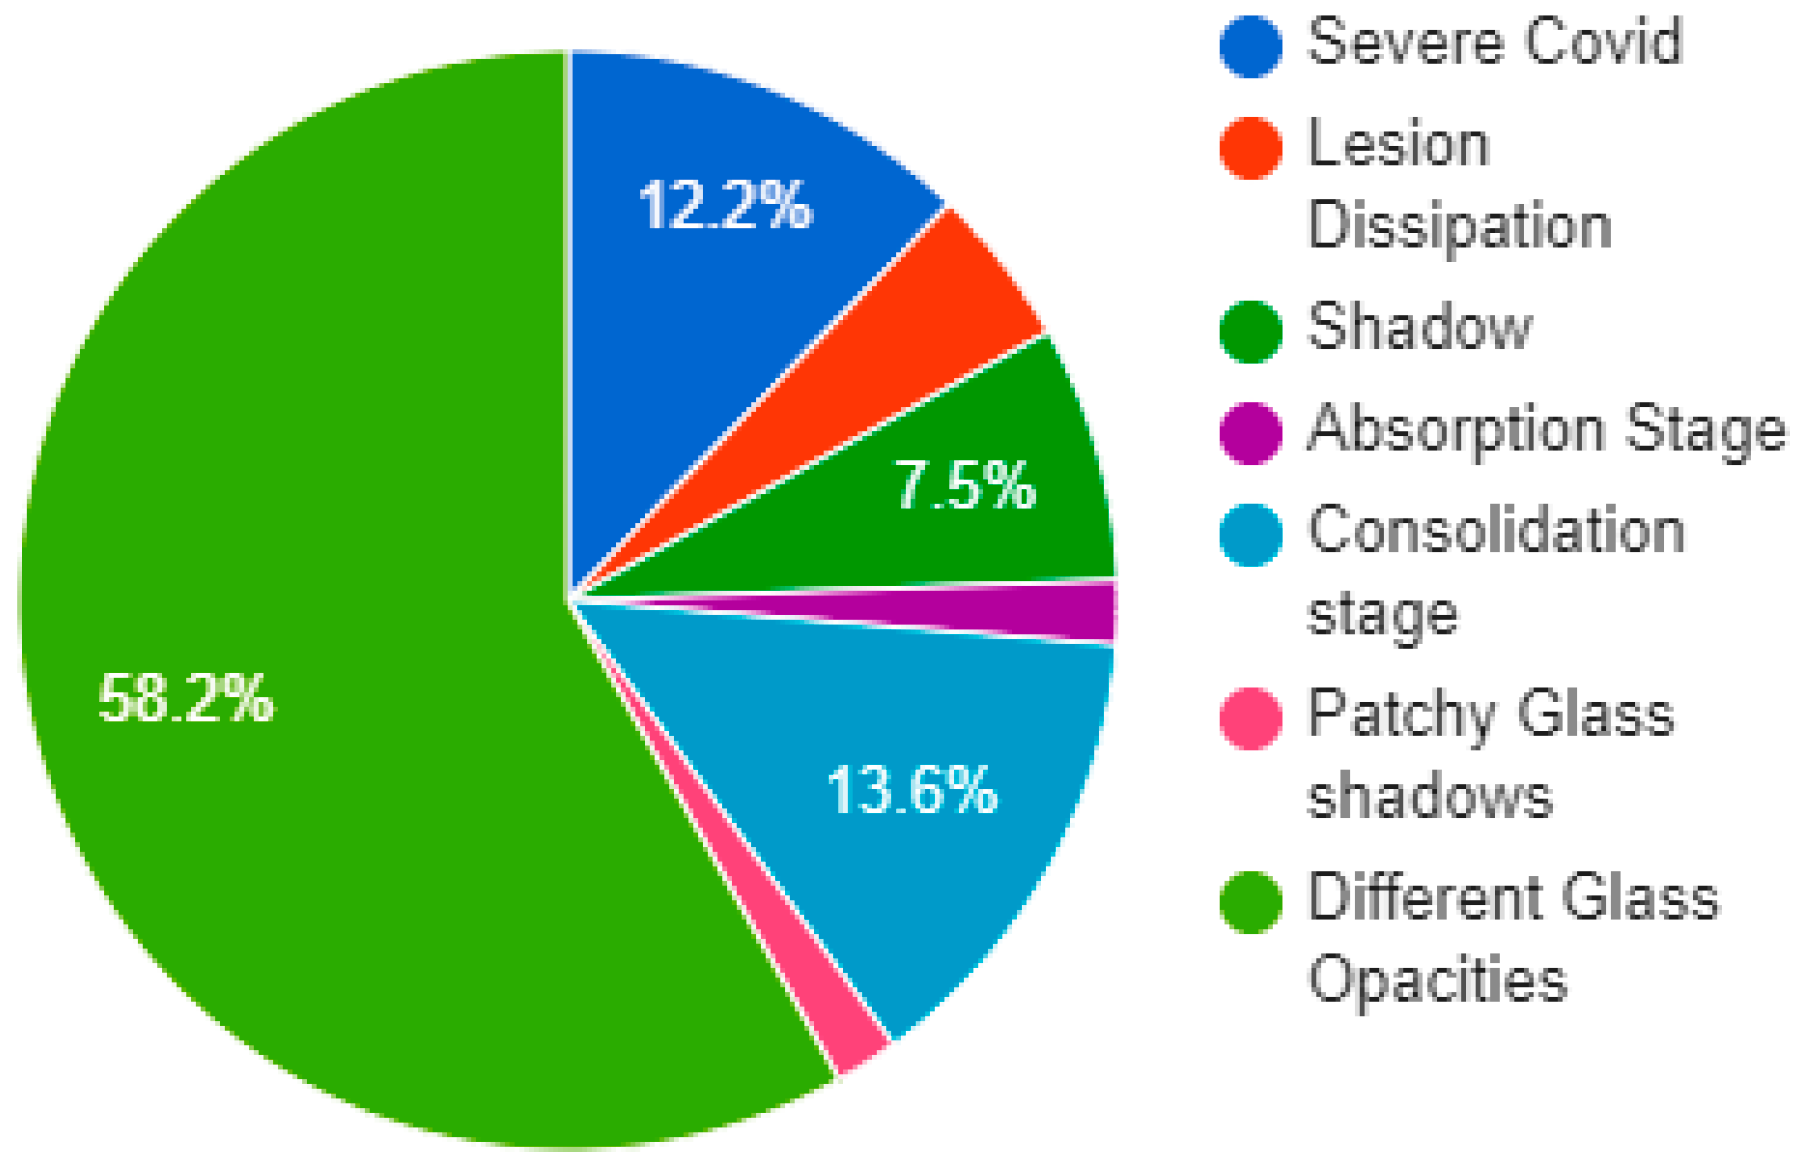
| Proposed XAI Model (LIME) | Lesion, Dissipation, Consolidation area, Absorption area, patchy Glass Shadow, Glass Opacities | Agnostic | Both |
Disclaimer/Publisher’s Note: The statements, opinions and data contained in all publications are solely those of the individual author(s) and contributor(s) and not of MDPI and/or the editor(s). MDPI and/or the editor(s) disclaim responsibility for any injury to people or property resulting from any ideas, methods, instructions or products referred to in the content. |
© 2023 by the authors. Licensee MDPI, Basel, Switzerland. This article is an open access article distributed under the terms and conditions of the Creative Commons Attribution (CC BY) license (https://creativecommons.org/licenses/by/4.0/).
Share and Cite
Naz, Z.; Khan, M.U.G.; Saba, T.; Rehman, A.; Nobanee, H.; Bahaj, S.A. An Explainable AI-Enabled Framework for Interpreting Pulmonary Diseases from Chest Radiographs. Cancers 2023, 15, 314. https://doi.org/10.3390/cancers15010314
Naz Z, Khan MUG, Saba T, Rehman A, Nobanee H, Bahaj SA. An Explainable AI-Enabled Framework for Interpreting Pulmonary Diseases from Chest Radiographs. Cancers. 2023; 15(1):314. https://doi.org/10.3390/cancers15010314
Chicago/Turabian StyleNaz, Zubaira, Muhammad Usman Ghani Khan, Tanzila Saba, Amjad Rehman, Haitham Nobanee, and Saeed Ali Bahaj. 2023. "An Explainable AI-Enabled Framework for Interpreting Pulmonary Diseases from Chest Radiographs" Cancers 15, no. 1: 314. https://doi.org/10.3390/cancers15010314