2. Experimental Section
Materials. The iridium chloride salt (IrCl
3·nH
2O) was purchased from Johnson Mattey. The ligands 2-phenylbenzimidazole, 2-(2′-pyridylbenzimidazole), 2-(2′-aminophenylbenzimidazole), 2-(2′-aminophenylbenzothiazole), 2-(2′-hydroxyphenylbenzimidazole) and 2-(2′-hydroxyphenylbenzothiazole) were purchased from Sigma-Aldrich. The ligands 2-phenyl-N-methyl-benzimidazole and 2-(2′-pyridyl)l-N-methyl-benzimidazole were prepared according to slightly modified reported protocols [
48]. Deuterated solvents were obtained from SDS and Euriso-top. Unless otherwise specified, all the biological reagents were purchased from Merck Life Science S.L.U., Madrid, Spain. Calf thymus DNA provided as a highly polymerized lyophilized sodium salt was dissolved into doubly-deionized water and sonicated with an MSE-Sonyprep sonicator to reduce the polymer length at approximately 1000 base-pairs. The molar DNA concentration in base pairs, ε (260 nm) = 13,200 M
−1 cm
−1 [
49], will be expressed as C
P. BSA was supplied as crystallized and lyophilized powder (≥98%, agarose gel electrophoresis and ≤0.005% fatty acids); the BSA concentration of the stock solutions was spectrophotometrically determined as ε (278 nm) = 45,000 M
−1 cm
−1. All aqueous solutions were prepared with MilliQ-grade water using a Direct-Q8UV system from Millipore (Millipore Ibérica S.A., Madrid, Spain). All solvents were of analytical grade. The chemical studies were carried out in aqueous solutions at 25 °C, I = 2.5 mM sodium cacodylate (NaCaC) and pH between 6.0 and 7.1 unless other conditions are stated. All buffers with the biological components were of biological grade and used as received.
Synthesis and characterization.
Synthesis of ligands. Synthesis of 2-Phenyl-N-methyl-benzimidazole (pbim), [C,NMe]. In a 250 mL Round-bottomed flask, Cs2CO3 (3.3509 g, 10 mmol) was added to a solution of 2-phenylbenzimidazole (1 g, 5.15 mmol) in DMSO (30 mL). Some extra DMSO (20 mL) was added to the flask, and the mixture was heated to 80 °C for 1 h 30 min. After that, CH3I (481 µL, 7.73 mmol) was added, and the mixture was stirred at RT overnight. Water was added until a white solid was completely precipitated. The solid was filtered off and then dissolved in diethyl ether/toluene to get rid of DMSO traces and evaporate water more easily. The solvent was evaporated to dryness and washed with cold water (2 × 3 mL). The white solid was completely dried in a desiccator until it reached a constant weight. Yield: 548.4 mg (2.63 mmol, 51%).
2-(2′-Pyridyl)l-N-methyl-benzimidazole (pybim), [N,NMe]. In a 250 mL round-bottomed flask, Cs2CO3 (3.3377 g, 10.24 mmol) was added to a solution of 2-(2′-pyridyl)benzimidazole (1 g, 5.12 mmol) in DMSO (25 mL). The mixture was heated to 80 °C for 1 h 30 min. After that, CH3I (478 µL, 7.68 mmol) was added, and it was left to RT overnight. Water was added until a white solid was completely precipitated. The solid was filtered off and washed with cold water (2 × 10 mL). The white solid was completely dried in a desiccator until constant weight. Yield: 772.1 mg (3.69 mmol, 72%).
Synthesis of complexes. Synthesis of [(η5-Cp*)IrCl(κ2-N,C-pbim)], 1[C,NH-Cl]. In a 100 mL Schlenk flask, the pro-ligand 2-phenylbenzimidazole (151 mg, 0.777 mmol) was added to a solution of [(η5-Cp*)IrCl2]2 (300.5 mg, 0.377 mmol) and sodium acetate (1.02·103 mg, 7.5 mmol) in degassed dichloromethane (20 mL), and the mixture was stirred at room temperature for 20 h under a nitrogen atmosphere. An orange precipitate was formed this time. Water (3 mL) was added to extract the inorganic salts and AcOH compounds, and the mixture was filtered to isolate the crude product. The powder was washed with dichloromethane (1 × 5 mL) and diethyl ether (1 × 5 mL), filtered and dried in a vacuum. The orange solid was dissolved in a mixture of methanol-dichloromethane (18 mL, 2:1) with sodium chloride (6 mg, 0.103 mmol), and the mixture was stirred at room temperature overnight. The solution was concentrated to produce a precipitate. The solid was filtered and washed with dichloromethane (1 × 5 mL), water (1 × 5 mL) and diethyl ether (2 × 5 mL). The resulting orange powder was dried in a vacuum at 50 °C (water bath) for 1 h. The yield was 278.9 mg (0.502 mmol, 65%). The purity (HPLC) was >99%. Mr (C23H24N2ClIr) = 556.1287 g/mol. The anal. calcd for C23H24N2ClIr·(CH2Cl2)0.4 was C 47.63, H 4.24 and N 4.75; we found C 47.58, H 4.18 and N 4.37. The 1H NMR (400 MHz, DMSO-d6, 25 °C) δ 13.60 (s, 1H, HN-H), 8.12 (dd, J = 5.4, 3.5 Hz, 1H, H3′), 7.80 (dd, J = 5.6, 3.0 Hz, 1H, H6′), 7.70 (dd, J = 4.7, 3.8 Hz, 1H, Hc), 7.51 (d, J = 7.3 Hz, 1H, Hf), 7.46–7.38 (m, 2H, He, Hd), 7.32 (dd, J = 5.7, 3.1 Hz, 2H, H5′, H4′) and 1.76 (s, 15H, HCp*(Me)) ppm. The 13C{1H} NMR (101 MHz, DMSO-d6, 25 °C) δ 164.2 (s, 1C, C1′), 151.8 (s, 1C, Ca), 139.1 (s, 1C, Cg), 136.3 (s, 1C, C6′), 135.2 (s, 2C, C2′, Cb), 130.9 (s, 1C, C5′), 125.0 (s, 1C, C3′), 124.5 (s, 1C, C4′), 123.6 (s, 1C, Cd), 123.4 (s, 1C, Ce), 114.6 (s, 1C, Cc), 114.3 (s, 1C, Cf), 95.5 (s, 5C, CCp*) and 8.9 (s, 5C, CCp*(Me)) ppm. NMR spectra were recorded in DMSO-d6 due to the low solubility of this product in other solvents, and so the resulting spectra correspond to [(η5-Cp*)Ir(DMSO-d6)(κ2-N,C-pbim)]Cl. FT-IR (ATR, cm−1) selected bands: 3423 (w, νN-H), 3139-3111-3064 (m, ν=CH), 2962-2911 (m, ν-CH), 1592 (s, νC=C+C-N), 1536 (s), 1469-1458 (s, νC=N), 1432 (s), 1379 (w, δCH3), 1278-1262 (s), 1095 (m), 1027 (m), 801 (w, δC-C), 738-729 (vs, δCHoop), 670 (w). MS (FAB+): in DMSO for [(η5-Cp*)Ir(DMSO-d6)(κ2-N,C-Pbim)]Cl: m/z (%) = 600 (18) ([M-Cl+H]+), 522 (100) ([M-Cl-DMSO+H]+). For the molar conductivity (H2O), no data was available due to low solubility in water or acetonitrile. In terms of solubility, it was soluble in dimethyl sulfoxide (which involves Cl−/DMSO replacement) and DMF, partially soluble in methanol and insoluble in water and dichloromethane.
Synthesis of [(η5-Cp*)Ir(DMSO)(κ2-N,C-pbim)]Cl, 1[C,NH-DMSO]. In a 100 mL Schlenk flask, DMSO (38 μL, 0.535 mmol) was added to a solution of 1[C,NH-Cl] (30 mg, 0.054 mmol) in degassed dichloromethane (9 mL), and the mixture was stirred at room temperature for 20 h under a nitrogen atmosphere. The solution was concentrated, and diethyl ether was added to precipitate the product. The solvent was removed with filtration to isolate a white-yellowish powder that was washed with diethyl ether (2 × 5 mL) and dried in a vacuum at 50 °C (water bath) for 1 h. The yield was 25.6 mg (0.040 mmol, 74%). The Mr (C25H30N2SOClIr) = 634.2635 g/mol. The anal. calcd for C25H30N2SOClIr·(CH2Cl2)0.6 was C 43.89, H 4.67, N 4.16 and S 4.76; we found C 43.62, H 4.73, N 4.20 and S 4.71. The 1H NMR (400 MHz, DMSO-d6, 25 °C) δ 14.29 (s, 1H, HN-H), 8.00 (dd, J = 5.4, 3.5 Hz, 1H, H3′), 7.80 (dd, J = 5.3, 3.2 Hz, 1H, H6′), 7.71 (d, J = 8.2 Hz, 1H, Hc), 7.51 (d, J = 6.7 Hz, 1H, Hf), 7.48–7.40 (m, 2H, He, Hd), 7.32 (dd, J = 5.6, 3.3 Hz, 2H, H5′, H4′) and 1.77 (s, 15H, HCp*(Me)) ppm. The 1H NMR (400 MHz, D2O, 25 °C) δ 7.90 (dd, J = 8.6, 5.2 Hz, 2H), 7.76–7.69 (m, 1H), 7.61–7.56 (m, 1H), 7.52–7.47 (m, 2H), 7.42–7.36 (m, 2H), 2.94 (s, 3H, HCH3(DMSO)), 2.41 (s, 3H, HCH3(DMSO)) and 1.80 (s, 15H, HCp*(Me)) ppm. The FT-IR (ATR, cm−1) selected bands were 3354 (w, νN-H), 2899 (m, ν-CH), 1593 (s, νC=C+C-N), 1540 (s), 1469-1455 (s, νC=N), 1434 (s), 1379 (w, δCH3), 1278 (s), 1117 (vs, νS=O), 1014 (vs), 746 (vs, νC-S) and 685 (w), 427 (vs). The MS (FAB+): m/z (%) = 600 (4) ([M+H]+), 522 (10) ([M-DMSO+H]+). It was soluble in dimethyl sulfoxide and water and partially soluble in methanol.
Synthesis of [(η5-Cp*)IrCl(κ2-N,C-NMepbim)], 2[C,NMe-Cl]. In a 100 mL Schlenk flask, the pro-ligand 2-phenyl-N-Methylbenzimidazole (54 mg, 0.0.259 mmol) was added to a solution of [(η5-Cp*)IrCl2]2 (100 mg, 0.129 mmol) and sodium acetate (360 mg, 2.646 mmol) in degassed dichloromethane (18 mL), and the mixture was stirred at room temperature for 20 h under a nitrogen atmosphere. Hexane was added to precipitate the complex, and the solution was concentrated. The orange solid was filtered and then dissolved in a mixture of methanol-dichloromethane (13 mL, 5:8) with sodium chloride (13 mg, 0.224 mmol), and the mixture was stirred at room temperature overnight. The solvent was evaporated to dryness and washed with water (2 × 5 mL) and diethyl ether (2 × 5 mL). The resulting orange powder was dried in a vacuum at 50 °C (water bath) for 1 h. The yield was 75.4 mg (0.132 mmol, 51%). The purity (HPLC) was >99%. The Mr (C24H26N2ClIr) = 570.1555 g/mol. The anal. calcd for C24H26N2ClIr was C 50.56, H 4.60 and N 4.91; we found C 50.51, H 4.56 and N 5.18. The 1H NMR (400 MHz, DMSO-d6, 25 °C) δ 8.18–8.12 (m, 1H, H3′), 7.95 (m, 1H, Hc), 7.89–7.83 (m, 1H, H6′), 7.56–7.49 (m, 3H, Hd, He, Hf), 7.39–7.32 (m, 2H, H4′, H5′), 4.35 (s, 3H, Hh) and 1.75 (s, 15H, HCp*(Me)). The 13C{1H} NMR (101 MHz, DMSO-d6, 25 °C) δ 162.0 (s), 153.7 (s), 137.8 (s), 136.9 (s), 136.1 (s), 134.5 (s), 131.1 (s), 126.5 (s), 124.6 (s), 124.3 (s), 124.2 (s), 115.3 (s), 112.5 (s), 95.8 (s, 5C, CCp*), 32.4 (s, 1C, Ch) and 8.9 (s, 5C, CCp*(Me)) ppm. The FT-IR (KBr, cm−1) selected bands were 2904 (w, ν-CH), 1579 (s, νC=C + C-N), 1506 (s), 1479-1456 (s, νC=N), 1420-1402 (s), 1376 (m, δCH3), 1276 (m), 1153 (m), 1027-1010 (s), 828 (m, δC-C), 764 (vs), 727 (vs, δCHoop), 612 (s) and 449 (s). The MS (ESI+) in methanol was m/z (%) = 565 (79) ([M-Cl+OCH3-H]+), 535 (100) ([M-Cl]+). The molar conductivity (CH3CN) was 13.0 S·cm2·mol−1. It was soluble in dimethyl sulfoxide (with substitution of the Cl−), partially soluble in methanol and acetonitrile and insoluble in water and dichloromethane.
Synthesis of [(η5-Cp*)IrCl(κ2-N,N-pybim)]Cl, 3[N,NH-Cl]. In a 100 mL Schlenk flask, the ligand pybim (0.0505 g, 0.259 mmol) was added to a solution of [IrCl2(Cp*)]2 (0.1002 g, 0.126 mmol) in dichloromethane (14 mL), and the mixture was stirred at room temperature for 20 h and under a nitrogen atmosphere. The solution was concentrated, and the product was precipitated with hexane and filtered off. The resulting yellow powder was dried in a vacuum at 50 °C (water bath) for 1 h. The yield was 147.7 mg (0.249 mmol, 98%). The purity (HPLC) was >98%. The Mr (C22H24N3Cl2Ir) = 593.5771 g/mol. The anal. calcd for C22H24N3Cl2Ir·(CH2Cl2)1.1 was C 40.50, H 3.78 and N 5.45; we found C 40.39, H 3.84 and N 6.12. The 1H NMR (400 MHz, CDCl3, 25 °C) δ 16.21 (s, 1H, HN-H), 9.67 (d, J = 8.2 Hz, 1H, H3′), 8.76 (d, J = 5.7 Hz, 1H, H6′), 8.15 (t, J = 7.8 Hz, 1H, H4′), 8.01 (d, J = 8.2 Hz, 1H, Hc), 7.65 (d, J = 8.1 Hz, 1H, Hf), 7.61–7.53 (m, 1H, H5′), 7.53–7.45 (m, 1H, Hd), 7.42 (t, J = 7.7 Hz, 1H, He) and 1.75 (s, 15H, HCp(Me)) ppm. The 13C{1H} NMR (101 MHz, CDCl3, 25 °C) δ 152.3 (s, 1C, Ca), 150.64 (s, 1C, C6′), 148.2 (s, 1C, C2′), 140.8 (s, 1C, C4′), 138.7 (s, 1C, Cg), 135.5 (s, 1C, Cb), 127.4 (s, 1C, C5′), 126.5 (s, 1C, C3′), 126.2 (s, 1C, Cd), 125.1 (s, 1C, Ce), 116.2 (s, 1C, Cd), 115.8 (s, 1C, Cf), 88.3 (s, 1C, CCpC) and 9.7 (s, 1C, CCp(Me)) ppm. The FT-IR (ATR, cm−1) selected bands were 3389 (vs, νN-H), 3029 (w, ν C=CH), 2963-2915 (w, ν-CH), 1612-1594 (m, νC=C + C-N), 1484-1457-1447 (vs, νC=N), 1382 (m, δCH3), 1325 (m), 1261 (m), 1028 (s), 795 (m, δC-C) and 760 (s, δCHoop). The MS (FAB+) was m/z (%) = 648 (4), 559 (12) ([M-Cl+H]+), 522 (5) ([M-2Cl-H]+). The molar conductivity (CH3CN) was 27.1 S·cm2·mol−1. It was soluble in water, dichloromethane, chloroform, acetonitrile and acetone.
Synthesis of [(η5-Cp*)IrCl(κ2-N,N-pyMebim)]Cl, 4[N,NMe-Cl]. The synthesis was performed as for 3[N,NH-Cl] in the presence of the ligand 2-(2′-pyridyl)-N-methylbenzimidazole (0.0344 g, 0.164 mmol) and [IrCl2(Cp*)]2 (0.0574 g, 0.074 mmol) dichloromethane (6 mL). The product was precipitated with diethyl ether as a yellow powder. The yield was 81.8 mg (0.135 mmol, 91%). The purity (HPLC) was >97%. The Mr (C23H26N3Cl2Ir) = 607.6039 g/mol. The anal. calcd for C23H26N3Cl2Ir·(CH2Cl2)0.5(H2O)0.4 was C 42.95, H 4.26 and N 6.39; we found C 42.99, H 4.47 and N 5.96. The 1H NMR (400 MHz, CDCl3, 25 °C) δ 9.29 (d, J = 8.0 Hz, 1H, H3′), 8.89 (d, J = 5.6 Hz, 1H, H6′), 8.41 (t, J = 8.0 Hz, 1H, H4′), 7.74–7.63 (m, 3H, Hf, H5′, Hc), 7.62–7.55 (m, 1H, Hd), 7.53–7.48 (m, 1H, He), 4.70 (s, 3H, HMe) and 1.78 (s, 15H, HCp(Me)) ppm. The 13C{1H} NMR (101 MHz, CDCl3, 25 °C) δ 152.0 (s, 1C, C6′), 151.8 (s, 1C, Ca), 146.9 (s, 1C, C2′), 141.6 (s, 1C, C4′), 138.1 (s, 1C, Cg), 136.9 (s, 1C, Cb), 128.1 (s, 1C, C5′), 127.1 (s, 1C, C3′), 126.6 (s, 1C, Cd), 125.7 (s, 1C, Ce), 116.9 (s, 1C, Cf), 112.7 (s, 1C, Cc), 88.9 (s, 1C, CCpC) and 9.8 (s, 1C, CCp(Me)) ppm. The FT-IR (ATR, cm−1) selected bands were 3444-3379 (m, νN-H), 3069 (w, ν C=CH), 1606 (m, νC=C + C-N), 1524 (m), 1490-1468-1441 (vs, νC=N), 1354-1334 (w, δCH3), 1153 (m), 1030 (s), 832 (w), 792 (m, δC-C), 756-742 (vs, δCHoop), 582 (m), 545 (m) and 507 (w). The MS (FAB+) was m/z (%) = 572 (33) ([M-Cl]+), 536 (4) ([M-2Cl-H]+) and 363 (5) ([M-Cl-NMepybzIm-H]+). The molar conductivity (CH3CN) was 140.9 S·cm2·mol−1. It was soluble in water, methanol, dichloromethane and chloroform.
Synthesis of [(η5-Cp*)IrCl(κ2-N,N-apbim)]Cl, 5[CNH2,NH-Cl]. The synthesis was performed as for 4[N,NMe-Cl] in the presence of the ligand 2-(2′-aminophenyl)benzimidazole (0.0546 g, 0.261 mmol) and [IrCl2(Cp*)]2 (0.1000 g, 0.126 mmol) dichloromethane (14 mL). The precipitate was a yellow powder. The yield was 122.0 mg (0.201 mmol, 80%). The purity (HPLC) was >97%. The Mr (C23H26N3Cl2Ir) = 607.6039 g/mol. The anal. calcd for C23H26N3Cl2Ir·(CH2Cl2)0.3 was C 44.25, H 4.18 and N 6.13; we found C 44.21, H 4.24 and N 6.62. The 1H NMR (400 MHz, DMSO-d6, 25 °C) δ 14.61 (s, 1H, HN-H), 8.23 (d, J = 9.7 Hz, 1H, HNH2), 8.08 (d, J = 7.6 Hz, 1H, H3′), 7.85 (d, J = 11.0 Hz, 1H, HNH2), 7.75–7.70 (m, 1H, Hc), 7.67 (dd, J = 5.6, 3.7 Hz, 1H, Hf), 7.63 (t, J = 7.7 Hz, 1H, H5′), 7.52 (d, J = 7.8 Hz, 1H, H6′), 7.47–7.36 3m, 3H, H4′, Hd, He) and 1.46 (d, J = 63.7 Hz, 15H, HCp(Me)) ppm. The 13C{1H} NMR (101 MHz, DMSO-d6, 25 °C) δ 147.2 (s, 1C, Ca), 141.9 (s, 1C, C1′), 139.4 (s, 1C, Cg), 134.0 (s, 1C, Cb), 131.5 (s, 1C, C5′), 129.0 (s, 1C, C3′), 126.0 (s, 1C, C4′), 124.5 (s, 1C, Cd), 123.4 (s, 1C, Ce), 121.6 (s, 1C, C2′), 121.0 (s, 1C, C6′), 118.8 (s, 1C, Cc or Cf), 112.6 (s, 1C, Cf or C5′), 86.0 (s, 1C, CCpC) and 8.1 (s, 1C, CCp(Me)) ppm. The FT-IR (ATR, cm−1) selected bands were 3425 (w, νO-H), 3025 (vs, ν=CH, νNH2), 2962-2900 (vs, νNH2+(hydrogen bonds)), 1620-1598 (w, νC=C + C-N), 1541 (m), 1485 (s), 1463-1450 (vs, νC=N), 1417 (s), 1382 (m, δCH3), 1325 (m), 1161 (m), 1032 (m), 799 (m, δC-C) and 762-747 (s, δCHoop). The MS (FAB+) was m/z (%) = 573 (25) ([M-Cl+H]+), 537 (21) ([M-2Cl]+). The molar conductivity (CH3CN) was 50.6 S·cm2·mol−1. It was soluble in water, methanol, dimethyl sulfoxide and acetonitrile. It was insoluble in dichloromethane and acetone.
Synthesis of [(η5-Cp*)IrCl(κ2-N,N-apbtz)]Cl, 6[CNH2,S-Cl]. The synthesis was performed as for 4[N,NMe-Cl] in the presence of the ligand 2-(2′-aminophenyl)benzothiazole (0.0546 g, 0.258 mmol) and [IrCl2(Cp*)]2 (0.0999 g, 0.125 mmol) dichloromethane (14 mL). The precipitate was a yellow powder. The yield was 114.9 mg (0.184 mmol, 73%). The purity (HPLC) was >98%. The Mr (C23H25N2SCl2Ir) = 624.6553 g/mol. The anal. calcd for C23H25N2SCl2Ir·(CH2Cl2)1.1 was C 40.31, H 3.82, N 3.90 and S 4.47; we found C 40.19, H 3.92, N 3.55 and S 4.47. The 1H NMR (400 MHz, CDCl3, 25 °C) δ 10.58 (d, J = 10.9 Hz, 1H, HNH2), 8.77 (d, J = 7.8 Hz, 1H, H6′), 8.34 (d, J = 8.3 Hz, 1H, Hf), 7.97 (d, J = 7.9 Hz, 1H, Hc), 7.82 (d, J = 7.7 Hz, 1H, H3′), 7.68 (t, J = 7.8 Hz, 1H, H5′), 7.62 (t, J = 7.1 Hz, 1H, He), 7.56 (t, J = 7.4 Hz, 1H, Hd), 7.38 (t, J = 7.5 Hz, 1H, H4′), 5.87 (d, J = 10.5 Hz, 1H, HNH2) and 1.54 (s, 15H, HCp(Me)) ppm. The 13C{1H} NMR (101 MHz, CDCl3, 25 °C) δ 165.4 (s, 1C, Ca), 150.3 (s, 1C, Cg), 140.4 (s, 1C, C1′), 134.0 (s, 1C, C5′), 132.5 (s, 1C, Cb), 130.3 (s, 1C, C3′), 128.1 (s, 1C, Ce), 127.8 (s, 1C, C4′), 127.7 (s, 1C, Cd), 125.7 (s, 1C, Cf), 125.4 (s, 1C, C2′), 124.8 (s, 1C, C6′), 122.6 (s, 1C, Cc), 87.8 (s, 1C, CCpC) and 9.3 (s, 1C, CCp(Me)) ppm. The FT-IR (ATR, cm−1) selected bands were 3408 (w, νO-H), 3024 (m, ν=CH, νNH2), 2963-2922 (s, νNH2+(hydrogen bonds)), 1607 (w, νC=C + C-N), 1574 (w), 1477-1449 (vs, νC=N), 1430 (s), 1380 (m, δCH3), 1322 (w), 1254 (m), 1176 (m), 1078 (m, νC=S), 1031-997 (s), 789 (vs, δC-C), 755 (vs, δCHoop), 718 (s) and 689 (m). The MS (FAB+) was m/z (%) = 590 (16) ([M-Cl+H]+), 554 (9) ([M-2Cl]+). The molar conductivity (CH3CN) was 79.6 S·cm2·mol−1. It was soluble in dichloromethane, chloroform, acetonitrile and dimethyl sulfoxide.
Synthesis of [(η5-Cp*)IrCl(κ2-O,N-hpbim)], 7[CO,NH-Cl]. In a 100 mL Schlenk flask, the ligand 2-(2′-hydroxyphenyl)benzimidazole (0.0541 g, 0.257 mmol) was added to a solution of [IrCl2(Cp*)]2 (0. 0999 g, 0.125 mmol) and Et3N (37 μL, 0.266 mmol) in dichloromethane (15 mL), and the mixture was stirred at room temperature for 20 h and under a nitrogen atmosphere. The product was filtered and washed with water and diethyl ether. The resulting yellow powder was dried in a vacuum at 50 °C (water bath) for 1 h. The yield was 116.8 mg (0.204 mmol, 81%). The purity (HPLC) was >95%. The Mr (C23H24N2OClIr) = 572.1281 g/mol. The anal. calcd for C23H24N2OClIr·(CH2Cl2)0.3 was C 46.83, H 4.15 and N 4.69; we found C 46.89, H 4.13 and N 4.28. The 1H NMR (400 MHz, DMSO-d6/MeOD-d4, 25 °C) δ 7.78 (dd, J = 7.9, 1.7 Hz, 1H, H3′), 7.66 (dd, J = 7.0, 1.0 Hz, 1H, Hc), 7.46 (td, J = 7.5, 1.2 Hz, 1H, He), 7.41 (td, J = 7.5, 1.2 Hz, 1H, Hd), 7.34 (dd, J = 7.2, 1.0 Hz, 1H, Hf), 7.28 (t, J = 7.6, 1.0 Hz, 1H, H5′), 6.92 (dd, J = 8.4, 1.1 Hz, 1H, H6′), 6.75 (td, J = 7.6, 1.0 Hz, 1H, H4′) and 1.47 (s, 15H, HCp(Me)) ppm. The 13C{1H} NMR (101 MHz, DMSO-d6/MeOD-d4, 25 °C) δ 166.0 (s, 1C, C1′), 148.6 (s, 1C, Ca), 140.3 (s, 1C, Cg), 135.1 (s, 1C, Cb), 133.4 (s, 1C, C5′), 128.3 (s, 1C, C3′), 125.8 (s, 1C, Cd), 124.8 (s, 1C, Ce), 123.9 (s, 1C, C6′), 118.5 (s, 1C, C4′), 117.6 (s, 1C, Cf), 116.1 (s, 1C, C2′), 113.6 (s, 1C, Cc), 93.1 (s, 1C, CCpC) and 8.5 (s, 1C, CCp(Me)) ppm. The FT-IR (ATR, cm−1) selected bands were 3165-3141 (m), 3044 (w, ν=CH), 2983 (w, ν-CH), 1620 (m, νC-N), 1600 (s, νC=C), 1552-1532 (m), 1476-1444 (vs, νC=N), 1315 (s), 1259 (s, νC-O), 1137 (m), 1033 (m), 858 (m), 771-749 (s, δCHoop) and 689 (w). The MS (FAB+) (for the derivative obtained after Cl−/DMSO substitution) was m/z (%) = 616 (10) ([M-Cl+DMSO+H]+), 538 (72) ([M-DMSO+H]+). It was soluble in a mixture of dimethyl sulfoxide/methanol (3:2). It was slightly soluble in methanol. It was insoluble in water, dimethyl sulfoxide, dichloromethane, acetonitrile and acetone.
Synthesis of [(η5-Cp*)IrCl(κ2-O,N-hpbtz)], 8[CO,S-Cl]. The synthesis was performed as for 7[CO,NH-Cl] in the presence of the ligand 2-(2′-hidroxyphenyl)benzothiazole (0.0541 g, 0.259 mmol), [IrCl2(Cp*)]2 (0. 0999 g, 0.125 mmol) and Et3N (37 μL, 0.266 mmol) in dichloromethane (12 mL). The precipitate was a yellow powder. The yield was 81.4 mg (0.138 mmol, 55%). The purity (HPLC) was >99%. The Mr (C23H23NOSClIr) = 589.1795 g/mol. The anal. calcd for C23H23NOSClIr·(CH2Cl2)0.3 was C 45.53, H 3.87, N 2.28 and S 5.22; we found C 45.51, H 4.00, N 2.01 and S 5.06. The 1H NMR (400 MHz, CDCl3, 25 °C) δ 8.28 (dd, J = 8.4, 0.6 Hz, 1H, Hf), 7.77 (dd, J = 8.0, 0.6 Hz, 1H, Hc), 7.54–7.49 (m, 2H, H3′,e), 7.37 (td, J = 7.3, 1.1 Hz, 1H, Hd), 7.31–7.23 (m, 1H, H5′), 7.06–7.01 (m, 1H, H6′), 6.56 (ddt, J = 8.1, 7.0, 1.1 Hz, 1H, H4′) and 1.43 (s, 15H, HCp(Me)) ppm. The 13C{1H} NMR (101 MHz, CDCl3, 25 °C) δ 167.7 (s, 1C, C1′), 165.4 (s, 1C, Ca), 151.2 (s, 1C, Cg), 133.6 (s, 1C, C5′), 131.9 (s, 1C, Cb), 129.2 (s, 1C, C3′), 126.9 (s, 1C, Ce), 125.7 (s, 1C, Cd), 125.3 (s, 1C, Cf), 124.4 (s, 1C, C6′), 121.7 (s, 1C, C2′), 121.4 (s, 1C, Cc), 116.5 (s, 1C, C4′), 84.6 (s, 1C, CCpC) and 9.2 (s, 1C, CCp(Me)) ppm. The FT-IR (ATR, cm−1) selected bands were 3408 (w, νO-H), 3050 (w, ν=CH), 2964 (w, ν-CH), 1599 (s, νC=C+C-N), 1543 (m), 1492-1453 (vs, νC=N), 1377 (m, δCH3), 1325 (s), 1240-1223-1209 (s, νC-O), 1147 (m), 1077 (w, νC=S), 1032 (m), 771-733 (s, δCHoop) and 689 (w). The MS (FAB+) was m/z (%) = 590 (23) ([M]+), 555 (100) ([M-Cl+H]+). The molar conductivity (CH3CN) was 10.5 S·cm2·mol−1. It was soluble in dichloromethane, chloroform, acetonitrile and acetone. It was slightly soluble in methanol and insoluble in water.
Synthetic methods. All synthetic manipulations were carried out under an atmosphere of dry, oxygen-free nitrogen using standard Schlenk techniques. The solvents were dried and distilled under a nitrogen atmosphere before use. The elemental analyses were performed in a PerkinElmer 2400 CHN microanalyzer. The analytical data for the new compounds were obtained from crystalline samples when possible. In some cases, the data was reasonably accurate, but in others, the agreement between calculated and found values for carbon was >0.4% so that solvent molecules were introduced in the molecular formulas to improve agreement. The IR spectra were recorded on a Jasco FT/IR-4200 spectrophotometer (4000–400/cm range) with a Single Reflection ATR Measuring Attachment. The FAB
+ mass spectra (position of the peaks in DA) were recorded with an Autospec spectrometer. The isotopic distribution of iridium matched very closely with the calculated values for the expected complex cation in every case. The NMR samples were prepared under a nitrogen atmosphere by dissolving a suitable amount of the compound in 0.5 mL of the respective oxygen-free deuterated solvent, and the spectra were recorded at 298 K (unless otherwise stated) on a Varian Unity Inova-400 (399.94 MHz for
1H; 161.9 MHz for
31P; 100.6 MHz for
13C). Typically, 1D
1H NMR spectra were acquired with 32 scans into 32 k data points over a spectral width of 16 ppm. The
1H and
13C{
1H} chemical shifts were internally referenced to TMS via 1,4-dioxane in D
2O (δ = 3.75 and 67.19 ppm, respectively) or via the residual
1H and
13C signals of the corresponding solvents, CDCl
3 (δ 7.26 and 77.16 ppm) and (CD
3)
2SO (δ 2.50 and 39.52 ppm), according to the values reported by Fulmer et al [
50]. Chemical shift values are reported in ppm and coupling constants (J) in hertz. The splitting of proton resonances in the reported
1H NMR data was defined as s = singlet, d = doublet, t = triplet, st = pseudotriplet, q = quartet, sept = septet, m = multiplet and bs = broad singlet. The 2D NMR spectra such as
1H−
1H gCOSY,
1H−
1H NOESY,
1H−
13C gHSQC and
1H−
13C gHMBC were recorded using standard pulse sequences. The probe temperature (±1 K) was controlled by a standard unit calibrated with methanol as a reference. All NMR data processing was carried out using MestReNova version 10.0.2.
HPLC Purity measurements by HPLC were performed on a Waters instrument (Alliance module e2695), using a Mediterranean Sea C18 column, 250 × 4.6 mm, 5 µm. The mobile phase used was MilliQ-water (0.1% TFA, solvent A) and HPLC grade acetonitrile (0.1% TFA, solvent B). Gradient elution was used following the next method: 0–3 min, isocratic 95% A (5% B); 3–17 min, linear gradient from 95% A (5% B) to 0% A (100% B); 17–23, isocratic 0% A (100% B). A PDA detector was used for peak detection monitoring at 254, 350, 450 and 550 nm channels. All peaks were manually integrated at 254 nm to obtain the percentage area. Samples were prepared by dissolving some solid in DMSO. Then, acetonitrile and MilliQ-water were qualitatively added while avoiding precipitation. The solutions were filtered with hydrophilic PVDF syringe filters (Filter-Lab, Barcelona, Spain) before injections. Each sample was analysed at least twice (injection volume 20 µL) to ensure reproducibility. Complexes
1[C,NH] and
2[C,NMe] show two peaks corresponding to the equilibrium between the Ir-DMSO and the Ir-acetonitrile species since both solvents exhibit coordinating abilities [
51] (see
Figures S2 and S3). In these cases, both areas were added together for purity measurements. The chromatogram of DMSO was also recorded (
Figure S4).
Solubility. The solubility of the complexes was qualitatively assessed. Different solvents were added drop-by-drop while shaking to a small amount of complex (around 1–2 mg) in a vial until the solvent added exceeded 1 mL. Afterwards, it was checked if the solid was or not completely dissolved and/or if the solution got coloured.
The pH measurements were carried out with a Metrohm 16 DMS Titrino pH meter fitted out with a combined glass electrode with a 3 M KCl solution as a liquid junction. HClO4 and NaOH solution were used to adjust the pH.
Aquation/solvolysis. Chloride displacement was qualitatively monitored by 1H-NMR for some of the complexes in DMSO-d6. The replacement of the chloride by a DMSO molecule was observed as some peaks shifted and some new peaks appeared corresponding to the methyl groups of the DMSO molecule. Aquation/solvolysis equilibria were studied by kinetic UV-vis measurements.
The UV-vis measurements were performed with a Hewlett-Packard 8453A (Agilent Technologies, Palo Alto, CA, USA) photodiode array spectrophotometer with a Peltier temperature control system. Titrations were carried out at 25 °C by adding increasing amounts of DNA solution to the iridium complex solution. The pKa values were measured by analysing the absorbance change of iridium complex solutions recorded at different pH values. The melting experiments were carried out using a DNA solution varying the CIr-complex/CDNA (CD/CP) ratio from 0 to 1, keeping CP constant and recording the absorbance spectra while heating from 25 to 90 °C at 0.3 °C/min.
The slow kinetic measurements were performed with the previous spectrophotometer while the fast kinetic measurements were performed in a stopped flow Bio-Logic SFM-300 spectrophotometer with an absorbance detection system and dead time below 3 ms. The kinetic curves, obtained averaging out at least five shots, were analysed with the Jandel (AISN software, Mapleton, OR) fitting package.
Differential scanning calorimetry (DSC) studies were performed in a nano DSC (TA Instruments, Newcastle, USA) to determine the melting temperature of DNA in the absence and in the presence of different amount of the Ir(III) complexes. Cells were 300 μL platinum capillary tubes. Measurements were performed by heating the dye/polynucleotide system from 20 to 90 °C, at 1 °C/min scan rate and 3 atm pressure. To reduce the formation of bubbles upon heating to a minimum, the reference and the sample solutions were previously degassed for 30 min in a degassing station (TA Instruments, Newcastle, USA). The thermograms recorded were analysed with the NanoAnalyze 2.0 software. The buffer–buffer baseline was run at least five heating/cooling cycles until the heating was reproducible, and then, it was subtracted from the sample data.
Circular dichroism (CD) measurements were performed with a MOS-450 biological spectrophotometer (Bio-Logic SAS, Claix, France) fitted out with 1.0 cm path length cells. Titrations were carried out at 25 °C by adding increasing amounts of iridium complex solution to the DNA solution. Spectrograms were obtained in the 200−700 nm range at 2 nm/s speed. Molar ellipticity (Deg M−1 cm−1) was calculated using [θ] = 100·θ/CP·l, where CP is the polynucleotide concentration and l is the cell light path (cm).
Viscosity measurements were performed using a Micro-Ubbelohde viscometer whose temperature was controlled externally (25 ± 0.1 °C). The flow time was measured with a digital stopwatch. Mean values of triplicated measurements were taken to evaluate the DNA viscosity in the absence (η0) and in the presence, (η) of iridium complexes. The viscosity readings were expressed as L/L0 = (η/η0)1/3 versus the CD/CP ratio. The data was analysed using L/L0 = (t − t0)/(tDNA − t0) where t0 and tDNA are the buffer and polynucleotide solution flow times, respectively, whereas t is the flow time of the Ir-complex/DNA mixture after the stabilization period.
Agarose Gel electrophoresis of plasmid DNA Overnight cultures of the strain DH5α of Escherichia coli were isolated with the Quiagen DNA purification kit. Then, 20 µM (in base pairs) of plasmid DNA (pUC18) was incubated with different concentrations of the synthesized iridium complexes overnight at 37 °C. Afterwards, 2 μL of loading buffer were added to 10 μL of the incubated samples and loaded onto a 1% agarose gel. Electrophoresis was run in TAE 1× at 6.5 V/cm during 2.5 h. Then, the agarose gel was stained with ethidium bromide 1 μg/mL and visualized with a Gel Doc XR+ Imaging System (Bio-Rad, Hercules, CA, USA).
X-ray Crystallography. Single crystals of
1[C,NH-Cl],
3[N,NH-Cl]·2H2O,
4[N,NMe-Cl]·H2O, 5[CNH2,NH]·H2O and
8[CO,S-Cl] were mounted on a glass fiber and transferred to a Bruker X8 APEX II CCD-based diffractometer equipped with a graphite-monochromated Mo Kα radiation source (λ = 0.71073 Å). The highly redundant data sets were integrated using SAINT [
47] and corrected for Lorentz and polarization effects. The absorption correction was based on the function fitting to the empirical transmission surface as sampled by multiple equivalent measurements with the program SADABS [
52]. The software package SHELXTL (version 6.10) [
53] was used for space group determination, structure solution and refinement with full- matrix least-squares methods based on F2. A successful solution by direct methods provided most non-hydrogen atoms from the E map. The remaining non-hydrogen atoms were located in an alternating series of least-squares cycles and difference Fourier maps. All non-hydrogen atoms were refined with anisotropic displacement coefficients. Hydrogen atoms were placed using a “riding model” and included in the refinement at calculated positions. The CCDC reference numbers for
1[C,NH-Cl],
3[N,NH-Cl]·2H2O,
4[N,NMe-Cl]·H2O, 5[CNH2,NH]·H2O and
8[CO,S-Cl] are 2082270, 2082271, 2082272, 2082273 and 2082274, respectively. The thermal ellipsoid molecular structures were plotted using the ORTEP-III program for crystal structure illustrations.
Cell culture. Epithelial ovarian carcinoma cells (A2780) that acquired resistance to cisplatin epithelial ovarian carcinoma cells (A2780cis), colon adenocarcinoma cells (SW480) and epithelial lung adenocarcinoma cells (A549) were provided by Sigma Aldrich. A549 and SW480 cells were grown in Dulbecco′s Modified Eagle′s Medium (DMEM), supplemented with 10% Fetal Bovine Serum (FBS) and 1% penicillin, streptomycin and 1% glutamine for A549 and 1% amphotericin B for SW480. The A2780 and A2780cis were grown in RPMI 1640 supplemented with 10% Fetal Bovine Serum (FBS), 1% glutamine and 1% penicillin, streptomycin and amphotericin B. All cells were incubated in a humidified incubator at 37 °C under a 5% CO
2 atmosphere and grown in 100 mm culture dishes to approximately 70–80% confluence. For subculturing, cells were detached with Trypsin-EDTA (Sigma). A549-gal were derived from A549 cultured in glucose-free medium supplemented with 10 mM galactose (Sigma) for at least 10 passes [
54].
Cytotoxicity. MTT Assay and IC50 estimation. The cytotoxicity of 1[C,NH-Cl], 2[C,NMe-Cl], 3[N,NH-Cl]Cl, 4[N,NMe-Cl]Cl, 5[CNH2,NH-Cl]Cl, 6[CNH2,S-Cl]Cl, 7[CO,NH-Cl] and 8[CO,S-Cl] in A2780, A2780cis, SW480 and A549 carcinoma cells was evaluated by the MTT colorimetric assay. Cells were seeded in 96-well plates at 5000 cells per well and incubated at 37 °C, 5% CO2. After 24 h, the medium was removed and replaced with fresh medium with different concentrations of the compounds under study, and they were incubated for 48 h. Final DMSO concentration was kept below 0.7% in wells. For a negative control, one sequence of cells was left untreated and for vehicle control, cells treated with DMSO were included. For cell viability experiments preincubating with NAC (N-Acetyl-L-Cysteine), the cells were pre-treated with NAC, 10 mM for 2 h before the incubation with complex 1[C,NH-Cl] for 24 h. Then, the medium was removed from the wells, and 100 µL MTT (5 mg/mL) was added. After an incubation time of 4 h, 100 μL of solubilizing detergent solution (SDS, 10% in HCL 0.01 M) was added and kept in the incubator overnight. Cell growth inhibition was detected by measuring the absorbance of each well at 595 nm using a BioTek Cytation5 microplate reader. Each test was repeated in quadruplicate in three independent experiments for each cell line. The percentage of survival cells was calculated using absorbance measurements compared with control and the IC50 estimation using Graph Pad Prism version 6.01.
Quantification of Ir cellular uptake by ICP-MS (Inductively coupled plasma-mass spectrometry). Metal accumulation studies were conducted on the SW480 cell line. In these experiments, 3 × 10⁵ cells were seeded in 12.5 cm2 tissue culture flasks in drug-free medium and incubated for 24h at 37 °C in a 5% CO2 humidified atmosphere. Then, cells were treated with 2 µM of the iridium complexes. After 24 h of exposure, cells were washed twice with PBS and harvested. The pellets were resuspended in PBS, and 10 µL were used to count cells. Then, each resuspended pellet was digested in 65% HNO3 for 24 h. Finally, solutions were analyzed in a 7700 ICP-MS (Agilent Technologies, Palo Alto, CA, USA). Data is reported as the mean the standard deviation (n = 3).
Native protein electrophoresis. The interaction between BSA and iridium complexes was studied using native polyacrylamide gel electrophoresis (PAGE). The BSA concentration was 3 µM and the CD/CP ratio was 10. The samples of BSA/Ir-complexes were incubated overnight. The samples were mixed with a sample buffer (glycerol and bromophenol) and loaded into a 10% polyacrylamide gel for PAGE analysis (BioRad electrophoresis accessories). The gel was run at 80 V for 3 h, and then it was stained and destained before the gel was imaged using BioRad Gel Doc XR+ molecular imager. The staining solution contains 45% MeOH, 10% glacial acetic acid, 45% H2O and 0.1% brilliant blue, whereas the destaining solution consists of 20% MeOH, 10% glacial acetic acid and 70% H2O.
Specific assays with 1[C,NH] complex were performed according to manufacturer’s instructions using the following reagents from Molecular Probes (Thermo Fisher Scientific): Measurements of ROS: Dihydroethidium (DHE, D11347) and 2′, 7′-dichlorodihydrofluorescein diacetate (H
2DCFDA, D399); detection of caspases 3/7: CellEvent Caspase-3/7 Green Detection Reagent (C10423); Cell viability: Live/Dead Cell Imaging Kit (R37601); Analysis of cytosolic calcium concentration: Fluo3/AM (F23915); Analysis of MMP: Tetramethylrhodamine methyl ester perchlorate (TMRM, T668). RT-qPCR’s assays were performed with the following primers/probes from Thermo Fisher Scientific: DCP1A (Hs00218198-m1), FOSB (Hs00171851-m1), EGR1(Hs0015928-m1), ATF3 (Hs00231069-m1), DDIT3 (Hs00358796-g1), PP1R15A (Hs00169585-m1), CHAC1(Hs00225520-m1), MIR9-1 (Hs04231512-s1), ATP1B2 (Hs00155922-m1), BBC3 (Hs00248075-m1), BCL2L11 (Hs00798019-s1), PMAIP1 (Hs00560402-m1), SKP2 (Hs01021864-m1) and HIST1H1B (Hs00271207-s1). RT-qPCR experiments were performed as described [
55].
DNA damage was measured using EpiQuik 8-OHdG DNA Damage Quantification Direct Kit (colorimetric) (Fischer, Waltham, MA, USA, P600396); The mitochondrial cytochrome C release was evaluated using the “Millipore’s FlowCellect Cytochrome C Kit (Millipore, FCCH100110)”. Lactate dehydrogenase activity release was measured in the culture medium using Cytotoxicity Detection Kit (Roche Diagnostic, Barcelona, Spain, 11 644 793 001). Protein synthesis was determined using Click-iT Plus O-propargyl-puromycin (OPP) Protein Synthesis Assay Kit (Invitrogen™, Waltham, MA, USA). Measurement of GSH/GSSG was determined with GSH/GSSG-Glo Assay (Promega, V6611). Measurements of OCR and ECAR with Seahorse XFp (Agilent Technologies) were determined using the XFp Cell Mito Stress Test Kit (103010-100) and XFp Glycolysis Stress Test Kit (103017-100). ATP measurement was determined with Cell Titer-Glo Luminescent Cell Viability Assay (Promega, Madison, WI, USA, G7570). Determination of DNA damage using phosphorylated H
2AX measurement were performed as previously described [
56]. Cardiolipin oxidation using the fluorophore Nonyl Acridine Orange (NAO, Thermo Scientific, A1372) was performed as described [
57]. Cell viability was determined by Hoechst inclusion and Propidium iodide (PI) exclusion by standard protocols [
58]. TEM analysis were performed as described [
59]. Cell cycle analysis by flow cytometry and microarrays analysis were performed as described [
24]. Arrays data have been deposited in the ArrayExpress database at EMBL-EBI (
www.ebi.ac.uk/arrayexpress) under accession number E-MTAB-860 (10 November 2022)
CHOP induction. HEK293 cells were seeded at 8 × 10
5 cell/well in 24-well plates and transfected with CHOP::GFP plasmid (Addgene plasmid #21898;
http://n2t.net/addgene:21898; RRID:Addgene_21898, 10 November 2022) using the transfection reagent DreamFectTM Gold (OZ Bioscience, Cat. N. º LM80250). After 24 h incubation, the treatments were added:
1[C,NH] 9.7 µM; tunicamycin 0.5 µM as positive control. Cells were stained with propidium iodide (1 µg/mL). Time-lapse images were acquired every 30 min for 24 h.
Measurements. Absorbance and luminescence emission intensity were recorded by CLARIOstar® BMG Labtech, software Mars. Flow cytometry analyses were determined by a Guava EasyCite, Millipore. Fluorescence images were obtained by IX51 SBF-3 Olympus fluorescence microscopy, Software Cell Sense. Time Lapse imaging were performed using Wide Field Okolab DMI600B, DFC360FX camera, controlling by CTR7000HS, software LAS AF (Leica).
In vivo studies.
Female mice weighing approximately 20–25 g, 8–12 weeks were obtained from Janvier Laboratories (Le Genest-Saint-Isle, France). All mice received a standard laboratory diet and water ad libitum. The use of immunosuppressed animals is always a limitation since they are not a true reflection of an animal with a functional immune system and, therefore, can affect both the toxicological response and the biodistribution of a compound, but they are essential to be able to implant human tumor cells, otherwise the tumor would be rejected by the immune system. Therefore, in order to analyze the biodistribution, toxicology and efficacy of a compound against a tumor, it is necessary to use different animals. Animal studies were approved by the Bioethics Committee of the Universidade de Santiago de Compostela and were done in compliance with the principles of laboratory animal care according to Spanish national law (RD 53/2013).
Biodistribution studies: BALB/c mice were injected via the tail vein with 100 µL of 1[C,NH] dissolved in PBS. Then, 4 h after the injection, the animals (n = 3) were sacrificed, and the following organs were removed: kidney, spleen, liver, heart, lung, pancreas, intestine, ovary and stomach. They were kept at −80 °C until their analysis at the Cactus-Lugo Instrumental Analysis Unit. Solutions were diluted to a final volume of 10 mL MilliQ water and measured on an Agilent 7700x-ICP-MS.
Orthotopic lung cancer model. Athymic nude mice were used. The model was developed following the protocol previously described [
60,
61]. On day 20, treatment with the metal complex was started, and 4 doses were given every other day. Tumor growth was measured in vivo by luminescence (IVIS
® Spectrum) on the days that the complexes were not administered, ending the experiment on day 37 with the sacrifice of the animal and the removal of organs. Organ indicators of metastases, lungs, and mediastinal lymph nodes were processed as previously described [
62]. Histological analyzes were performed as described [
24].
Statistical analysis. The program used for statistical analysis was Graph Pad Prism version 6.01. The p-values were calculated using the t-test (* p < 0.05, ** p < 0.01, *** p < 0.001).
3. Results and Discussion
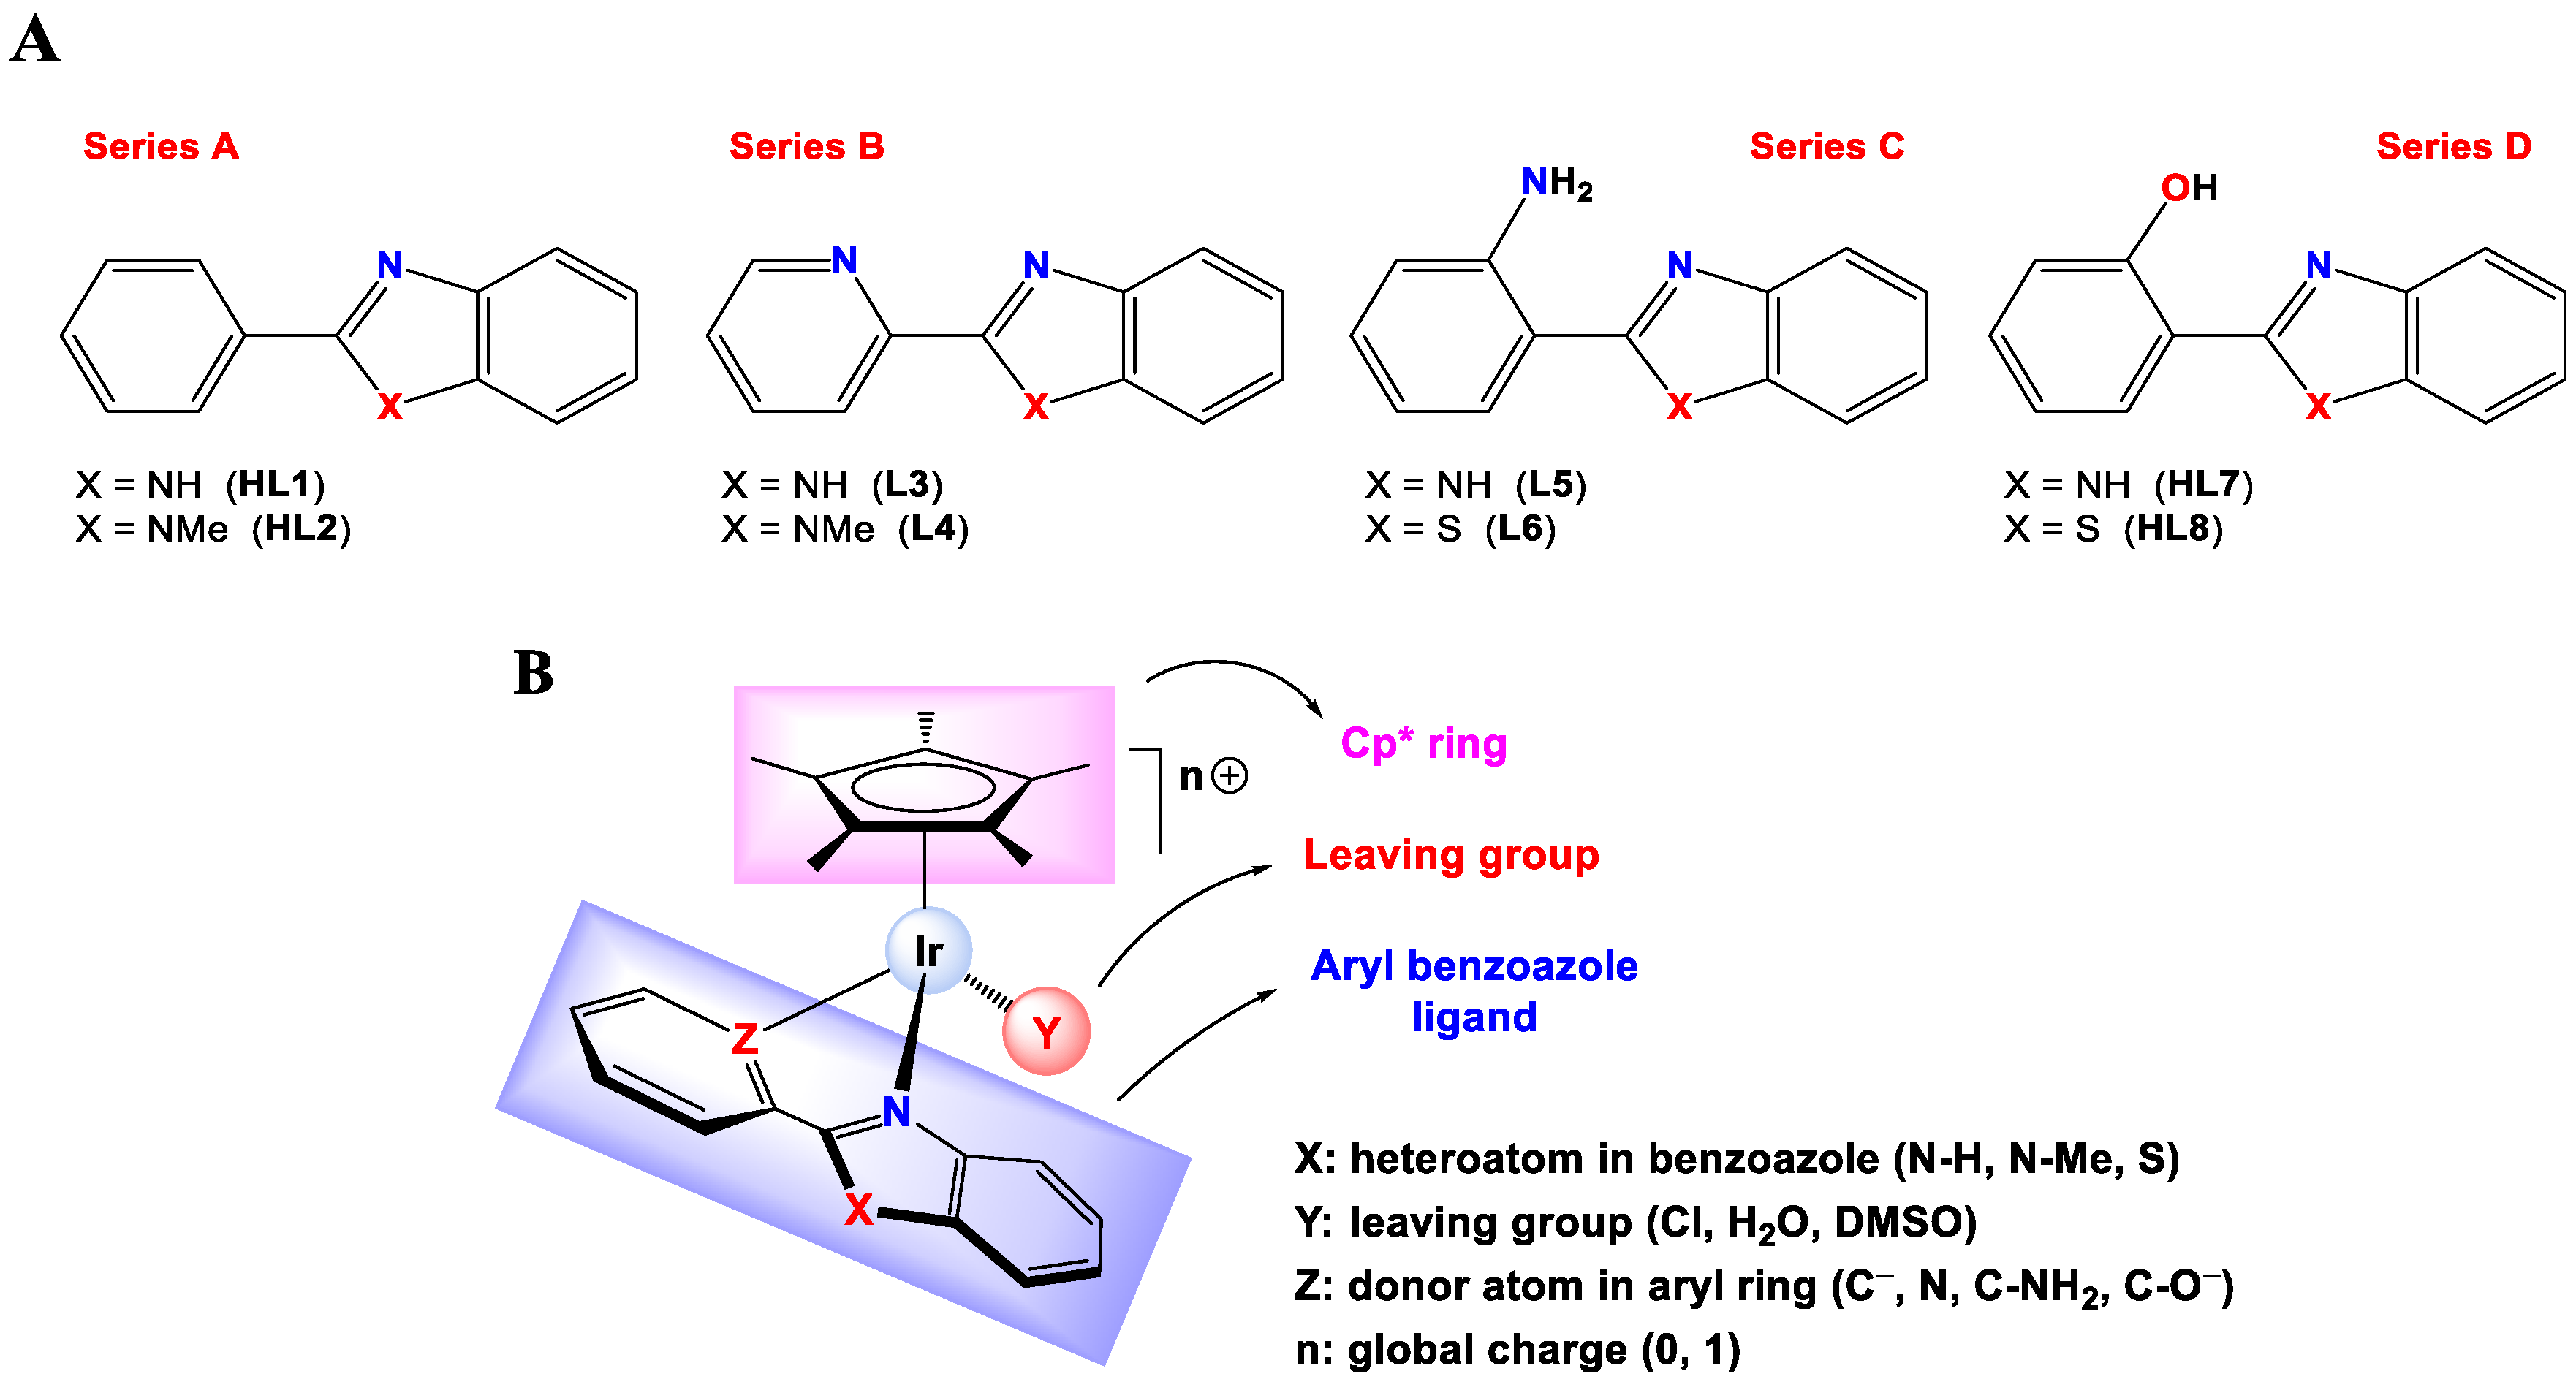
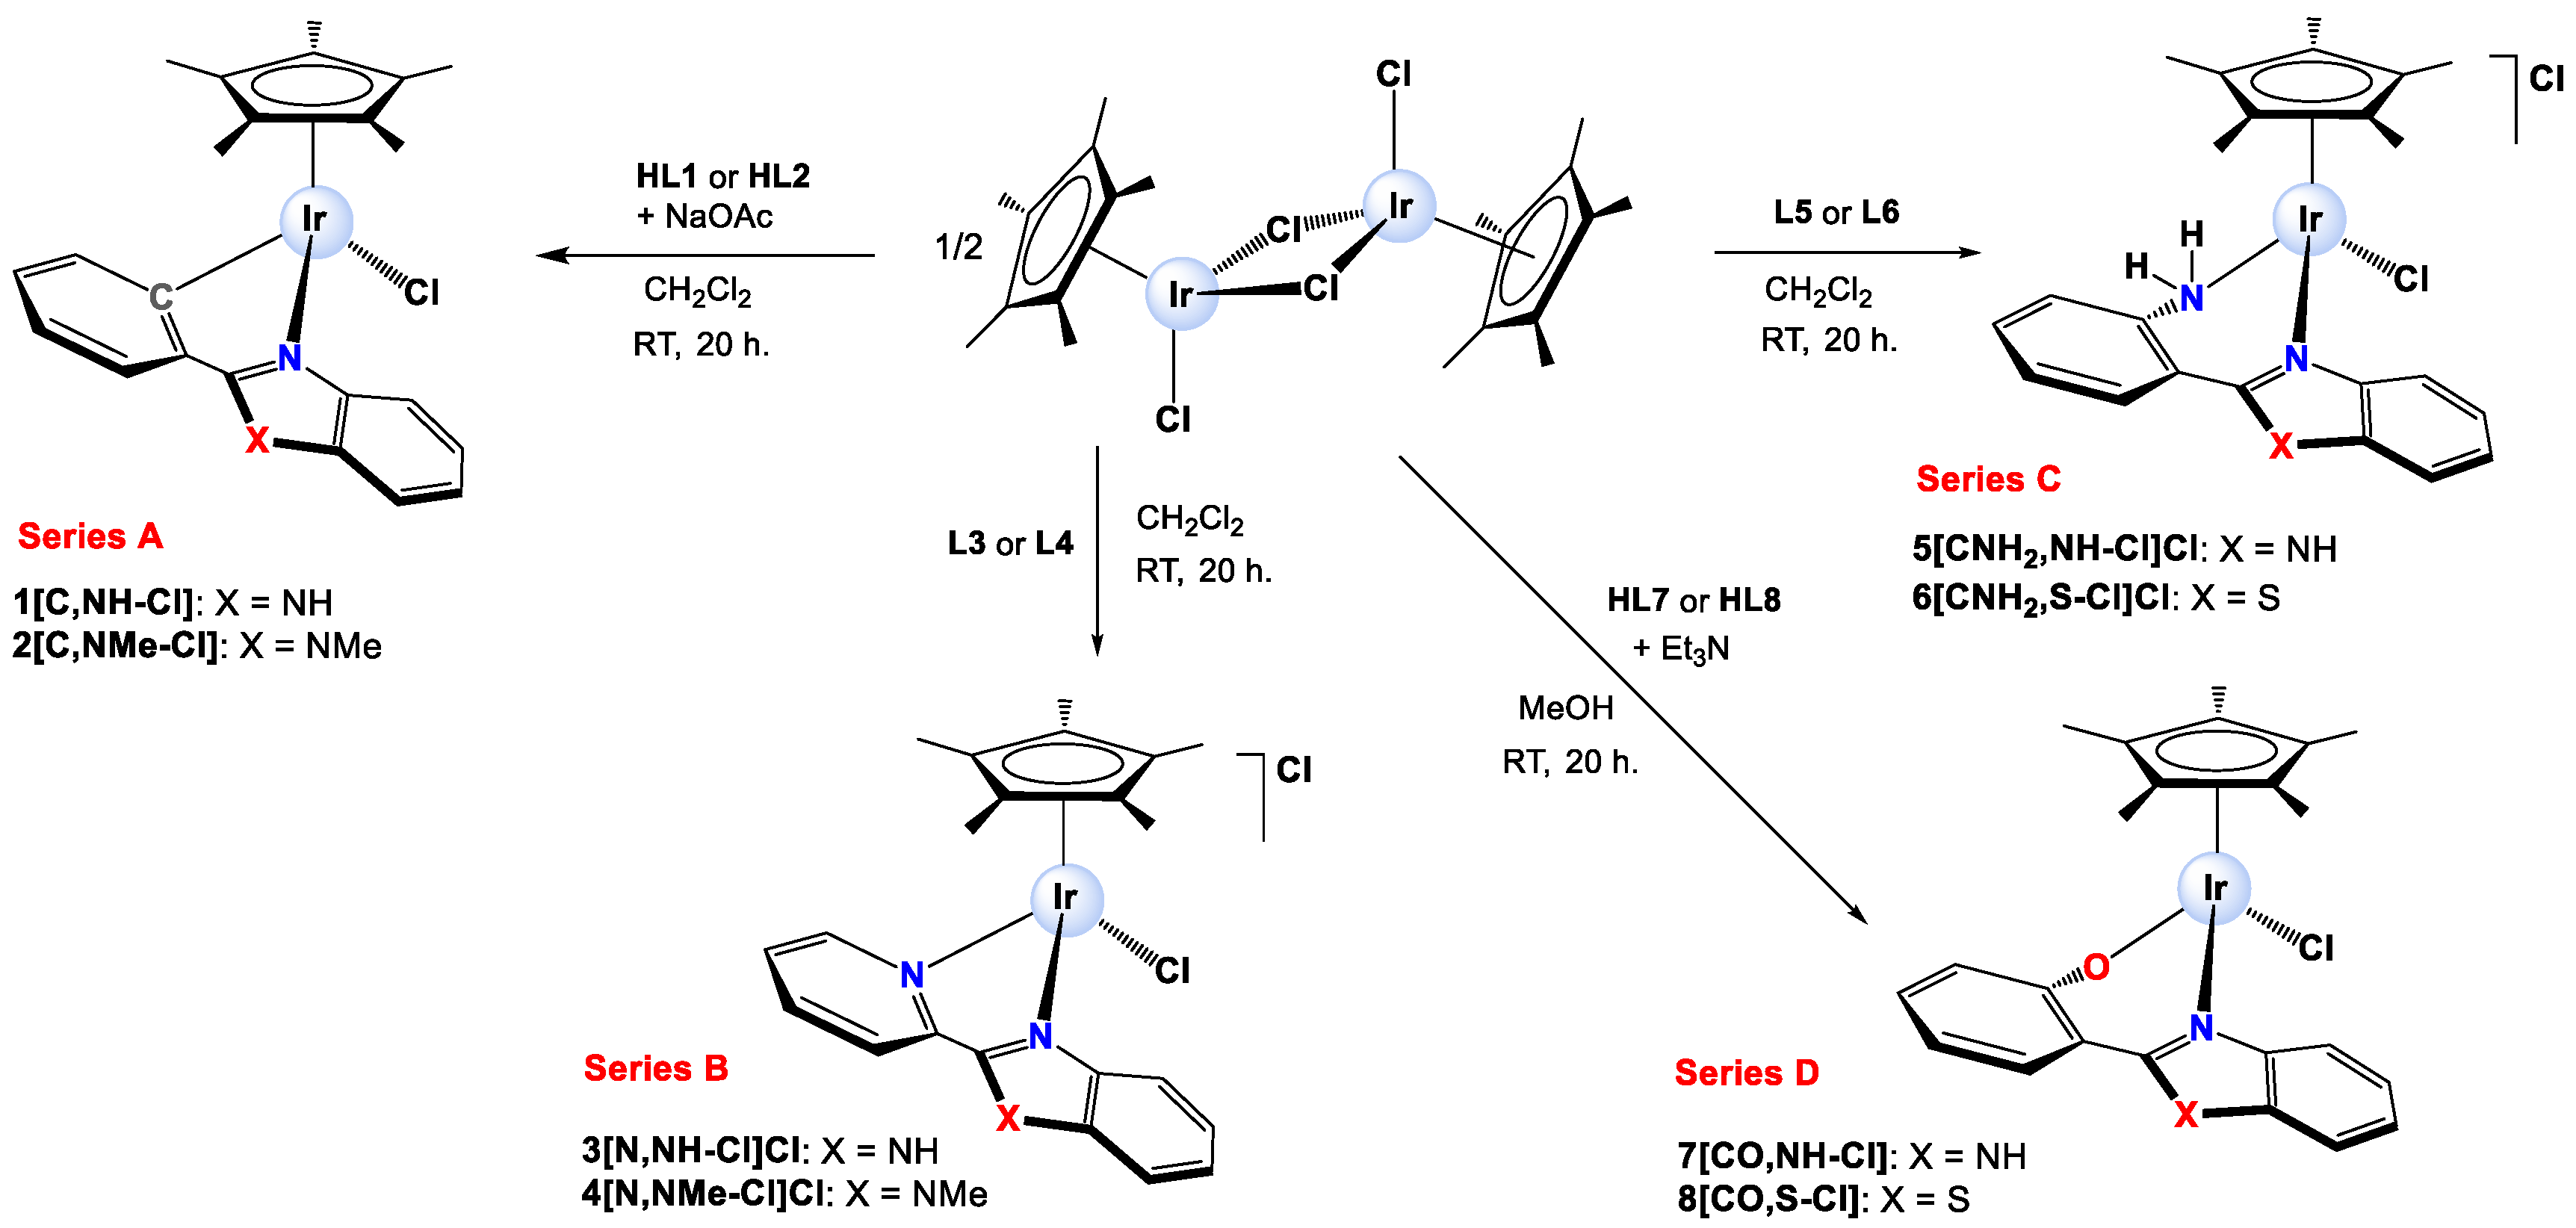
Synthesis and characterization. Eight Ir(III) half-sandwich complexes were synthesized and fully characterized. Methylated ligands [
48] and the Ir(III) starting material [IrCl(µ-Cl)(η
5-Cp*)]
2 [
63] were obtained from adapted protocols in the literature. The cationic Ir(III) complexes [IrCl(η
5-Cp*)(κ
2-N,N-L3)]Cl (
3[N,NH-Cl]Cl), [IrCl(η
5-Cp*)(κ
2-N,N-L4)]Cl (
4[N,NMe-Cl]Cl), [IrCl(η
5-Cp*)(κ
2-N,N-L5)]Cl (
5[CNH2,NH]Cl) and [IrCl(η
5-Cp*)(κ
2-N,N-L6)]Cl (
6[CNH2,S-Cl]Cl) were prepared by reacting [IrCl(µ-Cl)(η
5-Cp*)]
2 with the respective ligand in CH
2Cl
2 while the neutral derivatives [IrCl(η
5-Cp*)(κ
2-C,N-L1)] (
1[C,NH-Cl]), [IrCl(η
5-Cp*)(κ
2-C,N-L2)] (
2[C,NMe-Cl]), [IrCl(η
5-Cp*)(κ
2-N,O-L7)] (
7[CO,NH-Cl]) and [IrCl(η
5-Cp*)(κ
2-N,O-L8)] (
8[CO,S-Cl]) were synthesized by reacting [IrCl(µ-Cl)(η
5-Cp*)]
2 with the appropriate pro-ligand in the presence of NaOAc (
1[C,NH-Cl] and
2[C,NMe-Cl]) or Et
3N (
7[CO,NH-Cl] and
8[CO,S-Cl]). A scheme for the synthesis of the complexes is shown in
Figure 2, and the details are given in the
supporting information. Some of the complexes were previously reported; a derivative of complex
3[N,NH-Cl]+ bearing PF
6− as the counterion was reported by Kollipara [
64], the aqua complex
3[N,NH-H2O]2+ was published as the sulphate salt by Himeda [
65], the crystal structure of complex
3[N,NH-Cl] with PF
6− as counterion was reported by Chellan [
66] and complex
6[CNH2,S-Cl] was published by D. S. Pandey [
67]. All complexes were isolated as the corresponding racemates (RIr or SIr) in moderate or good yields (from 38% to 98%). The complexes were fully characterized by NMR spectroscopy (1D and 2D), IR spectroscopy, positive fast atom bombardment (FAB+) mass spectrometry (see
supporting information), molar conductivity and elemental analysis. Purity was determined by analytical HPLC, confirming ≥95% (
Figures S2–S4). For additional information about molar conductivity experiments, see
supporting information and
Table S6.
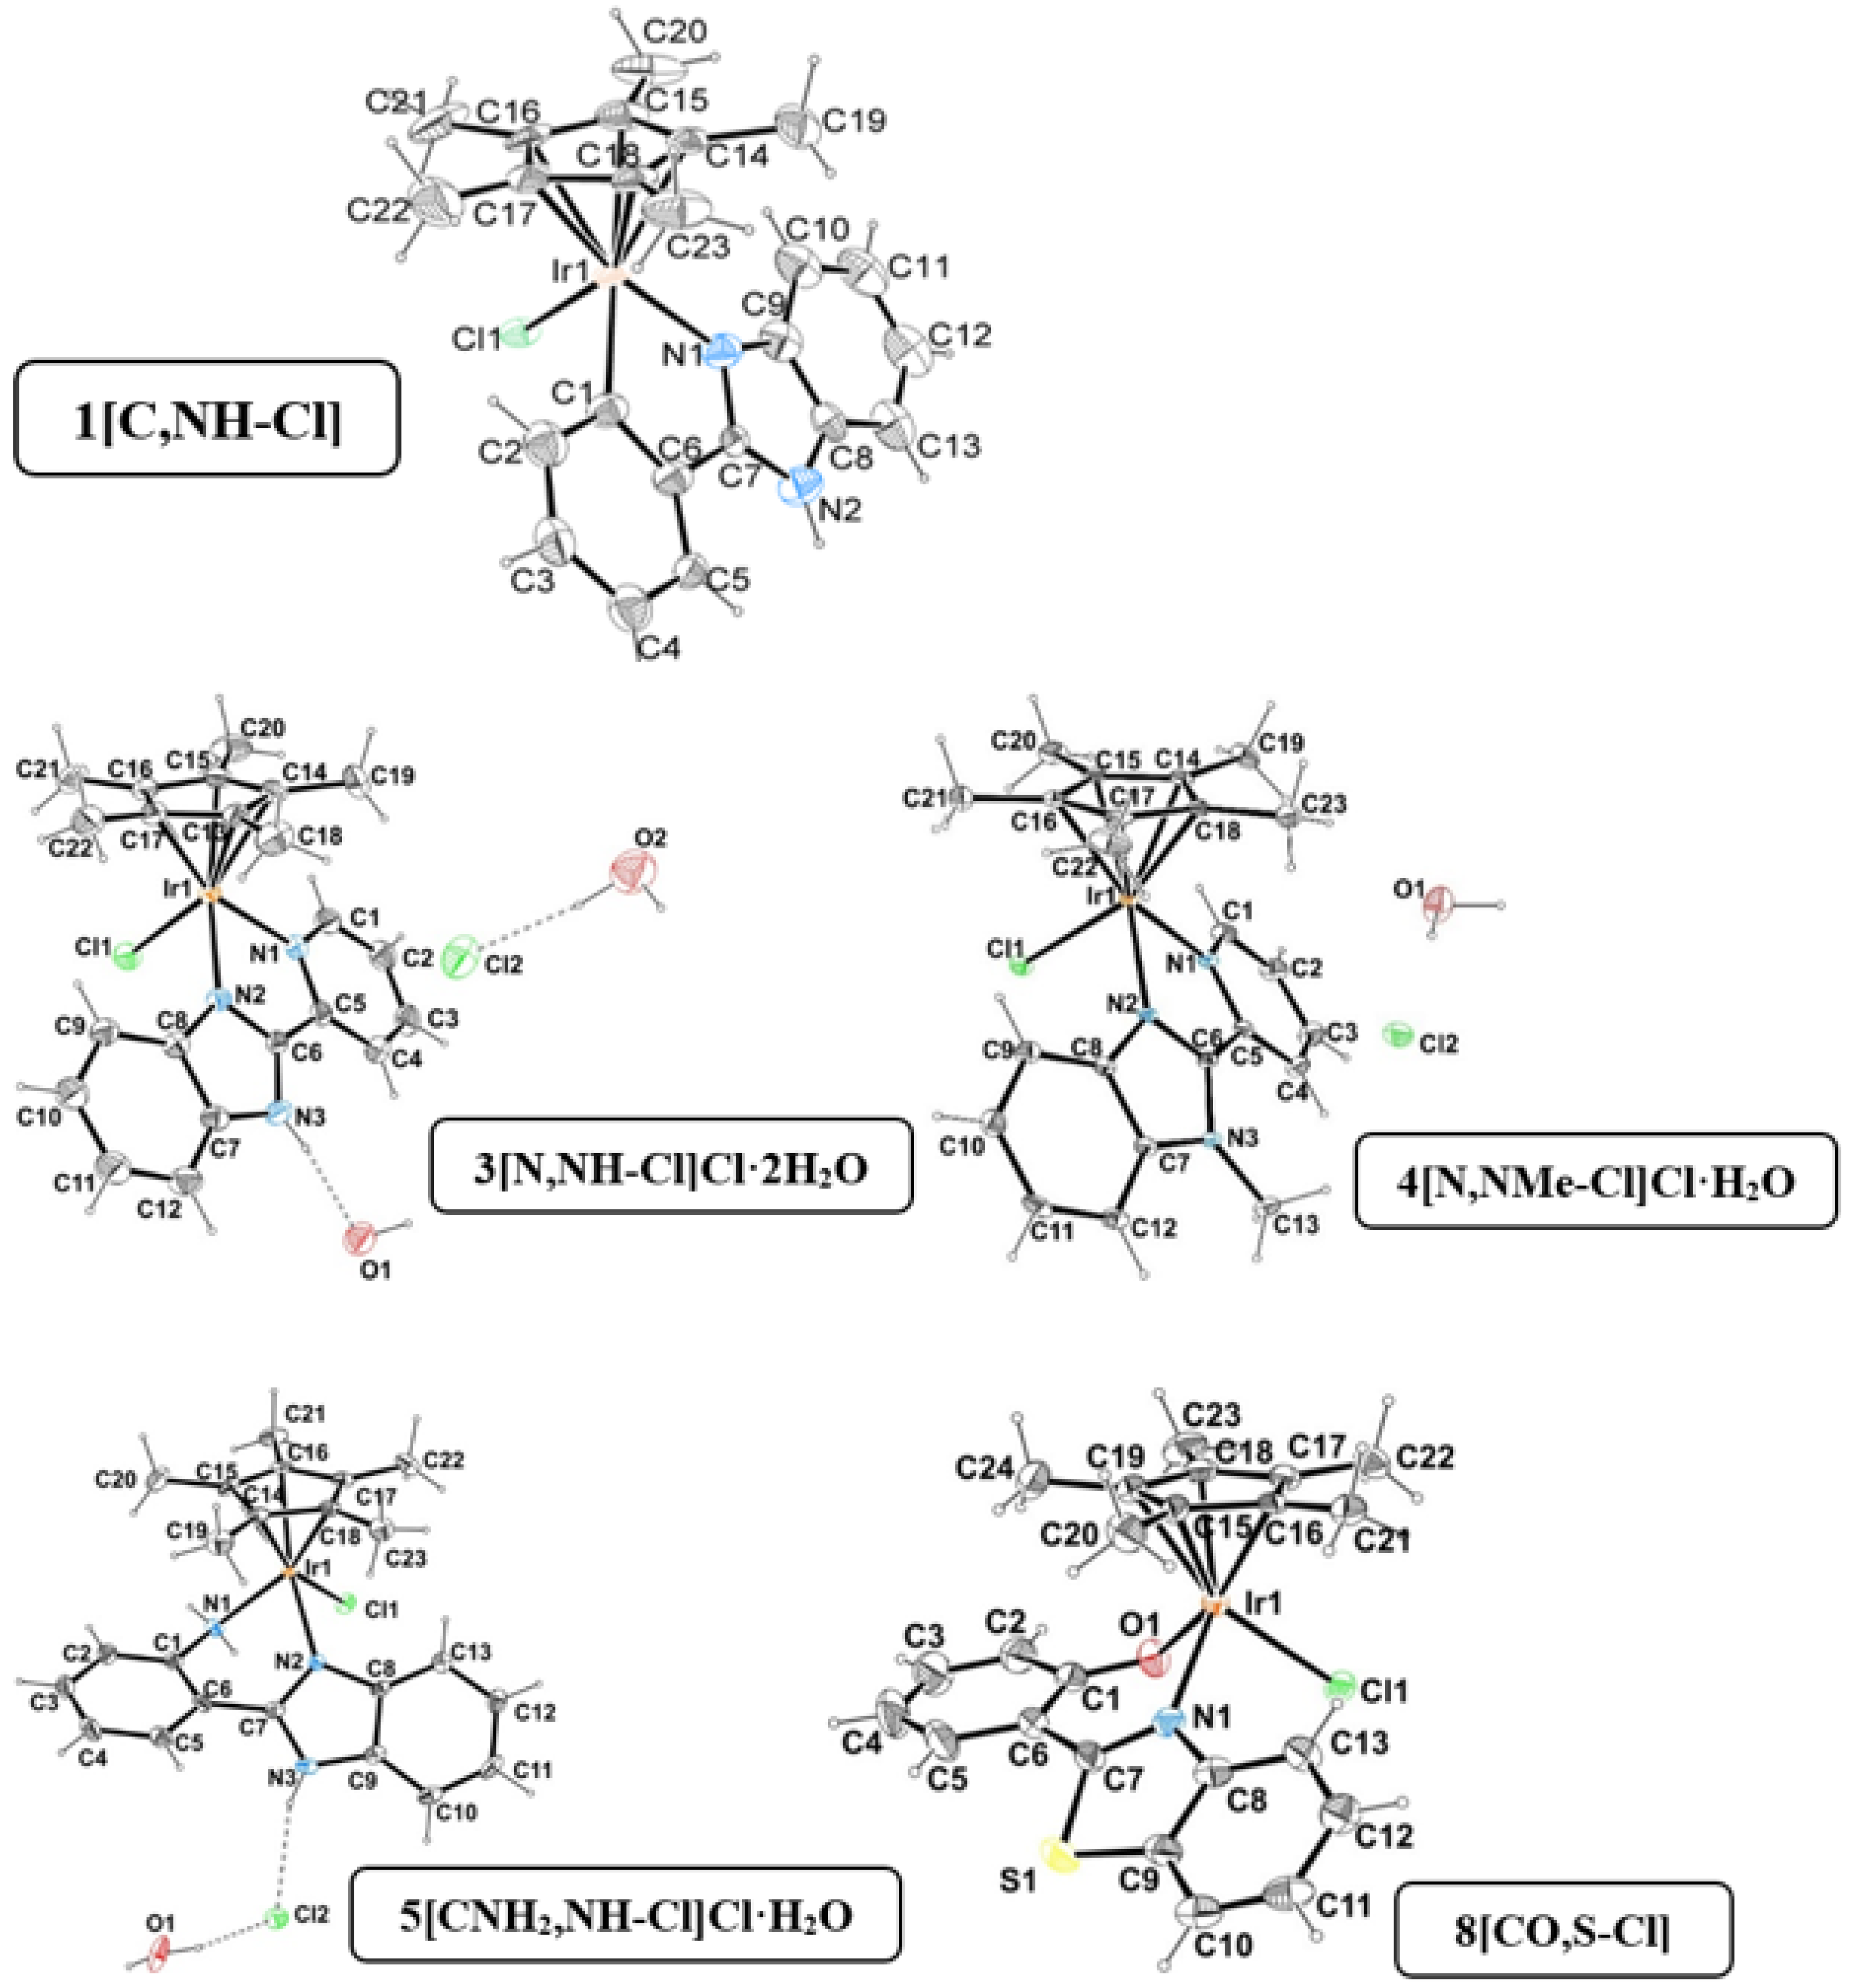
Single crystals suitable for X-ray diffraction analysis were obtained for
1[C,NH-Cl],
3[N,NH-Cl]Cl·2H2O,
4[N,NMe-Cl]·H2O,
5[CNH2,NH-Cl]·H2O and
8[CO,S-Cl] by the slow evaporation of solvents or a combination of solvents: methanol/acetone, methanol/water and methanol/dichloromethane [
15,
17]. The structure of
5[CNH2,NH] was reported by D. S. Pandley et al [
67]. A summary of selected bond lengths and angles as well as selected geometric parameters is given in
Tables S1 and S2. The crystal data collection and refinement parameters are gathered in
Tables S3 and S4 in the Supporting Information.
The ORTEP diagrams for all the complexes are represented in
Figure 3, and the unit cells show the expected enantiomers (R
Ir and S
Ir) with the pseudo-octahedral three-legged piano-stool geometry and the iridium π-bonded to a η
5-Cp* (pentamethylcyclopentadienyl ring). The Ir-centroid (1.766–1.825 Å) and Ir-Cl (2.385–2.422 Å) distances are standard. The Ir-N(benzimidazole, bim or benzothiazole, btz) distances fall in a narrow interval (2.037–2.098 Å), whereas the Ir-C/N/O(phenyl, pyridyl, aminophenyl or hydroxyphenyl) distances are longer (2.097–2.202 Å).
The bite angles (75–80°) are determined by the features of the corresponding free bidentate ligands and tend to be bigger than those obtained for their Ru(II) congeners (76–77°) [
68,
69]. Moreover, complexes of series A and B have 5-membered chelate rings, and derivatives of series C and D have 6-membered chelate rings. The metallacycle size has an impact on the geometry of the corresponding rings. Thus, complexes
1[C,NH-Cl],
3[N,NH-Cl]·2H2O,
4[N,NMe-Cl]·H2O possess planar geometries, whereas complexes
5[CNH2,NH-Cl]·H2O and
8[CO,S-Cl] exhibit an envelope conformation for the respective metallacycles, as it can be deduced from the torsion angles (θ,
Table S2).
The 3D structure of the complexes is supported by strong intermolecular hydrogen bonding interactions (between co-crystallized water molecules and the NH group of the benzimidazole moiety or the NH moiety and the chloride) as well as weak (C-H···π and π-π stacking) interactions. Among these interactions, it is remarkable that the π-π stacking was between the Cp* and the benzene ring of benzothiazole moiety in complex
8[CO,S-Cl], which is reinforced by the C-H···π interactions of the methyl groups of Cp* and the same benzene ring (
Figure S5 and
Table S6). Although these interactions involving Cp* are unusual and weak, some examples in complexes with other metal ions have been reported in the literature [
70,
71,
72,
73].
Solubility, aquation equilibria and acid-base behavior. Water solubility studies and analysis of the aquation/solvolysis equilibria were performed to decipher the behavior of these complexes in biological media. Solubility studies of this family of complexes revealed a strong dependence on the bidentate ligand as well as on the charge of the complex. Thus, the Ir-N^N and Ir-N^NH
2 complexes (
3[N,NH-Cl]+,
4[N,NMe-Cl]+,
5[CNH2,NH-Cl]+ and
6[CNH2,S-Cl]+) are monocationic and water-soluble, whereas Ir-N^C, (
1[C,NH-Cl] and
2[C,NMe-Cl]) and Ir-N^O (
7[CO,NH-Cl] and
8[CO,S-Cl]) are neutral and soluble in DMSO, but not in water. All complexes fulfil Lambert-Beer law (
Figure S6), and no-aggregates formation was observed. Regarding the stability of the complexes in aqueous solutions, the water soluble complexes undergo straightforward aquation, leading to the replacement of chloride by a water molecule, to give
3[N,NH-H2O]2+,
4[N,NMe-H2O]2+,
5[CNH2,NH-H2O]2+ and
6[CNH2,S-H2O]2+. The kinetic spectrograms and the data pairs absorbance-time at a fixed wavelength are displayed in
Figure S7. The corresponding curves were fitted to monoexponential functions to obtain the rate constants kaq (see
Table S7). Aquation may facilitate DNA binding reactions [
74,
75].
Regarding the neutral complexes
1[C,NH-Cl],
2[C,NMe-Cl],
7[CO,NH-Cl] and
8[CO,S-Cl], they underwent substitution of the chloride when dissolved in DMSO to give
1[C,NH-DMSO]+,
2[C,NMe-DMSO]+,
7[CO,NH-DMSO]+ and
8[CO,S-DMSO]+) as confirmed by UV-vis (
Figure S8A–D) and NMR (
Figure S8). Furthermore, the initial suspension became colorless as the reaction evolved (
Figure S10). Strong affinity of iridium(III) complexes to bind dimethyl sulfoxide is well known [
8]. From the fitting of a monoexponential function to Abs-time data pairs (insert
Figure S8A–D), we obtained the k
DMSO rate constants (see
Table S7). The kinetic constants k
aq and k
DMSO of formation of
6[CNH2,S- H2O]2+ and
8[CO,S-DMSO]+ are (2.12 ± 0.01) × 10
−4 s
−1 and (3.11 ± 0.25) × 10
−4 s
−1, respectively, between 10 and 100 times slower than k
aq and k
DMSO of the other complexes. This behavior indicates that the Cl-Ir bond is stabilized by the presence of benzothiazole as the ancillary ligand compared to benzimidazole.
The acid–base behavior is relevant since the protonation state of the synthesized compounds modulates not only the establishment of supramolecular interactions with biomolecules, but also their subcellular localization. The acid dissociation constants were calculated from the absorbance spectra at different pH. UV-vis spectrograms and absorbance at a fixed λ-pH data pairs are shown in
Figure S11. The Henderson–Hasselbalch [
76] equation was applied for the complexes that exhibited one acid-base equilibria,
1[C,NH-DMSO]+ (
Figure S11A),
4[N,NMe-H2O]2+ (
Figure S11D),
6[CNH2,S-H2O]2+(
Figure S11F) and
7[CO,NH-DMSO]+ (
Figure S11G). The Abs vs. pH plot for
3[N,NH-H2O]2+(
Figure S11C) showed a minimum at pH ≈ 7 and for
5[CNH2,NH-H2O]2+ (
Figure S11E) a maximum at pH ≈ 9, denoting, in both cases, two consecutive acid-base equilibria that were analyzed according to the Ang equation [
77]. Finally and as expected,
2[C,NMe-DMSO]+ (
Figure S11B) did not exhibit any acid–base equilibrium since there are not susceptible atoms prone to undergo this kind of equilibrium. The calculated pK
a1 and pK
a2 values are gathered in
Table S8. At pH >10, the benzothiazole complex
8[CO,S-DMSO]+ (
Figure S11H) underwent fast substitution of DMSO by OH
− to give
8[CO,S-OH] complex as it has been confirmed by stopped flow measurements (
Figure S12). pK
a1 values of the soluble compounds
3[N,NH-H2O]2+, 4[N,NMe-H2O]2+, 5[CNH2,NH-H2O]2+ and
6[CNH2,S-H2O]2+ correspond to the dissociation of an hydrogen atom from water to form the monohydroxo species [
17,
78]. Two ionization equilibrium constants of 2-phenylbenzimidazol ligand have been calculated, which correspond to dissociation of the pyridine- (=NH
+) and pyrrole-type (–NH) hydrogen atoms (Scheme S1). The first pK = 5.2 ± 0.1 is related to the deprotonation of the pyridine type N atom, and the pK = 11.8 ± 0.1 is assigned to that of the pyrrole type N atom. Therefore, pKa
2 corresponds to NH dissociation in
1[C,NH-DMSO], 3[N,NH-H2O]2+ 5[CNH2,NH-H2O]2+ and
7[CO,NH- Cl] [
79,
80]. In view of these results, we can conclude that at pH 7 the complexes are mostly found as in
Table S8 with the exception of 3, which will be found mostly as
3[N,NH-OH]+. As we can observed,
X and
Z play an essential role on the acid-base behavior of the different iridium complexes under study. From now on, the complexes will be denoted as
n[
Z,
X] for simplification.
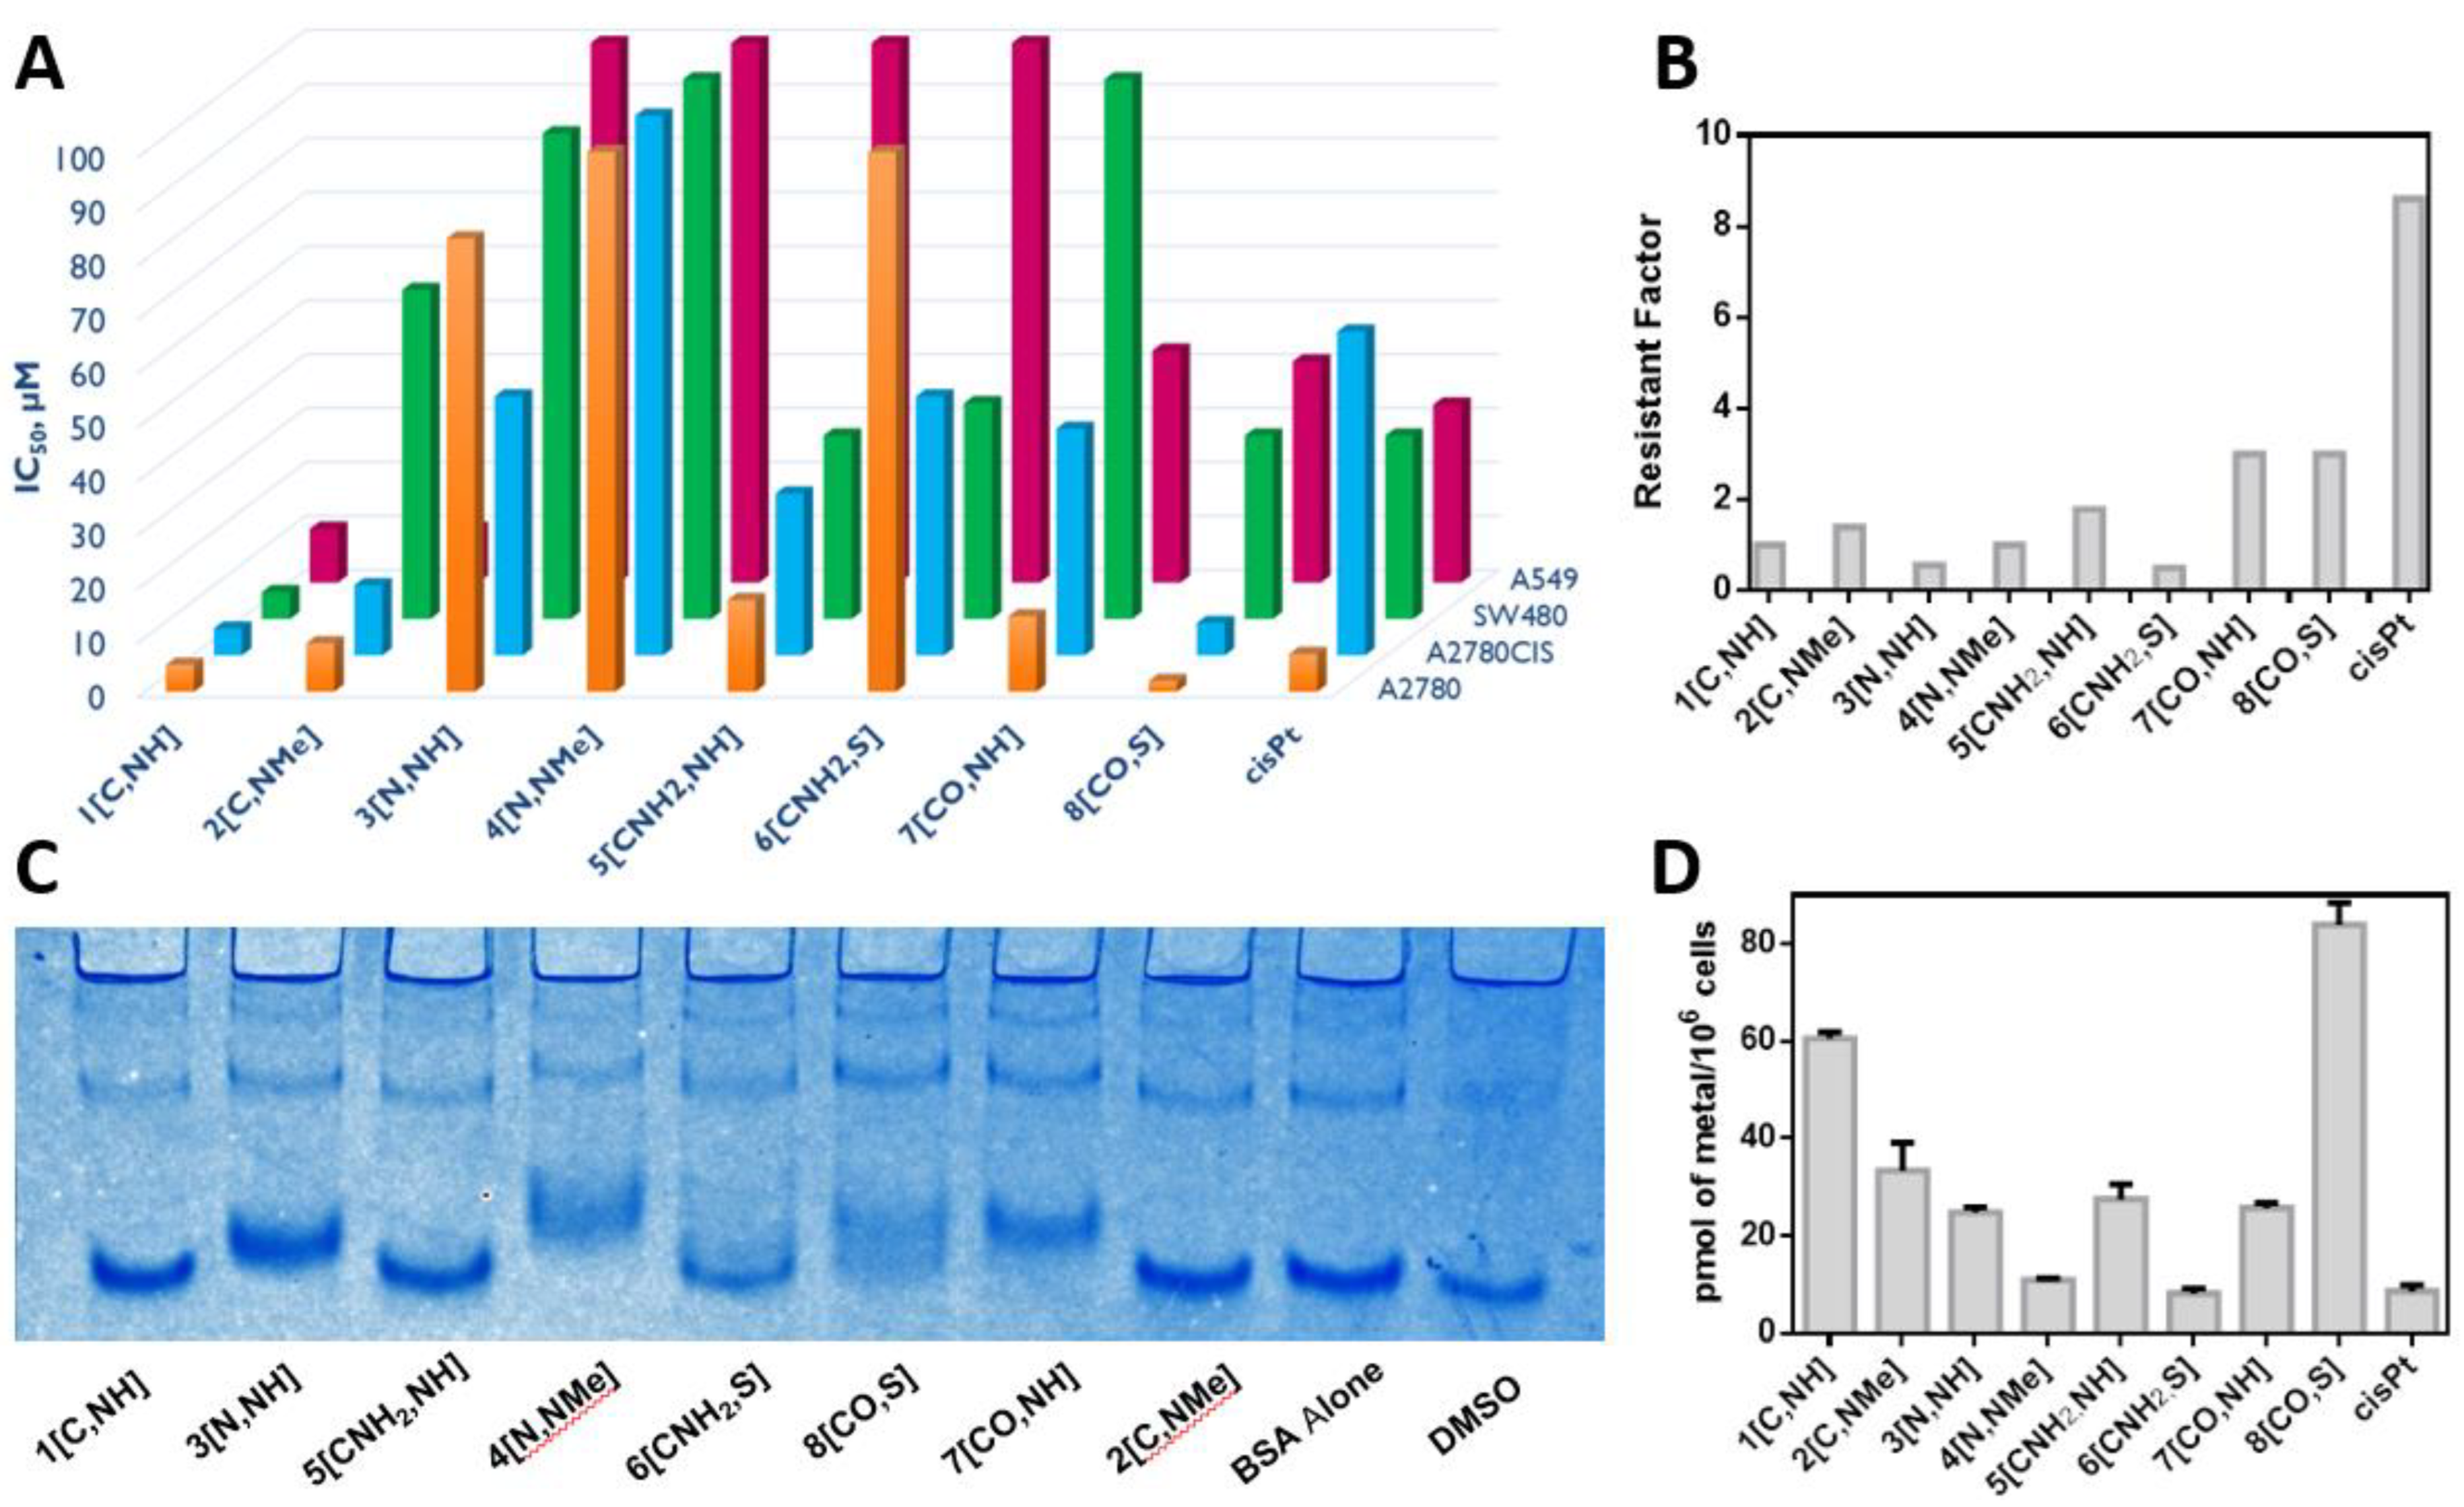
Cytotoxic activity and cell accumulation. The cytotoxicity of the complexes was evaluated in representative human cancer cells: A2780 and A2780cis (epithelial ovarian carcinoma and acquired resistance to cisplatin), SW480 (colon adenocarcinoma) and A549 (epithelial lung adenocarcinoma) cells. The cytotoxicity of cisplatin was also evaluated as a reference. The results, gathered in
Figure 4A and
Table S9, show some interesting structure–activity relationships.
We can observe that the atom in the Z position plays an essential role in the cytotoxic activity of these derivatives. Complexes with atoms negatively charged directly bonded to iridium, Z = C and CO (1[C,NH], 2[C,NMe] and 8[CO,S]) are more cytotoxic than those with neutral atoms attached to the metal center, Z = N and CNH2 (3[N,NH], 4[N,NMe] and 6[CNH2,S]). The only exception is 7[CO,NH], which is less cytotoxic than 5[CNH2,NH] in SW480 cells. Regarding X, we have observed that, in general, the NH group increases the activity when compared to the N-Me group or the S atom (1[C,NH] vs. 2[C,NMe], 3[N,NH] vs. 4[N,NMe], 5[CNH2,NH] vs. 6[CNH2,S]). The only exception is 7[CO,NH], which is less cytotoxic than 8[CO,S]. In conclusion, different substituents on the Z and X positions modulate the cytotoxicity of the arylbenzazole-based iridium(III) complexes. Overall, the less cytotoxic complex in all the cell lines is 4[N,NMe], whereas the most cytotoxic derivative is 1[C,NH] except in A2780 where 8[CO,S] is more active. In addition, 1[C,NH] is more cytotoxic than cisplatin in the four tested cancer cell lines, which confers a special biological relevance to this compound.
Finally, the Resistance Factor (RF) calculated as IC
50,
A2780CIS/IC
50,A2780 (
Figure 4B) reveals that complexes
7[CO,NH] and
8[CO,S] are not able to circumvent cisplatin acquired resistance on A2780cis since RF > 2 [
81]. By contrast, the best performers in all the studied cell lines, complexes
1[C,NH] and
2[C,NMe], exhibited no cross-resistance.
Cellular uptake of the complexes was measured through the determination of the iridium concentration inside SW480 cells by ICP-MS after 24 h of incubation with 2 μM of the complexes (
Figure 4D). All of them, except
6[CNH2,S], show better accumulation than cisplatin, according to the following trend:
8[CO,S] >
1[C,NH] >
2[C,NMe] >
5[CNH2,NH] >
7[CO,NH] >
3[N,NH] >
4[N,NMe] >
cisPt >
6[CNH2,S]. Nonetheless, seroalbumin, the most representative example among proteins in blood plasma and in cell culture media, could sequestrate the complexes and thus lead to lower concentrations inside cells [
82]. Native Polyacrylamide Gel Electrophoresis (PAGE) can be used to study the interactions of a metal complex with bovine seroalbumin, BSA.
Figure 4C shows that
1[C,NH],
2[C,NMe],
5[CNH2,NH] and
6[CNH2,S] do not interact with the protein, so BSA does not hinder their uptake by the cells. The interactions of
3[N,NH],
4[N,NMe] and
7[CO,NH] with BSA suggest that these complexes can be sequestrated by the protein, hindering their cellular accumulation, which might be a possible explanation for their low cytotoxicity. Surprisingly,
8[CO,S] interacts with BSA, but it still exhibits the highest accumulation in SW480 and a high cytotoxic activity. Thus, BSA binding do not explain/justify the differences observed in the cytotoxicity of the complexes.
DNA binding. According to literature data, the mechanism of action of half-sandwich Ir(III) anticancer complexes may involve both interaction with DNA and perturbation of the redox status of cells [
12,
19,
83,
84]. Since DNA-binding cytotoxic drugs are the first choice in the treatment of many cancers [
85,
86,
87,
88,
89], NMR [
69], UV-Vis and Circular Dichroism (CD) spectroscopies, viscosity [
90,
91,
92] and Differential Scanning Calorimetry (DSC) experiments were performed to properly check DNA as a possible target and to clarify the differences in the cytotoxicity (see in DNA interaction section in the
supplemental information). UV-Vis and NMR spectroscopies (
Figures S13–S17) allowed us to conclude that complexes
3[N,NH],
4[N,NMe],
5[CNH2,NH],
6[CNH2,S],
7[CO,NH] and
8[CO,S] are able to covalently bind DNA. Furthermore, the mass spectra of
3[N,NH] with 9MeG and GMP (as simplified models for DNA interaction) revealed coordination to both of them (see
Figures S18 and S19). The corresponding kinetic rate constants, kc, are shown in
Table S10. Nevertheless, DNA covalent binding can be ruled out for
1[C,NH] and
2[C,NMe]. To corroborate if these two complexes are able to bind DNA in a non-covalent way, absorbance titrations were carried out. No variation in the recorded spectra upon the addition of DNA was observed (
Figure S20). Relative viscosities (
Figure S21) and melting temperature, Tm, (determined by differential scanning calorimetry) (
Figure S22) were also measured for each C
D/C
P ratio (D and P being the concentration of complex and DNA, respectively) after overnight incubation in order to ensure the formation of the covalent Ir-DNA bond. No variations were observed for
1[C,NH] and
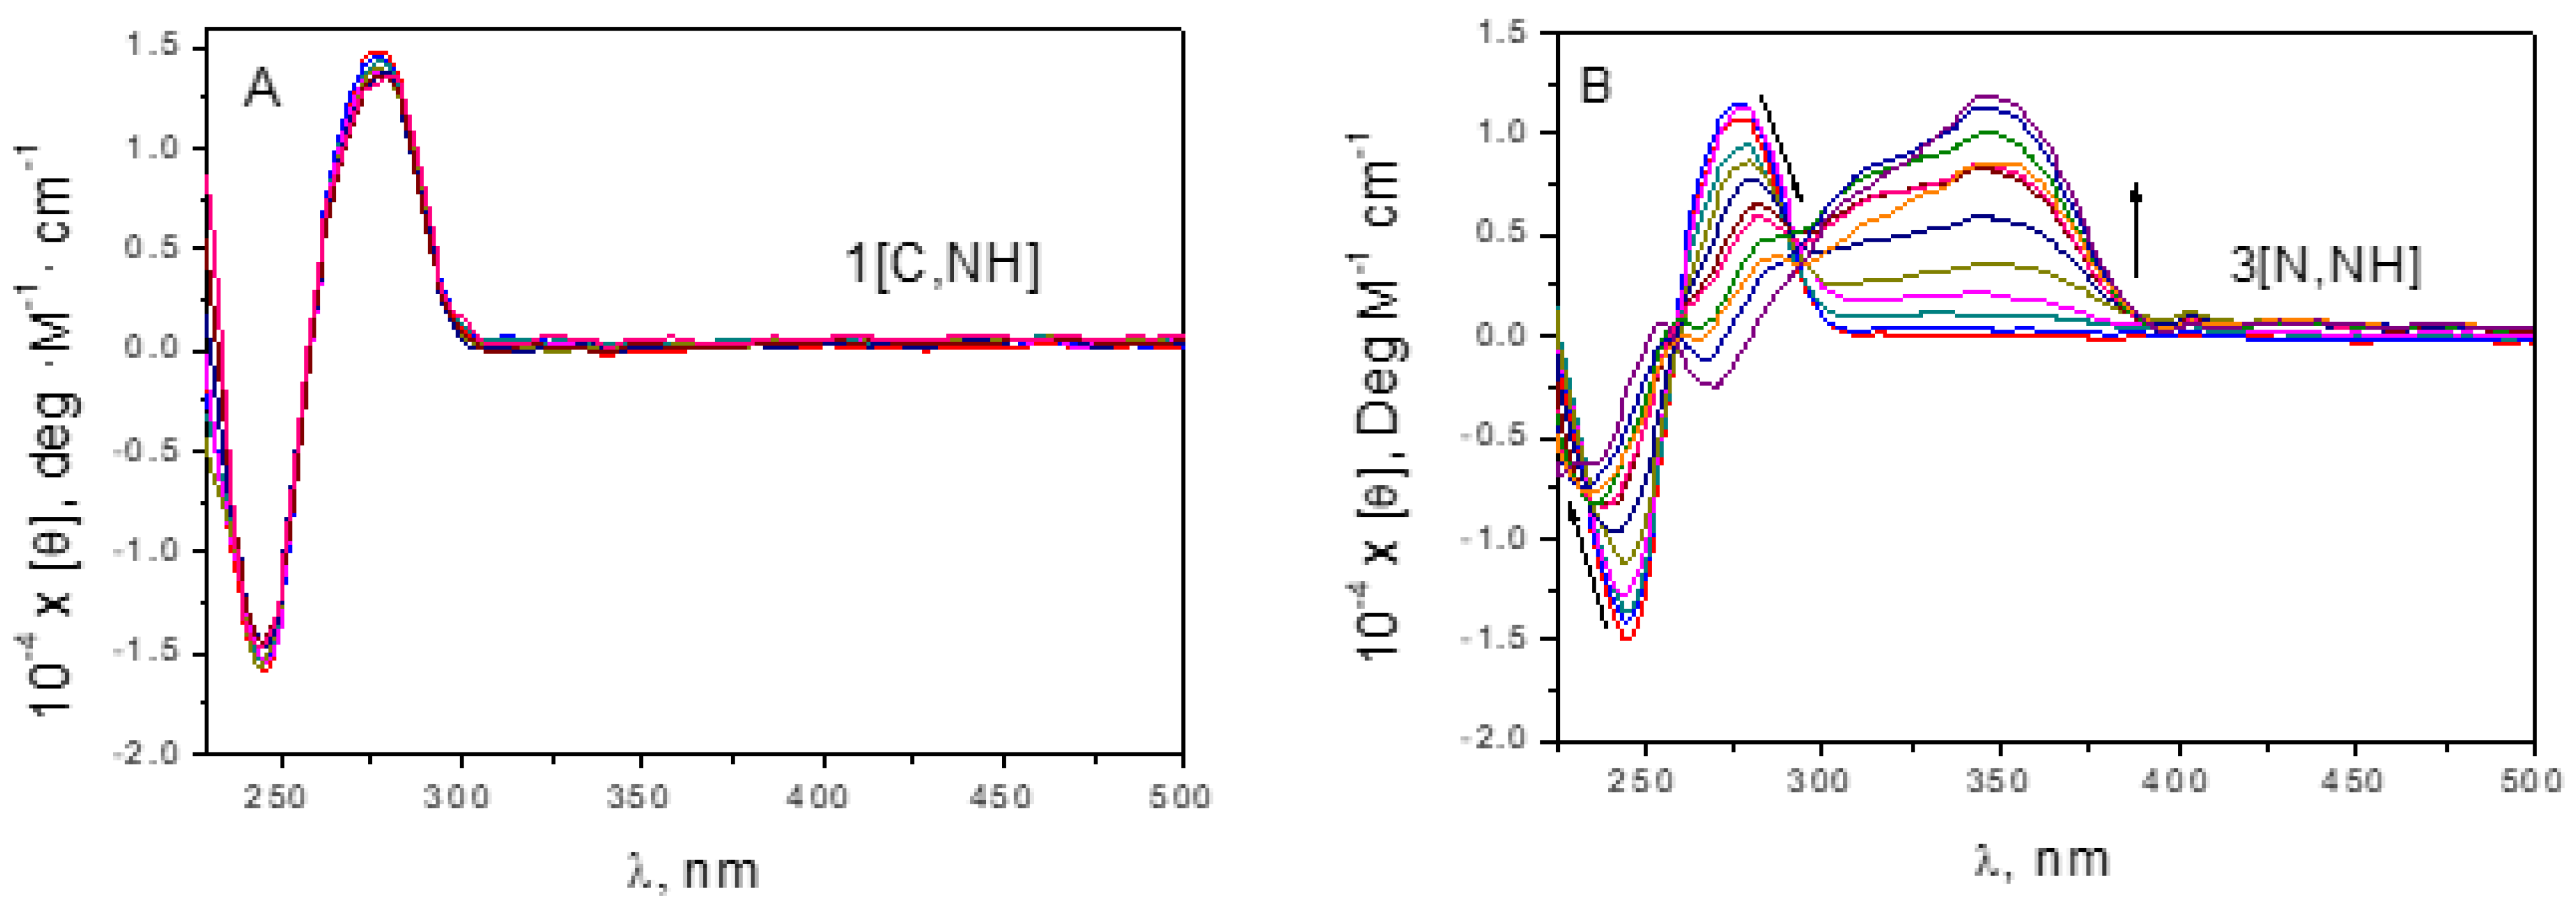
2[C,NMe], confirming again no DNA interaction. Finally, circular dichroism spectrograms were recorded at different C
D/C
P ratios after overnight incubation to allow the covalent Ir-DNA bond formation. It is worth mentioning that our complexes have been isolated as the respective racemic mixtures, which are optically inactive. The evolution of CD bands gave final spectra showing important differences (
Figure 5 and
Figure S23). The new positive and negative induced circular dichroism (ICD) bands account for the formation of Ir-DNA adducts [
93]. Once more, it can be concluded that
1[C,NH] does not bind to DNA since there are no variations in CD spectra. In addition, for
2[C,NMe]/DNA system, the recorded CD spectra show no significant variations, which is compatible with an external binding [
94]. Nonetheless, the variation in CD spectrograms at different C
D/C
P ratios of
3[N,NH],
4[N,NMe],
5[CNH2,NH],
6[CNH2,S],
7[CO,NH] and
8[CO,S] are prominent. Thus, with the exception of
8[CO,S], the interaction of the complexes with DNA does not account for differences in cytotoxicity. In addition, the most cytotoxic compound
1[C,NH] does not interact with DNA (
Figure 5A). The less cytotoxic derivatives,
3[N,NH] and
4[N,NMe], generate strong changes in the DNA structure as a consequence of the interaction (
Figure 5B and
Figure S23B). Nevertheless, their toxicity is low due to their limited cellular accumulation (
Figure 4D). In general, the increase of molar ellipticity [θ] in the ICD region with C
D/C
P corresponds to an intercalation process [
65,
95], and a decrease corresponds to groove binding [
96]. However, the alternation in the sign of ICD bands obtained in all experiments, rules out any interpretation about the specific binding mode and reveals the intricacy of the systems. The changes in the relative viscosity (
Figure S21) and melting temperature (
Figure S22) as a function of the C
D/C
P ratio suggest that a bifunctional covalent-groove binding product is the most likely DNA binding mode [
97].
The gel electrophoresis assay (
Figure S24) confirms previous results, that is, complexes
1[C,NH] and
2[C,NMe] are unable to interact with DNA since no changes in the migration pattern of the plasmid occur. By contrast, the rest of the complexes alter this migration pattern confirming DNA binding.
ROS generation. Several cyclopentadienyl Ir(III) complexes able to alter ROS levels and lead cancer cells to death have been previously reported [
8,
19,
84,
98,
99,
100]. Hence, the ability of complexes to induce ROS was investigated (
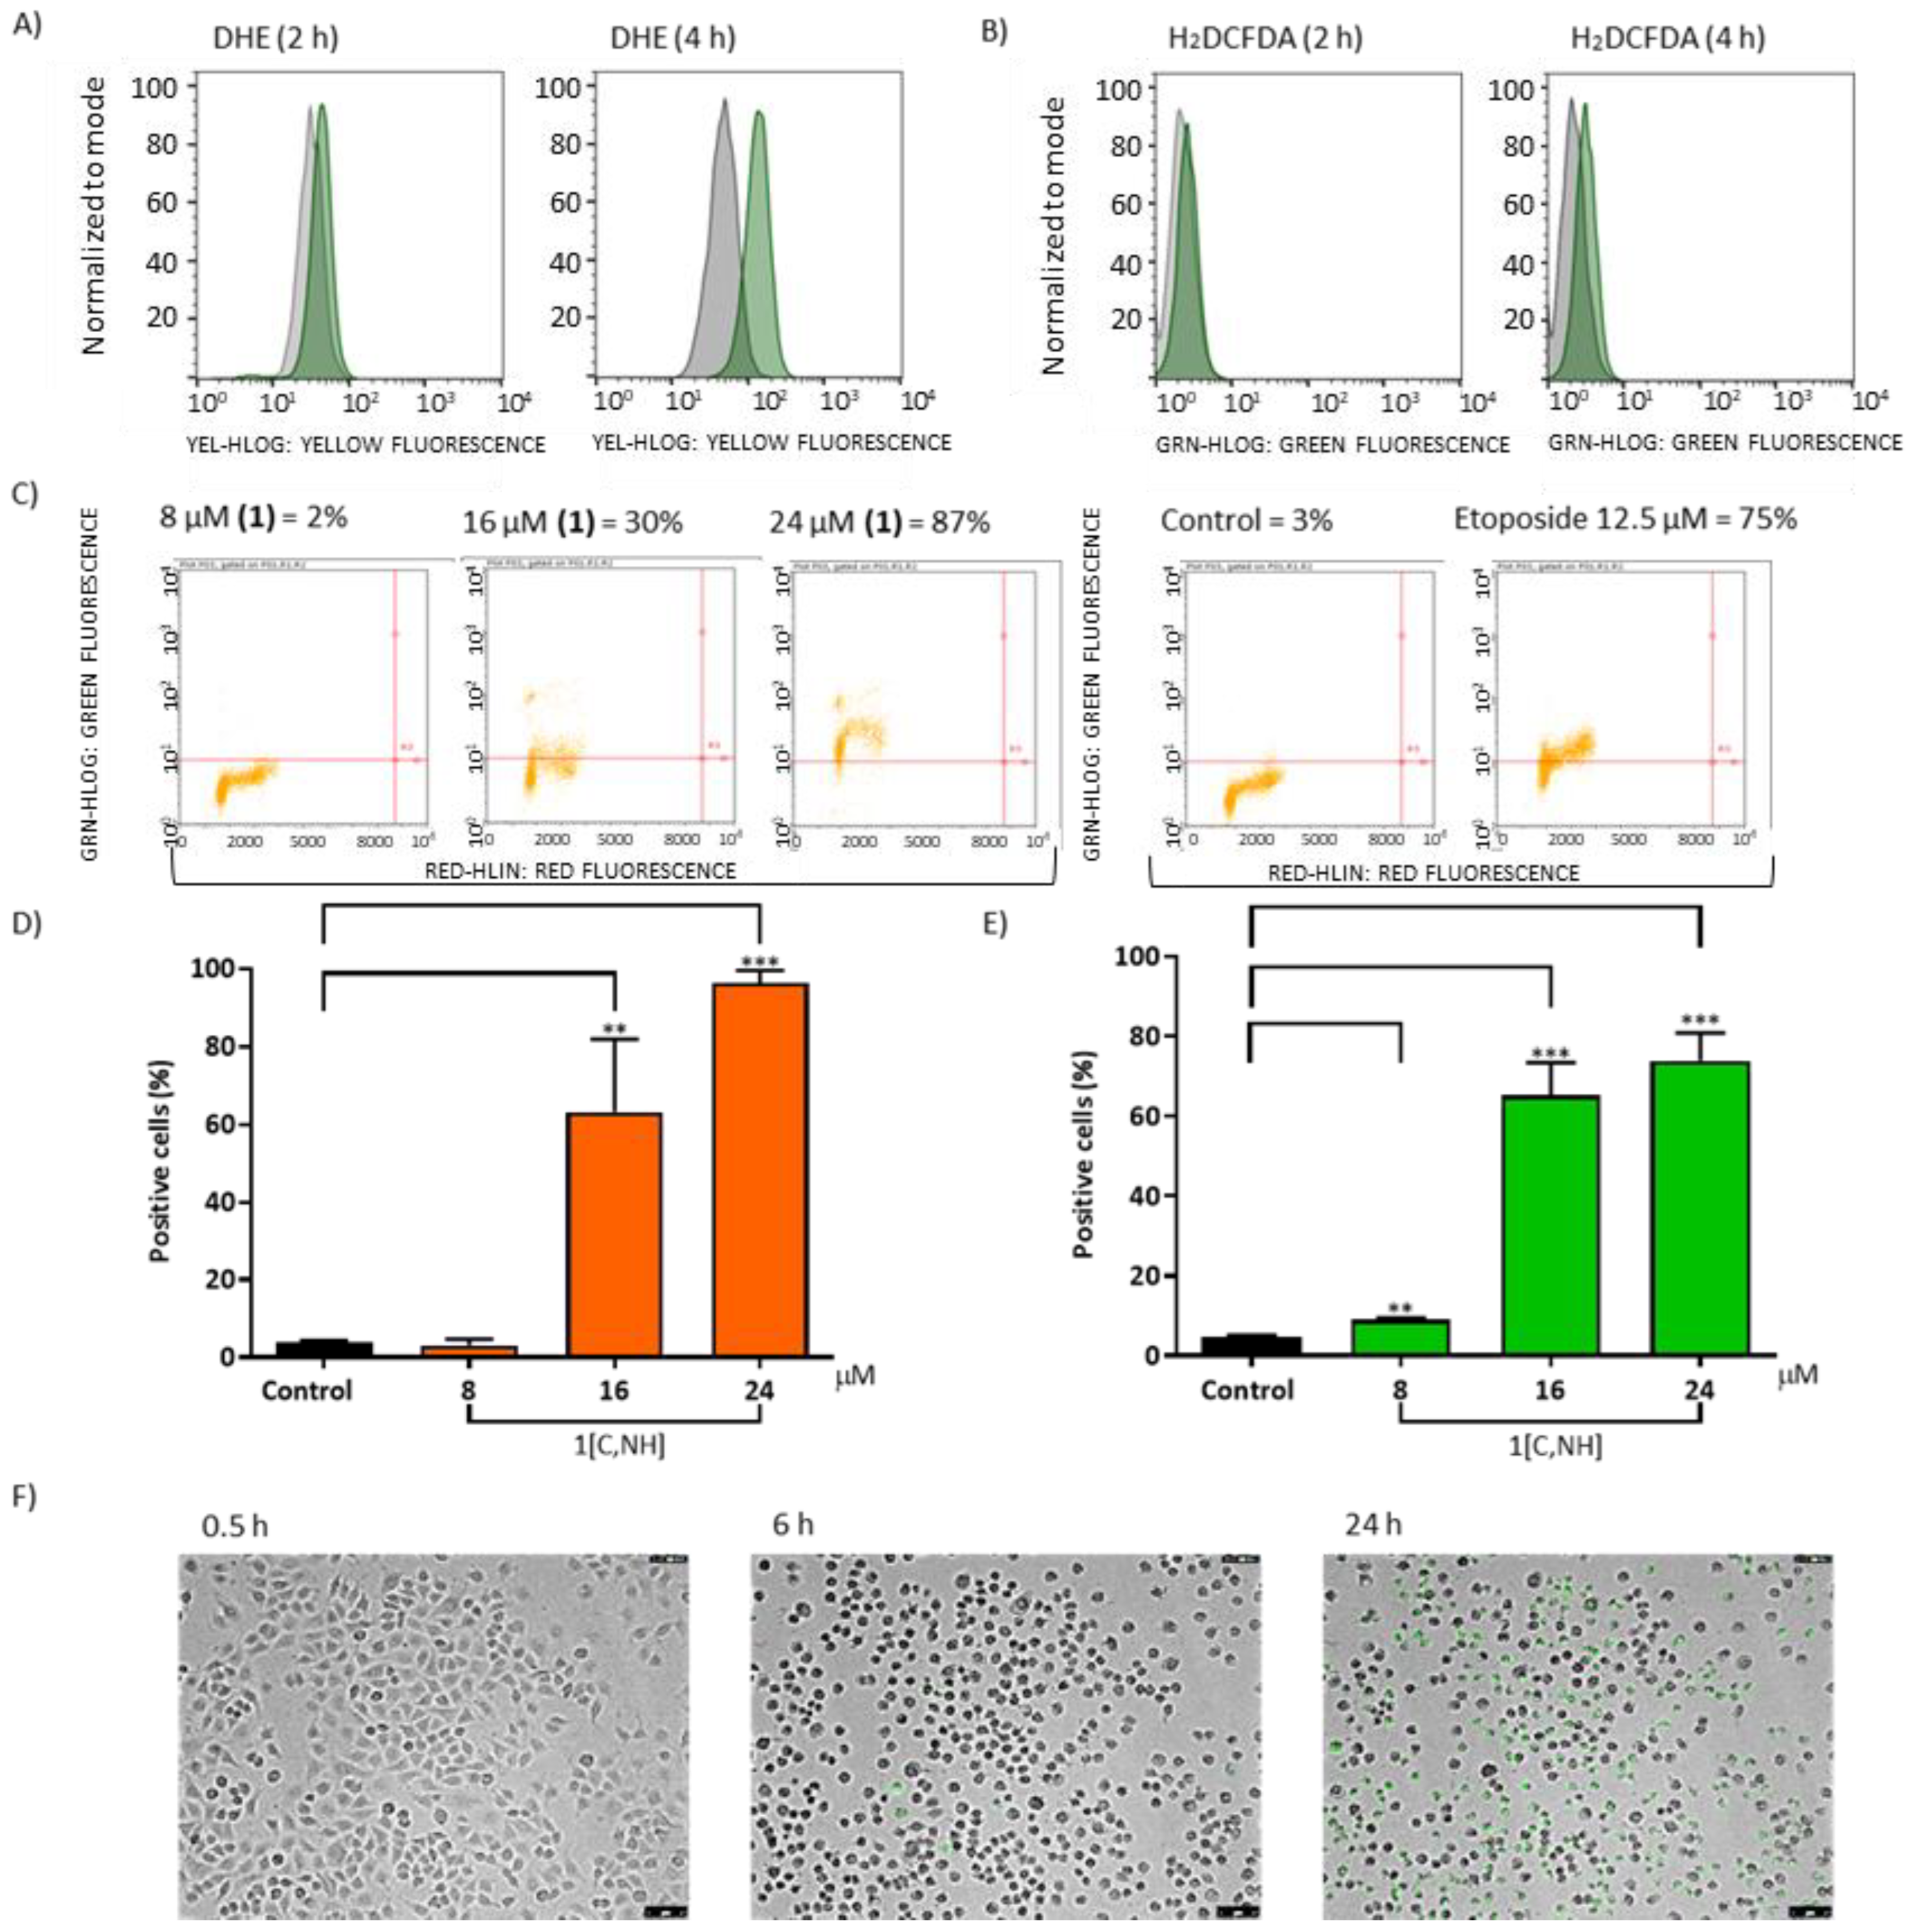
Figure S25). We used two fluorescent probes: dihydroethidium (DHE) to screen for superoxide anion (O
2∙−) levels and 2′, 7′-dichlorodihydrofluorescein diacetate (H
2DCFDA) to detect hydrogen peroxide (H
2O
2) among other oxidative species, such as nitric oxide and peroxynitrite [
101]. After 3 h, DHE fluorescence increased for complexes
1[C,NH], 2[C,NMe] and
8[CO,S]. H
2DCFDA fluorescence also increased, supporting the view that those complexes cause the increase of O
2∙− levels (See
Figure S25).
Mitochondrial dysfunction induced by
1[C,NH] complex. Therefore,
1[C,NH] increases ROS levels (
Figure 6A,B), does not bind to DNA, and is cytotoxic in all studied cell lines. This peculiarity, together with its resistance factor, led us to select this complex to study in more detail its possible mechanism of action. We were aware of the limitations of using fluorescent probes to estimate ROS levels [
102], so we studied the effects of
1[C,NH] on well-known ROS targets [
103]. DNA damage was detected using a phosphorylated histone marker (γH2AX) by flow cytometry [
24]. A dose-dependent increase in DNA double-strand breaks was seen when cells were incubated with
1[C,NH] (
Figure 6C). Moreover, 8-hydroxy-2′-deoxyguanosine (8-OHdG) levels, an oxidized derivative of deoxyguanosine [
104] was increased after 4 h (
Figure S26A). The determination of the reduced glutathione (GSH)/oxidized glutathione (GSSG) ratio is a useful indicator of oxidative stress in cells and tissues.
1[C,NH] decreased the GSH/GSSG ratio as expected (
Figure S26B). To explore if the diminished GSH/GSSG ratio had biological consequences, we tested whether the cytotoxicity induced by
1[C,NH] was rescued with N-acetyl-cysteine (NAC) coadministration. The mechanism of NAC action is debatable. However, it is currently accepted that NAC chemical interaction with hydroperoxides is extremely unlikely, as NAC acts as precursor of GSH in conditions of extreme GSH depletion [
105]. In agreement with a GSH mediated NAC action, we found a partial rescue from cytotoxic effects of
1[C, NH] in the presence of NAC (
Figure S26C).
Proteins and lipids that integrate the mitochondrial membrane may be oxidized by H
2O
2. Cardiolipin(CL)-bound cytochrome c (Cyt c) acts as a peroxidase capable of catalyzing H
2O
2-dependent CL peroxidation, which is an essential step in the release of Cyt c during apoptosis.[
62]
1[C,NH] induced CL oxidation (
Figure 6D) and increased Cyt c release (
Figure 6E). Moreover, the administration of
1[C,NH] induced caspase 3/7 activation (
Figure 6F) (see
S.I Movie S.1). All this data indicated that
1[C,NH] prompts a form of programmed cell death. Morphological changes presented by the cells were also compatible with the process of apoptosis [
106]: retraction of the cytoplasm, nuclear fragmentation and formation of apoptotic bodies. Furthermore, some cells showed secondary necrosis, with a balloon-like morphology. All in all, these events are the natural outcome of the complete apoptotic program (
Figure S27A) [
107]. Swollen ER and mitochondria, early signals of preapoptotic cells [
108] and the presence of large invaginations of the plasma membrane were present 2 h after the treatment. After 12 h numerous autophagosomes, as a signal of mitochondrial affectation [
109], were detected (
Figure S27B). Hoechst/Propidium Iodide (PI) staining was used to exclude necrosis [
110] as the principal cause of death. PI positive cells were absent during the first 6 h of treatment and were only present 24 h later, associated with secondary necrosis (
Figure S27C). Furthermore, release of lactate dehydrogenase (LDH) to the medium, owing to the altered permeability of the plasmatic membrane, only began after 8 h of incubation (
Figure S27D).
Studies of the effect of
1[C,NH] on gene expression were performed and assessed 6 h after treatment, in a middle phase, when most cells were still alive (see
S.I. Movie S2) but already with characteristic morphological features of apoptosis (Movie S1). Gene expression profiles of cells was determined by Affymetrix Human Gene 2.1 ST Array Plate in three independent experiments. In order to confirm the microarray data, we selected some genes involved in several key pathways: stress response, apoptosis and cell cycle to validate the changes in the expression by RT-qPCR. Results indicated a good correlation between microarray analysis and RT-qPCR. (
Table S11). We next used Gene Ontology (GO) enrichment analysis to compare the biological processes that were significantly affected. Using GO term finder combined with ReviGO, we classified the function of all gene hits whose expression was significantly increased by
1[C,NH] into the broad categories of (i) “Negative regulation of cellular macromolecule biosynthetic process,” (ii) “negative regulation of cellular metabolic process,” (iii) “negative regulation of macromolecule metabolic process” and/or (iv) “negative regulation of cellular process”. Note that not all genes are annotated with these databases. However, the negative regulation of metabolic process and negative regulation of macromolecule metabolic process are highly represented, and ~38% (84) of all genes could be classified in this way. On the other hand,
1[C,NH] significantly decreased the expression of histone genes, consistent with the fact that treatment with
1[C,NH] induces a stress response that leads to the arrest of the cell cycle and the entry into apoptosis. The effect of
1[C,NH] on cell cycle progression was further assessed by flow cytometry. Then, 24 h after treatment, the percentage of cells in G0/G1 phase increased and cells in G2/M phase decreased (
Figure S28), thus justifying the down regulation of G2/M phase genes. In summary, mRNA expression analysis is in good agreement with the elevation of ROS, oxidative stress response, cell cycle arrest and induction of apoptosis.
Since all these experiments point out at an increment of ROS levels for
1[C,NH], we wondered about the initial source of ROS. We explored first whether
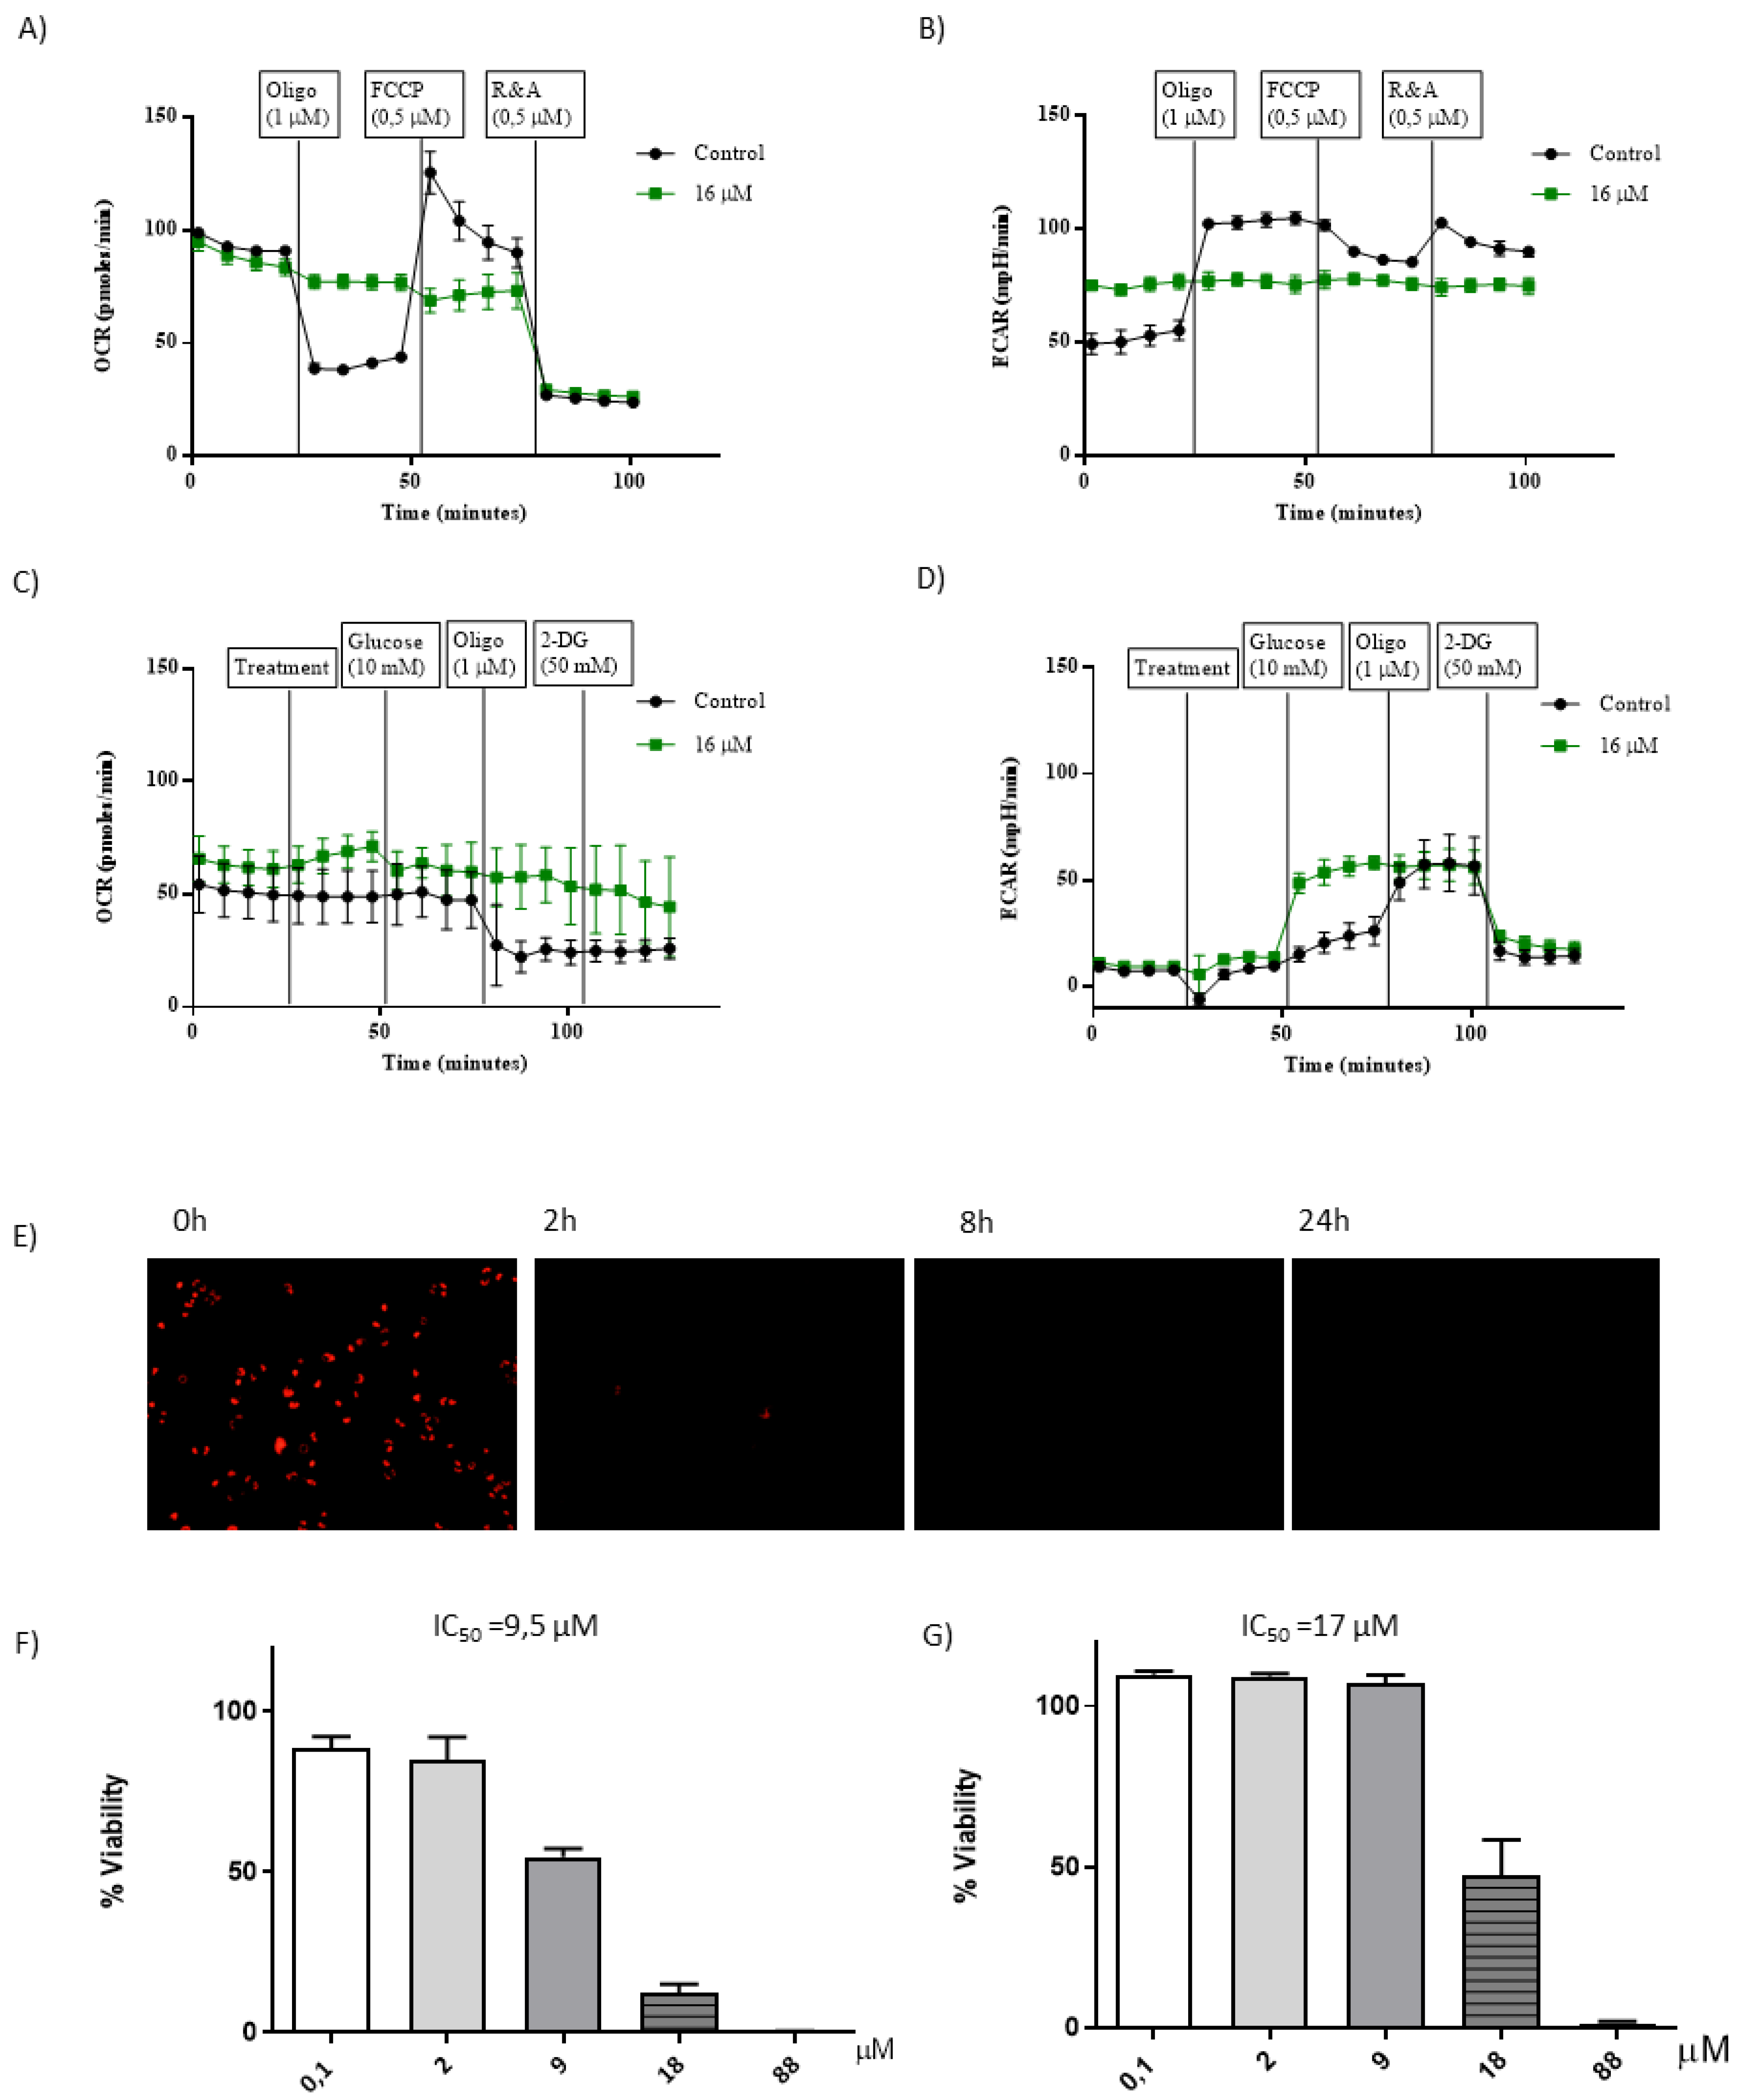
1[C,NH] directly affected mitochondrial respiration. Oxygen consumption rate (OCR) provides a measurement of mitochondrial respiration. After treatment of A549 cells with
1[C,NH], basal OCR was not affected. Interestingly, when oligomycin (Oligo), an ATP synthase inhibitor, was added to
1[C,NH] treated cells, OCR was not affected, indicating that the main component of OCR in the treated cells was not linked to ATP production (
Figure 7A). Therefore, we tentatively concluded that administration of
1[C,NH] increased proton leaks (
Table S12). When the protonophore FCCP (carbonyl cyanide p-trifluoromethoxyphenyl hydrazone) was added, OCR remained unchanged again instead of raising the OCR to the maximum values. Again, this suggests that complex
1[C,NH] blocks the ability of the electron transport chain (ETC) enzymatic system to reduce O
2 and generate a proton gradient through the mitochondrial membrane. Since the mitochondrial membrane potential (MMP) seemed to be affected by our compound, MMP was evaluated using the fluorescent potentiometric dye, tetramethylrhodamine methyl ester (TMRM). As seen in
Figure 7E,
1[C,NH] induced a quick and deep dissipation of MMP confirming again that administration of
1[C,NH] increases proton leaks. To test the effect in the non-mitochondrial respiration, mitochondrial respiration was blocked with a mixture of rotenone (R, a complex I inhibitor), and antimycin A (A, a complex III inhibitor). OCR in
1[C,NH] treated cells was reduced to the levels of control cells, demonstrating that non-mitochondrial OCR was not affected by
1[C,NH] administration (
Figure 7A). Thus,
1[C,NH] selectively disrupts mitochondrial respiration. Therefore,
1[C,NH] was selectively acting on mitochondrial respiration.
The mitochondrial capacity to produce ATP dropped markedly in cells treated with
1[C,NH] (
Table S12). However, a small decrease of around 35% on ATP levels was found after 8 h incubation with
1[C,NH] (
Figure S29A). Accordingly, cells needed to harness the glycolytic pathway in order to maintain ATP levels, as seen by the increase in the extracellular acidification rate (ECAR), that is largely the result of glycolysis (
Figure 7B). Moreover, the modulation of mitochondrial activity with Oligo, FCCP and R&A had no effect on ECAR, supporting that
1[C,NH] disrupted mitochondrial ATP synthesis. Oxidation of galactose to pyruvate yields no net ATP, which prompts cells to oxidize pyruvate via OXPHOS (oxidative phosphorylation) to survive. Thus, we used A549 galactose-grown cells (A549-gal) [
54] to further explore the effects of
1[C,NH]. A small increase in OCR was detected after addition of
1[C,NH], as expected for an uncoupled agent. Nevertheless and taking into account previous data, no variation in the OCR values was found in
1[C,NH] treated A549-gal cells after Oligo addition since mitochondria ATP synthesis was disrupted due to
1[C,NH]treatment (
Figure 7C). Furthermore, confirmation that
1[C,NH] did not affect glycolysis, was obtained when glucose was offered to A549-gal cells a seen by the huge ECAR increase in
1[C,NH] treated cells (
Figure 7D). Moreover, when treated cells were offered 2-DG (2-Deoxy-D-glucose), that blocks glucose metabolism, ECAR immediately dropped indicating that glycolysis was the major contributor to ECAR in treated cells (
Figure 7D) (
Table S13). In summary, cells endure the dysfunction of the mitochondria increasing their glycolytic capacity to maintain the ATP levels.
1[C,NH] also presented similar effects in a non-tumor cell line, MCF10A.
Mitochondrial dysfunction triggers the integrated stress response (ISR). An increase in cytosolic Ca
2+ was also observed after 4 h of incubation (
Figure S29C). To gather more evidence, we assessed the effect of
1[C,NH] on protein synthesis. ISR is known to trigger eIF2α phosphorylation that inhibits protein synthesis. After 6 h,
1[C,NH] inhibited around 60% of the total protein synthesis (
Figure S29B). Furthermore, we also observed an increased expression of the ER stress-responsive transcription factor C/EBP homologous protein (CHOP) (
Figure S30) thus confirming that
1[C,NH] was triggering the ISR as result of
1[C,NH] causing mitochondrial dysfunction.
1[C,NH] selective action on mitochondrial bioenergetic, inducing oxidative stress, led us to explore it as an antitumor drug. It is generally accepted that apoptosis is initiated when ROS generation overflows the cellular antioxidant pathways. We reasoned that proliferating cells should be more sensitive to
1[C,NH] action rather than terminally differentiated, non-proliferating normal cells because ROS production is different in both conditions. Cell division raises the energy demand and as a by-product, mitochondrial ROS production is increased. Hence,
1[C,NH] proapoptotic effect should be greater in proliferating cells with an already elevated ROS production. We have addressed this point by assessing complex
1[C,NH] action in the same cell line under proliferating (increased ROS production) vs. non-proliferating conditions. Significantly, we found that the IC
50 of the complex
1[C,NH] was 9.5 µM in the proliferating condition vs. 17 µM in the non-proliferating condition (see
Figure 7F). Thus, confirming our prediction and opening the therapeutic window for the complex. In summary, complex
1[C,NH] acts enhancing the oxidative stress of the tumor cell to induce apoptosis. Remarkably, normal vs. mutated oncogenes are non-longer relevant for complex
1[C,NH] action, unless driver oncogenes modify the metabolism of the tumor cells, as it frequently happens, inducing cell proliferation and, as a by-product of the increased energetic demand, oxidative stress.
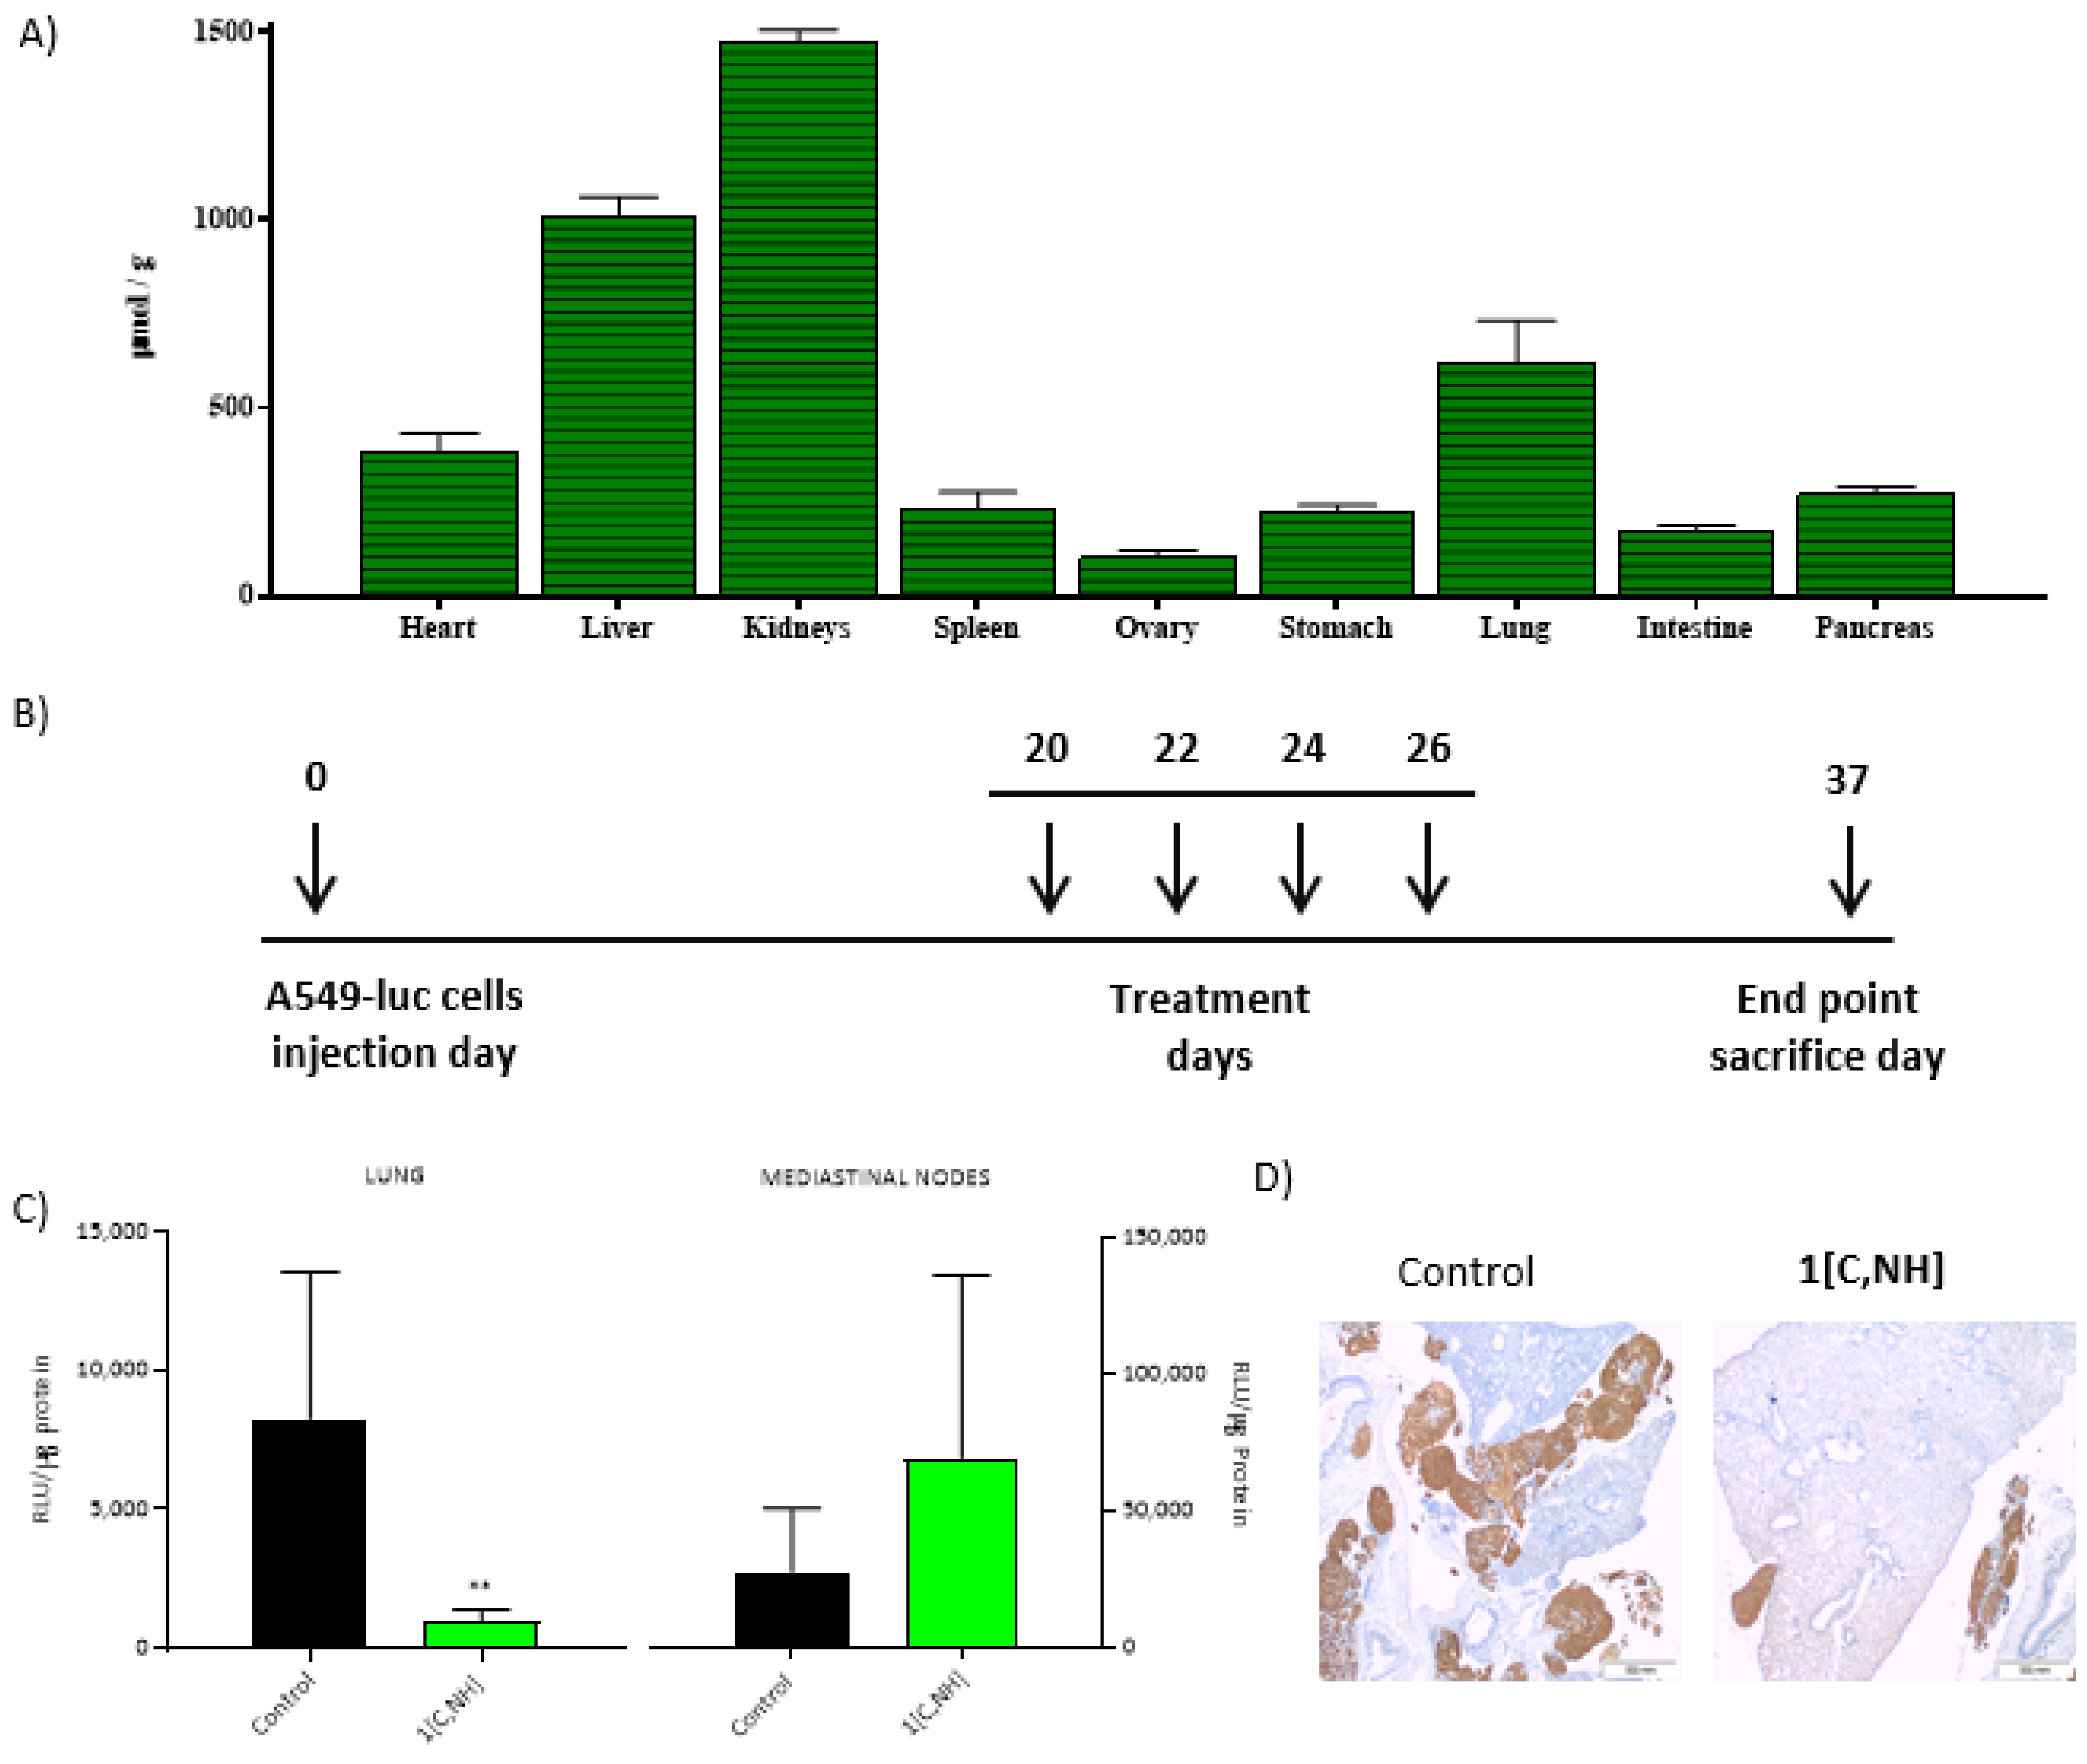
1[C,NH] reduced the lung tumor burden. Prior the performance of in vivo studies, the drug uptake was determined. The amount of
1[C,NH] entering the cell was estimated after administration of 16 μM of
1[C,NH] to 400,000 cells. The intracellular iridium content was assessed after 4 h by ICP-MS, and the percentage of drug taken up by cells was 1.7%. Then, acute toxicity and bio distribution of
1[C,NH] was studied in healthy mice (BALB/c).
1[C,NH] was dissolved in PBS The maximum tolerated dose was (1.3 mg/kg) and the bio distribution showed that most irrigated tissues were the ones with the highest accumulation of
1[C,NH], such as liver, kidneys and lungs (
Figure 8A). Antitumor efficacy was studied using an orthotopic model of lung cancer in nude mice [
24] (
Figure 8B). A549-luc cells (A549 cells marked with luciferase) were used to induce the tumor and 20 days after the injection of cells, we proceeded to the administration of 4 doses (0.9 mg/kg) of
1[C,NH] on alternate days. Treated mice did not lose weight. During the necropsy, no pathological evidence of relevance was detected in non-tumor tissues in treated animals. However, we cannot exclude the appearance of toxic effects after repeated administrations over longer periods of time. Control animals showed a steady tumor growth up to the end of the experiment, 37 days after injection.
1[C,NH] had no effect on the reduction of tumor burden, as seen by daily measurements of the bioluminescence in tumor cells. However, this estimation did not discriminate between fluorescence coming from the primary tumor and from the affected lymphatic nodes. To differentiate the effect of
1[C,NH] on the primary tumor and on the affected nodes, at day 37, the animals were sacrificed, and luciferase activity, as a marker on the presence of tumor cells, was measured. Interestingly,
1[C,NH] significantly reduced luciferase activity in the primary tumor but not in the neighbor invaded mediastinal nodes (
Figure 8C). Moreover, lung mice were stained with a monoclonal antibody against a human cytokeratin (only A549 tumor cells of human origin were stained) (
Figure 8D). Notably,
1[C,NH] had a strong effect on reducing the size of tumor foci, confirming that
1[C,NH] had a strong antitumor action on the primary tumor. The lack of effect on mediastinal nodes could be related with a low penetration of
1[C,NH] into the lymphatic nodes. In addition, other factors influence the efficacy of a drug on the primary tumor and not on the metastasis, cell-cell interactions, matrix in the nodes, etc. However,
1[C,NH] differential effects on the primary tumor and in affected mediastinal nodes could be the result of mitochondrial plasticity in tumor progression [
111]. Cancer cells continuously rewire their metabolism to fulfil their need for rapid growth and survival while subject to changes in environmental cues. Cancer cells that depend mainly on glucose for ATP synthesis, such as hypoxic cells, depend less on OXPHOS and are thus more resistant to
1[C,NH]. We believe, therefore, that the sensitivity or resistance to
1[C,NH] is given by the activity of the mitochondria that will vary depending on the tumor and its location.


 ,
, 


