Article

A Novel Machine Learning 13-Gene Signature: Improving Risk Analysis and Survival Prediction for Clear Cell Renal Cell Carcinoma Patients

by
Patrick Terrematte
1,2,*,
Dhiego Souto Andrade
1,
Josivan Justino
1,3,
Beatriz Stransky
1,4,
Daniel Sabino A. de Araújo
1 and
Adrião D. Dória Neto
1,5
1
Bioinformatics Multidisciplinary Environment (BioME), Metropole Digital Institute (IMD), Federal University of Rio Grande do Norte (UFRN), Natal 59078-400, Brazil
2
Department of Engineering and Technology (DETEC), Pau dos Ferros Multidisciplinary Center, Federal Rural University of Semi-arid (UFERSA), Pau dos Ferros 59900-000, Brazil
3
Department of Mathematics and Statistics (DME), Federal University of Rondônia (UNIR), Ji-Paraná 76900-726, Brazil
4
Biomedical Engineering Department, Center of Technology, UFRN, Natal 59078-970, Brazil
5
Department of Computer Engineering and Automation, UFRN, Natal 59078-970, Brazil
*
Author to whom correspondence should be addressed.
Cancers 2022, 14(9), 2111; https://doi.org/10.3390/cancers14092111
Submission received: 10 March 2022 / Revised: 11 April 2022 / Accepted: 12 April 2022 / Published: 24 April 2022
(This article belongs to the Collection Artificial Intelligence and Machine Learning in Cancer Research)

Abstract

:

Simple Summary

Clear cell renal cell carcinoma is a type of kidney cancer which comprises the majority of all renal cell carcinomas. Many efforts have been made to identify biomarkers which could help healthcare professionals better treat this kind of cancer. With extensive public data available, we conducted a machine learning study to determine a gene signature that could indicate patient survival with high accuracy. Through the min-Redundancy and Max-Relevance algorithm we generated a signature of 13 genes highly correlated with patient outcomes. These findings reveal potential strategies for personalized medicine in the clinical practice.

Abstract

Patients with clear cell renal cell carcinoma (ccRCC) have poor survival outcomes, especially if it has metastasized. It is of paramount importance to identify biomarkers in genomic data that could help predict the aggressiveness of ccRCC and its resistance to drugs. Thus, we conducted a study with the aims of evaluating gene signatures and proposing a novel one with higher predictive power and generalization in comparison to the former signatures. Using ccRCC cohorts of the Cancer Genome Atlas (TCGA-KIRC) and International Cancer Genome Consortium (ICGC-RECA), we evaluated linear survival models of Cox regression with 14 signatures and six methods of feature selection, and performed functional analysis and differential gene expression approaches. In this study, we established a 13-gene signature (AR, AL353637.1, DPP6, FOXJ1, GNB3, HHLA2, IL4, LIMCH1, LINC01732, OTX1, SAA1, SEMA3G, ZIC2) whose expression levels are able to predict distinct outcomes of patients with ccRCC. Moreover, we performed a comparison between our signature and others from the literature. The best-performing gene signature was achieved using the ensemble method Min-Redundancy and Max-Relevance (mRMR). This signature comprises unique features in comparison to the others, such as generalization through different cohorts and being functionally enriched in significant pathways: Urothelial Carcinoma, Chronic Kidney disease, and Transitional cell carcinoma, Nephrolithiasis. From the 13 genes in our signature, eight are known to be correlated with ccRCC patient survival and four are immune-related. Our model showed a performance of 0.82 using the Receiver Operator Characteristic (ROC) Area Under Curve (AUC) metric and it generalized well between the cohorts. Our findings revealed two clusters of genes with high expression (SAA1, OTX1, ZIC2, LINC01732, GNB3 and IL4) and low expression (AL353637.1, AR, HHLA2, LIMCH1, SEMA3G, DPP6, and FOXJ1) which are both correlated with poor prognosis. This signature can potentially be used in clinical practice to support patient treatment care and follow-up.

1. Introduction

Renal cell carcinoma (RCC) occurs in the renal cortex or the renal tubular epithelial cell. The molecular subtypes of renal cancers are clear cell RCC (ccRCC), papillary RCC (pRCC), and chromophobe RCC (ChRCC). RCC accounts for more than 90% of cancers in the kidney [1], of which 80–90% are ccRCC [2], and more than 30% of patients with ccRCC experience metastasis [3]. In 2020, the worldwide mortality rate from kidney cancer was an estimated 179,368 cases International Agency for Research on Cancer (IARC). The American Cancer Society estimated a prevalence of 76,080 new cases of kidney cancer for 2021 in the United States (48,780 in men and 27,300 in women), and an estimated mortality rate of 13,780 people (8790 men and 4990 women) [4]. Depending on the stage at diagnosis, the five-year survival rates of RCC in the US are the following: 93% for localized disease (stage I), 72.5% for regional disease (stage II/III, local lymph node involvement), and only 12% for late-stage (stage IV metastatic) [5]. The poor survival outcomes of metastatic patients with ccRCC reveal the importance of seeking new and robust biomarkers of prognosis, and of preventing the progression of non-metastatic tumors.
The challenges of artificial intelligence (AI) applications to cancer care are driven by the translation of models with clinical validity, utility, and usability into feasible clinical treatment [6]. In the field of precision medicine applied to cancer, feature selection is useful in detecting the most important traits and molecular profiles for predicting the survival risks of a patient′s outcome through a given gene set. A gene signature is a set of genes whose expression pattern in a specific cell type and condition can provide a biomarker for diagnosis, prognosis, or therapeutic responses in cancer patients [7]. The gene signatures can be defined by the pattern of the Single Nucleotide Variant (SNV) mutational profile; the copy number of alterations (CNA); the methylation levels; or the expression of messenger or other RNA types. Genes involved in the biological processes of many tumors might be overexpressed or inhibited, signaling a better or worse prognosis for the patient [8]. While most of the studies used only mRNA data to build their signatures, microRNA and/or clinical data can be explored as relevant features to build a predictive signature [9,10,11,12,13,14].
Nowadays, the scientific community is still searching for new biomarkers for ccRCC, and feature selection methods using survival analysis provide a robust exploratory methodology before experimental validations. Survival analysis is a field of statistics that predicts the time until an event of interest happens in many domains [15]. The most commonly used method for survival analysis is the Cox Regression model [16]. The Cox model is semi-parametric, that is, the distribution of the event of interest is unknown. In addition, Cox models are widely used for censored data, i.e., when the event is not observed during the study period due to loss to follow-up, study termination, or the patient’s death by other causes. Regularized Cox models provide suitable predictions for high-dimensional data using penalty functions with the main regularizers Lasso-Cox, Ridge-Cox, and Elastic net-Cox [15]. Ensemble learning methods are committees of machine learning models, in other words, they combine the majority of the votes for each model in an ensemble or they adjust the weighted vote of each model. Moreover, this approach results in a more robust, efficient, and stable model compared to singular models. In this work, we applied Cox models and ensemble methods using gene expression to predict the overall survival (OS) after diagnosis of ccRCC.
Lasso-Cox regression generated most of the reviewed gene signatures for ccRCC [9,10,13,17,18,19]. All the studies reviewed in this work use the TCGA-KIRC dataset to train and validate the results. Fewer studies validated their results with other datasets such as GEO database [2,10,13], ICGC-RECA [2,11], and data from Fudan University Shanghai Cancer Center (FUSCC). The most common methodologies used to discover and validate gene signatures were differentially expression analysis (DEA), and gene set enrichment analysis (GSEA). Only one study compared its methodology to three other biomarker signatures from our literature selection [9]. In addition, there was a lack of comparisons between the gene signatures. As far we know, our study presents the most comprehensive comparison between gene signatures, including ensemble methods, machine learning, and feature selection.
This study aims to specify a gene signature based on the state-of-the-art algorithms of feature selection methods, and to be able to predict the survival risk of ccRCC patients. Moreover, this study compares the novel signatures obtained by these feature selection methods, and other previously published gene signatures. The best-performing gene signature was achieved using the mutual-information-based ensemble method of min-Redundancy and Max-Relevance (mRMR) [20]. Specifically, the mRMR is an ensemble-based method to select a minimal set of features with a maximum prediction performance. The flowchart shown in Figure 1 displays a summarized view of the discovery process for the novel mRMR gene signature of ccRCC.

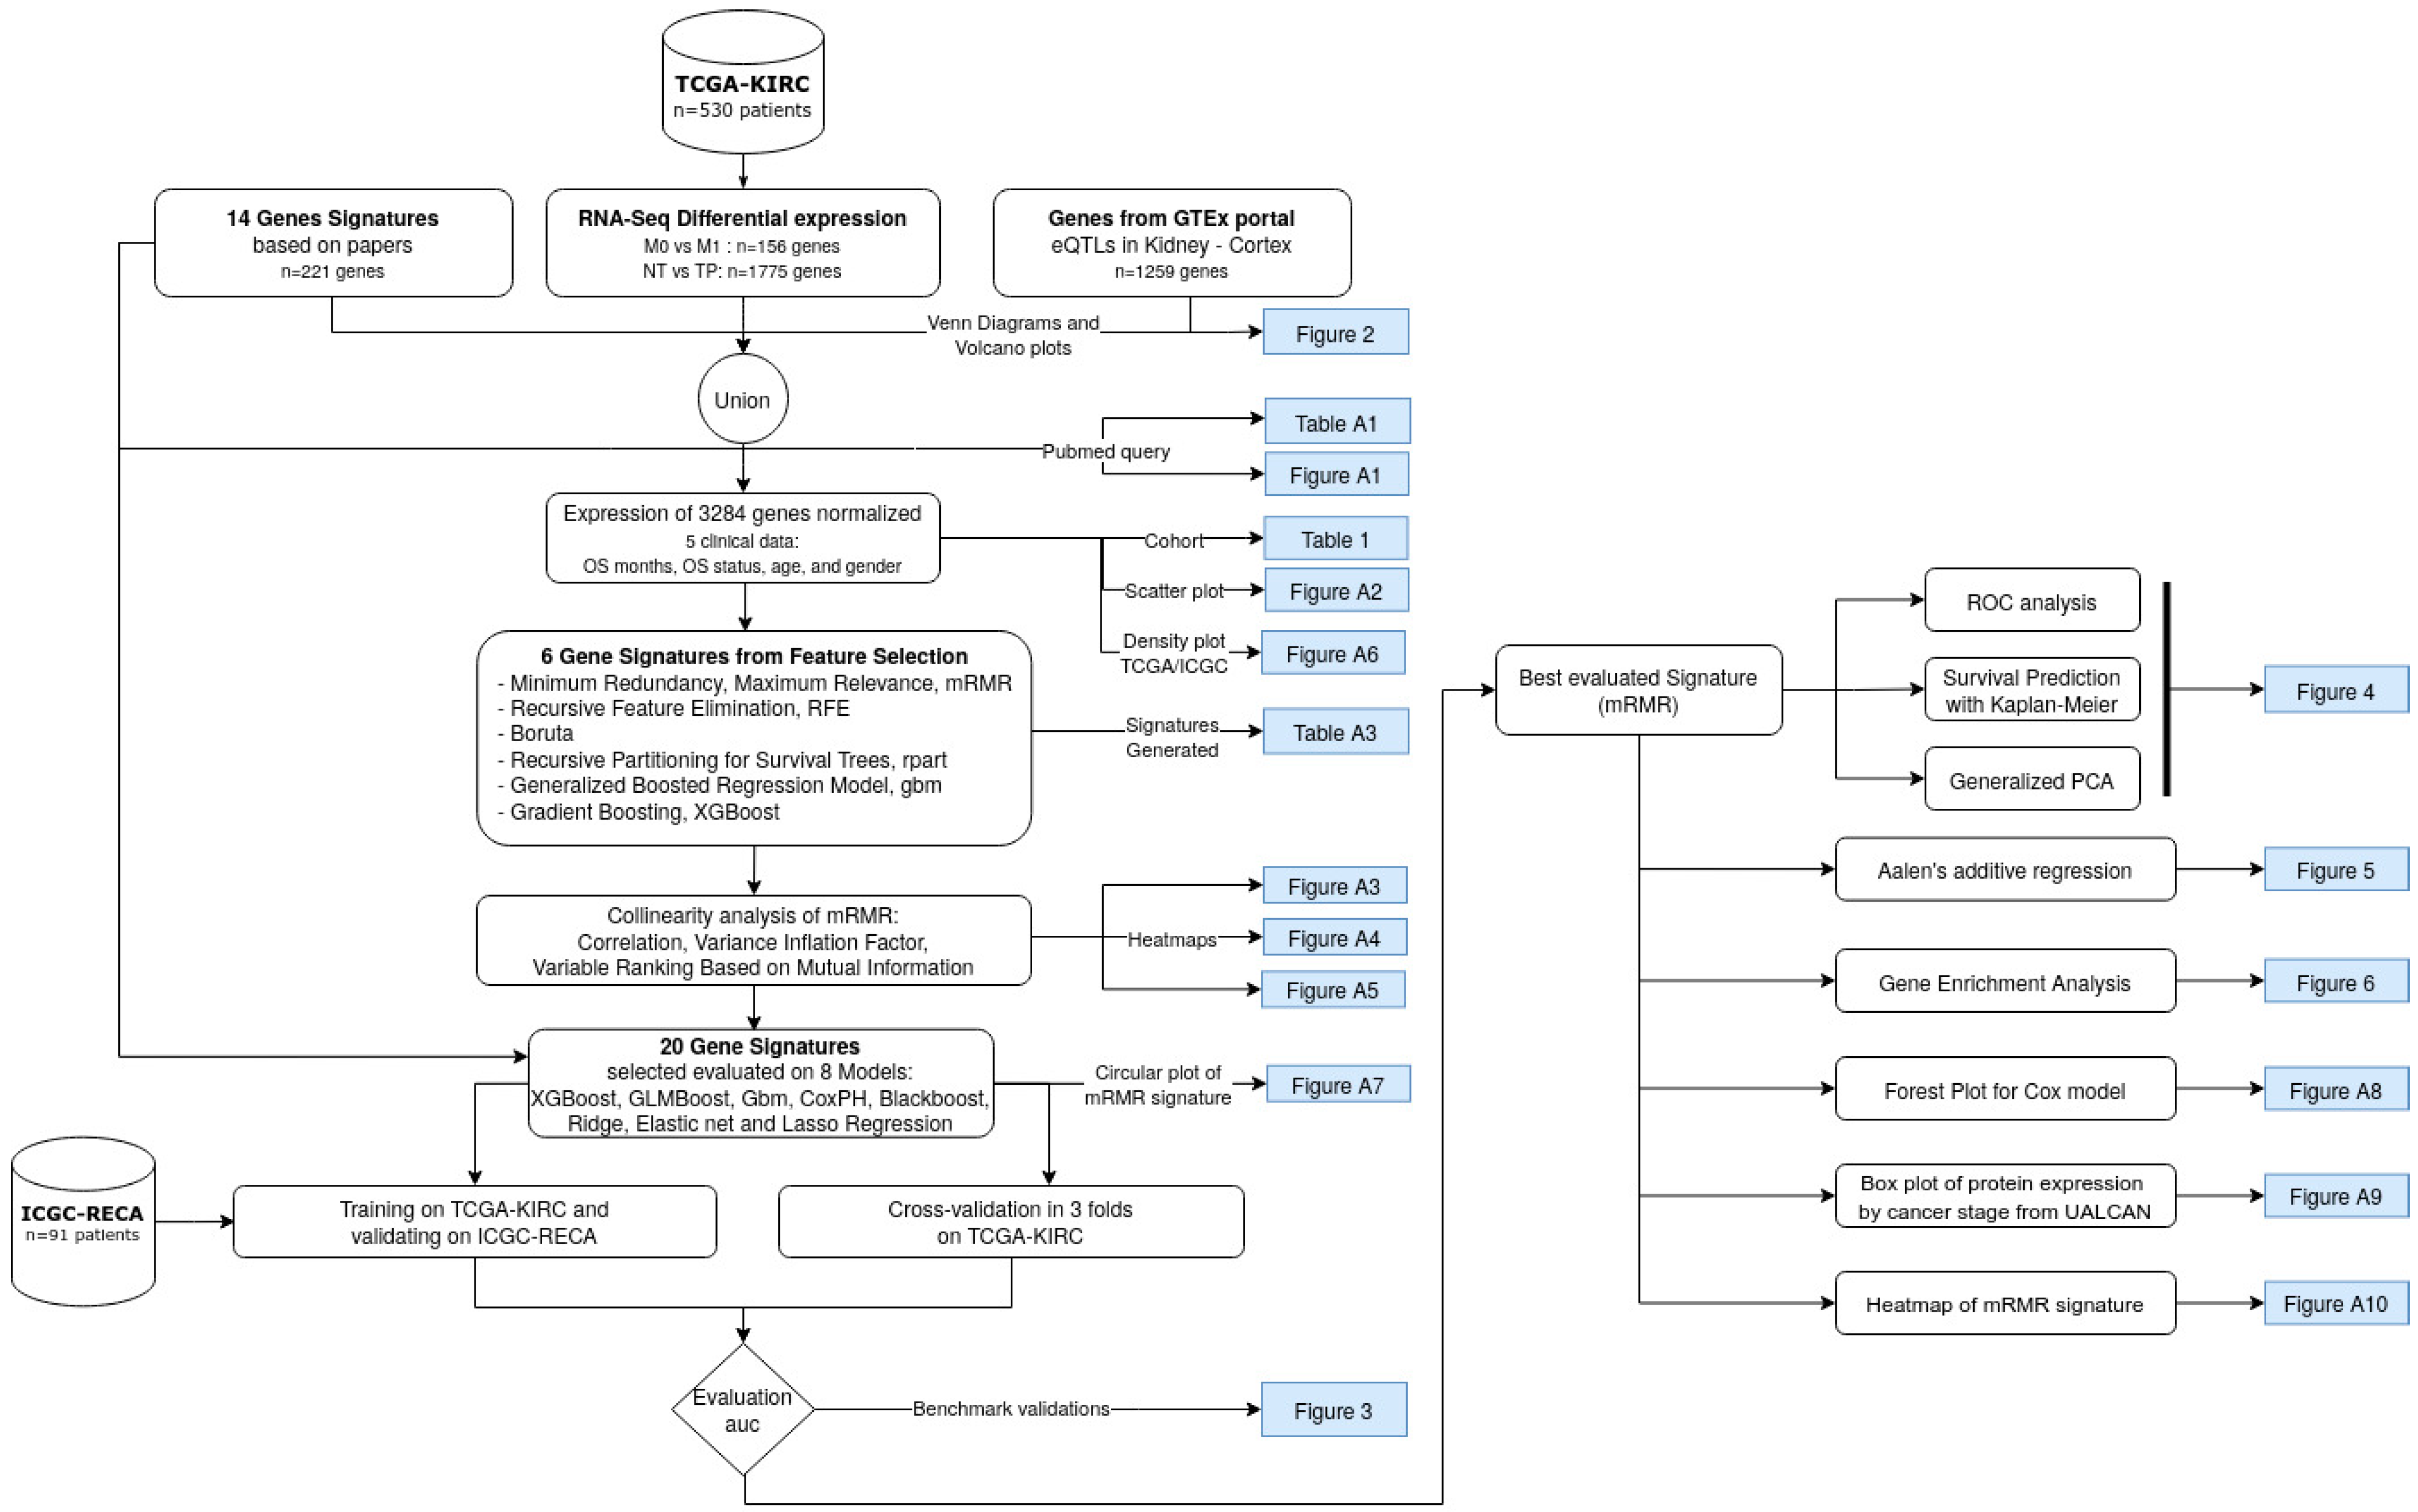
2. Materials and Methods

2.1. Literature Search Using PubMed

A literature search for gene signatures was conducted using PubMed to select studies from 2015 to 2020 (Figure A1), given that the search was carried out in January 2021, from this date, we performed the analyses and wrote the manuscript. The majority of papers were published in the last five years since 2020, therefore we excluded the period of 2008 to 2014. The PubMed query of terms comprised the following: (renal OR kidney) AND (clear cell) AND (cancer) AND (prognosis OR survival OR outcomes) AND (regression) AND (gene signature).
The search query resulted in 77 papers, and we adopted the following as inclusion criteria: original articles on human ccRCC about survival prognosis or tumor staging classification. The exclusion criteria consisted of the following: reviews, editorials, conferences, or abstracts; studies about other RCC subtypes, such as pRCC, ChRCC, or Sarcomatoid renal cell carcinoma; and studies that evaluated genes based on their corresponding patient prognoses depending on chosen treatment, on biomarkers predicting treatment resistance, or on tolerance to renal allograft. Ultimately, we adopted 14 gene signatures with a total of 221 unique genes (Table A1).

2.2. Data

From a bottom-up perspective, this work is data-driven by the gene expression and survival data of the larger public dataset of ccRCC (n = 530), The Cancer Genome Atlas Consortium of Kidney Renal Clear Cell Carcinoma (TCGA-KIRC) [21,22]. For external data validation, in order to corroborate the findings within our novel gene signature, we used the dataset of ccRCC samples (n = 91) from the International Cancer Genome Consortium (ICGC-RECA) [23,24].

2.3. Data Pre-Processing

Data pre-processing was undertaken to select the genes from both TCGA-KIRC (n = 60,489) and ICGC-RECA (n = 49,221) cohorts to obtain a consensus nomenclature for the genes in the signatures, and to map the latter with the HGNC Symbol and the Ensembl identifiers. The reference genomes used for the TCGA-KIRC and ICGC-RECA databases are the GRCh38 and the GRCh37 genomes, respectively. Despite this distinction, both reference genome versions are highly concordant [25].
For both datasets, we used unprocessed raw count data, and to reduce the batch-effect of datasets, we evaluated the following normalization methods: (1) scaling to the range interval between zero and one; (2) variance stabilizing transformation with DESeq2 [26]; and (3) Box-Cox normalization with Caret R package [27] (v. 6.0–90). The chosen method was Box-Cox transformation, with the higher correlation R = 0.97 between the median of each gene expression of datasets (Figure A2).

2.4. Feature Selection with Bioinformatics Analyses and Machine Learning

From a top-down perspective, in order to guide our feature selection, we performed two differential expression analyses of RNA-Seq with DESeq2 [26]. The first analysis was to compare solid normal tissue (NT) samples (n = 71) versus primary solid tumor (TP) samples (n = 530) using the absolute log2 fold-change (LFC) >3 and p-value adjusted (FDR) <0.01, from which we obtained 1775 genes that were under- and over-expressed. The LFC of each gene expression is the ratio of the mean normalized by log2 in the two groups of samples. The second analysis was to compare the non-metastatic (M0) samples (n = 422) against metastatic (M1) samples (n = 78); then using absolute LFC over 2 and p-value adjusted (FDR) <0.01, we obtained 156 altered genes.
To optimize the right candidates to their ideal biomarker genes, we also included 221 genes from the literature, and selected 1259 tissue-specific genes of Kidney Cortex tissue with significant expression quantitative trait locus (eQTL) obtained from the Genotype-Tissue Expression (GTEx) Project [28,29]. The feature selection methods and supervised Cox regression models were then trained by gene expressions of 3284 pre-selected genes, the overall survival (OS) days since the diagnosis, and the OS status (deceased or living) of TCGA-KIRC patients.
Inspired by the methodology of [30], we produced the new gene signatures using 6 feature selection methods divided into two main categories:
  • Filtering methods of feature importance: Extreme Gradient Boosting (XGBoost), Generalized Boosted Regression Model (GBM), and Recursive Partitioning for Survival Trees (Rpart).
  • Wrapper methods: Minimum Redundancy Maximum Relevance (mRMR); Recursive Feature Elimination (RFE); and Boruta.
For the filtering methods, we selected the 30 most important genes for patient survival. We chose the number of 30 genes based on this being the average number of genes in signatures referenced in the literature. The wrapper methods selected the most important genes based on the best performing metrics of models without predefining the number of genes on signatures. The new gene signatures generated by each feature selection are presented in Table A2.
We evaluated the signatures using Machine Learning analyses of eight linear survival models with optimized auto-tuning hyper-parameters: Extreme Gradient Boosting (XGBoost), Cox Model with gradient boosting (GLMBoost), Generalized Boosted Regression Model (GBM), Cox Proportional Hazards Regression Model (CoxPH), Gradient Boosting with Regression Trees (Blackboost), and the three models Penalized Cox Regression (glmnet) [31]–LASSO, ElasticNet and Ridge regression. Each model calculates the fitted coefficient for each gene.
The mRMR method applies mutual information to select features that maximize the statistical dependency on the joint distribution of the target variable of supervised learning [20,32]. The maximum relevance for the feature set S, given the mutual information of gene gi in k-classes, is:
m a x D ( S , k ) , D = 1 | S | g i S I ( g i , k )
The minimum redundancy in the feature subset condition is given by the sample vectors of all genes gi, gj:
m i n R ( S , k ) , D = 1 | S 2 | g i , g j S I ( g i , k )
This work uses the implementation of the R package mRMRe [33] (v. 2.1.2) available in CRAN on expression data. The target features consisted of the overall survival days and overall survival status. We set an ensemble of 5 executions filtering 20 genes per run, resulting in a set of 64 unique genes as relevant features. Finally, we performed a forward search feature selection with variable ranking based on mutual information difference of the most representative genes with respect to AJCC Staging, resulting in a 13-gene signature (Figure A3).
The framework of Tidyverse in R (v. 4.1.1) was used for pre-processing, and the framework mlr3 (Machine Learning in R) [34] carried out the evaluation of the metrics of feature selection and model benchmark. All of the code for the experiments was written in R. For the multicollinearity analysis, we built the visualization with corrplot [35] (v. 0.92), and we assessed the degree of collinearity among independent variables. None of the genes had Variance Inflation Factors > 5 (Figure A4). Additionally, no correlations greater than or equal to 0.7 were found between the genes (Figure A5). For the Variable Ranking Based on Mutual Information Difference, we used the R package varrank [36] (v. 0.4).

2.5. Model Evaluation and Statistical Analysis

The concordance C-index is a commonly used metric, but is not a proper strategy to predict the t-year risk of an event [37]. Therefore, to evaluate the performance of each survival model, we applied the measure of the area under the time-dependent ROC curve (AUC Uno) [38]. For internal validation, we used AUC Uno of 10 years on 3-fold cross-validation of TCGA-KIRC in 100 repetitions. For external validation, we used AUC Uno of 7-years by training with TCGA-KIRC and predicting the ICGC-RECA dataset using 100 repetitions through censored regression models. We restrict the 10-year prediction for TCGA-KIRC to exclude outliers in the long tail of the density plot of the patient’s overall survival. For the ICGC-RECA dataset, we decided to maintain a 7-year prediction in order to include all samples, and limit the time prediction to the range of distribution of this dataset for external validation (Figure A6). The sensitivity (SE) and the specificity (SP) describe the distinguishing risk of patients to be deceased by time t from those who will be alive, with values ranging from 0 to 1, where 1 corresponds to the best model performance, and 0.5 represents a random prediction. The evaluation was performed with the R package survAUC [39] (v. 1.0–5).
The Kaplan–Meier analysis is the main visualization graph used to distinguish between high-risk, moderate, and low-risk patients. The p-value was calculated by the log-rank test using the survminer [40] (v. 0.4.9) R package and by comparing the predicted survival distributions of groups′ high, moderate, and low risk.
The enrichment analysis was performed using the 13-gene signature on the curated database of DisGeNET [41] (v7.0) with gene-disease associations (GDAs) filtering by FDR (<0.05).
The flowchart was created using diagrams.net. The figures were implemented in R 4.1.1 using the following packages: VennDiagram [42] (v. 1.7.1); the ggplot2 (v. 3.3.5) for Volcano plots, Heatmap and Boxplots; GOplot [43] (v. 1.0.2) for the circular visualization of mRMR genes and sets of genes; FactoMineR [44] (v. 2.4) and factoextra [45] (v. 1.0.7) for the principal component analysis (PCA); survival [46] (v. 3.2–11) and ggstatsplot [43] (v. 0.9.0) for the Aalen′s additive cox regression; clusterProfiler [47] (v. 4.2.1) and disgenet2r [41] (v. 0.99) for the enrichment analysis with a Heatmap-like functional classification; survminer [40] (v. 0.4.9) and finalfit [48] (v. 1.0.4) for the survival curves and the Forest plot for Cox proportional hazards model; and pheatmap [49] (v. 1.0.12) for the Heatmap with Hierarchical clustering of RNA-seq expression and clinical annotation with dendrograms.

3. Results

3.1. Clinical Characteristics of the ccRCC Cohorts

To produce our gene signature, we used the TCGA-KIRC (n = 530) and ICGC-RECA (n = 91) samples of RNASeq data of ccRCC. The characteristics of both cohorts for training and validation datasets are summarized in Table 1. The clinical characteristics with their respective p-value tests indicate that there is no significant distinction in the distributions between both datasets, except for Neoplasm.

3.2. mMRM Gene Selection

The mRMR executed a supervised gene selection of 3304 genes with four clinical features: overall survival (OS) days, OS status, age and sex. To identify the most representative genes of the signature related to Stage AJCC, we performed a forward search feature selection Variable Ranking Based on Mutual Information Difference, resulting in a 13-gene signature (AR, AL353637.1, DPP6, FOXJ1, GNB3, HHLA2, IL4, LIMCH1, LINC01732, OTX1, SAA1, SEMA3G, ZIC2–Figure A3) able to predict distinct outcomes (high, moderate, and low survival risk) of patients with ccRCC. To select the best independent predictors genes for survival risk, it is important to avoid multicollinearity; therefore, we assessed the degree of collinearity among independent variables. None of the genes had Variance Inflation Factors > 5 (Figure A4). Additionally, no correlations greater than 0.70 were found between the genes (Figure A5).
We visualized the composition of filtered genes with a Venn diagram (Figure 2a) with the intersection sizes of genes and the original sets of genes. In particular, most of the mRMR genes (n = 7) were obtained from the differential gene expression analysis (DEA) comparing normal tissues versus primary tumor samples (Figure 2b), with a larger number of upregulated genes, including the mRMR genes HHLA2, LINC01732, SAA1, AL353637.1, and ZIC2. The downregulated mRMR genes for normal versus tumor samples are DPP6 and FOXJ1. The DEA of comparing non-metastatic versus metastatic samples (Figure 2c) identified less differentiated genes (n = 2), with the upregulated genes OTX1 and ZIC2. The genes selected with mRMR on TCGA-KIRC samples are presented in Figure A7 with a circular visualization of the relationship between genes and their original sets of DEA, genes from GTEx portal of expression quantitative trait loci (eQTLs) in Kidney Cortex, and gene signatures from the literature.

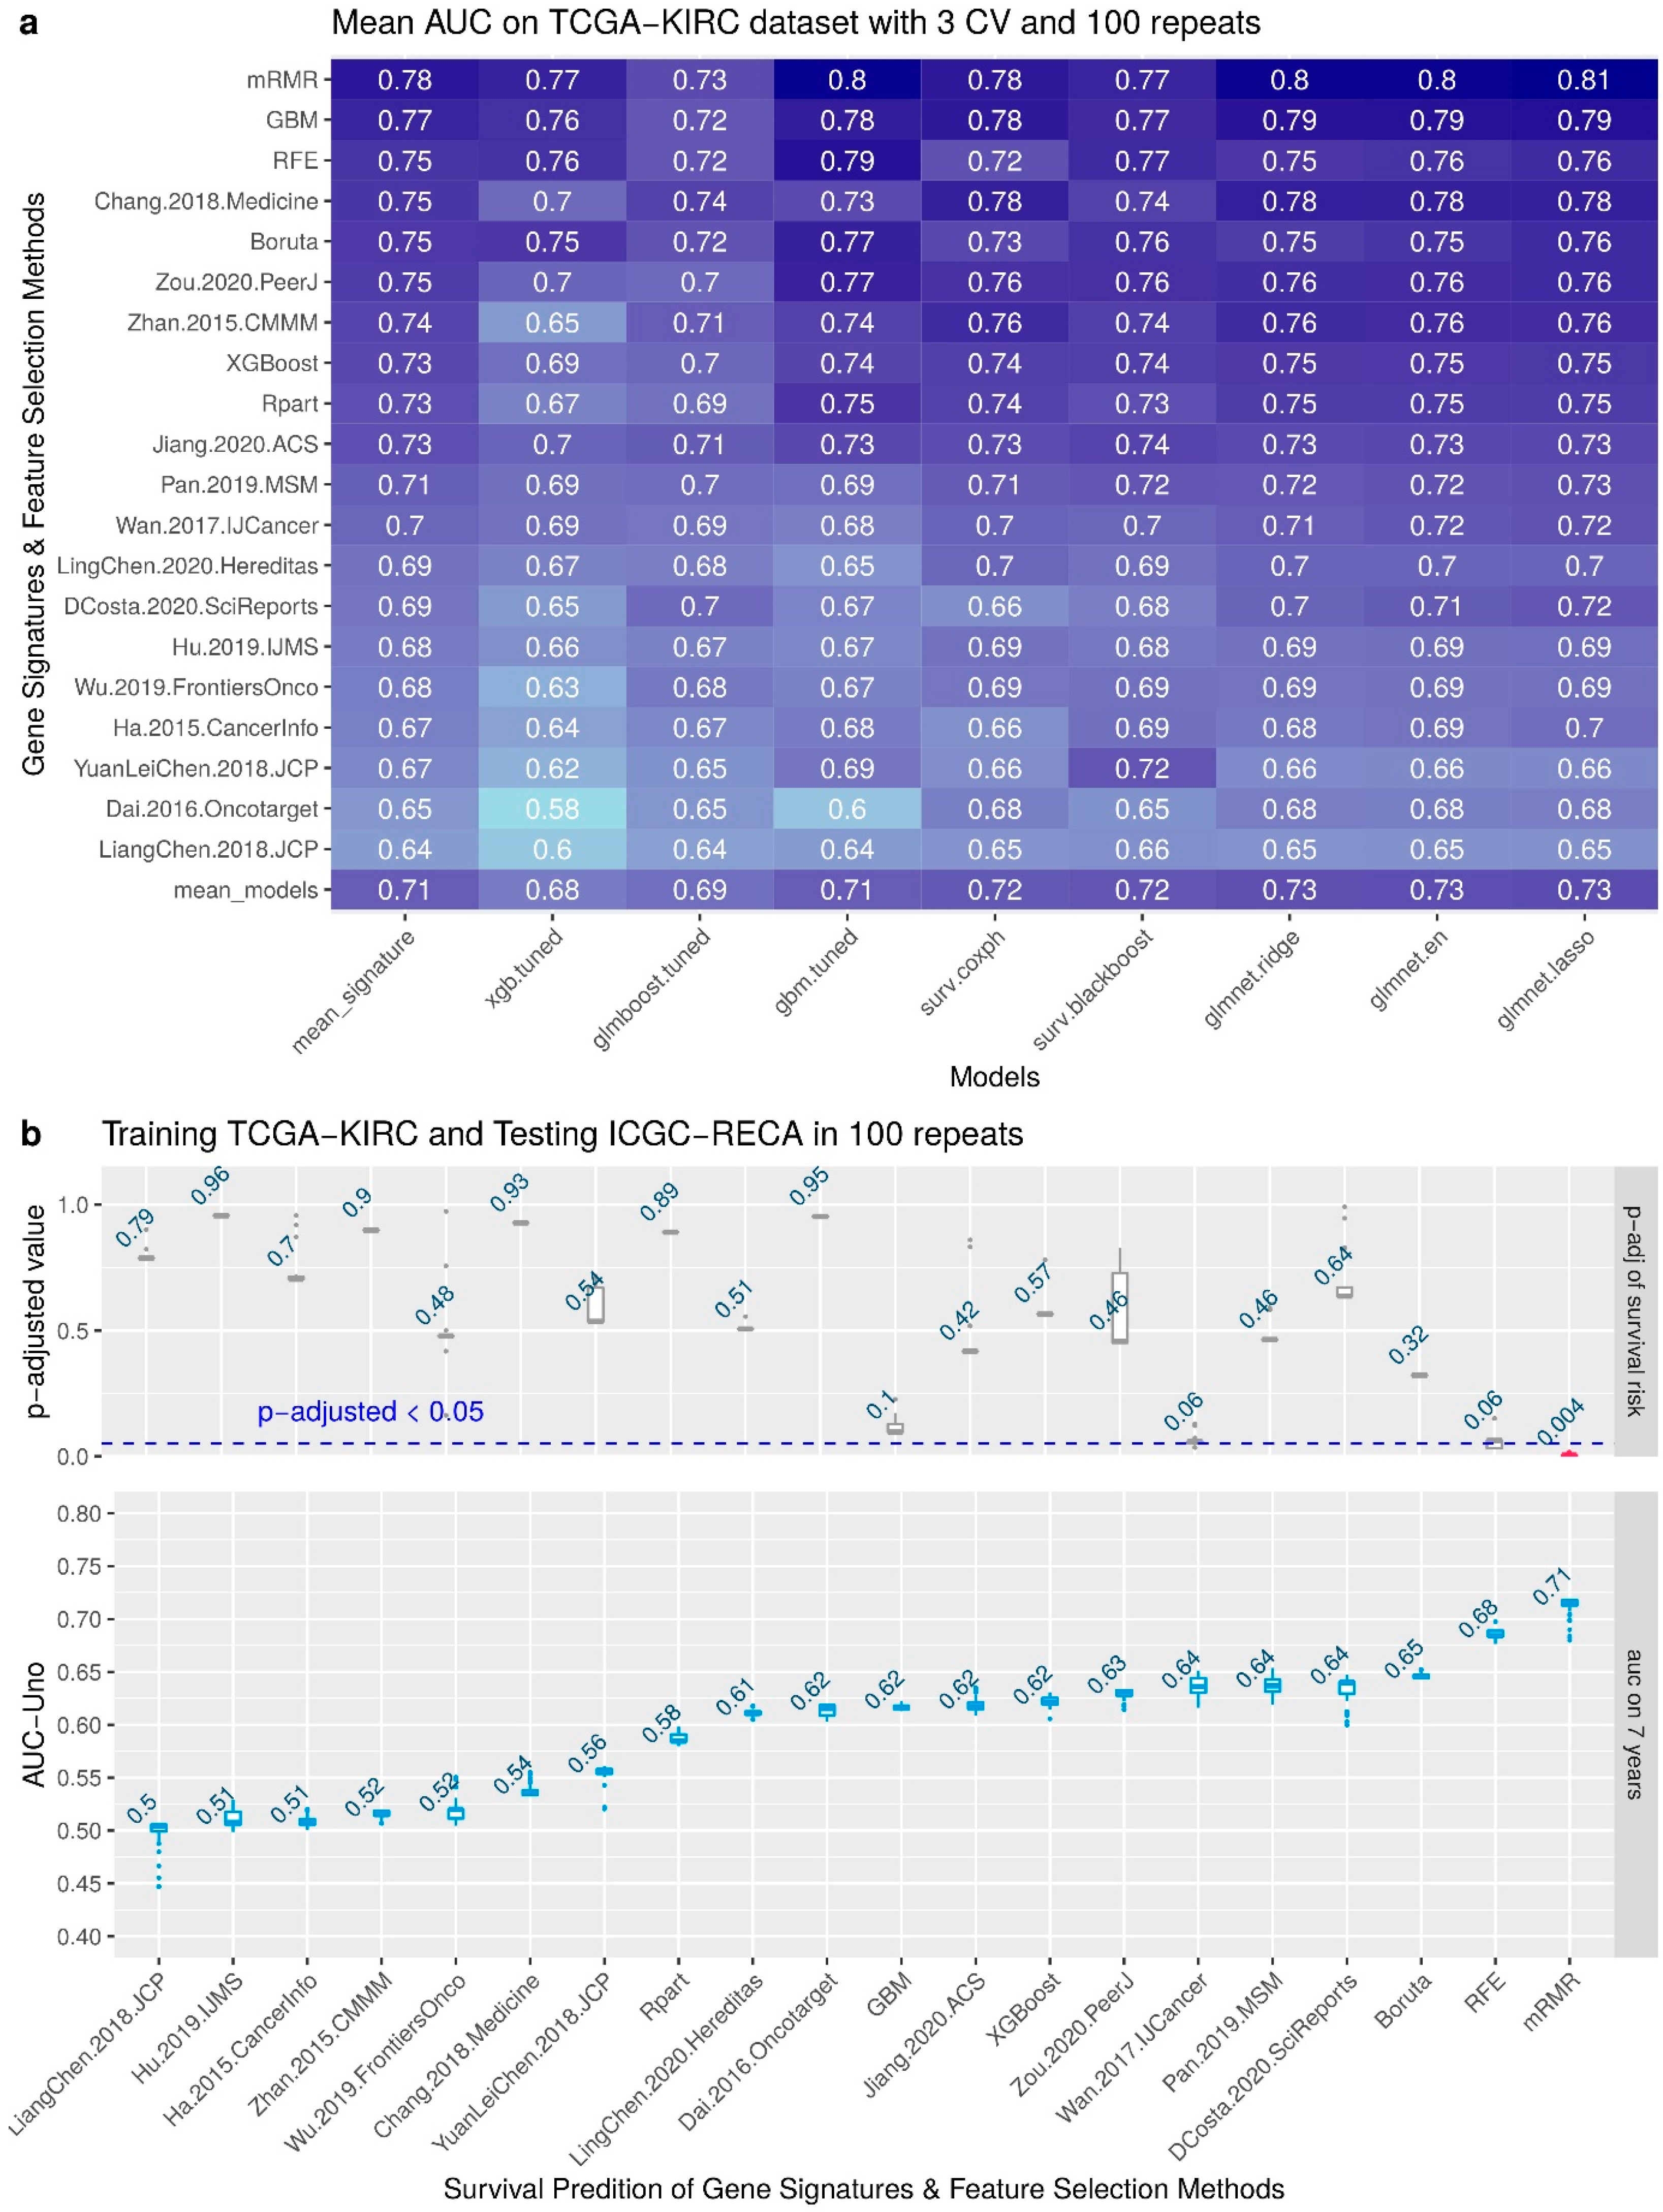
3.3. Performance of the Feature Selection Models for Internal and External Validations

To compare our mRMR signature with six feature selection methods (Recursive Feature Elimination, Boruta, Rpart, GBM and XGBoost for Survival) and 14 signatures published, we performed a benchmark using eight survival models of cox survival regressions (XGBoost, GLMBoost, Gbm, CoxPH, Blackboost, Ridge, Elastic Net, and Lasso). The benchmark results are shown in Figure 3a with the performance of 100 repetitions of predictions with Area Under the Curve (AUC) Receiving Operator Characteristics (ROC) Uno evaluating the 20 gene signatures using 3-fold cross-validation of TCGA-KIRC dataset. We can observe that the model Lasso-Cox regression of glmnet had the best mean AUC, 0.81, in internal validation for mRMR. The minimal set of genes with best performance to predict TCGA-KIRC as internal validation is: AL353637.1, DPP6, FOXJ1, GNB3, HHLA2, IL4, LIMCH1, OTX1, SAA1, and ZIC2.
Figure 3b shows the boxplot of the results of external validation in 100 random repeats. The upper plot also displays the mean of the adjusted p-value of the log-rank test of survival risk. Please note that the only signature that has a significant adjusted p-value (p < 0.05) is the mRMR. The lower plot displays the AUC metric of each survival prediction, and the number displayed on boxplots is the average value of all repeats. Please note that the best mean of AUC is 0.71 for the mRMR signature. The minimal set of genes for training with samples of TCGA-KIRC and predicting the survival risk of samples of ICGC-RECA is AR, AL353637.1, FOXJ1, HHLA2, SEMA3G, and LINC01732.
In Figure 4, we display the Kaplan–Meier curves and a principal component analysis (PCA) of two random predictions of internal and external validations.
For internal validation of the mRMR gene signature, we performed 3-fold cross-validation with AUC assessed on TCGA-KIRC with time-dependent intervals of seven years. Figure 4a shows a prediction of a random 33% sampling from TCGA-KIRC after training the regression model with 66% of the samples. The Kaplan–Meier curves (Figure 4a) are evaluated by the p-values of the log-rank test, indicating the separation between patients with high, moderate, and low risk. Figure 4a displays a PCA with the same predicted samples using only the expression of mRMR genes. Please note that only one patient was deceased in the low-risk group, and there is a visible separation between the low-risk and high-risk groups of patients on the x-axis of the PCA.
For external validation, we trained the model with the TCGA-KIRC dataset and predicted all the samples of ICGC-RECA. Analogously, in Figure 4c, a model trained with TCGA-KIRC data predicts ICGC-RECA samples in separated survival curves risks (p < 0.05) and AUC of 0.66. In Figure 4d, we performed a PCA with mRMR gene on the same previously predicted samples of ICGC-RECA, and the x-axis also separates the centroids of the risk clusters.

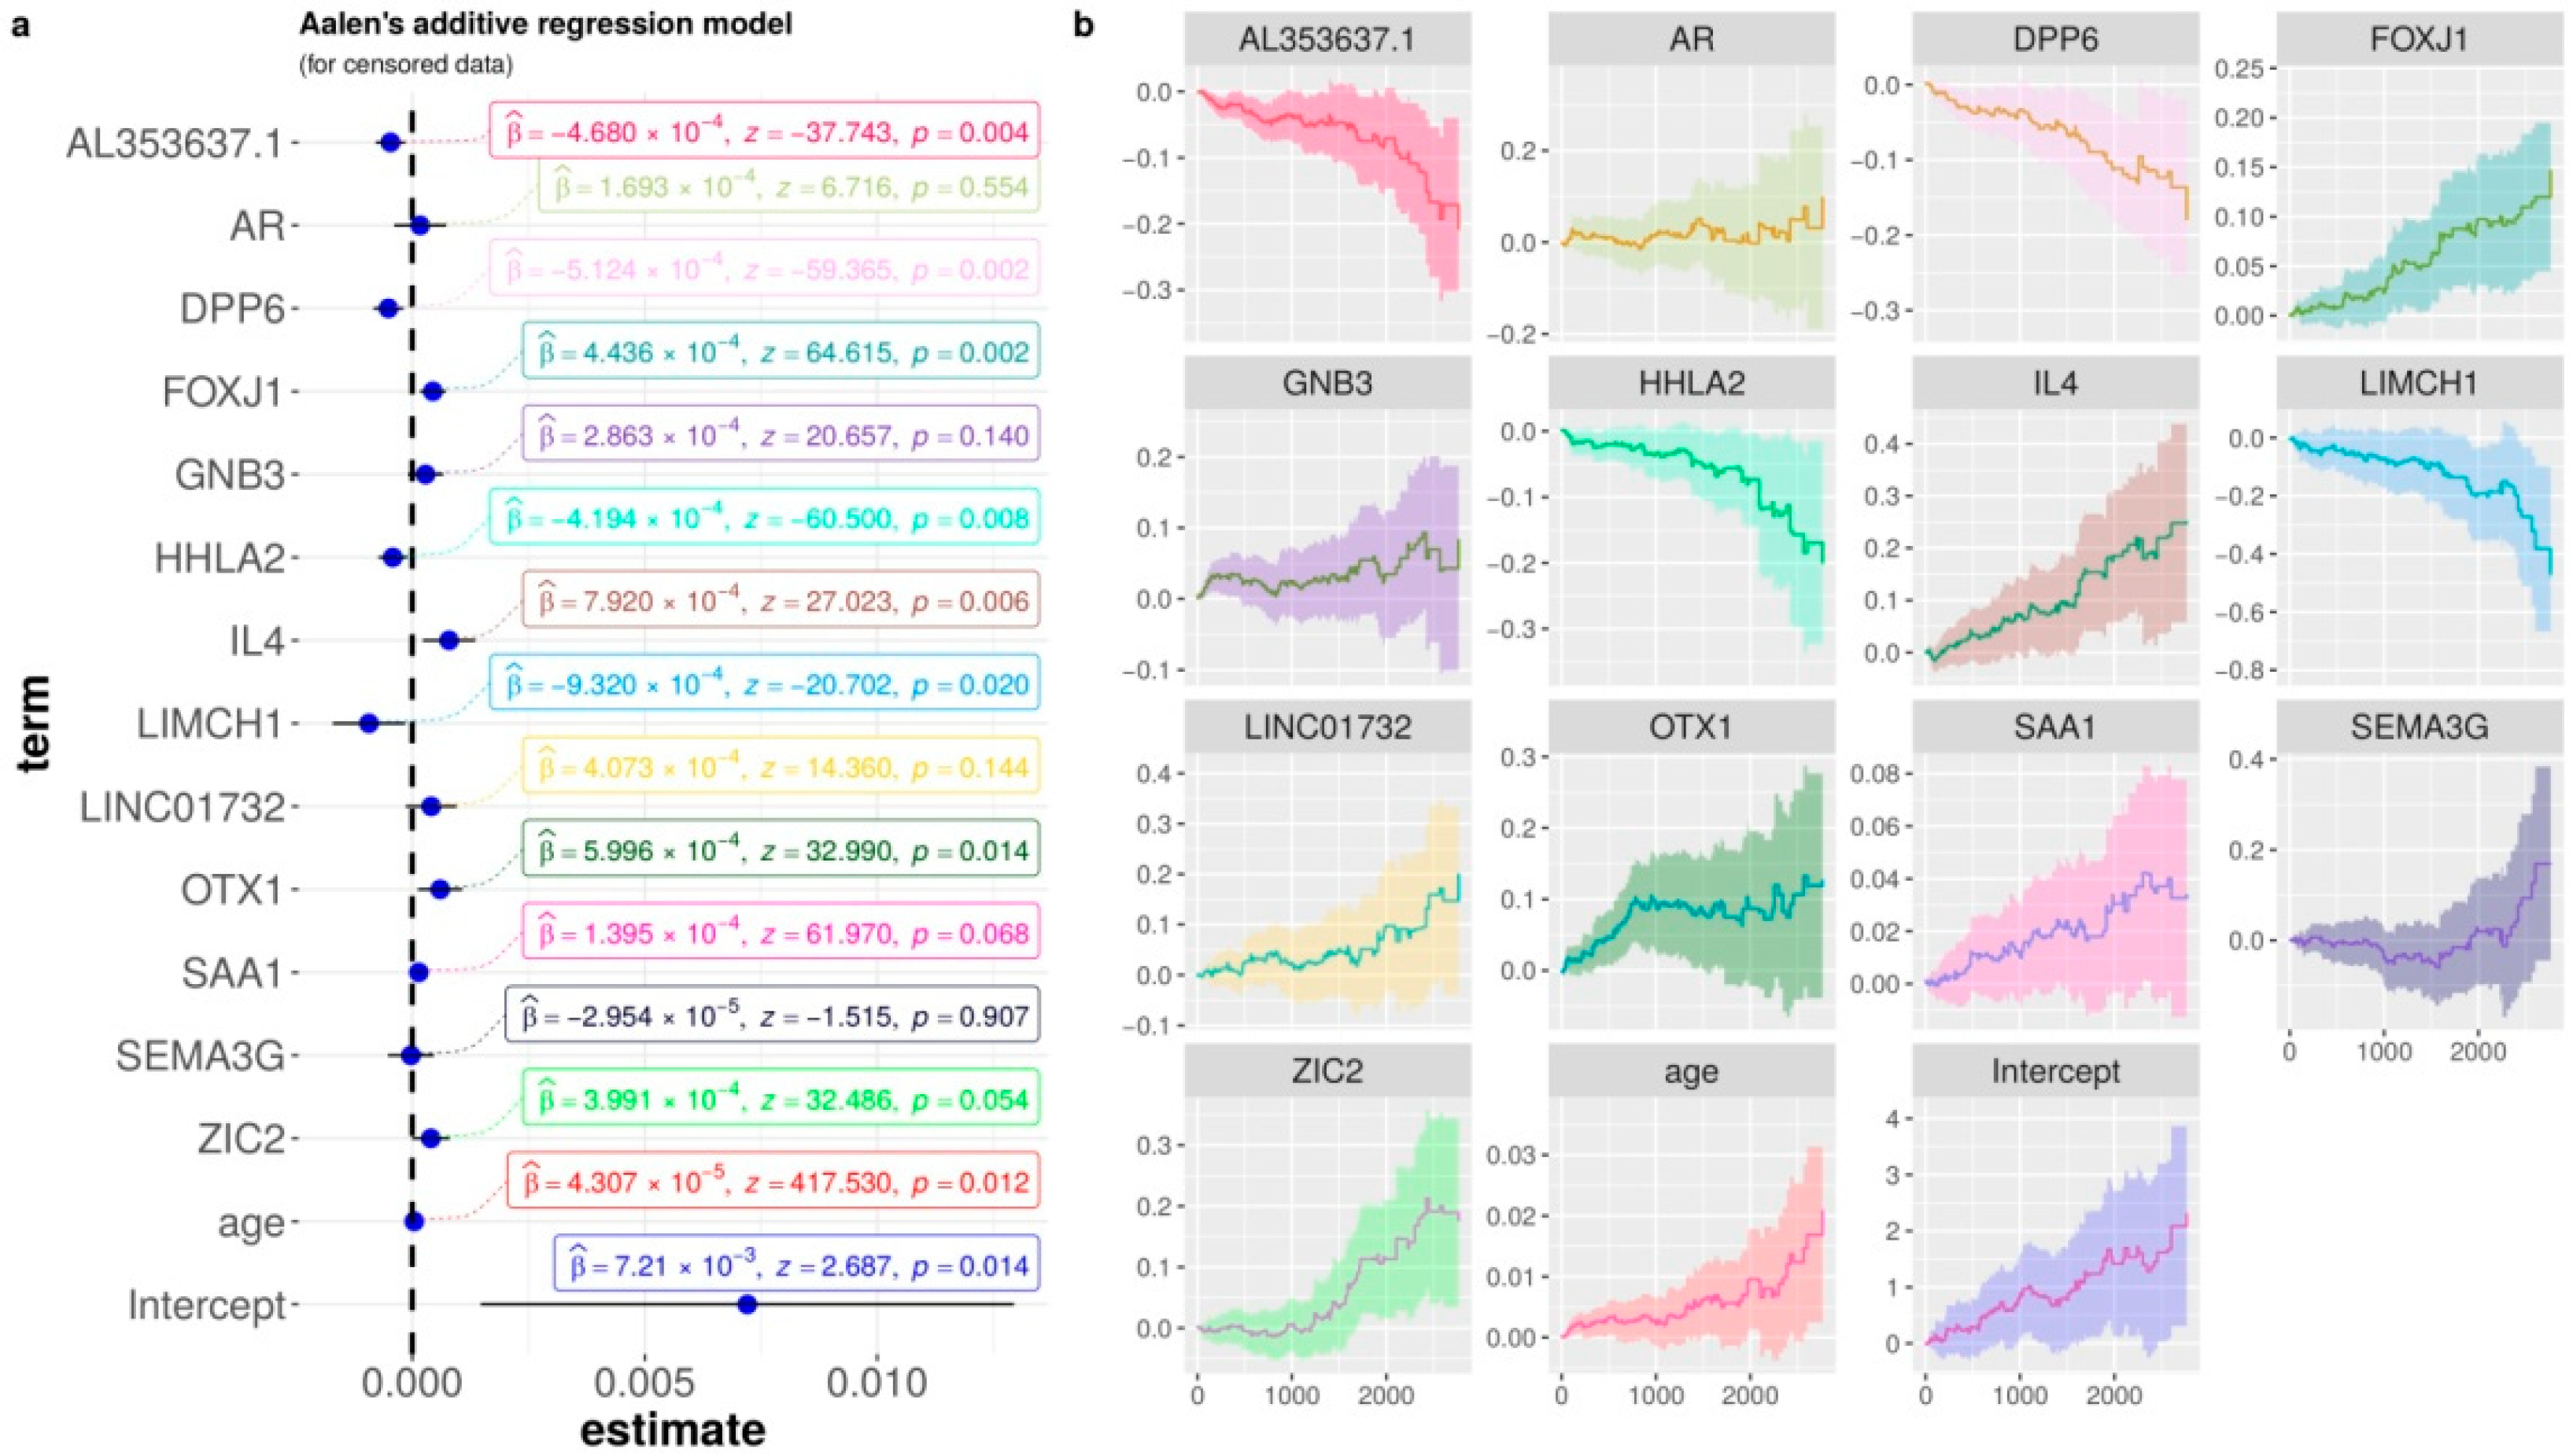
3.4. Biological Interpretation: Gene Contributions for Survival Risk and Enrichment Analysis

To shed light on the ability of each gene to predict ccRCC risk, we performed an additive regression, plotting the genes’ coefficients with time-varying and covariate effects. Similar to the forest plot of hazard ratio regression (Figure A8), Figure 5 shows the estimated coefficients of the increasing curves for the following significant high expression genes with a high risk of death: FOXJ1, OTX1, and IL4. On the other hand, the decreasing curves indicate that the high expression of the following genes is related to the low risk of death: AL353637.1, DPP6, HHLA2, and LIMCH1. A common classical representation of these covariate effects is the Hazard ratio in Figure 5 of the forest plot for the Cox proportional hazards model.
We confirmed the genes’ contributions to survival risk by checking protein expression according to cancer stage using the UALCAN dataset of ccRCC from Clinical Proteomic Tumor Analysis Consortium (CPTAC). As a result, the gene expression by overall survival is corroborated with the levels of protein expression and the cancer stage. In CPTAC-ccRCC, the protein expression of genes AR, GNB3, HHLA2, LIMCH1, and SAA1 had statistical significance in some comparisons of normal samples and cancer stage (Figure A9a–e) [50]. In particular, HHLA2 protein expression in samples of Stage 1 was higher than in stage 4, but normal tissue had a lower protein expression than any tumor stage (Figure A9c). This protein expression shift is compatible with our results in Figure 5 of the decreasing curve for HHLA2, and is in accordance with the TCGA-KIRC RNASeq data, since the higher expression of HHLA2 demonstrates a better prognosis (Figure A9c).
We verified patient survival curves by comparing the low/medium versus high expression of TCGA-KIRC data on UALCAN portal [51]. The above results correspond with the OS patients with low/medium versus high expression, available on the effect of expression level of patient survival. We noticed that patients with a poor prognosis had low expression of AR, DPP6, HHLA2, LIMCH1 and SEMA3G. Additionally, poor prognoses of patients can be identified with high expressions of FOXJ1, GNB3, OTX1, SAA1, and ZIC2.
Furthermore, in accordance with the above results, performing a Heatmap with hierarchical clustering combining RNA-Seq of patients from TCGA-KIRC and ICGC-RECA (Figure A10), we verified that the cluster of genes SAA1, OTX1, ZIC2, LINC01732, GNB3, and IL4, with high expression, is correlated with Stage T3 AJCC, metastasis, and poor prognoses. Likewise, the cluster of genes AL353637.1, AR, HHLA2, LIMCH1, SEMA3G, DPP6, and FOXJ1, with low expression, is correlated with poor prognoses.
To clarify the relationship between the genes and other kidney pathologies, we checked the statistical significance of multiple diseases associated with the enriched genes in the signature. Figure 6 shows a subset of 11 genes from within the signature, and most genes are related to Neoplasms, except for AL353637.1, LINC01732, and DPP6. Nevertheless, genes DPP6 and AR are enriched to clear-cell metastatic RCC diseases. We identified six genes enriched to kidney diseases and ccRCC (AR, DPP6, GNB3, IL4, SAA1, SEMA3G). Other enriched genes we found (AR, GNB3, HHLA2 and IL4) were related to transitional cell carcinoma of the bladder (also known as Urothelial carcinoma). GNB3 and IL4 are both enriched in kidney diseases, transitional cell carcinoma, and neoplasm metastasis. This enrichment analysis also confirms the results of benchmark and comparisons to the literature, indicating the importance of the selected mRMR genes in predicting ccRCC survival risk.

4. Discussion

From our 13-gene signature, a subset of eight genes had been reported previously in distinct signatures for ccRCC, including other recent signatures that were not compared in our benchmark: AR [19,51], SEMA3G [19,52,53], LIMCH1 [9], DPP6 [54,55], FOXJ1 [56,57], ZIC2 [11], IL4 [19,58,59,60], and OTX1 [12]. The concordance of this work with published signatures strengthens the validity of our methodology to obtain a ccRCC survival signature.
FOXJ1, IL4, HHLA2, and SEMA3G are immune-related genes [19,52,53], corroborating the high immunogenicity of ccRCC. Forkhead Box J1 (FOXJ1) is a transcription factor, and a member of the FOX family, involved in ciliogenesis. Its defective expression is associated with some inflammatory [61] and autoimmune [62,63] diseases. FOXJ1 has previously been identified as a prognostic marker of RCC, where its expression was reported to be upregulated [57]. Moreover, it has been reported to be upregulated in bladder cancer [64], hepatocellular carcinoma [65] and colorectal cancer [66]. Conversely, its low expression has been reported to be correlated with gastric cancer [67], ependymoma and choroid plexus tumors [68]. AL353637.1 is a pseudogene nearby the gene FOXB2, also belongs to the FOX family of FOXJ1 [56], and contains a variant (rs115747230) associated with chronic kidney disease [69]. Interleukin 4 (IL4) is a cytokine that induces differentiation of T cells and is present in the tumor environment of many cancers. The expression of IL4 in the tumor microenvironment can improve tumor growth and the blockade of IL4 can delay the growth [70] and can also improve immunotherapies (in mice models) such as CpG ODN or anti-OX40 AB [71]. Polymorphisms of the IL4 gene have been associated with many cancers [72]. HERV-H LTR-Associating 2 (HHLA2, also known as B7-H7) is a member of the B7-family of immune checkpoint molecules, known to perform an inhibitory activity in human CD4+ and CD8+ T cells by binding to their receptors [73,74]. It is known to have limited expression in normal tissues and to be highly expressed in cervical adenocarcinoma [75], pancreatic and ampullary cancers [76], also widely expressed in different subtypes of human lung cancer [73,77]. The 5-year survival rate of patients with gastric cancer was significantly higher in patients with HHLA2 highly expressed [78]. In particular, the overexpression of HHLA2 in patients after surgery was identified to promote ccRCC progression when compared to normal adjacent tissue [79], which corresponds with our results regarding HHLA2 expression. The knockdown of HHLA2 decreased the expression of genes related to the cell cycle, as well as the ability of the cells to migrate and invade [79]. SEMA3G belongs to the family of class-3 semaphorins, and studies indicate that this gene is linked to kidney diseases [80,81], suggesting important roles with neuropilin and plexin families in the etiology of cancer [82], and it is also an inhibitor of glioma progression by competing with VEGF for receptor NRP1 [83]. In single-cell RNA-seq study of kidney with transplant biopsy, SEMA3G activates an angiogenic program [84]. Patients with high expression of SEMA3G and AR have better prognoses according to the survival analysis of UALCAN RNASeq data [51]. The presence of immune-related genes in our signature strengthens the approach of focusing on the genes from the immune system to build a prognostic signature [19,85]. Our findings reinforce that HHLA2 is an important immune-related biomarker of ccRCC.
The genes AR, OTX1, and ZIC2 are transcription factors. In particular, Androgen Receptor (AR) is a transcription factor whose activity is highly critical to prostate cancer evolution [86]. The expression of AR-V7, its isoform, which is encoded by splice variant 7 in circulating tumor cells of prostate cancer, was reported to be associated with drug resistance [87]. AR interacts with VHL to modulate the metastasis of ccRCC [88], and AR inhibition can attenuate RCC progression [89]. The epigenetic control of AR co-regulates lysine-specific histone demethylase 1 (LSD1) in kidney cancer development, and the LSD1 inhibitor can reduce growth of kidney cancer cells [90]. Additionally, AR could suppress ccRCC cell progression by increasing the expression of circRNA circHIAT1 [91]. In addition, in vitro research and in vivo mouse model studies indicate that AR mediates lncRNA-TANAR signals that might play a crucial role in ccRCC progression and metastasis [92]. The studies above indicate that AR might be a promising drug target for treatment of ccRCC. OTX1 is a protein-coding gene of the bicoid sub-family of homeodomain-containing transcription factors, involved in differentiation of young neurons of the deeper cortical layers, and in proliferative zones of the neocortex [93]. OTX1 is related to breast cancer, medulloblastomas, colorectal cancer, hepatocellular carcinoma and bladder cancer [12]. The zinc finger of the cerebellum 2 (ZIC2) is a transcription factor with an important role in neural development and mutations of ZIC2, which could lead to brain malformations [94,95]. ZIC2 is an oncogenic with overexpression correlated with progression of epithelial ovarian tumors [96]. In breast cancer, low expression of ZIC2 has been correlated with poor outcomes and acts as a tumor suppressor by regulating STAT3 [97]. ZIC2 also upregulates gene RUNX2 and promotes ccRCC progression through inhibition of tumor suppressor NOLC1 [98].
Lim and Calponin Homology Domains 1 (LIMCH1) is an actin-stress-fiber-associated protein, a gene encoding zinc-binding protein, and is known to negatively regulate cell-spreading and migration [99]. It has been reported to be downregulated in malignant lung tissue [100] and upregulated in breast cancer [101]. LIMCH1 is upregulated with a strong association to poor prognoses, representing a potential biomarker for cervical cancer treatment [102]. According to survival analysis of the Human Protein Atlas [103], LIMCH1 is also a prognostic gene, whose high expression is associated with favorable outcomes in renal cancer [104].
Dipeptidyl Peptidase Like 6 (DPP6) is a type II membrane glycoprotein known to regulate potassium channels and is mainly expressed in the central nervous system [105]. The methylation of CG sites in the DPP6 promoter was reported to be in greater numbers in tumor samples compared to normal samples from pancreatic ductal carcinoma; thus, the hypermethylation of DPP6 promoter is associated with poor overall survival [106]. The hypermethylation of DPP6 was associated with high-grade tumor in ccRCC [55]. Additionally, high expression of DPP6 was reported to be correlated with good prognoses in patients with breast cancer [107].
Guanine Nucleotide Binding Protein Beta Polypeptide 3 (GNB3) is involved in various transmembrane signaling systems such as in GTPase activity. Some studies associate the polymorphism GNB3-C825T with cholangiocarcinoma [108] and thyroid carcinoma [109], but another study discarded a relationship with the risk for breast cancer [110].
Serum Amyloid A 1 (SAA1) is an acute-phase protein mainly produced by hepatocytes in response to infection, tissue injury and malignancy. SAA1 modulates neutrophil function in the context of cancer [111]. SAA1 gene expression in patients with RCC is associated with poor prognosis [112]. According to survival analysis of Human Protein Atlas [103], SAA1 is also a prognostic gene with high expression for unfavorable outcomes in renal cancer [113]. Moreover, multiple mutation variants of SAA1 have been identified in patients with RCC [114].
LINC01732 is affiliated with the long non-coding RNAs (lncRNAs) class. To the best of our knowledge, there are no publications regarding LINC01732 at this time. Nevertheless, increasing evidence suggests that lncRNAs play critical roles in tumor development of RCC [115]. Further research could be executed to understand other lncRNAs, including LINC01732.
Since alterations in expression of different genes from the same pathway have higher impacts on gene function, we performed an enrichment analysis and identified the pathways of urothelial carcinoma, chronic kidney disease, and transitional cell carcinoma, nephrolithiasis. Although the concurrence of RCC and urothelial carcinoma is clinically rare [116], previous studies reported the identification of clear cell tumors in general bladder carcinomas [117,118]. On nephrolithiasis, studies have whoen that kidney stones are associated with increased papillary RCC risk but not clear-cell RCC risk [119].
We compared our signature in a benchmark with fourteen other signatures already published in the literature. All of the gene signatures compared in this work use TCGA as their main training set to build their models. The studies reviewed have AUC-ROC between 0.568 to 0.884 with possible values ranging from 0 to 1, and the number of genes in each signature range from 3 to 66. Some studies use a different number of patients due to the distinct filtering approaches that the authors adopted, in addition to the updates of versions of TCGA-KIRC clinical data. The least absolute shrinkage and selection operator (Lasso-Cox) was the most-used model approach to build the signatures [9,10,13,17,18,19,120,121], but network-based models with protein–protein interaction (PPI), aside from being an elegant approach for retrieving information from data, can also be used for this purpose [122,123].
This work consists of a pure in silico and data-driven study, and other analyses could be corroborated in the future with in vitro or in vivo experiments [124]. In future works, we will expand the machine learning approach presented in this work to find potential cancer biomarkers using multiples levels of biological data available in TCGA by analyzing and integrating data of long non-coding RNAs (lncRNAs), methylation, single-nucleotide variants (SNV), and copy number variants (CNV).

5. Conclusions

Our main goal was to compare distinct gene signatures from the literature and generate new gene signatures using feature selection methods. We contributed by providing a list of new genes, some of them not previously reported as biomarkers for ccRCC. The gene signature created by the mRMR method achieved a score of 0.82 with AUC, being the best performer. We identified two clusters of genes with high expression (SAA1, OTX1, ZIC2, LINC01732, GNB3 and IL4) and low expression (AL353637.1, AR, HHLA2, LIMCH1, SEMA3G, DPP6, and FOXJ1) that were correlated with poor prognosis. We validated our 13-gene signature for ccRCC and confirmed our results with the literature, and by comparing each cancer stage of ccRCC with CPTAC and the survival effects of gene expression of individual genes in TCGA. We believe that further studies on the involvement of these genes in renal carcinogenic processes could improve our understanding of cancer biology. After experimental validations, new possible applications in clinical practices can benefit from the biomarker found with machine learning and feature selection.

Author Contributions

Conceptualization, P.T., B.S. and A.D.D.N.; Data curation, P.T. and J.J.; Formal analysis, P.T. and D.S.A.; Funding acquisition, A.D.D.N.; Investigation, P.T.; Methodology, P.T. and J.J.; Project administration, A.D.D.N.; Resources, P.T.; Software, P.T.; Supervision, B.S. and D.S.A.d.A.; Validation, P.T., B.S. and D.S.A.d.A.; Visualization, P.T.; Writing—original draft, P.T. and D.S.A.; Writing—review & editing, D.S.A., B.S., D.S.A.d.A. and A.D.D.N. All authors have read and agreed to the published version of the manuscript.

Funding

Patrick Terrematte was funded by the Federal Rural University of Semi-arid. Dhiego Souto was funded by grants numbers 88887.161820/2017-0 and 88887.600071/2021-0 of Brazilian Funding agency CAPES-National Coordination of High Education Personnel Formation Programs. The article processing charge was funded by the Federal University of Rio Grande do Norte.

Institutional Review Board Statement

This study did not require ethical review and approval because it performed a secondary analysis of publicly available data.

Informed Consent Statement

Not applicable.

Data Availability Statement

Publicly available datasets were analyzed in this study. The results shown here are-based upon data generated by the TCGA Research Network [125]. The TCGA-KIRC (version 07-19-2019) [126] is available via UCSC Xena Browser [22,127], and the ICGC-RECA is available via ICGC Data Portal [23,24]. Code used for analyses and to produce the figures is publicly available at: https://github.com/terrematte/gene_signature (accessed on 1 March 2022).

Acknowledgments

The authors would like to thank Isa Goldberg, Tayná da Silva Fiúza, Iara Dantas de Souza and Raul Maia Falcão for their suggestions and critical reading of the draft manuscript. The authors also thank the Center for High Performance Computing (Núcleo de Processamento de Alto Desempenho - NPAD/UFRN) available at https://npad.ufrn.br (accessed on 1 March 2022) and the Multidisciplinary Bioinformatics Environment (BioME) at UFRN for providing computing resources for data processing.

Conflicts of Interest

The authors declare that they have no competing interests, and that the research was conducted in the absence of any commercial or financial relationships that could be construed as a potential conflict of interest. The funders had no role in study design, data collection and analysis, decision to publish, or preparation of the manuscript.

Abbreviations

AJCCAmerican Joint Committee on Cancer
TCGAThe Cancer Genome Atlas
ICGCInternational Cancer Genome Consortium
KIRCKidney Renal Clear Cell Carcinoma
RECARenal Cell Cancer
ccRCCclear cell Renal cell carcinoma
mRMRMinimum Redundancy Maximum Relevance
AUCArea Under the Curve
ROCReceiving Operator Characteristics
PCAPrincipal Component Analysis
RFERecursive Feature Elimination
GBMGeneralized Boosted Regression Model
RpartRecursive Partitioning and Regression Trees
XGBoosteXtreme Gradient Boosting
CoxPHCox proportional hazards regression model

Appendix A

Table A1. Gene signatures of ccRCC after exclusion criteria. The PubMed query was conducted in January 2021 using the terms: (renal OR kidney) AND (clear cell) AND (cancer) AND (prognosis OR survival OR outcomes) AND (gene signature AND regression), and filtering the years of 2015 to 2020.
Title and Code in Figure 3Gene Signature
Prognostic gene signature identification using causal structure learning: applications in kidney cancer [122]
Code: Ha.2014.CaInfo
ETV5, CREB3L1, GMPS, RBM15, SEPT6, TTL, ARID1A, ERCC5, TFG, FLT3, SLC34A2, FAM46C, PER1, DDB2, NACA, MLLT10, HMGA1, TCF12, RUNX1, CANT1, REL, ZNF331, JAZF1, ASPSCR1, PLAG1, NOTCH1, TAL2, ERCC2, SMARCA4, DNMT3A, HOXA11, GNAS, CHEK2, HLF, GNAQ, ETV6, SET, KIF5B, TRRAP, CDKN2C, VHL, RPL22, CHN1, STAT3, CDK4, CD274, KTN1, CYLD, BRD3, TRIM33
A Five-Gene Signature Predicts Prognosis in Patients with Kidney Renal Clear Cell Carcinoma [8]
Code: Zhan.2015.CMMM
CKAP4, ISPD, MAN2A2, OTOF, SLC40A1
A four-gene signature predicts survival in clear-cell renal-cell carcinoma [120]
Code: Dai.2016.Oncotarget
PTEN, PIK3C2A, ITPA, BCL3
Identification and validation of an eight-gene expression signature for predicting high Fuhrman grade renal cell carcinoma [17]
Code: Wan.2017.IJCancer
ATOH8, ATP1A3, C10orf4, C17orf79, CHMP4C, CNGA1, EDA, FBXL3, GMDS, ISL2, KISS1, KLF2, MYADML2, NCRNA00116, OAZ1, ODZ3, PLA2G15, PPP1R1A, RAB40A, RRAS, SPOCK1, SQSTM1, TXNDC16, VAMP3
Comprehensive assessment gene signatures for clear cell renal cell carcinoma prognosis [9]
Code: Chang.2018.Medicine
INTS8, GTPBP2, ANK3, SLC16A12, LIMCH1, Hsa-mir-374a
A five-gene signature may predict sunitinib sensitivity and serve as prognostic biomarkers for renal cell carcinoma [123]
Code: YuanLeiChen.2018.JCP
BIRC5, CD44, MUC1, TF, CCL5
A Gene Signature of Survival Prediction for Kidney Renal Cell Carcinoma by Multi-Omic Data Analysis [18]
Code: Hu.2019.IJMS
BID, CCNF, DLX4, FAM72D, PYCR1, RUNX1, TRIP13
Prognostic value of a gene signature in clear cell renal cell carcinoma [10]
Code: LiangChen.2018.JCP
CENPW, FOXM1, NUF2
Identification of a 5-Gene Signature Predicting Progression and Prognosis of Clear Cell Renal Cell Carcinoma [12]
Code: Pan.2019.MSM
OTX1, FOXE1, FAM83A, HMGA2, KRT6A, DPYSL5, ANXA8, MATN4, ROS1, CSMD3, MAGEC3, AMER2, CPLX2, PI3, KRT13, ERVV-2, ERVFRDE1, ANKFN1, VTN, NFE4, ZNF114
Construction and Validation of a 9-Gene Signature for Predicting Prognosis in Stage III Clear Cell Renal Cell Carcinoma [13]
Code: Wu.2019.FrontiersOnco
ATP6V1C2, PCSK1N, PREX1, ANK3, HLA-DRA, SELENBP1, TYRP1, GABRA2, SERPINA5
Construction and validation of a seven-gene signature for predicting overall survival in patients with kidney renal clear cell carcinoma via an integrated bioinformatics analysis [11]
Code: Jiang.2020.ACS
PODXL, SLC16A12, ZIC2, ATP2B3, KRT75, C20orf141, CHGA
A 14 immune-related gene signature predicts clinical outcomes of kidney renal clear cell carcinoma [19]
Code: Zou.2020.PeerJ
TXLNA, SEMA3G, AR, BID, IL20RB, CCR10, BMP8A, SEMA3A, CCL7, GDF1, KLRC2, LHB, FGF17, IL4
A seven-gene signature model predicts overall survival in kidney renal clear cell carcinoma [2]
Code: LingChen.2020.Hereditas
APOLD1, C9orf66, G6PC, PPP1R1A, CNN1G, TIMP1, TUBB2B
Identification of gene signature for treatment response to guide precision oncology in clear-cell renal cell carcinoma [121]
Code: DCosta.2020.SciReports
ANGPT4, EDN1, VEGFA, ESM1, FLT1, KDR, CD34, PECAM1, NOTCH1, EDNRB, STIM2, FYN, VWF, GJA1, MCF2L, PPM1F, PTPRB, HEY1, ETS1, EXOC3L2, TBXA2R, TCF4, S1PR1, SLC9A3R2, NES, NFATC1, NOS3, PDE2A, CORO1A, CCR5, CXCR3, PTK2B, WAS, CD72, IL16, FYB1, FASLG, FERMT3, FOXP3, XCL2, CD3E, CD7, LAX1, CD38, LCP1, LCP2, ITK, LAT, LCK, GRK2, CCL4, CCL5, CD2, PRF1, TIGIT, GZMA, GZMB, CD8A, CTLA4, EOMES, PDCD1, PYHIN1, SLA2, LTA, PSMB8, PSMB9
Table A2. New gene signatures of ccRCC obtained by state-of-art machine learning for feature selection methods: Recursive Feature Elimination, Boruta, Rpart, GBM and XGBoost for Survival.
CodeMethodN. GenesGene Signature
GBMFiltering with Generalized Boosted Regression Models for Cox Proportional Hazard30AC084117.1, CRHBP, LINC00973, ITPKA, IGFN1, C14orf37, OTX1, LINC02446, HOTTIP, NEIL3, ZIC5, CCDC154, IL4, AC008663.1, FER1L4, DUSP5P1, AL078604.2, KRT6A, SPATC1L, RTL1, LINC01597, CRABP1, RASGRP3, C3orf85, AL034399.1, TRIM4, LINC00475, ADAMTS14, DPP6
RpartFiltering with Recursive partitioning for survival trees30TROAP, KIF18B, AURKB, LINC00973, AC003092.1, G6PC, ZNF181, MYBL2, FOXM1, NUF2, POU4F1, APOM, AR, NPHS1, AC018638.2, MERTK, AC098679.1, AL353637.1, IYD, C17orf80, SLC12A3, CDCA2, LINC02362, SRD5A3, EIF3F, AC138393.1, MCC, WFIKKN1, ALDOB, APOL5
XGBoostFiltering with
XGBoost for Survival Analysis
30LINC00973, LINC01271, CHAT, SPIC, AL355796.1, DLK1, ZIC5, LINC01700, ENTPD6, ATOH8, C14orf37, WNT7B, THEG, AC084117.1, ADA2, DCSTAMP, AL450311.2, A3GALT2, CNTNAP3B, TBC1D27, BIRC7, LINC00943, LINC01529, OR4C6, FAM47E, BCL3, AC105118.1, AL359736.1, SLC44A3, LINP1
BorutaWrapper Boruta with XGBoost for Survival Data43Age, ZIC2, CHAT, AMH, OTX1, BARX1, TROAP, CKAP4, ITPKA, NUF2, KRT75, KIF18B, SLC18A3, AL355796.1, RPL10P19, LINC02154, LINC00973, IL4, HOTAIRM1, Z84485.1, LINC02362, CASP9, CCNF, RTL1, BID, CHGA, RANBP3L, ZIC5, SLC16A12, SPATC1L, CD44, KRI1, RUFY4, AC073324.1, AC091812.1, AC156455.1, AGAP6, AC128685.1, SEMA3G, IGFN1, KLRC2, ANXA8, AURKB
RFEWrapper with Recursive Feature Elimination89A3GALT2, AC006450.2, AC073324.1, AC093520.1, AC103925.1, AC120498.6, AC128685.1, AC156455.1, ADAMTS14, AL355796.1, AL592494.1, AL606519.1, AMH, ANK3, ANXA8, AP000697.1, AP001029.1, AURKB, BARX1, BIRC5, C20orf141, CCNF, CDC42P2, CENPW, CHAT, CHGA, CKAP4, CRHBP, DLX4, DMRT3, DUSP5P1, G6PC, GOLGA6L2, GOLGA6L7P, HAMP, HAO1, HOTAIRM1, HP, IGFN1, IGHJ3P, IL20RB, IL4, ISL2, ITPKA, KIF18B, KLRC2, KRT75, KRT78, LINC00051, LINC00460, LINC00524, LINC00896, LINC00973, LINC01234, LINC01501, LINC01655, LINC01700, LINC01956, LINC02154, LINC02362, NEIL3, NFE4, NUF2, OTX1, PAEP, PGLYRP2, PI3, PITX1, PLG, PTPRB, RALYL, RPL10P19, RTL1, SAA1, SAA2, SAA4, SIM2, SLC16A12, SLC18A3, TGM3, TRIP13, TROAP, VSX1, WFDC10B, Z84485.1, ZIC2, ZIC5, ZPLD1
mRMREnsemble of Min-redundancy and Max-relevance with survival data65AR, AL353637.1, DPP6, FOXJ1, GNB3, HHLA2, IL4, LIMCH1,LINC01732, OTX1, SAA1, SEMA3G, ZIC2
Figure A1. Number of papers published on PubMed by year on query performed in January 2021. Initially, in green, the gene signatures published in the period of 2015 to 2020 were selected to be compared. After the exclusion criteria, we obtained the 14 gene signatures.
Cancers 14 02111 g0a1
Figure A2. Scatter plot of median of gene expression comparing TCGA-KIRC and ICGC-RECA gene expression. (a) Raw counts. (b) log2(count + 1) normalization. (c) Variance-stabilizing transformation with DESeq2. (d) Box-Cox transformation. (e) Scaling between zero and one (with Caret R package and ‘range’ method). (f) Scaling between zero and one (with BBmisc R package and ‘range’ method).
Cancers 14 02111 g0a2
Figure A3. Variable ranking based on mutual information of 10 most important genes of mRMR 13-gene signature of ccRCC. The most representative genes with respect to AJCC Staging of TCGA dataset.
Cancers 14 02111 g0a3
Figure A4. Collinearity analysis with variance inflation factors 13-gene signature of ccRCC. None of genes had variance inflation factors ≥ 5, indicating no collinearity or redundancy on the signature.
Cancers 14 02111 g0a4
Figure A5. Correlation analysis between genes of mRMR 13-gene signature of ccRCC. No strong correlation between genes ≥ 0.70 was found, including the clinical data of age, overall survival status and AJCC staging.
Cancers 14 02111 g0a5
Figure A6. Density plot of the distribution of overall patient survival in TCGA-KIRC and ICGC-RECA. The dotted line indicates the mean of distributions, and the solid lines indicate the time prediction used for internal and external validations. We restrict the 10-year prediction for TCGA-KIRC to exclude outliers in the long tail of the density plot of the patient’s overall survival. For the ICGC-RECA dataset, we decided to maintain a 7-year prediction in order to include all samples, and limit the time prediction to the range of distribution of this dataset for external validation.
Cancers 14 02111 g0a6
Figure A7. Circular diagram of mRMR gene signature and the source of genes DEA, genes from GTEx portal of expression quantitative trait loci (eQTLs) in Kidney Cortex, and gene signatures from the literature.
Cancers 14 02111 g0a7
Figure A8. Forest plot for Cox proportional hazards model displaying the significative genes (AL353637.1, DPP6, FOXJ1, HHLA2, and SAA1). The statistical significance between comparisons is given by * p-value < 0.05, ** p-value < 0.01, and *** p-value < 0.001.
Cancers 14 02111 g0a8
Figure A9. Analysis performed using UALCAN portal with data of ccRCC from Clinical Proteomic Tumor Analysis Consortium (CPTAC) [50], available at http://ualcan.path.uab.edu/ (accessed on 1 March 2022). Z-values represent standard deviations from the median across samples for the given cancer type of ccRCC. The statistical significance between comparisons is given by * p-value < 0.05, ** p-value < 0.01, and *** p-value < 0.001. (a) Comparison of protein expression by cancer stages of AR gene. (b) Comparison of protein expression by cancer stages of GNB3. (c) Comparison of protein expression by cancer stages of HHLA2. (d) Comparison of protein expression by cancer stages of LIMCH1. (e) Comparison of protein expression by cancer stages of SAA1.
Cancers 14 02111 g0a9
Figure A10. Heatmap with hierarchical clustering combining RNA-seq expression of patients on TCGA-KIRC and ICGC-RECA. Columns are genes of the mRMR signature. Rows indicate RNA-seq expression of 590 patients of TCGA-KIRC and ICGC-RECA. Data of patients with distant metastasis that cannot be assessed (MX) were removed in order to clarify the clustering.
Cancers 14 02111 g0a10

References

  1. Hsieh, J.J.; Purdue, M.P.; Signoretti, S.; Swanton, C.; Albiges, L.; Schmidinger, M.; Heng, D.Y.; Larkin, J.; Ficarra, V. Renal Cell Carcinoma. Nat. Rev. Dis. Primers 2017, 3, 17009. [Google Scholar] [CrossRef] [PubMed]
  2. Chen, L.; Xiang, Z.; Chen, X.; Zhu, X.; Peng, X. A Seven-Gene Signature Model Predicts Overall Survival in Kidney Renal Clear Cell Carcinoma. Hereditas 2020, 157, 38. [Google Scholar] [CrossRef] [PubMed]
  3. Cui, H.; Shan, H.; Miao, M.Z.; Jiang, Z.; Meng, Y.; Chen, R.; Zhang, L.; Liu, Y. Identification of the Key Genes and Pathways Involved in the Tumorigenesis and Prognosis of Kidney Renal Clear Cell Carcinoma. Sci. Rep. 2020, 10, 1–10. [Google Scholar] [CrossRef] [PubMed]
  4. Society, A.C. Facts & Figures: 2020 Edition. 2020. Available online: https://www.cancer.org/research/cancer-facts-statistics/all-cancer-facts-figures/cancer-facts-figures-2020.html (accessed on 1 March 2022).
  5. Padala, S.A.; Barsouk, A.; Thandra, K.C.; Saginala, K.; Mohammed, A.; Vakiti, A.; Rawla, P.; Barsouk, A. Epidemiology of Renal Cell Carcinoma. World J. Oncol. 2020, 11, 79–87. [Google Scholar] [CrossRef] [PubMed]
  6. Kann, B.H.; Hosny, A.; Aerts, H.J.W.L. Artificial Intelligence for Clinical Oncology. Cancer Cell 2021, 39, 916–927. [Google Scholar] [CrossRef]
  7. Chibon, F. Cancer Gene Expression Signatures—The Rise and Fall? Eur. J. Cancer 2013, 49, 2000–2009. [Google Scholar] [CrossRef]
  8. Zhan, Y.; Guo, W.; Zhang, Y.; Wang, Q.; Xu, X.-J.; Zhu, L. A Five-Gene Signature Predicts Prognosis in Patients with Kidney Renal Clear Cell Carcinoma. Comput. Math. Methods Med. 2015, 2015, 842784. [Google Scholar] [CrossRef] [Green Version]
  9. Chang, P.; Bing, Z.; Tian, J.; Zhang, J.; Li, X.; Ge, L.; Ling, J.; Yang, K.; Li, Y. Comprehensive Assessment Gene Signatures for Clear Cell Renal Cell Carcinoma Prognosis. Medicine 2018, 97, e12679. [Google Scholar] [CrossRef]
  10. Chen, L.; Luo, Y.; Wang, G.; Qian, K.; Qian, G.; Wu, C.-L.; Dan, H.C.; Wang, X.; Xiao, Y. Prognostic Value of a Gene Signature in Clear Cell Renal Cell Carcinoma. J. Cell. Physiol. 2019, 234, 10324–10335. [Google Scholar] [CrossRef]
  11. Jiang, H.; Chen, H.; Chen, N. Construction and Validation of a Seven-Gene Signature for Predicting Overall Survival in Patients with Kidney Renal Clear Cell Carcinoma via an Integrated Bioinformatics Analysis. Anim. Cells Syst. 2020, 24, 160–170. [Google Scholar] [CrossRef]
  12. Pan, Q.; Wang, L.; Zhang, H.; Liang, C.; Li, B. Identification of a 5-Gene Signature Predicting Progression and Prognosis of Clear Cell Renal Cell Carcinoma. Med. Sci. Monit. Int. Med. J. Exp. Clin. Res. 2019, 25, 4401–4413. [Google Scholar] [CrossRef] [PubMed]
  13. Wu, J.; Jin, S.; Gu, W.; Wan, F.; Zhang, H.; Shi, G.; Qu, Y.; Ye, D. Construction and Validation of a 9-Gene Signature for Predicting Prognosis in Stage III Clear Cell Renal Cell Carcinoma. Front. Oncol. 2019, 9, 152. [Google Scholar] [CrossRef] [PubMed] [Green Version]
  14. Kalantzakos, T.J.; Sullivan, T.B.; Gloria, T.; Canes, D.; Moinzadeh, A.; Rieger-Christ, K.M. MiRNA-424-5p Suppresses Proliferation, Migration, and Invasion of Clear Cell Renal Cell Carcinoma and Attenuates Expression of O-GlcNAc-Transferase. Cancers 2021, 13, 5160. [Google Scholar] [CrossRef] [PubMed]
  15. Wang, P.; Li, Y.; Reddy, C.K. Machine Learning for Survival Analysis: A Survey. ACM Comput. Surv. 2019, 51, 1–36. [Google Scholar] [CrossRef]
  16. Cox, D.R. Regression Models and Life-Tables. J. R. Stat. Soc. Ser. B 1972, 34, 187–220. [Google Scholar] [CrossRef]
  17. Wan, F.; Zhu, Y.; Han, C.; Xu, Q.; Wu, J.; Dai, B.; Zhang, H.; Shi, G.; Gu, W.; Ye, D. Identification and Validation of an Eight-Gene Expression Signature for Predicting High Fuhrman Grade Renal Cell Carcinoma. Int. J. Cancer J. Int. Du Cancer 2017, 140, 1199–1208. [Google Scholar] [CrossRef] [Green Version]
  18. Hu, F.; Zeng, W.; Liu, X. A Gene Signature of Survival Prediction for Kidney Renal Cell Carcinoma by Multi-Omic Data Analysis. Int. J. Mol. Sci. 2019, 20, 5720. [Google Scholar] [CrossRef] [Green Version]
  19. Zou, Y.; Hu, C. A 14 Immune-Related Gene Signature Predicts Clinical Outcomes of Kidney Renal Clear Cell Carcinoma. PeerJ 2020, 8, e10183. [Google Scholar] [CrossRef]
  20. Peng, H.; Long, F.; Ding, C. Feature Selection Based on Mutual Information Criteria of Max-Dependency, Max-Relevance, and Min-Redundancy. IEEE Trans. Pattern Anal. Mach. Intell. 2005, 27, 1226–1238. [Google Scholar] [CrossRef]
  21. Network, C.G.A.R. Comprehensive Molecular Characterization of Clear Cell Renal Cell Carcinoma. Nature 2013, 499, 43–49. [Google Scholar] [CrossRef] [Green Version]
  22. GDC TCGA Kidney Clear Cell Carcinoma (KIRC). 2022. Available online: https://xenabrowser.net/datapages/ (accessed on 1 March 2022).
  23. Zhang, J.; Bajari, R.; Andric, D.; Gerthoffert, F.; Lepsa, A.; Nahal-Bose, H.; Stein, L.D.; Ferretti, V. The International Cancer Genome Consortium (ICGC) Data Portal. Nat. Biotechnol. 2019, 37, 367–369. [Google Scholar] [CrossRef] [PubMed]
  24. International Cancer Genome Consortium. Renal Cell Cancer; EU/FR (RECA): Paris, France, 2022; Available online: https://dcc.icgc.org/projects/RECA-EU (accessed on 1 March 2022).
  25. Gao, G.F.; Parker, J.S.; Reynolds, S.M.; Silva, T.C.; Wang, L.-B.; Zhou, W.; Akbani, R.; Bailey, M.; Balu, S.; Berman, B.P.; et al. Before and After: Comparison of Legacy and Harmonized TCGA Genomic Data Commons’ Data. Cell Syst. 2019, 9, 24–34.e10. [Google Scholar] [CrossRef] [PubMed] [Green Version]
  26. Love, M.I.; Huber, W.; Anders, S. Moderated Estimation of Fold Change and Dispersion for RNA-Seq Data with DESeq2. Genome Biol. 2014, 15, 550. [Google Scholar] [CrossRef] [PubMed] [Green Version]
  27. Kuhn, M. Building Predictive Models in R Using the Caret Package. J. Stat. Softw. 2008, 28, 1–26. [Google Scholar] [CrossRef] [Green Version]
  28. Consortium, Gte. The GTEx Consortium Atlas of Genetic Regulatory Effects across Human Tissues. Science 2020, 369, 1318–1330. [Google Scholar] [CrossRef]
  29. Consortium, Gte. Human Genomics. The Genotype-Tissue Expression (GTEx) Pilot Analysis: Multitissue Gene Regulation in Humans. Science 2015, 348, 648–660. [Google Scholar] [CrossRef] [Green Version]
  30. Spooner, A.; Chen, E.; Sowmya, A.; Sachdev, P.; Kochan, N.A.; Trollor, J.; Brodaty, H. A Comparison of Machine Learning Methods for Survival Analysis of High-Dimensional Clinical Data for Dementia Prediction. Sci. Rep. 2020, 10, 20410. [Google Scholar] [CrossRef]
  31. Simon, N.; Friedman, J.; Hastie, T.; Tibshirani, R. Regularization Paths for Cox’s Proportional Hazards Model via Coordinate Descent. J. Stat. Softw. 2011, 39, 1–13. [Google Scholar] [CrossRef]
  32. Ding, C.; Peng, H. Minimum Redundancy Feature Selection from Microarray Gene Expression Data. J. Bioinform. Comput. Biol. 2005, 3, 185–205. [Google Scholar] [CrossRef]
  33. Jay, N.D.; De Jay, N.; Papillon-Cavanagh, S.; Olsen, C.; El-Hachem, N.; Bontempi, G.; Haibe-Kains, B. MRMRe: An R Package for Parallelized MRMR Ensemble Feature Selection. Bioinformatics 2013, 29, 2365–2368. [Google Scholar] [CrossRef] [Green Version]
  34. Lang, M.; Binder, M.; Richter, J.; Schratz, P.; Pfisterer, F.; Coors, S.; Au, Q.; Casalicchio, G.; Kotthoff, L.; Bischl, B. Mlr3: A Modern Object-Oriented Machine Learning Framework in R. J. Open Source Softw. 2019, 4, 1903. [Google Scholar] [CrossRef] [Green Version]
  35. Wei, T.; Simko, V. R Package “Corrplot”: Visualization of a Correlation Matrix. 2021. Available online: https://cran.r-project.org/web/packages/corrplot/index.html (accessed on 1 March 2022).
  36. Kratzer, G.; Furrer, R. Varrank: An R Package for Variable Ranking Based on Mutual Information with Applications to Observed Systemic Datasets. arXiv 2018, arXiv:1804.07134. [Google Scholar]
  37. Blanche, P.; Kattan, M.W.; Gerds, T.A. The C-Index Is Not Proper for the Evaluation of t-Year Predicted Risks. Biostatistics 2019, 20, 347–357. [Google Scholar] [CrossRef] [PubMed]
  38. Uno, H.; Cai, T.; Tian, L.; Wei, L.J. Evaluating Prediction Rules Fort-Year Survivors with Censored Regression Models. J. Am. Stat. Assoc. 2007, 102, 527–537. [Google Scholar] [CrossRef]
  39. Potapov, S.; Adler, W.; Schmid, M. SurvAUC: Estimators of Prediction Accuracy for Time-to-Event Data. In Proceedings of the R User Conference, Nashville, TN, USA, 12–15 June 2012. [Google Scholar]
  40. Kassambara, A.; Kosinski, M.; Biecek, P. Survminer: Drawing Survival Curves Using “Ggplot2”. 2021. Available online: https://cran.r-project.org/web/packages/survminer/index.html (accessed on 1 March 2022).
  41. Piñero, J.; Ramírez-Anguita, J.M.; Saüch-Pitarch, J.; Ronzano, F.; Centeno, E.; Sanz, F.; Furlong, L.I. The DisGeNET Knowledge Platform for Disease Genomics: 2019 Update. Nucleic Acids Res. 2020, 48, D845–D855. [Google Scholar] [CrossRef] [Green Version]
  42. Chen, H.; Boutros, P.C. VennDiagram: A Package for the Generation of Highly-Customizable Venn and Euler Diagrams in R. BMC Bioinform. 2011, 12, 35. [Google Scholar] [CrossRef] [Green Version]
  43. Walter, W.; Sánchez-Cabo, F.; Ricote, M. GOplot: An R Package for Visually Combining Expression Data with Functional Analysis. Bioinformatics 2015, 31, 2912–2914. [Google Scholar] [CrossRef]
  44. Lê, S.; Josse, J.; Husson, F. FactoMineR: An R Package for Multivariate Analysis. J. Stat. Softw. 2008, 25, 1–18. [Google Scholar] [CrossRef] [Green Version]
  45. Kassambara, A.; Mundt, F. Factoextra: Extract and Visualize the Results of Multivariate Data Analyses. Open J. Anim. Sci. 2020, 11, 4. [Google Scholar]
  46. Therneau, T.M. A Package for Survival Analysis in R. 2022. Available online: https://cran.r-project.org/web/packages/survival/index.html (accessed on 1 March 2022).
  47. Wu, T.; Hu, E.; Xu, S.; Chen, M.; Guo, P.; Dai, Z.; Feng, T.; Zhou, L.; Tang, W.; Zhan, L.; et al. ClusterProfiler 4.0: A Universal Enrichment Tool for Interpreting Omics Data. Innovation 2021, 2, 100141. [Google Scholar] [CrossRef]
  48. Harrison, E.; Drake, T.; Ots, R. Finalfit: Quickly Create Elegant Regression Results Tables and Plots When Modelling. 2022. Available online: https://github.com/ewenharrison/finalfit (accessed on 1 March 2022).
  49. Kolde, R. Pheatmap: Pretty Heatmaps. 2019. Available online: https://cran.r-project.org/web/pheatmap/survival/index.html (accessed on 1 March 2022).
  50. Patil, I. Visualizations with Statistical Details: The “ggstatsplot” Approach. J. Open Source Softw. 2021, 6, 3167. [Google Scholar] [CrossRef]
  51. Chandrashekar, D.S.; Bashel, B.; Balasubramanya, S.A.H.; Creighton, C.J.; Ponce-Rodriguez, I.; Chakravarthi, B.V.S.K.; Varambally, S. UALCAN: A Portal for Facilitating Tumor Subgroup Gene Expression and Survival Analyses. Neoplasia 2017, 19, 649–658. [Google Scholar] [CrossRef] [PubMed]
  52. Wan, B.; Liu, B.; Huang, Y.; Yu, G.; Lv, C. Prognostic Value of Immune-Related Genes in Clear Cell Renal Cell Carcinoma. Aging 2019, 11, 11474–11489. [Google Scholar] [CrossRef] [PubMed]
  53. Gao, X.; Yang, J.; Chen, Y. Identification of a Four Immune-Related Genes Signature Based on an Immunogenomic Landscape Analysis of Clear Cell Renal Cell Carcinoma. J. Cell. Physiol. 2020, 235, 9834–9850. [Google Scholar] [CrossRef]
  54. Zhang, Z.; Lin, E.; Zhuang, H.; Xie, L.; Feng, X.; Liu, J.; Yu, Y. Construction of a Novel Gene-Based Model for Prognosis Prediction of Clear Cell Renal Cell Carcinoma. Cancer Cell Int. 2020, 20, 27. [Google Scholar] [CrossRef] [Green Version]
  55. Kang, H.W.; Park, H.; Seo, S.P.; Byun, Y.J.; Piao, X.M.; Kim, S.M.; Kim, W.T.; Yun, S.J.; Jang, W.; Shon, H.S.; et al. Methylation Signature for Prediction of Progression Free Survival in Surgically Treated Clear Cell Renal Cell Carcinoma. J. Korean Med. Sci. 2019, 34, e144. [Google Scholar] [CrossRef]
  56. Jia, Z.; Wan, F.; Zhu, Y.; Shi, G.; Zhang, H.; Dai, B.; Ye, D. Forkhead-Box Series Expression Network Is Associated with Outcome of Clear-Cell Renal Cell Carcinoma. Oncol. Lett. 2018, 15, 8669–8680. [Google Scholar] [CrossRef] [Green Version]
  57. Zhu, P.; Piao, Y.; Dong, X.; Jin, Z. Forkhead Box J1 Expression Is Upregulated and Correlated with Prognosis in Patients with Clear Cell Renal Cell Carcinoma. Oncol. Lett. 2015, 10, 1487–1494. [Google Scholar] [CrossRef] [Green Version]
  58. Liu, M.; Pan, Q.; Xiao, R.; Yu, Y.; Lu, W.; Wang, L. A cluster of metabolism-related genes predict prognosis and progression of clear cell renal cell carcinoma. Sci. Rep. 2020, 10, 12949. [Google Scholar] [CrossRef]
  59. Wang, Y.; Chen, Y.; Zhu, B.; Ma, L.; Xing, Q. A Novel Nine Apoptosis-Related Genes Signature Predicting Overall Survival for Kidney Renal Clear Cell Carcinoma and its Associations with Immune Infiltration. Front. Mol. Biosci. 2021, 8, 567730. [Google Scholar] [CrossRef]
  60. Kang, M.A.; Lee, J.; Ha, S.H.; Lee, C.M.; Kim, K.M.; Jang, K.Y.; Park, S.H. Interleukin4Rα (IL4Rα) and IL13Rα1 Are Associated with the Progress of Renal Cell Carcinoma through Janus Kinase 2 (JAK2)/Forkhead Box O3 (FOXO3) Pathways. Cancers 2019, 11, 1394. [Google Scholar] [CrossRef] [PubMed] [Green Version]
  61. Li, C.-S.; Chae, S.-C.; Lee, J.-H.; Zhang, Q.; Chung, H.-T. Identification of Single Nucleotide Polymorphisms in FOXJ1 and Their Association with Allergic Rhinitis. J. Hum. Genet. 2006, 51, 292–297. [Google Scholar] [CrossRef] [PubMed]
  62. Li, C.-S.; Zhang, Q.; Lim, M.-K.; Sheen, D.-H.; Shim, S.-C.; Kim, J.-Y.; Lee, S.-S.; Yun, K.-J.; Moon, H.-B.; Chung, H.-T.; et al. Association of FOXJ1 Polymorphisms with Systemic Lupus Erythematosus and Rheumatoid Arthritis in Korean Population. Exp. Mol. Med. 2007, 39, 805–811. [Google Scholar] [CrossRef] [PubMed]
  63. Srivatsan, S.; Peng, S.L. Cutting Edge: Foxj1 Protects against Autoimmunity and Inhibits Thymocyte Egress. J. Immunol. 2005, 175, 7805–7809. [Google Scholar] [CrossRef] [Green Version]
  64. Xian, S.; Shang, D.; Kong, G.; Tian, Y. FOXJ1 Promotes Bladder Cancer Cell Growth and Regulates Warburg Effect. Biochem. Biophys. Res. Commun. 2018, 495, 988–994. [Google Scholar] [CrossRef]
  65. Chen, H.-W.; Huang, X.-D.; Li, H.-C.; He, S.; Ni, R.-Z.; Chen, C.-H.; Peng, C.; Wu, G.; Wang, G.-H.; Wang, Y.-Y.; et al. Expression of FOXJ1 in Hepatocellular Carcinoma: Correlation with Patients’ Prognosis and Tumor Cell Proliferation. Mol. Carcinog. 2013, 52, 647–659. [Google Scholar] [CrossRef]
  66. Liu, K.; Fan, J.; Wu, J. Forkhead Box Protein J1 (FOXJ1) Is Overexpressed in Colorectal Cancer and Promotes Nuclear Translocation of B-Catenin in SW620 Cells. Med. Sci. Monit. Int. Med. J. Exp. Clin. Res. 2017, 23, 856–866. [Google Scholar] [CrossRef] [Green Version]
  67. Wang, J.; Cai, X.; Xia, L.; Zhou, J.; Xin, J.; Liu, M.; Shang, X.; Liu, J.; Li, X.; Chen, Z.; et al. Decreased Expression of FOXJ1 Is a Potential Prognostic Predictor for Progression and Poor Survival of Gastric Cancer. Ann. Surg. Oncol. 2015, 22, 685–692. [Google Scholar] [CrossRef]
  68. Abedalthagafi, M.S.; Wu, M.P.; Merrill, P.H.; Du, Z.; Woo, T.; Sheu, S.-H.; Hurwitz, S.; Ligon, K.L.; Santagata, S. Decreased FOXJ1 Expression and Its Ciliogenesis Programme in Aggressive Ependymoma and Choroid Plexus Tumours. J. Pathol. 2016, 238, 584–597. [Google Scholar] [CrossRef] [Green Version]
  69. Lin, B.M.; Nadkarni, G.N.; Tao, R.; Graff, M.; Fornage, M.; Buyske, S.; Matise, T.C.; Highland, H.M.; Wilkens, L.R.; Carlson, C.S.; et al. Genetics of Chronic Kidney Disease Stages Across Ancestries: The PAGE Study. Front. Genet. 2019, 10, 494. [Google Scholar] [CrossRef] [Green Version]
  70. Shirota, H.; Klinman, D.M.; Ito, S.-E.; Ito, H.; Kubo, M.; Ishioka, C. IL4 from T Follicular Helper Cells Downregulates Antitumor Immunity. Cancer Immunol. Res. 2017, 5, 61–71. [Google Scholar] [CrossRef] [PubMed] [Green Version]
  71. Ito, S.-E.; Shirota, H.; Kasahara, Y.; Saijo, K.; Ishioka, C. IL-4 Blockade Alters the Tumor Microenvironment and Augments the Response to Cancer Immunotherapy in a Mouse Model. Cancer Immunol. Immunother. 2017, 66, 1485–1496. [Google Scholar] [CrossRef] [PubMed]
  72. Jia, Y.; Xie, X.; Shi, X.; Li, S. Associations of Common IL-4 Gene Polymorphisms with Cancer Risk: A Meta-Analysis. Mol. Med. Rep. 2017, 16, 1927–1945. [Google Scholar] [CrossRef] [PubMed] [Green Version]
  73. Cheng, H.; Borczuk, A.; Janakiram, M.; Ren, X.; Lin, J.; Assal, A.; Halmos, B.; Perez-Soler, R.; Zang, X. Wide Expression and Significance of Alternative Immune Checkpoint Molecules, B7x and HHLA2, in PD-L1–Negative Human Lung Cancers. Clin. Cancer Res. 2018, 24, 1954–1964. [Google Scholar] [CrossRef] [PubMed] [Green Version]
  74. Zhao, R.; Chinai, J.M.; Buhl, S.; Scandiuzzi, L.; Ray, A.; Jeon, H.; Ohaegbulam, K.C.; Ghosh, K.; Zhao, A.; Scharff, M.D.; et al. HHLA2 Is a Member of the B7 Family and Inhibits Human CD4 and CD8 T-Cell Function. Proc. Natl. Acad. Sci. USA 2013, 110, 9879–9884. [Google Scholar] [CrossRef] [PubMed] [Green Version]
  75. Byun, J.M.; Cho, H.J.; Park, H.Y.; Lee, D.S.; Choi, I.H.; Kim, Y.N.; Jeong, C.H.; Kim, D.H.; Hwa Im, D.; Min, B.J.; et al. The Clinical Significance of HERV-H LTR -Associating 2 Expression in Cervical Adenocarcinoma. Medicine 2021, 100, e23691. [Google Scholar] [CrossRef]
  76. Boor, P.P.C.; Sideras, K.; Biermann, K.; Hosein Aziz, M.; Levink, I.J.M.; Mancham, S.; Erler, N.S.; Tang, X.; van Eijck, C.H.; Bruno, M.J.; et al. HHLA2 Is Expressed in Pancreatic and Ampullary Cancers and Increased Expression Is Associated with Better Post-Surgical Prognosis. Br. J. Cancer 2020, 122, 1211–1218. [Google Scholar] [CrossRef]
  77. Cheng, H.; Janakiram, M.; Borczuk, A.; Lin, J.; Qiu, W.; Liu, H.; Chinai, J.M.; Halmos, B.; Perez-Soler, R.; Zang, X. HHLA2, a New Immune Checkpoint Member of the B7 Family, Is Widely Expressed in Human Lung Cancer and Associated with EGFR Mutational Status. Clin. Cancer Res. Off. J. Am. Assoc. Cancer Res. 2017, 23, 825–832. [Google Scholar] [CrossRef] [Green Version]
  78. Shimonosono, M.; Arigami, T.; Yanagita, S.; Matsushita, D.; Uchikado, Y.; Kijima, Y.; Kurahara, H.; Kita, Y.; Mori, S.; Sasaki, K.; et al. The Association of Human Endogenous Retrovirus-H Long Terminal Repeat-Associating Protein 2 (HHLA2) Expression with Gastric Cancer Prognosis. Oncotarget 2018, 9, 22069–22078. [Google Scholar] [CrossRef] [Green Version]
  79. Chen, L.; Zhu, D.; Feng, J.; Zhou, Y.; Wang, Q.; Feng, H.; Zhang, J.; Jiang, J. Overexpression of HHLA2 in Human Clear Cell Renal Cell Carcinoma Is Significantly Associated with Poor Survival of the Patients. Cancer Cell Int. 2019, 19, 1–12. [Google Scholar] [CrossRef]
  80. Reidy, K.; Tufro, A. Semaphorins in Kidney Development and Disease: Modulators of Ureteric Bud Branching, Vascular Morphogenesis, and Podocyte-Endothelial Crosstalk. Pediatric Nephrol. 2011, 26, 1407–1412. [Google Scholar] [CrossRef] [PubMed] [Green Version]
  81. Xia, J.; Worzfeld, T. Semaphorins and Plexins in Kidney Disease. Nephron 2016, 132, 93–100. [Google Scholar] [CrossRef] [PubMed]
  82. Neufeld, G.; Mumblat, Y.; Smolkin, T.; Toledano, S.; Nir-Zvi, I.; Ziv, K.; Kessler, O. The Role of the Semaphorins in Cancer. Cell Adhes. Migr. 2016, 10, 652–674. [Google Scholar] [CrossRef] [PubMed] [Green Version]
  83. Karayan-Tapon, L.; Wager, M.; Guilhot, J.; Levillain, P.; Marquant, C.; Clarhaut, J.; Potiron, V.; Roche, J. Semaphorin, Neuropilin and VEGF Expression in Glial Tumours: SEMA3G, a Prognostic Marker? Br. J. Cancer 2008, 99, 1153–1160. [Google Scholar] [CrossRef] [PubMed] [Green Version]
  84. Wu, H.; Malone, A.F.; Donnelly, E.L.; Kirita, Y.; Uchimura, K.; Ramakrishnan, S.M.; Gaut, J.P.; Humphreys, B.D. Single-Cell Transcriptomics of a Human Kidney Allograft Biopsy Specimen Defines a Diverse Inflammatory Response. J. Am. Soc. Nephrol. JASN 2018, 29, 2069–2080. [Google Scholar] [CrossRef] [PubMed]
  85. Liang, J.; Liu, Z.; Zou, Z.; Tang, Y.; Zhou, C.; Yang, J.; Wei, X.; Lu, Y. The Correlation between the Immune and Epithelial-Mesenchymal Transition Signatures Suggests Potential Therapeutic Targets and Prognosis Prediction Approaches in Kidney Cancer. Sci. Rep. 2018, 8, 6570. [Google Scholar] [CrossRef] [Green Version]
  86. Balk, S.P.; Knudsen, K.E. AR, the Cell Cycle, and Prostate Cancer. Nucl. Recept. Signal. 2008, 6, nrs.06001. [Google Scholar] [CrossRef] [Green Version]
  87. Sun, M.; Abdollah, F. Re: AR-V7 and Resistance to Enzalutamide and Abiraterone in Prostate Cancer. Eur. Urol. 2015, 68, 162–163. [Google Scholar] [CrossRef] [Green Version]
  88. Huang, Q.; Sun, Y.; Zhai, W.; Ma, X.; Shen, D.; Du, S.; You, B.; Niu, Y.; Huang, C.-P.; Zhang, X.; et al. Androgen Receptor Modulates Metastatic Routes of VHL Wild-Type Clear Cell Renal Cell Carcinoma in an Oxygen-Dependent Manner. Oncogene 2020, 39, 6677–6691. [Google Scholar] [CrossRef]
  89. Chen, Y.; Sun, Y.; Rao, Q.; Xu, H.; Li, L.; Chang, C. Androgen Receptor (AR) Suppresses MiRNA-145 to Promote Renal Cell Carcinoma (RCC) Progression Independent of VHL Status. Oncotarget 2015, 6, 31203–31215. [Google Scholar] [CrossRef] [Green Version]
  90. Lee, K.-H.; Kim, B.-C.; Jeong, S.-H.; Jeong, C.W.; Ku, J.H.; Kwak, C.; Kim, H.H. Histone Demethylase LSD1 Regulates Kidney Cancer Progression by Modulating Androgen Receptor Activity. Int. J. Mol. Sci. 2020, 21, 6089. [Google Scholar] [CrossRef] [PubMed]
  91. Wang, K.; Sun, Y.; Tao, W.; Fei, X.; Chang, C. Androgen Receptor (AR) Promotes Clear Cell Renal Cell Carcinoma (CcRCC) Migration and Invasion via Altering the CircHIAT1/MiR-195-5p/29a-3p/29c-3p/CDC42 Signals. Cancer Lett. 2017, 394, 1–12. [Google Scholar] [CrossRef] [PubMed]
  92. You, B.; Sun, Y.; Luo, J.; Wang, K.; Liu, Q.; Fang, R.; Liu, B.; Chou, F.; Wang, R.; Meng, J.; et al. Androgen Receptor Promotes Renal Cell Carcinoma (RCC) Vasculogenic Mimicry (VM) via Altering TWIST1 Nonsense-Mediated Decay through LncRNA-TANAR. Oncogene 2021, 40, 1674–1689. [Google Scholar] [CrossRef]
  93. Larsen, K.B.; Lutterodt, M.C.; Møllgård, K.; Møller, M. Expression of the Homeobox Genes OTX2 and OTX1 in the Early Developing Human Brain. J. Histochem. Cytochem. Off. J. Histochem. Soc. 2010, 58, 669–678. [Google Scholar] [CrossRef] [PubMed] [Green Version]
  94. García-Frigola, C.; Carreres, M.I.; Vegar, C.; Mason, C.; Herrera, E. Zic2 Promotes Axonal Divergence at the Optic Chiasm Midline by EphB1-Dependent and -Independent Mechanisms. Development 2008, 135, 1833–1841. [Google Scholar] [CrossRef] [PubMed] [Green Version]
  95. Grinberg, I.; Millen, K.J. The ZIC Gene Family in Development and Disease. Clin. Genet. 2005, 67, 290–296. [Google Scholar] [CrossRef] [PubMed]
  96. Marchini, S.; Poynor, E.; Barakat, R.R.; Clivio, L.; Cinquini, M.; Fruscio, R.; Porcu, L.; Bussani, C.; D’Incalci, M.; Erba, E.; et al. The Zinc Finger Gene ZIC2 Has Features of an Oncogene and Its Overexpression Correlates Strongly with the Clinical Course of Epithelial Ovarian Cancer. Clin. Cancer Res. Off. J. Am. Assoc. Cancer Res. 2012, 18, 4313–4324. [Google Scholar] [CrossRef] [Green Version]
  97. Liu, Z.-H.; Chen, M.-L.; Zhang, Q.; Zhang, Y.; An, X.; Luo, Y.-L.; Liu, X.-M.; Liu, S.-X.; Liu, Q.; Yang, T.; et al. ZIC2 Is Downregulated and Represses Tumor Growth via the Regulation of STAT3 in Breast Cancer. Int. J. Cancer. J. Int. Du Cancer 2020, 147, 505–518. [Google Scholar] [CrossRef]
  98. Wu, C.-Y.; Li, L.; Chen, S.-L.; Yang, X.; Zhang, C.Z.; Cao, Y. A Zic2/Runx2/NOLC1 Signaling Axis Mediates Tumor Growth and Metastasis in Clear Cell Renal Cell Carcinoma. Cell Death Dis. 2021, 12, 319. [Google Scholar] [CrossRef]
  99. Lin, Y.-H.; Zhen, Y.-Y.; Chien, K.-Y.; Lee, I.-C.; Lin, W.-C.; Chen, M.-Y.; Pai, L.-M. LIMCH1 Regulates Nonmuscle Myosin-II Activity and Suppresses Cell Migration. Mol. Biol. Cell 2017, 28, 1054–1065. [Google Scholar] [CrossRef] [Green Version]
  100. Karlsson, T.; Kvarnbrink, S.; Holmlund, C.; Botling, J.; Micke, P.; Henriksson, R.; Johansson, M.; Hedman, H. LMO7 and LIMCH1 Interact with LRIG Proteins in Lung Cancer, with Prognostic Implications for Early-Stage Disease. Lung Cancer 2018, 125, 174–184. [Google Scholar] [CrossRef] [PubMed]
  101. Cizkova, M.; Cizeron-Clairac, G.; Vacher, S.; Susini, A.; Andrieu, C.; Lidereau, R.; Bièche, I. Gene Expression Profiling Reveals New Aspects of PIK3CA Mutation in ERalpha-Positive Breast Cancer: Major Implication of the Wnt Signaling Pathway. PLoS ONE 2010, 5, e15647. [Google Scholar] [CrossRef] [PubMed] [Green Version]
  102. Halle, M.K.; Sødal, M.; Forsse, D.; Engerud, H.; Woie, K.; Lura, N.G.; Wagner-Larsen, K.S.; Trovik, J.; Bertelsen, B.I.; Haldorsen, I.S.; et al. A 10-Gene Prognostic Signature Points to LIMCH1 and HLA-DQB1 as Important Players in Aggressive Cervical Cancer Disease. Br. J. Cancer 2021, 124, 1690–1698. [Google Scholar] [CrossRef] [PubMed]
  103. Uhlen, M.; Zhang, C.; Lee, S.; Sjöstedt, E.; Fagerberg, L.; Bidkhori, G.; Benfeitas, R.; Arif, M.; Liu, Z.; Edfors, F.; et al. A Pathology Atlas of the Human Cancer Transcriptome. Science 2017, 357, 2507. [Google Scholar] [CrossRef] [PubMed] [Green Version]
  104. Expression of LIMCH1 in Renal Cancer—Interactive Survival Scatter Plot—The Human Protein Atlas. 2022. Available online: https://www.proteinatlas.org/ENSG00000064042-LIMCH1/pathology/renal+cancer (accessed on 1 March 2022).
  105. Clark, B.D.; Kwon, E.; Maffie, J.; Jeong, H.-Y.; Nadal, M.; Strop, P.; Rudy, B. DPP6 Localization in Brain Supports Function as a Kv4 Channel Associated Protein. Front. Mol. Neurosci. 2008, 1, 8. [Google Scholar] [CrossRef] [PubMed] [Green Version]
  106. Zhao, X.; Cao, D.; Ren, Z.; Liu, Z.; Lv, S.; Zhu, J.; Li, L.; Lang, R.; He, Q. Dipeptidyl Peptidase like 6 Promoter Methylation Is a Potential Prognostic Biomarker for Pancreatic Ductal Adenocarcinoma. Biosci. Rep. 2020, 40, BSR20200214. [Google Scholar] [CrossRef]
  107. Choy, T.-K.; Wang, C.-Y.; Phan, N.N.; Khoa Ta, H.D.; Anuraga, G.; Liu, Y.-H.; Wu, Y.-F.; Lee, K.-H.; Chuang, J.-Y.; Kao, T.-J. Identification of Dipeptidyl Peptidase (DPP) Family Genes in Clinical Breast Cancer Patients via an Integrated Bioinformatics Approach. Diagnostics 2021, 11, 1204. [Google Scholar] [CrossRef]
  108. Wang, Y.; Zhang, S. Quantitative Assessment of the Association between GNB3 C825T Polymorphism and Cancer Risk. JBUON J. Balk. Union Oncol. 2014, 19, 1092–1095. [Google Scholar]
  109. Fingas, C.D.; Katsounas, A.; Kahraman, A.; Siffert, W.; Jochum, C.; Gerken, G.; Nückel, H.; Canbay, A. Prognostic Assessment of Three Single-Nucleotide Polymorphisms (GNB3 825C>T, BCL2-938C>A, MCL1-386C>G) in Extrahepatic Cholangiocarcinoma. Cancer Investig. 2010, 28, 472–478. [Google Scholar] [CrossRef]
  110. Paleari, R.G.; Peres, R.M.R.; Florentino, J.O.; Heinrich, J.K.; Bragança, W.O.; Del Valle, J.C.T.; Zeferino, L.C.; Derchain, S.F.M.; Sarian, L.O. Reduced Prevalence of the C825T Polymorphism of the G-Protein Beta Subunit Gene in Women with Breast Cancer. Int. J. Biol. Markers 2011, 26, 234–240. [Google Scholar] [CrossRef]
  111. Santo, C.D.; De Santo, C.; Arscott, R.; Booth, S.; Karydis, I.; Jones, M.; Asher, R.; Salio, M.; Middleton, M.; Cerundolo, V. Invariant NKT Cells Modulate the Suppressive Activity of IL-10-Secreting Neutrophils Differentiated with Serum Amyloid A. Nat. Immunol. 2010, 11, 1039–1046. [Google Scholar] [CrossRef] [PubMed] [Green Version]
  112. Paret, C.; Schön, Z.; Szponar, A.; Kovacs, G. Inflammatory Protein Serum Amyloid A1 Marks a Subset of Conventional Renal Cell Carcinomas with Fatal Outcome. Eur. Urol. 2010, 57, 859–866. [Google Scholar] [CrossRef] [PubMed]
  113. Expression of SAA1 in Renal Cancer—Interactive Survival Scatter Plot—The Human Protein Atlas. 2022. Available online: https://www.proteinatlas.org/ENSG00000173432-SAA1/pathology/renal+cancer (accessed on 1 March 2022).
  114. Marshall, F.F. Serum Protein Profiling by SELDI Mass Spectrometry: Detection of Multiple Variants of Serum Amyloid Alpha in Renal Cancer Patients. J. Urol. 2005, 173, 1919–1920. [Google Scholar] [CrossRef]
  115. Guo, R.; Zou, B.; Liang, Y.; Bian, J.; Xu, J.; Zhou, Q.; Zhang, C.; Chen, T.; Yang, M.; Wang, H.; et al. LncRNA RCAT1 Promotes Tumor Progression and Metastasis via MiR-214-5p/E2F2 Axis in Renal Cell Carcinoma. Cell Death Dis. 2021, 12, 689. [Google Scholar] [CrossRef] [PubMed]
  116. Qi, N.; Chen, Y.; Gong, K.; Li, H. Concurrent Renal Cell Carcinoma and Urothelial Carcinoma: Long-Term Follow-up Study of 27 Cases. World J. Surg. Oncol. 2018, 16, 16. [Google Scholar] [CrossRef] [PubMed] [Green Version]
  117. Knez, V.M.; Barrow, W.; Lucia, M.S.; Wilson, S.; La Rosa, F.G. Clear Cell Urothelial Carcinoma of the Urinary Bladder: A Case Report and Review of the Literature. J. Med. Case Rep. 2014, 8, 275. [Google Scholar] [CrossRef] [PubMed] [Green Version]
  118. Rotellini, M.; Fondi, C.; Paglierani, M.; Stomaci, N.; Raspollini, M.R. Clear Cell Carcinoma of the Bladder in a Patient with a Earlier Clear Cell Renal Cell Carcinoma: A Case Report with Morphologic, Immunohistochemical, and Cytogenetical Analysis. Appl. Immunohistochem. Mol. Morphol. AIMM Off. Publ. Soc. Appl. Immunohistochem. 2010, 18, 396–399. [Google Scholar] [CrossRef]
  119. van de Pol, J.A.A.; van den Brandt, P.A.; Schouten, L.J. Kidney Stones and the Risk of Renal Cell Carcinoma and Upper Tract Urothelial Carcinoma: The Netherlands Cohort Study. Br. J. Cancer 2018, 120, 368–374. [Google Scholar] [CrossRef] [Green Version]
  120. Dai, J.; Lu, Y.; Wang, J.; Yang, L.; Han, Y.; Wang, Y.; Yan, D.; Ruan, Q.; Wang, S. A Four-Gene Signature Predicts Survival in Clear-Cell Renal-Cell Carcinoma. Oncotarget 2016, 7, 82712–82726. [Google Scholar] [CrossRef] [Green Version]
  121. D’Costa, N.M.; Cina, D.; Shrestha, R.; Bell, R.H.; Lin, Y.-Y.; Asghari, H.; Monjaras-Avila, C.U.; Kollmannsberger, C.; Hach, F.; Chavez-Munoz, C.I.; et al. Identification of Gene Signature for Treatment Response to Guide Precision Oncology in Clear-Cell Renal Cell Carcinoma. Sci. Rep. 2020, 10, 2026. [Google Scholar] [CrossRef] [Green Version]
  122. Ha, M.J.; Baladandayuthapani, V.; Do, K.-A. Prognostic Gene Signature Identification Using Causal Structure Learning: Applications in Kidney Cancer. Cancer Inform. 2015, 14, 23–35. [Google Scholar] [CrossRef] [PubMed]
  123. Chen, Y.-L.; Ge, G.-J.; Qi, C.; Wang, H.; Wang, H.-L.; Li, L.-Y.; Li, G.-H.; Xia, L.-Q. A Five-Gene Signature May Predict Sunitinib Sensitivity and Serve as Prognostic Biomarkers for Renal Cell Carcinoma. J. Cell. Physiol. 2018, 233, 6649–6660. [Google Scholar] [CrossRef] [PubMed]
  124. Jafari, M.; Guan, Y.; Wedge, D.C.; Ansari-Pour, N. Re-Evaluating Experimental Validation in the Big Data Era: A Conceptual Argument. Genome Biol. 2021, 22, 71. [Google Scholar] [CrossRef] [PubMed]
  125. The Cancer Genome Atlas Program. 2022. Available online: https://www.cancer.gov/about-nci/organization/ccg/research/structural-genomics/tcga (accessed on 1 March 2022).
  126. TCGA/GDC Data Portal—Data Release 18.0. 2019. Available online: https://docs.gdc.cancer.gov/Data/Release_Notes/Data_Release_Notes/#data-release-180 (accessed on 1 March 2022).
  127. Goldman, M.J.; Craft, B.; Hastie, M.; Repečka, K.; McDade, F.; Kamath, A.; Banerjee, A.; Luo, Y.; Rogers, D.; Brooks, A.N.; et al. Visualizing and Interpreting Cancer Genomics Data via the Xena Platform. Nat. Biotechnol. 2020, 38, 675–678. [Google Scholar] [CrossRef] [PubMed]
Figure 1. Flowchart of the current study to obtain a gene signature based on mutual information, Minimum Redundancy Maximum Relevance (mRMR). The datasets are indicated by the cylinder, white rectangles represent a step of the analysis, and the blue rectangles indicate the resulting figures and tables. TCGA-KIRC and ICGC-RECA are datasets of ccRCC.
Cancers 14 02111 g001
Figure 2. Selected genes through mRMR. (a) Venn diagram of prefiltered gene sets. A total of 3284 prefiltered genes is given by the sets of DEA between non-metastatic versus metastatic (156), normal tissues versus primary tumor (1775), genes from literature (221), significant eQTLs genes (1259), and 124 genes overlapping in two or three intersections of sets. (b) Volcano plot of DEA comparing normal tissues versus primary tumor samples of TCGA-KIRC. In green, we see the downregulated genes of normal tissues versus primary tumors (DPP6 and FOXJ1). In red, we see the upregulated genes (HHLA2, LINC01732, SAA1, AL353637.1, and ZIC2). In gray, we see the non significant genes with low fold change. (c) Volcano plot of DEA comparing non-metastatic versus metastatic samples. In red, we see the upregulated genes (OTX1 and ZIC2).
Cancers 14 02111 g002
Figure 3. Benchmark with internal and external validation. (a) Comparison of 14 gene signatures from the literature and 6 feature selection on 8 models for survival risk, showing the predicted AUC of survival outcome in 10-years prediction. (b) Boxplots of results of each gene signature and feature selection for 7-year prediction.
Cancers 14 02111 g003
Figure 4. Survival risk predictions with mRMR signature and dimensionality reduction. (a) The survival curves are predicted in three equal-size strata of risk groups of the TCGA-KIRC dataset: higher risk (red), lower risk (green), and moderate risk (orange). (b) A dimension reduction of genes from the mRMR signature, using principal components analysis. (c) The survival curves were predicted by validating the ICGC-RECA dataset. (d) The principal components analysis of the ICGC-RECA dataset with genes of mRMR signature.
Cancers 14 02111 g004
Figure 5. Aalen’s additive Cox regression model for censored data of the mRMR signature, and the clinical features age and metastasis. (a) The dot-and-whisker plots with the estimated coefficients (β), z-score, their confidence intervals (95%), and the p-values. (b) Curves of each term for the censored data in relation to time (days).
Cancers 14 02111 g005
Figure 6. Gene enrichment analysis. (a) Heatmap of enriched terms and relationships of genes, displaying the fold change of differential analysis of normal tissues versus primary tumors of TCGA-KIRC samples. (b) Enrichment analysis of gene-disease associations (GDAs) from DisGeNET (v7.0) of expert curated databases.
Cancers 14 02111 g006
Table 1. Study Characteristics of TCGA-KIRC and ICGC-RECA cohort with the clinical characteristics: age, gender, tumor grade, metastasis, and staging by the American Joint Committee on Cancer (AJCC).
Clinical CharacteristicsTraining Cohort
TCGA-KIRC (n = 530) 1
Validation
Cohort
ICGC-RECA
(n = 91)
p Value 2
Overall survival (days)Mean (SD)1343.2 (976.6)1511.6 (634.6)0.113
Overall survival status, n./total n. (%)Alive359/530 (67.7)61/91 (67.0)0.991
Deceased171/530 (32.3)30/91 (33.0)
Age, yearsMean (SD)60.5 (12.0)60.5 (10.0)0.99
Gender, n./total n. (%)Female183/530 (34.5)39/91 (42.9)0.158
Male347/530 (65.5)52/91 (57.1)
AJCC stage, n./Total (%)T1270/530 (50.9)54/91 (59.3)0.343
T270/530 (13.2)13/91 (14.3)
T3179/530 (33.8)22/91 (24.2)
T411/530 (2.1)2/91 (2.2)
Neoplasm, n. (%)N079 (86.8)239 (45.1)<0.001
N12 (2.2)16 (3.0)
NX10 (11.0)275 (51.9)
Metastasis, n. (%)M0422/528 (79.9)81/91 (89.0)0.081
M178/528 (14.8)9/91 (9.9)
MX28/528 (5.3)1/91 (1.1)
1 The metastasis values do not sum up to heading totals because of missing data. 2 The statistical tests for age and overall survival days are performed by Wilcoxon rank-sum test, and all other comparisons are by Fisher’s exact test.
Publisher’s Note: MDPI stays neutral with regard to jurisdictional claims in published maps and institutional affiliations.

