
Application of Proteogenomics to Urine Analysis towards the Identification of Novel Biomarkers of Prostate Cancer: An Exploratory Study

 , , , ,
  ,
,  , and
, and
Abstract
:Simple Summary
Abstract
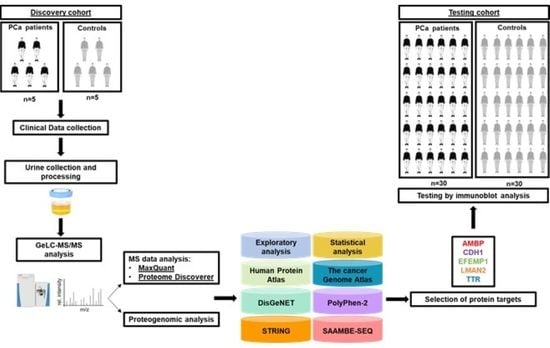
1. Introduction
2. Materials and Methods
2.1. Urine Proteome Profile of PCa Patients and Cancer-Free Subjects
2.1.1. Patients and Sample Collection
2.1.2. Urine Sample Preparation
2.1.3. SDS-PAGE
2.1.4. Liquid Chromatography Tandem-Mass-Spectrometry (LC-MS/MS)
2.1.5. Protein Identification and Quantification
2.1.6. Exploratory Analysis of Urine Proteome Data
2.1.7. Comparison with a Previous Bioinformatic Analysis of Putative Urinary Markers of PCa and Selection of Candidate Protein Targets for the Testing Phase
2.1.8. Measurement of Candidate Protein Targets in Urine Using Immunoblot
2.1.9. Measurement of Urinary PSA Levels
2.2. Urine Proteogenome Profile of PCa Patients and Cancer-Free Subjects
2.2.1. Identification of Cancer-Associated Mutations
2.2.2. Exploratory Analysis of Urine Proteogenome Data
2.2.3. Integration with the Cancer Genome Atlas (TCGA), DisGeNET and Literature Data
2.2.4. Comparison of the Levels of Native and Mutant Forms of Proteins in the Urine from PCa Patients
2.2.5. Prediction of the Likely Impact of Single-Residue Substitutions in Proteins
2.2.6. Protein–Protein Interaction Analysis
2.2.7. Prediction of the Likely Impact of Single-Residue Substitutions in Protein–Protein Affinity
2.3. Statistical Data Analysis
3. Results
3.1. Urine Proteome Profile of PCa Patients and Cancer-Free Subjects
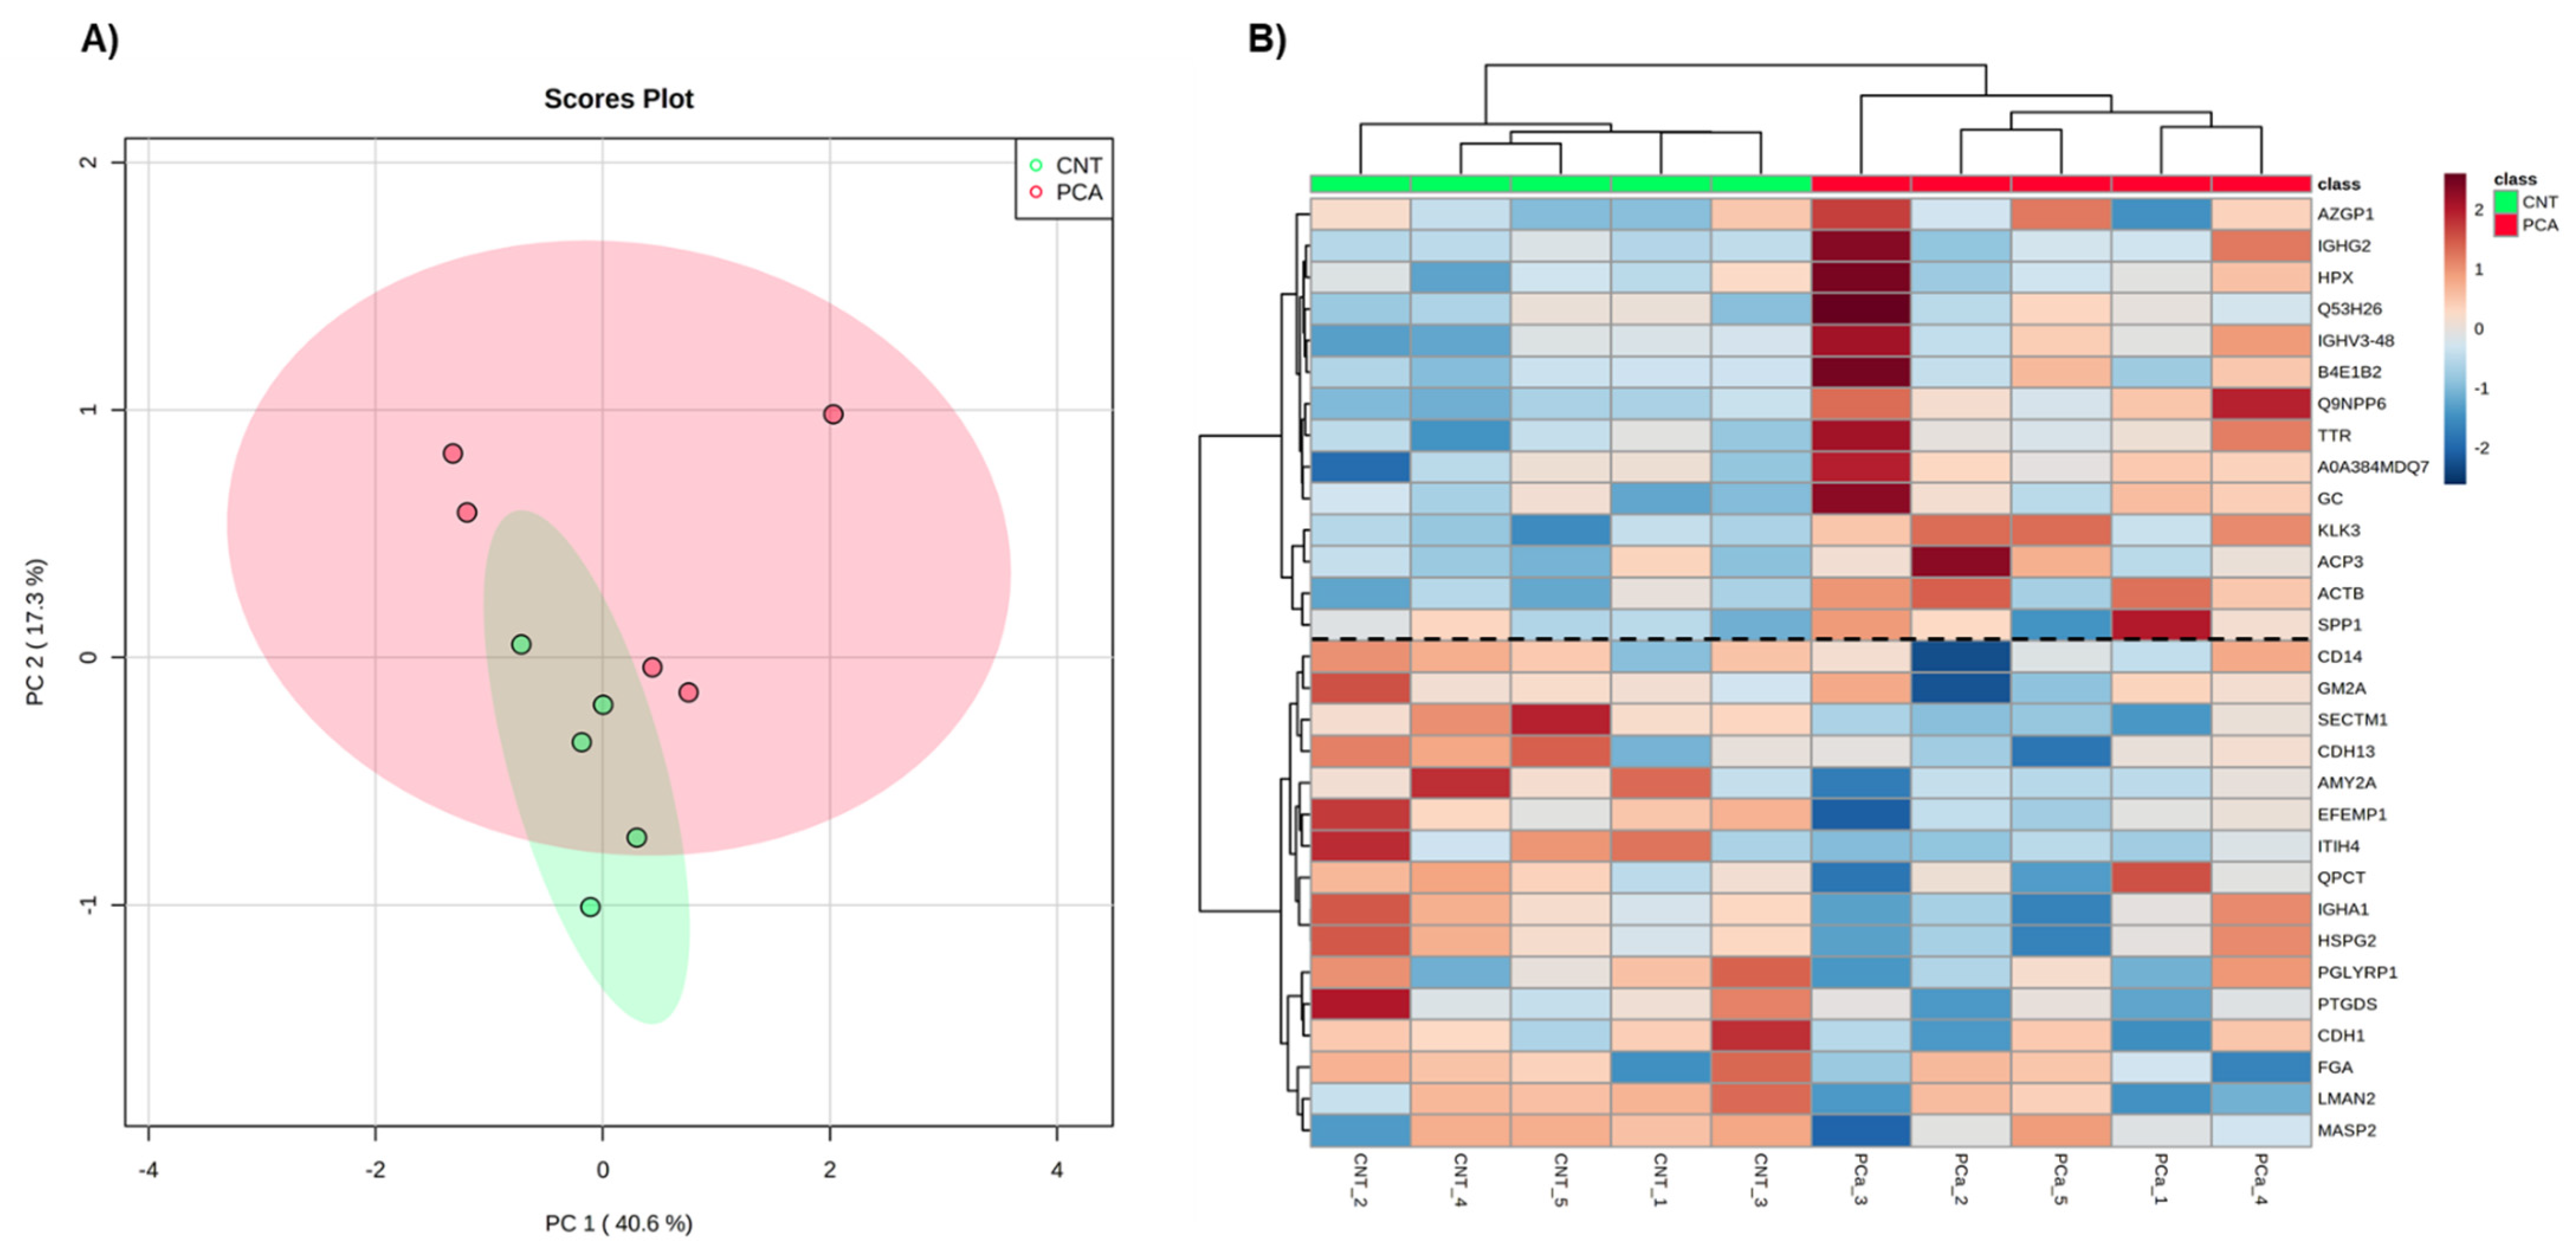
3.1.1. Exploratory Analysis of Urine Proteome Data
3.1.2. Comparison with a Previous Bioinformatic Analysis of Putative Urinary Markers of PCa and Selection of Candidate Protein Targets for the Testing Phase
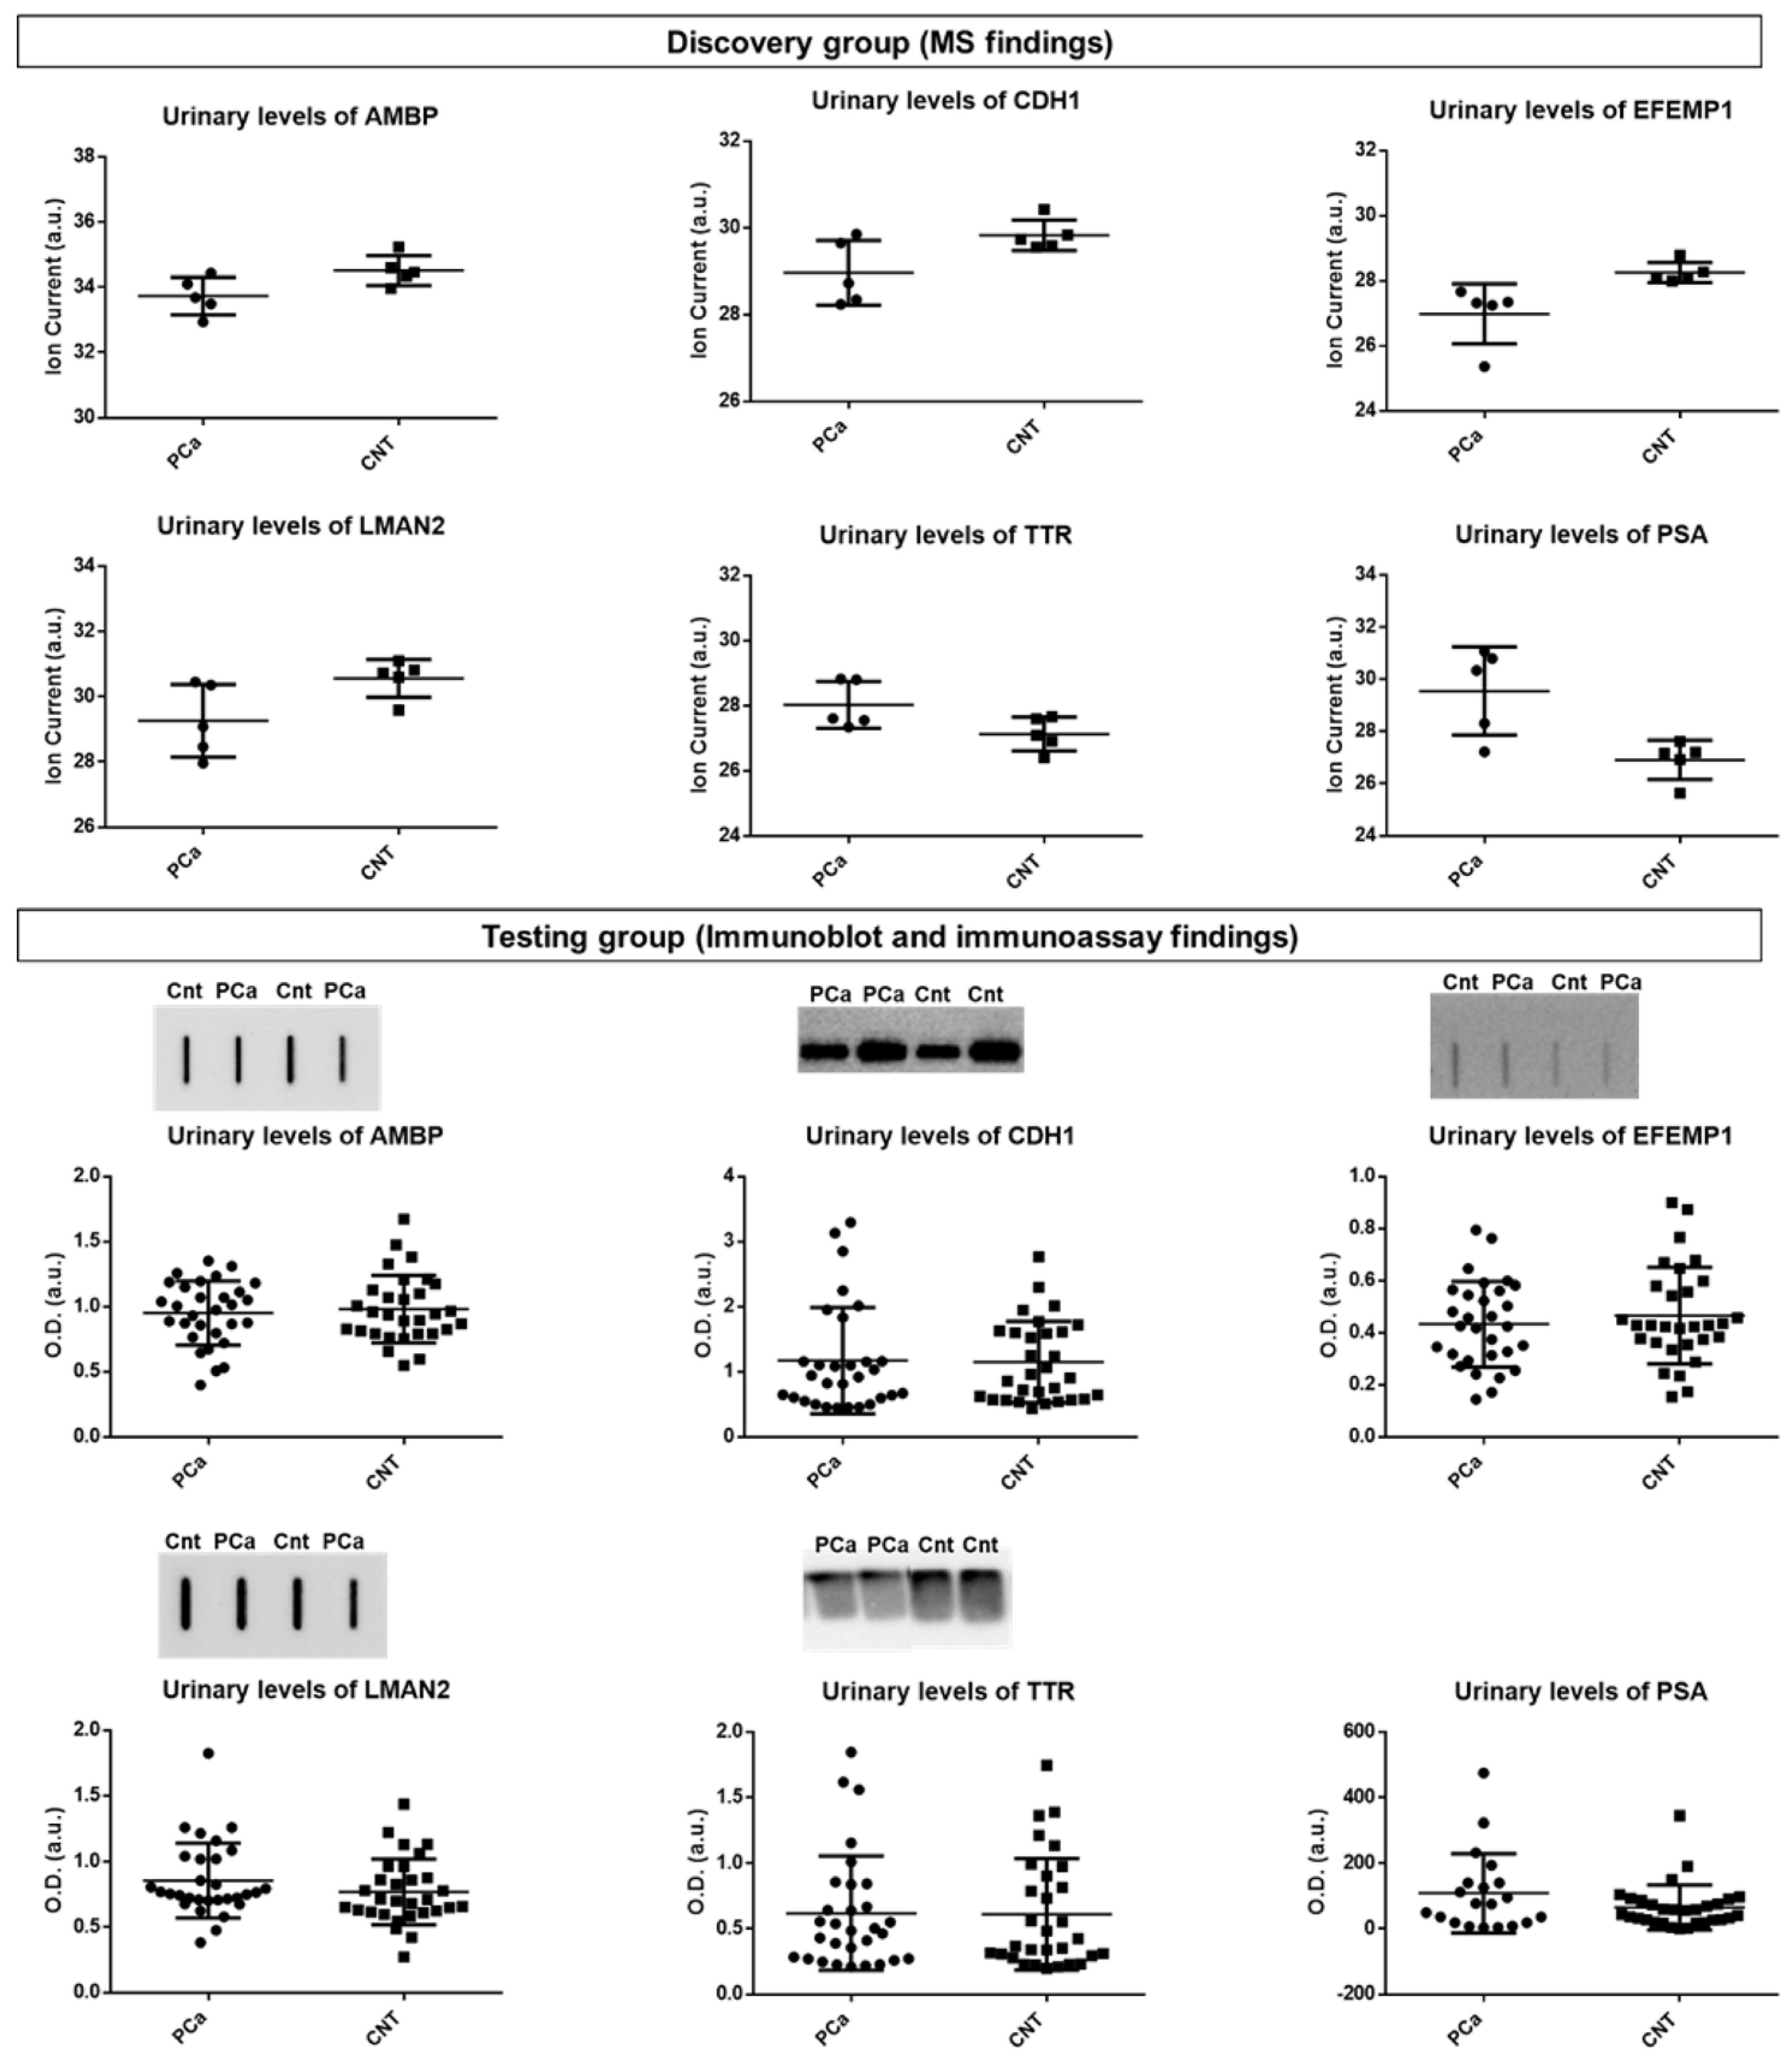
3.1.3. Measurement of Candidate Protein Targets in Urine
3.2. Urine Proteogenome Profile of PCa Patients and Cancer-Free Subjects
3.2.1. Identification of Cancer-Associated Mutations
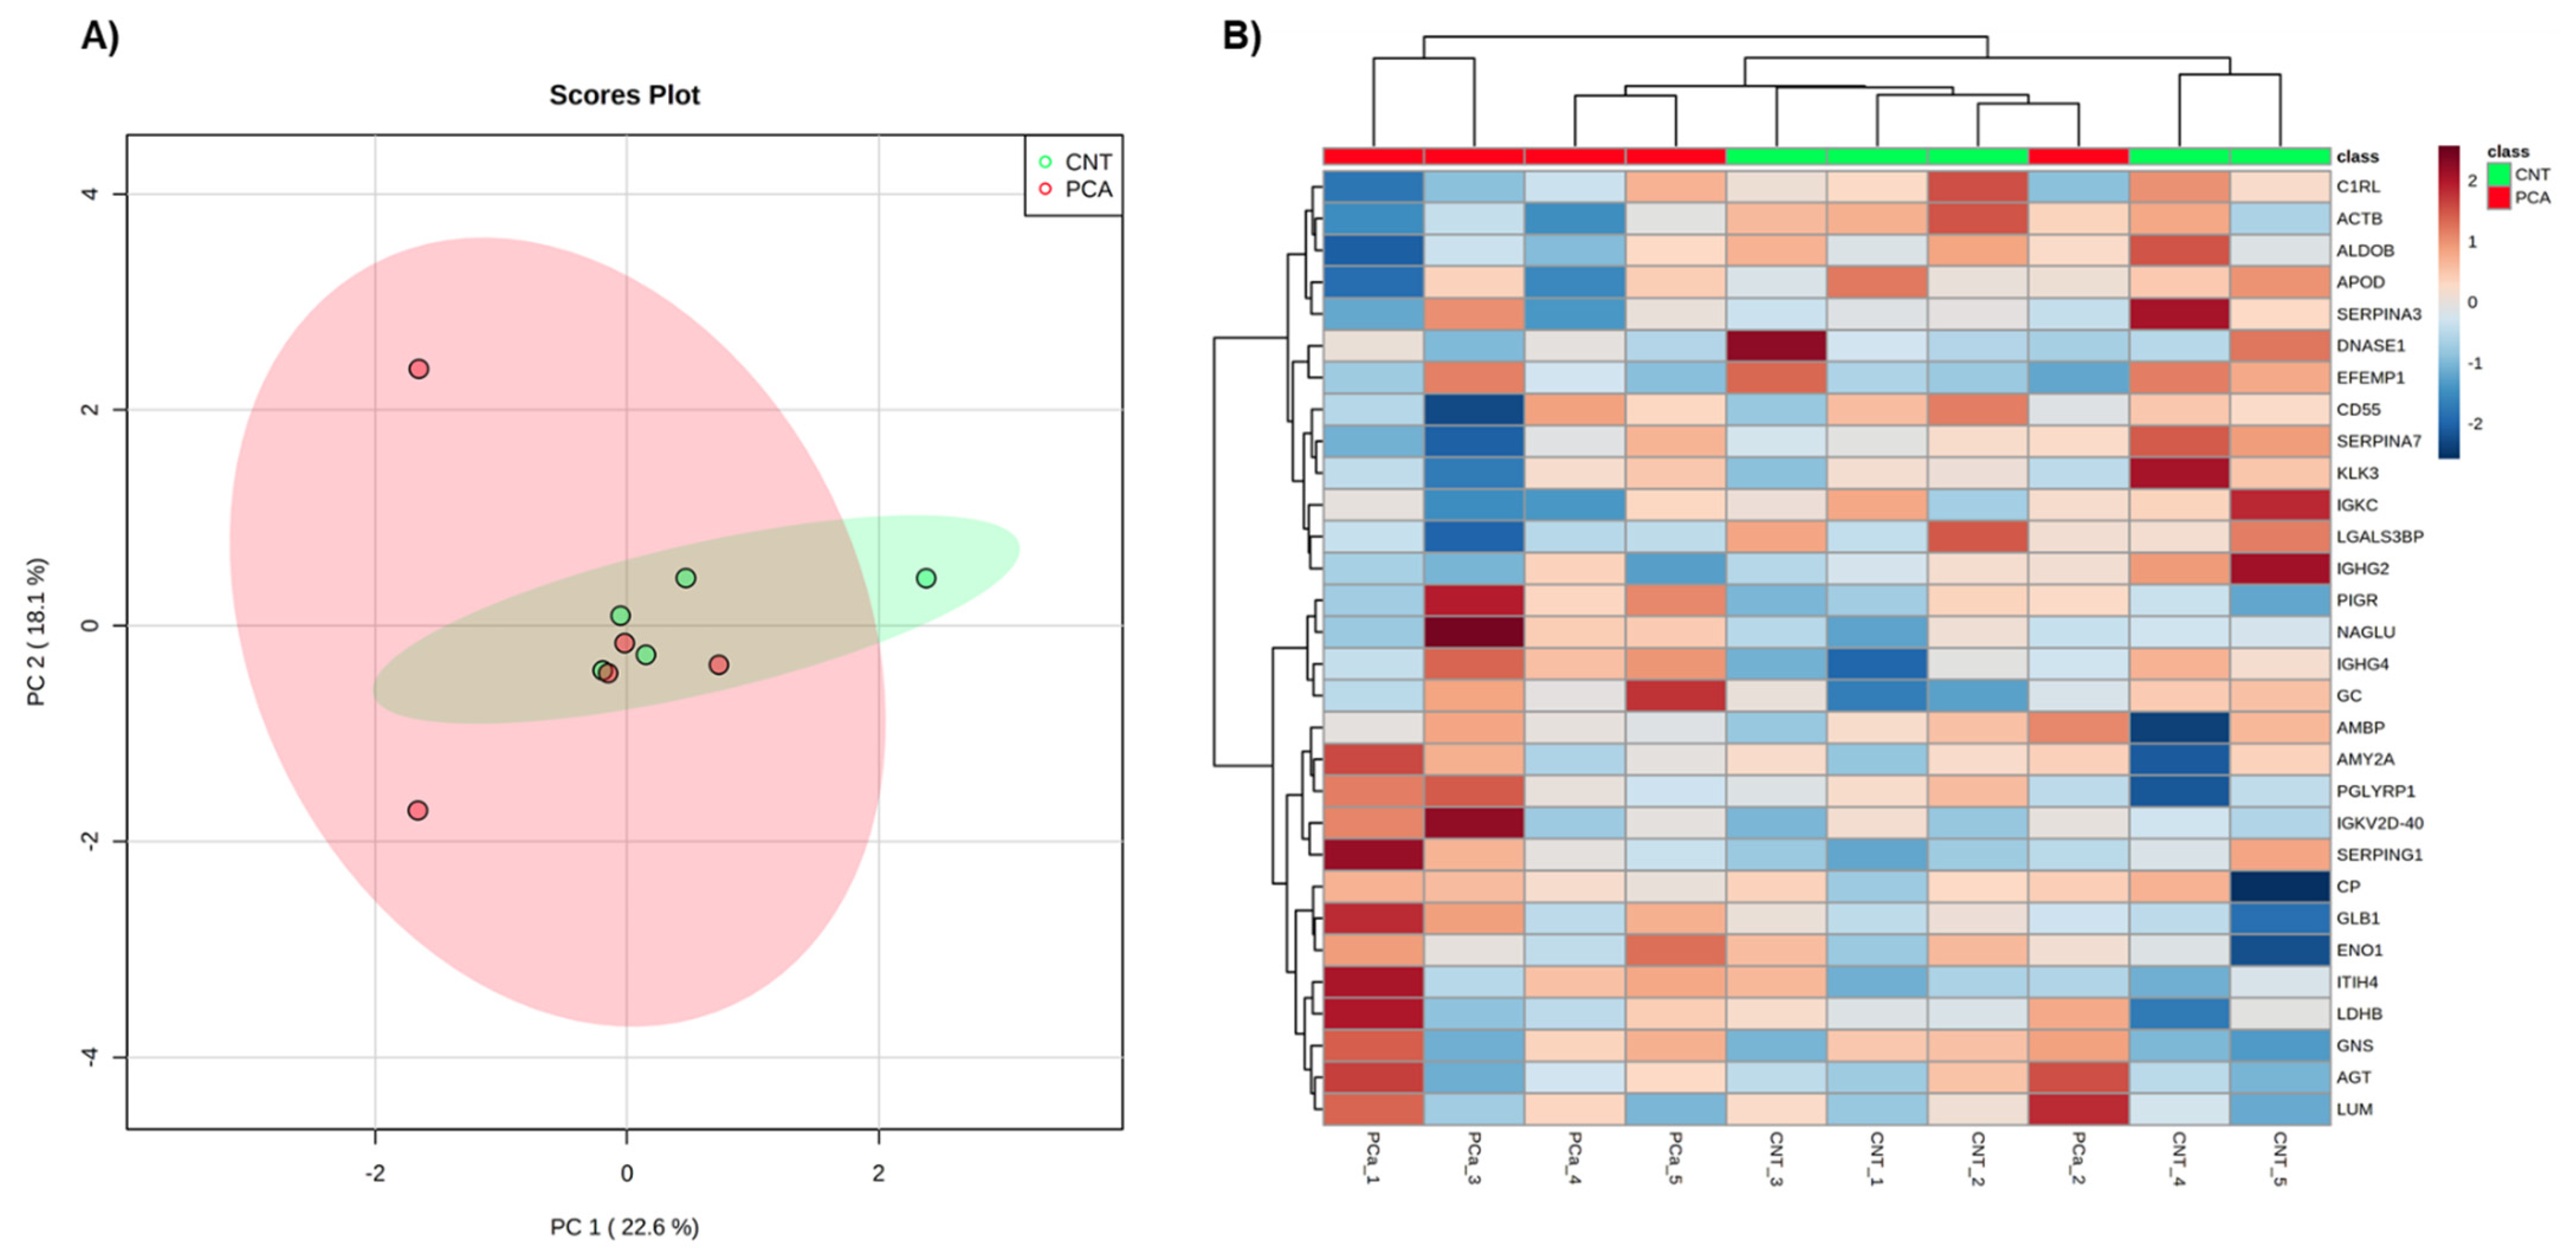
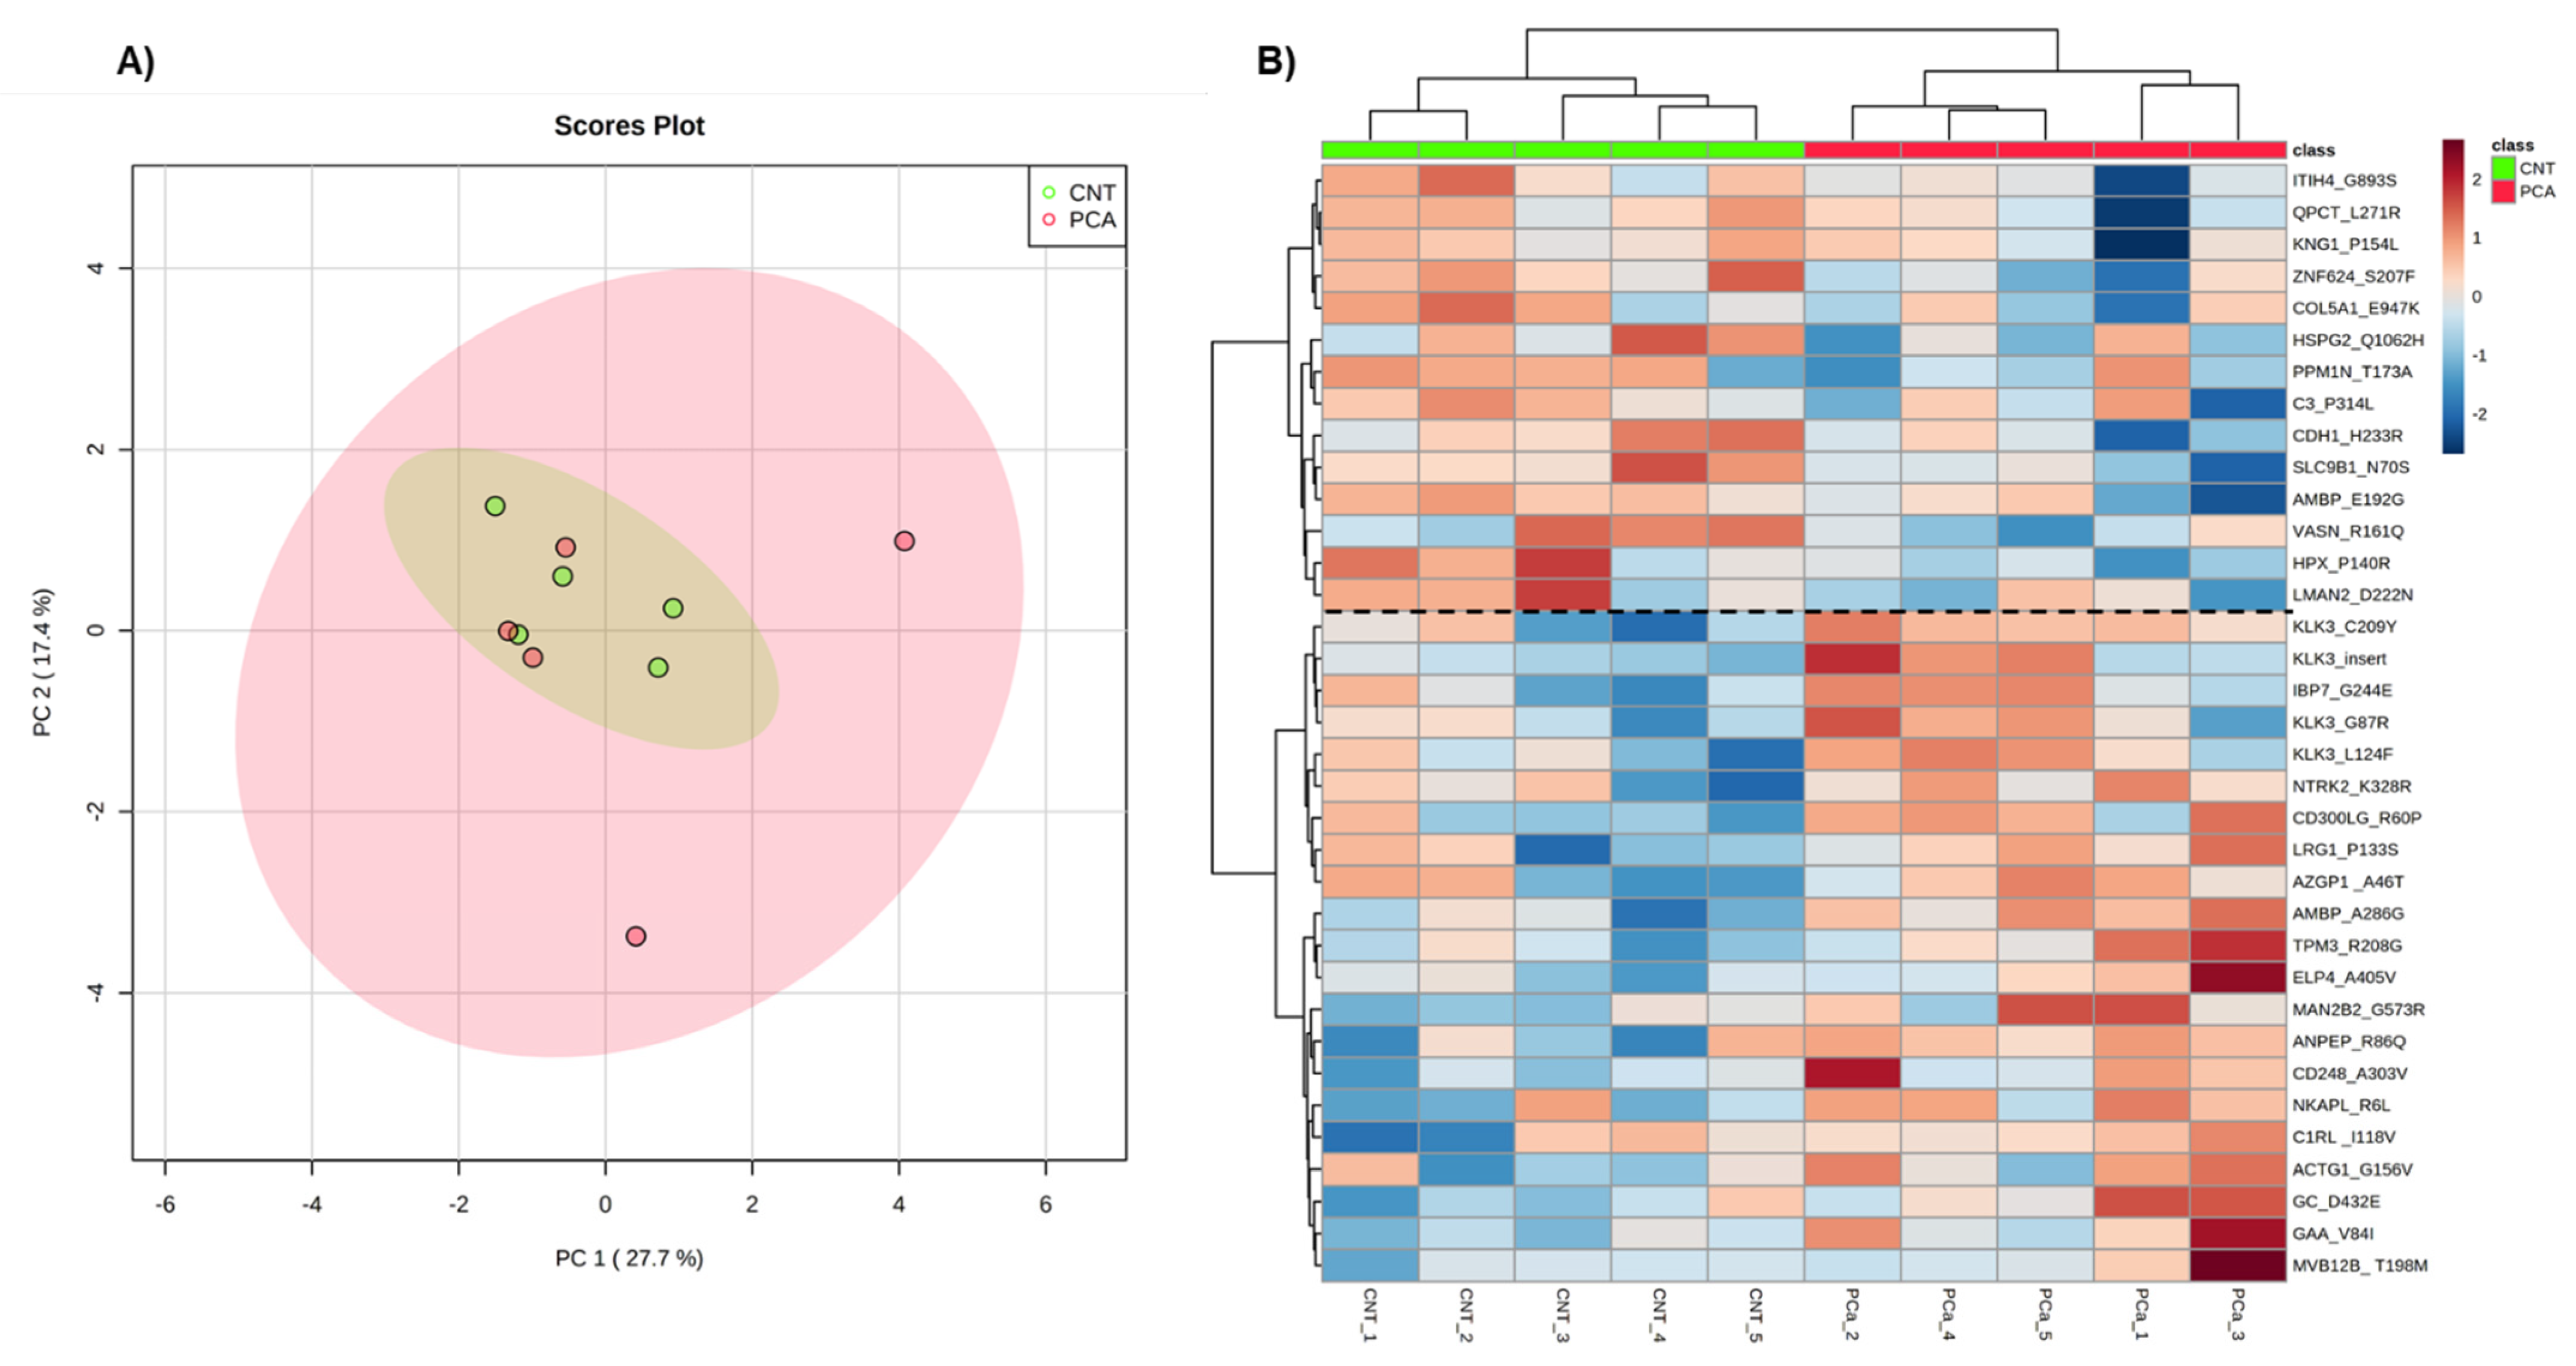
3.2.2. Exploratory Analysis of Urine Proteogenome Data
3.2.3. Integration with the Cancer Genome Atlas (TCGA), DisGeNET and Literature Data
3.2.4. Comparison of the Levels of Native and Mutant Forms of Proteins in the Urine from PCa Patients
3.2.5. Prediction of the Likely Impact of Single-Residue Substitutions in Proteins
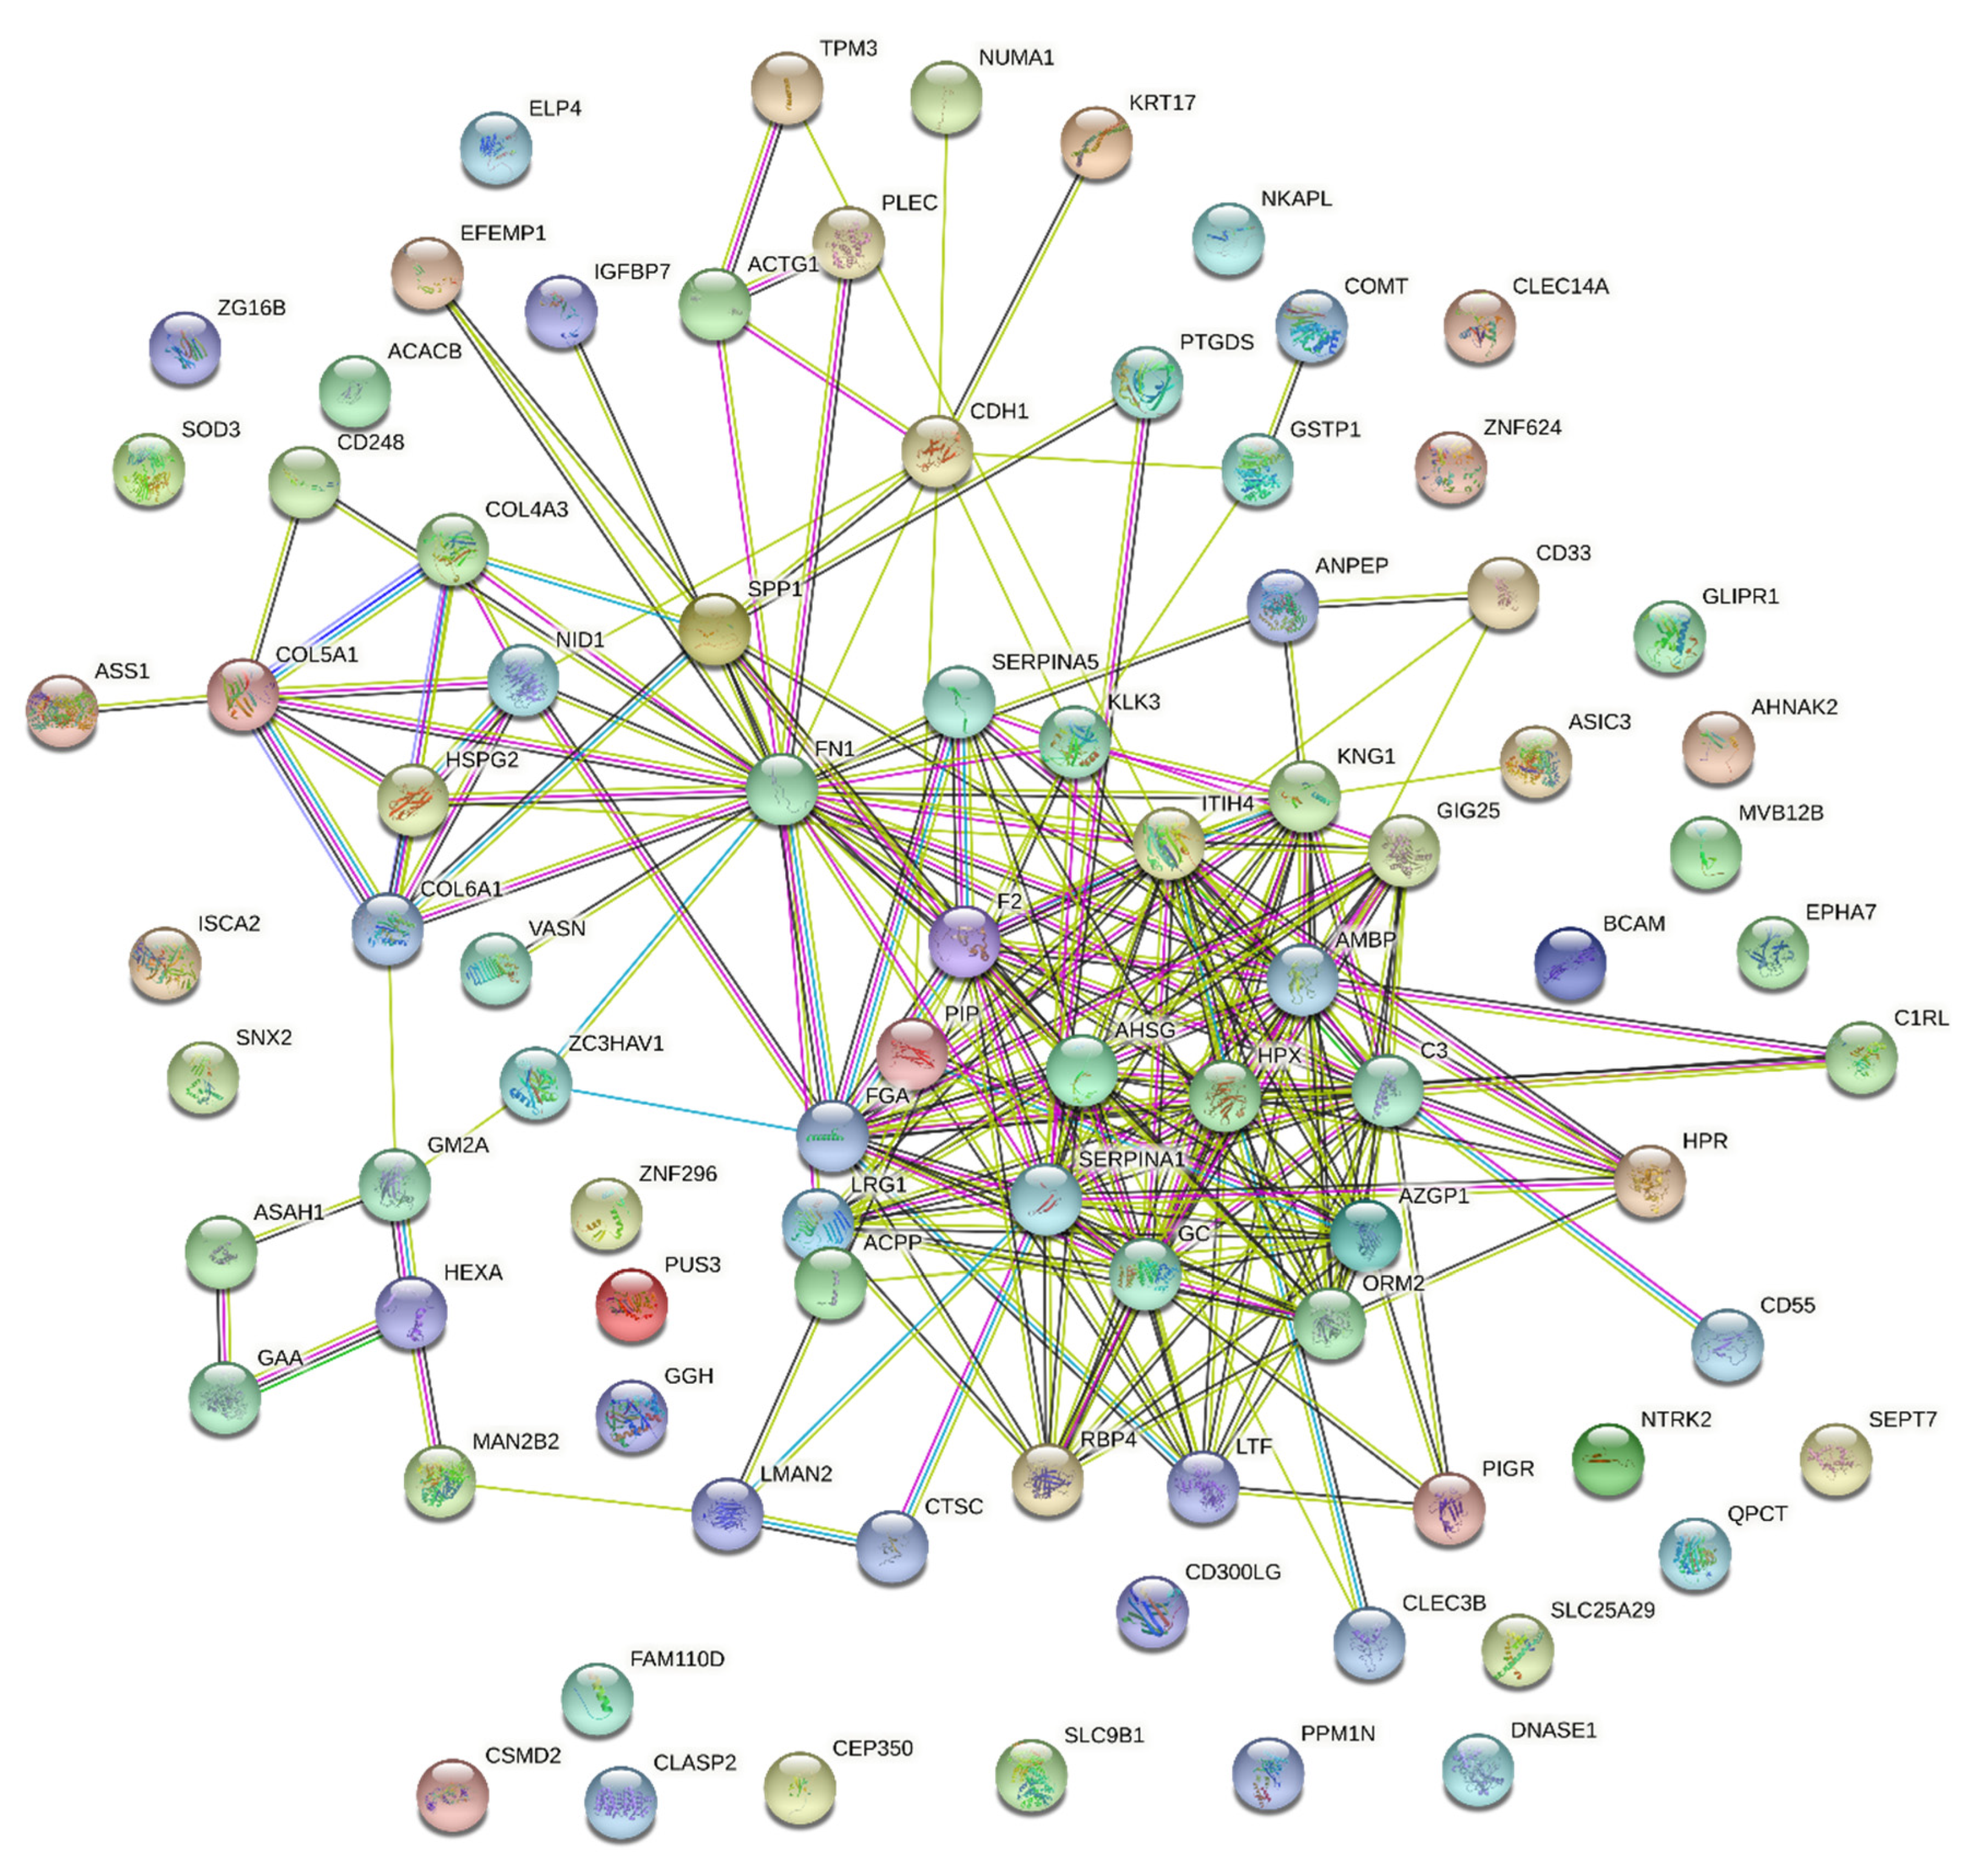
3.2.6. Protein–Protein Interaction Analysis
3.2.7. Prediction of the Likely Impact of Single-Residue Substitutions in Protein–Protein Affinity
4. Discussion
5. Conclusions
Supplementary Materials
Author Contributions
Funding
Institutional Review Board Statement
Informed Consent Statement
Data Availability Statement
Conflicts of Interest
References
- Sung, H.; Ferlay, J.; Siegel, R.L.; Laversanne, M.; Soerjomataram, I.; Jemal, A.; Bray, F. Global cancer statistics 2020: GLOBOCAN estimates of incidence and mortality worldwide for 36 cancers in 185 countries. CA Cancer J. Clin. 2021, 71, 209–249. [Google Scholar] [CrossRef] [PubMed]
- Saini, S. PSA and beyond: Alternative prostate cancer biomarkers. Cell. Oncol. 2016, 39, 97–106. [Google Scholar] [CrossRef] [PubMed] [Green Version]
- Jakobsen, N.A.; Hamdy, F.C.; Bryant, R.J. Novel biomarkers for the detection of prostate cancer. J. Clin. Urol. 2016, 9, 3–10. [Google Scholar] [CrossRef] [PubMed] [Green Version]
- Eskra, J.N.; Daniel, R.; Pavlovich, C.P.; Catalona, W.J.; Luo, J. Approaches to urinary detection of prostate cancer. Prostate Cancer Prostatic Dis. 2019, 22, 362–381. [Google Scholar] [CrossRef]
- Van der Burgt, Y.E.M. Protein biomarker discovery is still relevant and has entered a new phase. eBioMedicine 2019, 43, 15. [Google Scholar] [CrossRef] [Green Version]
- Davalieva, K.; Kiprijanovska, S.; Komina, S.; Petrusevska, G.; Zografska, C.C.; Polenakovic, M. Proteomics analysis of urine reveals acute phase response proteins as candidate diagnostic biomarkers for prostate cancer. Proteome Sci. 2015, 13, 2. [Google Scholar] [CrossRef] [Green Version]
- Garbis, S.D.; Tyritzis, S.I.; Roumeliotis, T.; Zerefos, P.; Giannopoulou, E.G.; Vlahou, A.; Kossida, S.; Diaz, J.; Vourekas, S.; Tamvakopoulos, C.; et al. Search for potential markers for prostate cancer diagnosis, prognosis and treatment in clinical tissue specimens using amine-specific isobaric tagging (iTRAQ) with two-dimensional liquid chromatography and tandem mass spectrometry. J. Proteome Res. 2008, 7, 3146–3158. [Google Scholar] [CrossRef]
- Katafigiotis, I.; Tyritzis, S.I.; Stravodimos, K.G.; Alamanis, C.; Pavlakis, K.; Vlahou, A.; Makridakis, M.; Katafigioti, A.; Garbis, S.D.; Constantinides, C.A. Zinc α2-glycoprotein as a potential novel urine biomarker for the early diagnosis of prostate cancer. BJU Int. 2012, 110, E688–E693. [Google Scholar] [CrossRef]
- Louie, K.S.; Seigneurin, A.; Cathcart, P.; Sasieni, P. Do prostate cancer risk models improve the predictive accuracy of PSA screening? A meta-analysis. Ann. Oncol. 2015, 26, 848–864. [Google Scholar] [CrossRef]
- Blume-Jensen, P.; Berman, D.M.; Rimm, D.L.; Shipitsin, M.; Putzi, M.; Nifong, T.P.; Small, C.; Choudhury, S.; Capela, T.; Coupal, L.; et al. Biology of human tumors development and clinical validation of an in situ biopsy-based multimarker assay for risk stratification in prostate cancer. Clin. Cancer Res. 2015, 17, 372–381. [Google Scholar] [CrossRef] [Green Version]
- Deras, I.L.; Aubin, S.M.J.; Blase, A.; Day, J.R.; Koo, S.; Partin, A.W.; Ellis, W.J.; Marks, L.S.; Fradet, Y.; Rittenhouse, H.; et al. PCA3: A molecular urine assay for predicting prostate biopsy outcome. J. Urol. 2008, 179, 1587–1592. [Google Scholar] [CrossRef] [PubMed]
- Van Neste, L.; Hendriks, R.J.; Dijkstra, S.; Trooskens, G.; Cornel, E.B.; Jannink, S.A.; de Jong, H.; Hessels, D.; Smit, F.P.; Melchers, W.J.G.; et al. Detection of high-grade prostate cancer using a urinary molecular biomarker—Based risk score. Eur. Urol. 2016, 70, 740–748. [Google Scholar] [CrossRef] [PubMed]
- McKiernan, J.; Donovan, M.J.; O’Neill, V.; Bentink, S.; Noerholm, M.; Belzer, S.; Skog, J.; Kattan, M.W.; Partin, A.; Andriole, G.; et al. A novel urine exosome gene expression assay to predict high-grade prostate cancer at initial biopsy. JAMA Oncol. 2016, 2, 882–889. [Google Scholar] [CrossRef] [PubMed] [Green Version]
- Tosoian, J.J.; Dunn, R.L.; Niknafs, Y.S.; Saha, A.; Vince, R.A.; St. Sauver, J.L.; Jacobson, D.J.; McGree, M.E.; Siddiqui, J.; Groskopf, J.; et al. Association of urinary myprostatescore, age, and prostate volume in a longitudinal cohort of healthy men: Long-term findings from the olmsted county study. Eur. Urol. Open Sci. 2021, 29, 30–35. [Google Scholar] [CrossRef]
- Lin, T.; Zhang, T.; Kitata, R.B.; Liu, T.; Smith, R.D.; Qian, W.; Shi, T. Mass spectrometry-based targeted proteomics for analysis of protein mutations. Mass Spectrom. Rev. 2021, e21741. [Google Scholar] [CrossRef]
- Reva, B.; Antipin, Y.; Sander, C. Predicting the functional impact of protein mutations: Application to cancer genomics. Nucleic Acids Res. 2011, 39, e118. [Google Scholar] [CrossRef] [Green Version]
- Sinha, A.; Huang, V.; Livingstone, J.; Wang, J.; Fox, N.S.; Kurganovs, N.; Ignatchenko, V.; Fritsch, K.; Donmez, N.; Heisler, L.E.; et al. The proteogenomic landscape of curable prostate cancer. Cancer Cell 2019, 35, 414–427.e6. [Google Scholar] [CrossRef] [Green Version]
- Lazar, I.M.; Karcini, A.; Ahuja, S.; Estrada-Palma, C. Proteogenomic analysis of protein sequence alterations in breast cancer cells. Sci. Rep. 2019, 9, 10381. [Google Scholar] [CrossRef] [Green Version]
- Mathivanan, S.; Ji, H.; Tauro, B.J.; Chen, Y.S.; Simpson, R.J. Identifying mutated proteins secreted by colon cancer cell lines using mass spectrometry. J. Proteom. 2012, 76, 141–149. [Google Scholar] [CrossRef]
- Zhang, B.; Wang, J.; Wang, X.; Zhu, J.; Liu, Q.; Shi, Z.; Chambers, M.C.; Zimmerman, L.J.; Shaddox, K.F.; Kim, S.; et al. Proteogenomic characterization of human colon and rectal cancer. Nature 2014, 513, 382–387. [Google Scholar] [CrossRef] [Green Version]
- Kwon, O.K.; Jeon, J.M.I.; Sung, E.; Na, A.Y.; Kim, S.J.; Lee, S. Comparative secretome profiling and mutant protein identification in metastatic prostate cancer cells by quantitative mass spectrometry-based proteomics. Cancer Genom. Proteom. 2018, 15, 279–290. [Google Scholar] [CrossRef] [PubMed] [Green Version]
- Kwon, O.K.; Ha, Y.-S.; Lee, J.N.; Kim, S.; Lee, H.; Chun, S.Y.; Kwon, T.G.; Lee, S. Comparative proteome profiling and mutant protein identification in metastatic prostate cancer cells by quantitative mass spectrometry-based proteogenomics. Cancer Genom. Proteom. 2019, 16, 273–286. [Google Scholar] [CrossRef] [PubMed] [Green Version]
- Yang, J.; Roy, R.; Jedinak, A.; Moses, M.A. Mining the human urinary proteome biomarker discovery for human cancer and its metastases. Cancer J. 2015, 21, 327–336. [Google Scholar] [CrossRef] [PubMed]
- Dzieciatkowska, M.; Hill, R.C.; Hansen, K. GeLC-MS/MS analysis of complex protein mixtures. Methods Mol. Biol. 2014, 1156, 53–66. [Google Scholar] [CrossRef]
- Shevchenko, A.; Tomas, H.; Havliš, J.; Olsen, J.V.; Mann, M. In-gel digestion for mass spectrometric characterization of proteins and proteomes. Nat. Protoc. 2007, 1, 2856–2860. [Google Scholar] [CrossRef]
- Perez-Riverol, Y.; Csordas, A.; Bai, J.; Bernal-Llinares, M.; Hewapathirana, S.; Kundu, D.J.; Inuganti, A.; Griss, J.; Mayer, G.; Eisenacher, M.; et al. The PRIDE database and related tools and resources in 2019: Improving support for quantification data. Nucleic Acids Res. 2019, 47, D442–D450. [Google Scholar] [CrossRef]
- Pang, Z.; Chong, J.; Zhou, G.; de Lima Morais, D.A.; Chang, L.; Barrette, M.; Gauthier, C.; Jacques, P.É.; Li, S.; Xia, J. MetaboAnalyst 5.0: Narrowing the gap between raw spectra and functional insights. Nucleic Acids Res. 2021, 49, W388–W396. [Google Scholar] [CrossRef]
- Lima, T.; Henrique, R.; Vitorino, R.; Fardilha, M. Bioinformatic analysis of dysregulated proteins in prostate cancer patients reveals putative urinary biomarkers and key biological pathways. Med. Oncol. 2021, 38, 10381. [Google Scholar] [CrossRef]
- Zhao, M.; Li, M.; Yang, Y.; Guo, Z.; Sun, Y.; Shao, C.; Li, M.; Sun, W.; Gao, Y. A comprehensive analysis and annotation of human normal urinary proteome. Sci. Rep. 2017, 7, 3024. [Google Scholar] [CrossRef]
- Caseiro, A.; Barros, A.; Ferreira, R.; Padrão, A.; Aroso, M.; Quintaneiro, C.; Pereira, A.; Marinheiro, R.; Vitorino, R.; Amado, F. Pursuing type 1 diabetes mellitus and related complications through urinary proteomics. Transl. Res. 2014, 163, 188–199. [Google Scholar] [CrossRef]
- Piñero, J.; Ramírez-Anguita, J.M.; Saüch-Pitarch, J.; Ronzano, F.; Centeno, E.; Sanz, F.; Furlong, L.I. The DisGeNET knowledge platform for disease genomics: 2019 update. Nucleic Acids Res. 2020, 48, D845–D855. [Google Scholar] [CrossRef] [Green Version]
- Adzhubei, I.A.; Schmidt, S.; Peshkin, L.; Ramensky, V.E.; Gerasimova, A.; Bork, P.; Kondrashov, A.S.; Sunyaev, S.R. A method and server for predicting damaging missense mutations. Nat. Methods 2010, 7, 248–249. [Google Scholar] [CrossRef] [Green Version]
- Adzhubei, I.; Jordan, D.M.; Sunyaev, S.R. Predicting functional effect of human missense mutations using PolyPhen-2. Curr. Protoc. Hum. Genet. 2013, 76, 7–20. [Google Scholar] [CrossRef] [Green Version]
- Szklarczyk, D.; Gable, A.L.; Nastou, K.C.; Lyon, D.; Kirsch, R.; Pyysalo, S.; Doncheva, N.T.; Legeay, M.; Fang, T.; Bork, P.; et al. The STRING database in 2021: Customizable protein-protein networks, and functional characterization of user-uploaded gene/measurement sets. Nucleic Acids Res. 2021, 49, D605–D612. [Google Scholar] [CrossRef]
- Li, G.; Pahari, S.; Murthy, A.K.; Liang, S.; Fragoza, R.; Yu, H.; Alexov, E. SAAMBE-SEQ: A sequence-based method for predicting mutation effect on protein-protein binding affinity. Bioinformatics 2021, 37, 992–999. [Google Scholar] [CrossRef]
- Otto, J.J.; Correll, V.L.; Engstroem, H.A.; Hitefield, N.L.; Main, B.P.; Albracht, B.; Johnson-Pais, T.; Yang, L.F.; Liss, M.; Boutros, P.C.; et al. Targeted mass spectrometry of a clinically relevant psa variant from post-DRE urines for quantitation and genotype determination. Proteom. Clin. Appl. 2020, 14, e2000012. [Google Scholar] [CrossRef]
- Santric, V.; Djokic, M.; Suvakov, S.; Pljesa-Ercegovac, M.; Nikitovic, M.; Radic, T.; Acimovic, M.; Stankovic, V.; Bumbasirevic, U.; Milojevic, B.; et al. GSTP1 rs1138272 polymorphism affects prostate cancer risk. Medicina 2020, 56, 128. [Google Scholar] [CrossRef] [Green Version]
- Zhang, Y.; Yuan, Y.; Chen, Y.; Wang, Z.; Li, F.; Zhao, Q. Association between GSTP1 Ile105Val polymorphism and urinary system cancer risk: Evidence from 51 studies. Onco. Targets. Ther. 2016, 9, 3565–3569. [Google Scholar] [CrossRef] [Green Version]
- Gilbert, R.; Bonilla, C.; Metcalfe, C.; Lewis, S.; Evans, D.M.; Fraser, W.D.; Kemp, J.P.; Donovan, J.L.; Hamdy, F.C.; Neal, D.E.; et al. Associations of vitamin D pathway genes with circulating 25-hydroxyvitamin-D, 1, 25-dihydroxyvitamin-D, and prostate cancer: A nested case–control study. Cancer Causes Control. 2015, 26, 205–218. [Google Scholar] [CrossRef] [Green Version]
- Sekikawa, S.; Onda, T.; Miura, N.; Nomura, T.; Takano, N.; Shibahara, T.; Honda, K. Underexpression of α-1-microglobulin/bikunin precursor predicts a poor prognosis in oral squamous cell carcinoma. Int. J. Oncol. 2018, 53, 2605–2614. [Google Scholar] [CrossRef] [Green Version]
- Huang, H.; Han, Y.; Gao, J.; Feng, J.; Zhu, L.; Qu, L.; Shen, L.; Shou, C. High level of serum AMBP is associated with poor response to paclitaxel-capecitabine chemotherapy in advanced gastric cancer patients. Med. Oncol. 2013, 30, 748. [Google Scholar] [CrossRef]
- Fujita, K.; Kume, H.; Matsuzaki, K.; Kawashima, A.; Ujike, T. Proteomic analysis of urinary extracellular vesicles from high Gleason score prostate cancer. Sci. Rep. 2017, 7, 42961. [Google Scholar] [CrossRef] [Green Version]
- Hamm, A.; Veeck, J.; Bektas, N.; Wild, P.J.; Hartmann, A.; Heindrichs, U.; Kristiansen, G.; Werbowetski-Ogilvie, T.; Del Maestro, R.; Knuechel, R.; et al. Frequent expression loss of Inter-alpha-trypsin inhibitor heavy chain (ITIH) genes in multiple human solid tumors: A systematic expression analysis. BMC Cancer 2008, 8, 25. [Google Scholar] [CrossRef] [Green Version]
- Davalieva, K.; Kiprijanovska, S.; Kostovska, I.M.; Stavridis, S.; Stankov, O.; Komina, S.; Petrusevska, G.; Polenakovic, M. Comparative proteomics analysis of urine reveals down-regulation of acute phase response signaling and LXR/RXR activation pathways in prostate cancer. Proteomes 2017, 6, 1. [Google Scholar] [CrossRef] [Green Version]
- Zhao, H.; Zhao, X.; Lei, T.; Zhang, M. Screening, identification of prostate cancer urinary biomarkers and verification of important spots. Invest. New Drugs 2019, 37, 935–947. [Google Scholar] [CrossRef]
- Rodríguez-Blanco, G.; Zeneyedpour, L.; Duijvesz, D.; Marije Hoogland, A.; Verhoef, E.I.; Kweldam, C.F.; Burgers, P.C.; Smitt, P.S.; Bangma, C.H.; Jenster, G.; et al. Tissue proteomics outlines AGR2 AND LOX5 as markers for biochemical recurrence of prostate cancer. Oncotarget 2018, 9, 36444–36456. [Google Scholar] [CrossRef]
- Quanico, J.; Franck, J.; Gimeno, J.P.; Sabbagh, R.; Salzet, M.; Day, R.; Fournier, I. Parafilm-assisted microdissection: A sampling method for mass spectrometry-based identification of differentially expressed prostate cancer protein biomarkers. Chem. Commun. 2015, 51, 4564–4567. [Google Scholar] [CrossRef]
- Khan, A.P.; Poisson, L.M.; Bhat, V.B.; Fermin, D.; Zhao, R.; Kalyana-Sundaram, S.; Michailidis, G.; Nesvizhskii, A.I.; Omenn, G.S.; Chinnaiyan, A.M.; et al. Quantitative proteomic profiling of prostate cancer reveals a role for miR-128 in prostate cancer. Mol. Cell. Proteom. 2010, 9, 298–312. [Google Scholar] [CrossRef] [Green Version]
- Debelec-Butuner, B.; Alapinar, C.; Ertunc, N.; Gonen-Korkmaz, C.; Yörükoğlu, K.; Korkmaz, K.S. TNFα-mediated loss of β-catenin/E-cadherin association and subsequent increase in cell migration is partially restored by NKX3.1 expression in prostate cells. PLoS ONE 2014, 9, e109868. [Google Scholar] [CrossRef] [Green Version]
- Tsui, K.-H.; Lin, Y.-H.; Chung, L.-C.; Chuang, S.-T.; Feng, T.-H.; Chiang, K.-C.; Chang, P.-L.; Yehg, C.-J.; Juang, H.H. Prostate-derived ets factor represses tumorigenesis and modulatesepithelial-to-mesenchymal transition in bladder carcinoma cells. Cancer Lett. 2016, 375, 142–151. [Google Scholar] [CrossRef]
- Li, F.; Pascal, L.E.; Stolz, D.B.; Wang, K.; Zhou, Y.; Chen, W.; Xu, Y.; Chen, Y.; Dhir, R.; Parwani, A.V.; et al. E-cadherin is down-regulated in benign prostate hyperplasia and required for tight junction formation and permeability barrier in prostatic epithelial cell monolayer. Prostate 2020, 79, 1226–1237. [Google Scholar] [CrossRef] [PubMed]
- Shen, H.; Zhang, L.; Zhou, J.; Chen, Z.; Yang, G.; Liao, Y.; Zhu, M. Epidermal growth factor-containing fibulin-like extracellular matrix protein 1 (EFEMP1) acts as a potential diagnostic biomarker for prostate cancer. Med. Sci. Monit. 2017, 23, 216–222. [Google Scholar] [CrossRef] [PubMed] [Green Version]
- Kim, Y.J.; Yoon, H.Y.; Kim, S.K.; Kim, Y.W.; Kim, E.J.; Kim, I.Y.; Kim, W.J. EFEMP1 as a novel DNA methylation marker for prostate cancer: Array-based DNA methylation and expression profiling. Clin. Cancer Res. 2011, 17, 4523–4530. [Google Scholar] [CrossRef] [PubMed] [Green Version]
- Almeida, M.; Costa, V.L.; Costa, N.R.; Ramalho-Carvalho, J.; Baptista, T.; Ribeiro, F.R.; Paulo, P.; Teixeira, M.R.; Oliveira, J.; Lothe, R.A.; et al. Epigenetic regulation of EFEMP1 in prostate cancer: Biological relevance and clinical potential. J. Cell. Mol. Med. 2014, 18, 2287–2297. [Google Scholar] [CrossRef] [PubMed]
- Grindel, B.; Li, Q.; Arnold, R.; Petros, J.; Zayzafoon, M.; Muldoon, M.; Stave, J.; Chung, L.W.K.; Farach-Carson, M.C. Perlecan/HSPG2 and matrilysin/MMP-7 as indices of tissue invasion: Tissue localization and circulating perlecan fragments in a cohort of 288 radical prostatectomy patients. Oncotarget 2016, 7, 10433–10447. [Google Scholar] [CrossRef] [Green Version]
- Savorè, C.; Zhang, C.; Muir, C.; Liu, R.; Wyrwa, J.; Shu, J.; Zhau, H.E.; Chung, L.W.K.; Carson, D.D.; Farach-Carson, M.C. Perlecan knockdown in metastatic prostate cancer cells reduces heparin-binding growth factor responses in vitro and tumor growth in vivo. Clin. Exp. Metastasis 2005, 22, 377–390. [Google Scholar] [CrossRef]
- Whitelock, J.; Melrose, J.; Iozzo, R.V. Diverse cell signaling events modulated by perlecan. Biochemistry 2008, 47, 11174–11183. [Google Scholar] [CrossRef] [Green Version]
- Piñeiro, M.; Andrés, M.; Iturralde, M.; Carmona, S.; Hirvonen, J.; Pyörälä, S.; Heegaard, P.M.H.; Tjørnehøj, K.; Lampreave, F.; Piñeiro, A.; et al. ITIH4 (inter-alpha-trypsin inhibitor heavy chain 4) is a new acute-phase protein isolated from cattle during experimental infection. Infect. Immun. 2004, 72, 3777–3782. [Google Scholar] [CrossRef] [Green Version]
- Huang, M.; Zhang, W.; Zhao, B.; Li, L. Relationship between inter-α-trypsin inhibitor heavy chain 4 and ovarian cancer. Chin. J. Cancer Res. 2019, 31, 955–964. [Google Scholar] [CrossRef]
- Duffy, M.J. Biomarkers for prostate cancer: Prostate-specific antigen and beyond. Clin. Chem. Lab. Med. 2020, 58, 326–339. [Google Scholar] [CrossRef] [Green Version]
- Söllner, T. Adaptor protein CD2AP and L-type lectin LMAN2 regulate exosome cargo protein trafficking through the golgi. J. Biol. Chem. 2016, 291, 25462–25475. [Google Scholar] [CrossRef] [Green Version]
- The L-Type Lectin LMAN2 Is Over-Expressed in Brain Metastatic Breast Cancer. Available online: https://www.sciencegate.app/app/document/full-text#10.31219/osf.io/s3k2n. (accessed on 1 January 2022).
- Potapenko, I.O.; Haakensen, V.D.; Lüders, T.; Helland, Å.; Bukholm, I.; Sørlie, T.; Kristensen, V.N.; Lingjærde, O.C.; Børresen-Dale, A.L. Glycan gene expression signatures in normal and malignant breast tissue; possible role in diagnosis and progression. Mol. Oncol. 2010, 4, 98–118. [Google Scholar] [CrossRef] [PubMed] [Green Version]
- L’Espérance, S.; Popa, I.; Bachvarova, M.; Plante, M.; Patten, N.; Wu, L.; Têtu, B.; Bachvarov, D. Gene expression profiling of paired ovarian tumors obtained prior to and following adjuvant chemotherapy: Molecular signatures of chemoresistant tumors. Int. J. Oncol. 2006, 29, 5–24. [Google Scholar] [CrossRef] [PubMed] [Green Version]
- Thompson, V.C.; Day, T.K.; Bianco-Miotto, T.; Selth, L.A.; Han, G.; Thomas, M.; Buchanan, G.; Scher, H.I.; Nelson, C.C.; Greenberg, N.M.; et al. A gene signature identified using a mouse model of androgen receptor-dependent prostate cancer predicts biochemical relapse in human disease. Int. J. Cancer 2012, 131, 662–672. [Google Scholar] [CrossRef] [PubMed]
- Kim, J.; Yang, P.; Suraokar, M.; Sabichi, A.L.; Llansa, N.D.; Mendoza, G.; Subbarayan, V.; Logothetis, C.J.; Newman, R.A.; Lippman, S.M.; et al. Suppression of prostate tumor cell growth by stromal cell prostaglandin D synthase-derived products. Cancer Res. 2005, 65, 6189–6198. [Google Scholar] [CrossRef] [Green Version]
- Ogretmen, B.; Hannun, Y.A. Biologically active sphingolipids in cancer pathogenesis and treatment. Nat. Rev. Cancer 2004, 4, 604–616. [Google Scholar] [CrossRef]
- Seelan, R.S.; Qian, C.; Yokomizo, A.; Bostwick, D.G.; Smith, D.I.; Liu, W. Human acid ceramidase is overexpressed but not mutated in prostate cancer. Genes Chromosom. Cancer 2000, 29, 137–146. [Google Scholar] [CrossRef]
- Camacho, L.; Meca-Cortés, Ó.; Abad, J.L.; García, S.; Rubio, N.; Díaz, A.; Celiá-Terrassa, T.; Cingolani, F.; Bermudo, R.; Fernández, P.L.; et al. Acid ceramidase as a therapeutic target in metastatic prostate cancer. J. Lipid Res. 2013, 54, 1207–1220. [Google Scholar] [CrossRef] [Green Version]
- Saad, A.F.; Meacham, W.D.; Bai, A.; Anelli, V.; Elojeimy, S.; Mahdy, A.E.M.; Turner, L.S.; Cheng, J.; Bielawska, A.; Bielawski, J.; et al. The functional effects of acid ceramidase overexpression in prostate cancer progression and resistance to chemotherapy. Cancer Biol. Ther. 2007, 6, 1455–1460. [Google Scholar] [CrossRef] [Green Version]
- McCord, J.M.; Edeas, M.A. SOD, oxidative stress and human pathologies: A brief history and a future vision. Biomed. Pharmacother. 2005, 59, 139–142. [Google Scholar] [CrossRef]
- Zheng, S.; Lin, X.; Gan, X.; Wang, X. The impact of SOD3 on prostatic diseases: Elevated SOD3 is a novel biomarker for the diagnosis of chronic nonbacterial prostatiti. Res. Sq. 2021. [Google Scholar] [CrossRef]
- Kim, J.; Mizokami, A.; Shin, M.; Izumi, K.; Konaka, H.; Kadono, Y.; Kitagawa, Y.; Keller, E.T.; Zhang, J.; Namiki, M. SOD3 acts as a tumor suppressor in PC-3 prostate cancer cells via hydrogen peroxide accumulation. Anticancer Res. 2014, 34, 2821–2832. [Google Scholar]
- Allocati, N.; Masulli, M.; Di Ilio, C.; Federici, L. Glutathione transferases: Substrates, inihibitors and pro-drugs in cancer and neurodegenerative diseases. Oncogenesis 2018, 7, 8. [Google Scholar] [CrossRef]
- Lin, X.; Tascilar, M.; Lee, W.H.; Vles, W.J.; Lee, B.H.; Veeraswamy, R.; Asgari, K.; Freije, D.; Van Rees, B.; Gage, W.R.; et al. GSTP1 CpG island hypermethylation is responsible for the absence of GSTP1 expression in human prostate cancer cells. Am. J. Pathol. 2001, 159, 1815–1826. [Google Scholar] [CrossRef] [Green Version]
- Nakayama, M.; Bennett, C.J.; Hicks, J.L.; Epstein, J.I.; Platz, E.A.; Nelson, W.G.; De Marzo, A.M. Hypermethylation of the human glutathione S-transferase-π gene (GSTP1) CpG island is present in a subset of proliferative inflammatory atrophy lesions but not in normal or hyperplastic epithelium of the prostate: A detailed study using laser-capture micro. Am. J. Pathol. 2003, 163, 923–933. [Google Scholar] [CrossRef]
- Brooks, J.D.; Weinstein, M.; Lin, X.; Sun, Y.; Pin, S.S.; Bova, G.S.; Epstein, J.I.; Isaacs, W.B.; Nelson, W.G. CG island methylation changes near the GSTP1 gene in prostatic intraepithelial neoplasia. Cancer Epidemiol. Biomark. Prev. 1998, 7, 531–536. [Google Scholar]
- Badowska-Kozakiewicz, A.M.; Budzik, M.P. The multidirectional role of osteopontin in cancer. Nowotwory 2018, 68, 176–183. [Google Scholar] [CrossRef]
- Khodavirdi, A.C.; Song, Z.; Yang, S.; Zhong, C.; Wang, S.; Wu, H.; Pritchard, C.; Nelson, P.S.; Roy-Burman, P. Increased expression of osteopontin contributes to the progression of prostate cancer. Cancer Res. 2006, 66, 883–888. [Google Scholar] [CrossRef] [Green Version]
- Yu, A.; Guo, K.; Qin, Q.; Xing, C.; Zu, X. Clinicopathological and prognostic significance of osteopontin expression in patients with prostate cancer: A systematic review and meta-analysis. Biosci. Rep. 2021, 41, BSR20203531. [Google Scholar] [CrossRef]
- Wiśniewski, T.; Zyromska, A.; Makarewicz, R.; Zekanowska, E. Osteopontin and angiogenic factors as new biomarkers of prostate cancer. Urol. J. 2019, 16, 134–140. [Google Scholar] [CrossRef]
- Prager, A.J.; Peng, C.R.; Lita, E.; Mcnally, D.; Kaushal, A.; Sproull, M.; Compton, K.; Dahut, W.L.; Figg, W.D.; Citrin, D.; et al. Urinary aHGF, IGFBP3 and OPN as diagnostic and prognostic biomarkers for prostate cancer. Biomark. Med. 2013, 7, 831–841. [Google Scholar] [CrossRef]
- Graddis, T.J.; McMahan, C.J.; Tamman, J.; Page, K.J.; Trager, J.B. Prostatic acid phosphatase expression in human tissues. Int. J. Clin. Exp. Pathol. 2011, 4, 295–306. [Google Scholar] [CrossRef] [Green Version]
- Gutman, B.Y.A.B.; Gutman, E.B. An “acid” phosphatase occurring in the serum of patients with metastasizing carcinoma of the prostate gland. J. Clin. Investig. 1938, 17, 473–478. [Google Scholar] [CrossRef]
- Bing, C.; Bao, Y.; Jenkins, J.; Sanders, P.; Manieri, M.; Cinti, S.; Tisdale, M.J.; Trayhurn, P. Zinc-α2-glycoprotein, a lipid mobilizing factor, is expressed in adipocytes and is up-regulated in mice with cancer cachexia. Proc. Natl. Acad. Sci. USA 2004, 101, 2500–2505. [Google Scholar] [CrossRef] [Green Version]
- Bondar, O.P.; Barnidge, D.R.; Klee, E.W.; Davis, B.J.; Klee, G.G. LC-MS/MS quantification of Zn-α2 glycoprotein: A potential serum biomarker for prostate cancer. Clin. Chem. 2007, 53, 673–678. [Google Scholar] [CrossRef] [Green Version]
- Hale, L.P.; Price, D.T.; Sanchez, L.M.; Demark-Wahnefried, W.; Madden, J.F. Zinc α-2-glycoprotein is expressed by malignant prostatic epithelium and may serve as a potential serum marker for prostate cancer. Clin. Cancer Res. 2001, 7, 846–853. [Google Scholar]
- Chintapalli, V.R.; Kato, A.; Henderson, L.; Hirata, T.; Woods, D.J.; Overend, G.; Davies, S.A.; Romero, M.F.; Dow, J.A.T. Transport proteins NHA1 and NHA2 are essential for survival, but have distinct transport modalities. Proc. Natl. Acad. Sci. USA 2015, 112, 11720–11725. [Google Scholar] [CrossRef] [Green Version]
- Shi, W.; Dong, F.; Jiang, Y.; Lu, L.; Wang, C.; Tan, J.; Yang, W.; Guo, H.; Ming, J.; Huang, T. Construction of prognostic microRNA signature for human invasive breast cancer by integrated analysis. Onco. Targets. Ther. 2019, 12, 1979–2010. [Google Scholar] [CrossRef] [Green Version]
- Cui, F.L.; Mahmud, A.N.; Xu, Z.P.; Wang, Z.Y.; Hu, J.P. VASN promotes proliferation of prostate cancer through the YAP/TAZ axis. Eur. Rev. Med. Pharmacol. Sci. 2020, 24, 6589–6596. [Google Scholar] [CrossRef]
- Dho, S.H.; Lim, J.C.; Kim, L.K. Beyond the role of CD55 as a complement component. Immune Netw. 2018, 18, e11. [Google Scholar] [CrossRef] [Green Version]
- Loberg, R.D.; Day, L.S.L.; Dunn, R.; Kalikin, L.M.; Pienta, K.J. Inhibition of decay-accelerating factor (CD55) attenuates prostate cancer growth and survival in vivo. Neoplasia 2006, 8, 69–78. [Google Scholar] [CrossRef] [Green Version]
- Kuefer, R.; Hofer, M.D.; Gschwend, J.E.; Pienta, K.J.; Sanda, M.G.; Chinnaiyan, A.M.; Rubin, M.A.; Day, M.L. The role of an 80 kDa fragment of E-cadherin in the metastatic progression of prostate cancer. Clin. Cancer Res. 2003, 9, 6447–6452. [Google Scholar]
- Iacopino, F.; Pinto, F.; Bertaccini, A.; Calarco, A.; Proietti, G.; Totaro, A.; Martorana, G.; Bassi, P.; Sica, G. Soluble E-cadherin and IL-6 serum levels in patients affected by prostate cancer before and after prostatectomy. Oncol. Rep. 2012, 28, 370–374. [Google Scholar] [CrossRef] [Green Version]
- Banks, R.E.; Porter, W.H.; Whelan, P.; Smith, P.H.; Selby, P.J. Soluble forms of the adhesion molecule E-cadherin in urine. J. Clin. Pathol. 1995, 48, 179–180. [Google Scholar] [CrossRef] [Green Version]
- Katayama, M.; Hirai, S.; Yasumoto, M.; Nishikawa, K.; Nagata, S.; Otsuka, M.; Kato, I.; Kamihagi, K. Soluble fragments of E-cadherin cell adhesion molecule increase in urinary excretion of cancer patients, potentially indicating its shedding from epithelial tumor cells. Int. J. Oncol. 1994, 5, 1049–1057. [Google Scholar] [CrossRef]
- Tsaur, I.; Thurn, K.; Juengel, E.; Gust, K.M.; Borgmann, H.; Mager, R.; Bartsch, G.; Oppermann, E.; Ackermann, H.; Nelson, K.; et al. sE-cadherin serves as a diagnostic and predictive parameter in prostate cancer patients. J. Exp. Clin. Cancer Res. 2015, 34, 43. [Google Scholar] [CrossRef] [Green Version]
- Kuefer, R.; Hofer, M.D.; Zorn, C.S.M.; Engel, O.; Volkmer, B.G.; Juarez-Brito, M.A.; Eggel, M.; Gschwend, J.E.; Rubin, M.A.; Day, M.L. Assessment of a fragment of e-cadherin as a serum biomarker with predictive value for prostate cancer. Br. J. Cancer 2005, 92, 2018–2023. [Google Scholar] [CrossRef] [Green Version]
- Duijvesz, D.; Versluis, C.Y.L.; Van Der Fels, C.A.M.; Vredenbregt-Van Den Berg, M.S.; Leivo, J.; Peltola, M.T.; Bangma, C.H.; Pettersson, K.S.I.; Jenster, G. Immuno-based detection of extracellular vesicles in urine as diagnostic marker for prostate cancer. Int. J. Cancer 2015, 137, 2869–2878. [Google Scholar] [CrossRef]
- Xu, H.; Wang, F.; Li, H.; Ji, J.; Cao, Z.; Lyu, J.; Shi, X.; Zhu, Y.; Zhang, C.; Guo, F. Prostatic acid phosphatase (PAP) predicts prostate cancer progress in a population-based study: The renewal of PAP? Dis. Markers. 2019, 2019, 7090545. [Google Scholar] [CrossRef]
- Fang, L.C.; Dattoli, M.; Taira, A.; True, L.; Sorace, R.; Wallner, K. Prostatic Acid Phosphatase Adversely Affects Cause-Specific Survival in Patients with Intermediate to High-Risk Prostate Cancer Treated with Brachytherapy. Urology 2008, 71, 146–150. [Google Scholar] [CrossRef]
- Alpert, E.; Akhavan, A.; Gruzman, A.; Hansen, W.J.; Lehrer-Graiwer, J.; Hall, S.C.; Johansen, E.; McAllister, S.; Gulati, M.; Lin, M.-F.; et al. Multifunctionality of prostatic acid phosphatase in prostate cancer pathogenesis. Biosci. Rep. 2021, 41, BSR20211646. [Google Scholar] [CrossRef]
- Kote-Jarai, Z.; Amin Al Olama, A.; Leongamornlert, D.; Tymrakiewicz, M.; Saunders, E.; Guy, M.; Giles, G.G.; Severi, G.; Southey, M.; Hopper, J.L.; et al. Identification of a novel prostate cancer susceptibility variant in the KLK3 gene transcript. Hum. Genet. 2011, 129, 687–694. [Google Scholar] [CrossRef] [Green Version]
- Parikh, H.; Wang, Z.; Pettigrew, K.A.; Jia, J.; Daugherty, S.; Yeager, M.; Jacobs, K.B.; Hutchinson, A.; Burdett, L.; Cullen, M.; et al. Fine mapping the KLK3 locus on chromosome 19q13.33 associated with prostate cancer susceptibility and PSA levels. Hum. Genet. 2011, 129, 675–685. [Google Scholar] [CrossRef] [Green Version]
- Gudmundsson, J.; Besenbacher, S.; Sulem, P.; Gudbjartsson, D.F.; Olafsson, I.; Arinbjarnarson, S.; Agnarsson, B.A.; Benediktsdottir, K.R.; Isaksson, H.J.; Kostic, J.P.; et al. Genetic correction of PSA values using sequence variants associated with PSA levels. Sci. Transl. Med. 2010, 2, 62ra92. [Google Scholar] [CrossRef] [Green Version]
- Cotignola, J.; Leonardi, D.B.; Shahabi, A.; Acuña, A.D.; Stern, M.C.; Navone, N.; Scorticati, C.; De Siervi, A.; Mazza, O.; Vazquez, E. Glutathione-S-transferase (GST) polymorphisms are associated with relapse after radical prostatectomy. Prostate Cancer Prostatic Dis. 2013, 16, 28–34. [Google Scholar] [CrossRef]
- Oskina, N.A.; Ermolenko, N.A.; Boyarskih, U.A.; Lazarev, A.F.; Petrova, V.D.; Ganov, D.I.; Tonacheva, O.G.; Lifschitz, G.I.; Filipenko, M.L. Associations between SNPs within antioxidant genes and the risk of prostate cancer in the Siberian region of Russia. Pathol. Oncol. Res. 2014, 20, 635–640. [Google Scholar] [CrossRef]
- Gulfidan, G.; Turanli, B.; Beklen, H.; Sinha, R.; Arga, K.Y. Pan-cancer mapping of differential protein-protein interactions. Sci. Rep. 2020, 10, 3272. [Google Scholar] [CrossRef]
- Engin, B.H.; Guney, E.; Keskin, O.; Oliva, B.; Gursoy, A. Integrating structure to protein-protein interaction networks that drive metastasis to brain and lung in breast cancer. PLoS ONE 2013, 8, e81035. [Google Scholar] [CrossRef] [Green Version]
- Matos, B.; Howl, J.; Jerónimo, C.; Fardilha, M. The disruption of protein-protein interactions as a therapeutic strategy for prostate cancer. Pharmacol. Res. 2020, 161, 105145. [Google Scholar] [CrossRef]
- Foulstone, E.; Prince, S.; Zaccheo, O.; Burns, J.L.; Harper, J.; Jacobs, C.; Church, D.; Hassan, A.B. Insulin-like growth factor ligands, receptors, and binding proteins in cancer. J. Pathol. 2005, 205, 145–153. [Google Scholar] [CrossRef]
- Chatterjee, S.; Sung Park, E.; Soloff, M.S. Proliferation of DU145 prostate cancer cells is inhibited by suppressing insulin-like growth factor binding protein-2. Int. J. Urol. 2004, 11, 876–884. [Google Scholar] [CrossRef]
- Hellawell, G.O.; Turner, G.D.H.; Davies, D.R.; Poulsom, R.; Brewster, S.F.; Macaulay, V.M. Expression of the type 1 insulin-like growth factor receptor is up-regulated in primary prostate cancer and commonly persists in metastatic disease. Cancer Res. 2002, 62, 2942–2950. [Google Scholar]
- Wolk, A.; Mantzoros, C.S.; Andersson, S.O.; Bergström, R.; Signorello, L.B.; Lagiou, P.; Adami, H.O.; Trichopoulos, D. Insulin-like growth factor 1 and prostate cancer risk: A population- based, case-control study. J. Natl. Cancer Inst. 1998, 90, 911–915. [Google Scholar] [CrossRef] [Green Version]
- Heidegger, I.; Kern, J.; Ofer, P.; Klocker, H.; Massoner, P. Oncogenic functions of IGF1R and INSR in prostate cancer include enhanced tumor growth, cell migration and angiogenesis. Oncotarget 2014, 5, 2723–2735. [Google Scholar] [CrossRef] [Green Version]
- Datta, M.W.; Hernandez, A.M.; Schlicht, M.J.; Kahler, A.J.; DeGueme, A.M.; Dhir, R.; Shah, R.B.; Farach-Carson, C.; Barrett, A.; Datta, S. Perlecan, a candidate gene for the CAPB locus, regulates prostate cancer cell growth via the Sonic Hedgehog pathway. Mol. Cancer 2006, 5, 9. [Google Scholar] [CrossRef] [Green Version]
- Mongiat, M.; Sweeney, S.M.; San Antonio, J.D.; Fu, J.; Iozzo, R.V. Endorepellin, a novel inhibitor of angiogenesis derived from the C terminus of perlecan. J. Biol. Chem. 2003, 278, 4238–4249. [Google Scholar] [CrossRef] [Green Version]
- Gonzalez, E.M.; Reed, C.C.; Bix, G.; Fu, J.; Zhang, Y.; Gopalakrishnan, B.; Greenspan, D.S.; Iozzo, R.V. BMP-1/Tolloid-like metalloproteases process endorepellin, the angiostatic C-terminal fragment of perlecan. J. Biol. Chem. 2005, 280, 7080–7087. [Google Scholar] [CrossRef] [Green Version]
- Bix, G.; Castello, R.; Burrows, M.; Zoeller, J.J.; Weech, M.; Iozzo, R.A.; Cardi, C.; Thakur, M.L.; Barker, C.A.; Camphausen, K.; et al. Endorepellin in vivo: Targeting the tumor vasculature and retarding cancer growth and metabolism. J. Natl. Cancer Inst. 2006, 98, 1634–1646. [Google Scholar] [CrossRef]
- Chang, J.W.; Kang, U.B.; Kim, D.H.; Yi, J.K.; Lee, J.W.; Noh, D.Y.; Lee, C.; Yu, M.H. Identification of circulating endorepellin LG3 fragment: Potential use as a serological biomarker for breast cancer. Proteom.-Clin. Appl. 2008, 2, 23–32. [Google Scholar] [CrossRef]
- Parker, T.J.; Sampson, D.L.; Broszczak, D.; Chng, Y.L.; Carter, S.L.; Leavesley, D.I.; Parker, A.W.; Upton, Z. A fragment of the LG3 peptide of endorepellin is present in the urine of physically active mining workers: A potential marker of physical activity. PLoS ONE 2012, 7, e33714. [Google Scholar] [CrossRef] [Green Version]
- Oda, O.; Shinzato, T.; Ohbayashi, K.; Takai, I.; Kunimatsu, M.; Maeda, K.; Yamanaka, N. Purification and characterization of perlecan fragment in urine of end-stage renal failure patients. Clin. Chim. Acta 1996, 255, 119–132. [Google Scholar] [CrossRef]
- Venning, F.A.; Wullkopf, L.; Erler, J.T. Targeting ECM disrupts cancer progression. Front. Oncol. 2015, 5, 224. [Google Scholar] [CrossRef] [Green Version]
- Kobayashi, H.; Shinohara, H.; Fujie, M.; Gotoh, J.; Itoh, M.; Takeuchi, K.; Terao, T. Inhibition of metastasis of lewis lung carcinoma by urinary trypsin inhibitor in experimental and spontaneous metastasis models. Int. J. Cancer 1995, 63, 455–462. [Google Scholar] [CrossRef]
- Suzuki, M.; Kobayashi, H.; Tanaka, Y.; Hirashima, Y.; Kanayama, N.; Takei, Y.; Saga, Y.; Suzuki, M.; Itoh, H.; Terao, T. Suppression of invasion and peritoneal carcinomatosis of ovarian cancer cell line by overexpression of bikunin. Int. J. Cancer 2003, 104, 289–302. [Google Scholar] [CrossRef] [Green Version]
- Geller, A.; Yan, J. The role of membrane bound complement regulatory proteins in tumor development and cancer immunotherapy. Front. Immunol. 2019, 10, 1074. [Google Scholar] [CrossRef] [Green Version]
- Ikeda, Y.; Imai, Y.; Kumagai, H.; Nosaka, T.; Morikawa, Y.; Hisaoka, T.; Manabe, I.; Maemura, K.; Nakaoka, T.; Imamura, T.; et al. Vasorin, a transforming growth factor β-binding protein expressed in vascular smooth muscle cells, modulates the arterial response to injury in vivo. Proc. Natl. Acad. Sci. USA 2004, 101, 10732–10737. [Google Scholar] [CrossRef] [Green Version]
- Zhang, M.; Zhang, Y.Y.; Chen, Y.; Wang, J.; Wang, Q.; Lu, H. TGF-β Signaling and Resistance to Cancer Therapy. Front. Cell Dev. Biol. 2021, 9, 786728. [Google Scholar] [CrossRef]
- Malapeira, J.; Esselens, C.; Bech-Serra, J.J.; Canals, F.; Arribas, J. ADAM17 (TACE) regulates TGFΒ signaling through the cleavage of vasorin. Oncogene 2011, 30, 1912–1922. [Google Scholar] [CrossRef] [Green Version]


| Uniprot ID | Protein Name | Gene Name | p-Value | Cohen’s d [Lower; Upper 95% CI] |
|---|---|---|---|---|
| P07288 | Prostate-specific antigen | KLK3 | 0.00 | 4.21 (3.50; 4.91) |
| Q8WVN6 | Secreted and transmembrane protein 1 | SECTM1 | 0.01 | −2.16 (−2.39; −1.93) |
| P12830 | Cadherin-1 | CDH1 | 0.03 | −1.73 (−2.05; −1.41) |
| P0DOX5 | Immunoglobulin gamma-1 heavy chain | N/A | 0.03 | 1.73 (1.39; 2.07) |
| Q12805 | EGF-containing fibulin-like extracellular matrix protein 1 | EFEMP1 | 0.03 | −1.68 (−2.25; −1.12) |
| P02766 | Transthyretin | TTR | 0.03 | 1.66 (0.86; 2.46) |
| P01861 | Immunoglobulin heavy constant gamma 4 | IGHG4 | 0.04 | 1.52 (0.90; 2.15) |
| P01034 | Cystatin-C | CST3 | 0.05 | 1.50 (0.91; 2.08) |
| Q01459 | Di-N-acetylchitobiase | CTBS | 0.05 | −1.44 (−1.86; −1.02) |
| Uniprot ID | Protein Name | Gene Name | p-Value | Cohen’s d [Lower; Upper 95% CI] |
|---|---|---|---|---|
| Q8WVN6 | Secreted and transmembrane protein 1 | SECTM1 | 0.01 | −2.10 (−2.48; −1.73) |
| P07288 | Prostate-specific antigen | KLK3 | 0.01 | 2.01 (1.08; 2.95) |
| P41222 | Prostaglandin-H2 D-isomerase | PTGDS | 0.01 | −1.97 (−2.44; −1.49) |
| Q14624 | Inter-alpha-trypsin inhibitor heavy chain H4 | ITIH4 | 0.01 | −1.96 (−2.32; −1.60) |
| Q12805 | EGF-containing fibulin-like extracellular matrix protein 1 | EFEMP1 | 0.01 | −1.84 (−2.33; −1.35) |
| P55290 | Cadherin-13 | CDH13 | 0.02 | −1.75 (−2.11; −1.40) |
| P98160 | Basement membrane-specific heparan sulfate proteoglycan core protein | HSPG2 | 0.03 | −1.63 (−2.07; −1.19) |
| P04746 | Pancreatic alpha -amylase | AMY2A | 0.03 | −1.57 (−1.95; −1.19) |
| P01876 | Immunoglobulin heavy constant alpha 1 | IGHA1 | 0.04 | 1.55 (1.32; 1.78) |
| P02760 | Protein AMBP | AMBP | 0.04 | −1.51 (−1.88; −1.13) |
| P12830 | Cadherin-1 | CDH1 | 0.05 | −1.48 (−1.90; −1.07) |
| Q12907 | Vesicular integral-membrane protein VIP36 | LMAN2 | 0.05 | −1.46 (−2.10; −0.83) |
| Q9NPP6 | Immunoglobulin heavy chain variant | N/A | 0.04 | 1.58 (1.22; 1.93) |
| P02766 | Transthyretin | TTR | 0.05 | 1.42 (0.97; 1.87) |
| Uniprot ID | Protein Name | Gene Name | Mutation Description | Mutation Type | Protein Role in PCa or Other Types of Cancer |
|---|---|---|---|---|---|
| P02760 | Protein AMBP | AMBP | G238S; E192G; V69M; A286G; P197S; R185Q; G338S; G341A; I198T; V313I; G186R; R185Q | missense | AMBP is an inflammation-regulating protein, associated with human cancers [40,41], including PCa [42,43]. Increased urinary levels [6,42,44,45] but diminished levels in tumor prostate tissue have been reported in PCa patients [46,47,48]. |
| P12830 | Cadherin-1 | CDH1 | H233R; A408E | missense | CDH1 is a protein implicated in cell adhesion, migration, and epithelial-mesenchymal transition [49,50] and its downregulation is correlated with a poor prognosis in PCa patients [51]. |
| Q12805 | EGF-containing fibulin-like extracellular matrix protein 1 | EFEMP1 | V463M | missense | EFMP1 plays a role in cell adhesion and migration, acting as a tumor suppressor in PCa. Diminished EFEMP1 mRNA and protein levels [52] and EFEMP1 promoter hypermethylation were observed in PCa patients [53,54]. |
| P98160 | Basement membrane-specific heparan sulfate proteoglycan core protein | HSPG2 | V4332I; A1503V; S970F; M638V; Q1062H | missense | HSPG2, found predominantly in the ECM and bone marrow, modulates tumor angiogenesis, proliferation, and differentiation. It is overexpressed in PCa tissues compared to non-malignant tissues, correlating with high GS and PCa cell proliferation and viability [55,56,57]. |
| Q14624 | Inter-alpha-trypsin inhibitor heavy chain H4 | ITIH4 | R866C; G893S | missense | ITIH4 is an acute-phase response protein whose function remains unclear [58]. Research points to a tumor suppressor activity of ITIH4 in human cancers and dysregulation in PCa [43,59]. |
| P07288 | Prostate-specific antigen (PSA) | KLK3 | C209Y; V55M; G156V; AVCG (47–50); S117P; G87R; L124F; A154T; I179T | Missense; inframe_insertion | PSA is widely used as serum biomarker for PCa. It was approved by the US Food and Drug Administration (FDA) in 1994 [60]. |
| Q12907 | Vesicular integral-membrane protein VIP36 | LMAN2 | G250S; D229N | missense | LMAN2 protein is involved in endoplasmic reticulum to Golgi trafficking of some glycoproteins [61]. Dysregulation of the LMAN2 gene has been indicated in some cancers [62,63,64], while the role in PCa remains obscure. However, raised LMAN2 urinary levels were detected in PCa patients [44]. |
| P41222 | Prostaglandin-H2 D-isomerase | PTGDS | L130M | missense | PTGDS is involved in prostaglandins metabolism and lipid transport. The PTGDS gene is downregulated in malignant prostate tissues compared to non-malignant tissues and integrates a signature that predicts relapse after prostatectomy. In vitro, its overexpression increased death and suppressed the growth of PCa cells [65,66]. |
| Q13510 | Acid ceramidase | ASAH1 | V246A | missense | ASAH1 hydrolyzes ceramide to sphingosine and fatty acid [67] and its protein levels are elevated in tumor prostate tissue [68]. Its increased levels have been suggested as a therapeutic target in PCa as they have been correlated with metastasis establishment and resistance to chemotherapy [69,70]. |
| P08294 | Extracellular superoxide dismutase [Cu-Zn] | SOD3 | A58T | missense | SOD3 is a known tumor suppressor gene in PCa. It is an antioxidant enzyme that catalyzes the dismutation of the superoxide radical anion [71]. SOD3-reduced levels were reported in PCa patients, and its overexpression in PCa cells prevented cell proliferation, migration, and invasion, suggesting a role as a therapeutic target and predictive marker [72,73]. |
| P09211 | Glutathione S-transferase P | GSTP1 | I105V | missense | GSTP1 is a known tumor suppressor gene in PCa and is responsible for cellular detoxification through glutathione conjugation [74]. PCa is characterized by loss of GSTP1 function, mostly due to hypermethylation of its regulatory CpG island [75], and it is purported to occur early in prostatic carcinogenesis [76,77]. |
| P10451 | Osteopontin | SPP1 | A22G | missense | SPP1 is a bone matrix protein involved in bone remodeling, modulation of inflammation, cell adhesion, and migration and angiogenesis [78]. In PCa, SPP1 is associated with metastasis and proliferation [79], lower overall survival and biochemical relapse-free survival, and high GS [80]. Higher SPP1 levels were reported in PCa patients [80,81,82]. |
| P15309 | Prostatic acid phosphatase | PAP | G68D | missense | PAP is one of the main secreted proteins by the prostate cells and was the first serum screening marker for PCa. PAP was latter replaced by PSA [83,84]. |
| P25311 | Zinc-alpha-2-glycoprotein | ZAG | P187L; A46T | missense | ZAG promotes adipocyte lipolysis, resulting in cancer cachexia [85]. Elevated levels of this protein have been proposed as a serum marker for PCa [86,87], and a significant predictive ability was found for urinary ZAG [8]. |
| Q4ZJI4 | Sodium/hydrogen exchanger 9B1 | SLC9B1 | N70S | missense | SLC9B1 is a Na+/H+ transporter responsible for preserving cellular homeostasis [88], but this transporter has not yet been correlated with any type of cancer. |
| Q9P2J8 | Zinc finger protein 624 | ZNF624 | S207F | missense | ZNF624 has not been well studied yet, but in breast cancer was one of the target genes of a microRNA found to be significantly and independently correlated with patient prognosis [89]. |
| Q6EMK4 | Vasorin | VASN | R161Q | missense | VASN, an inhibitor of TGF-beta signaling, is upregulated in PCa tissues and stimulates PCa proliferation [90]. |
| P08174 | Complement decay-accelerating factor | CD55 | S162L | missense | CD55 inhibits the complement system [91]. In PCa, CD55 mediates tumor cells survival and growth [92]. |
| Gene Name | Mutation | Prediction | Score | Sensitivity | Specificity |
|---|---|---|---|---|---|
| AMBP | G238S | Probably damaging | 1.000 | 0.00 | 1.00 |
| AMBP | E192G | Probably damaging | 0.75 | 0.981 | 0.96 |
| AMBP | V69M | Possibly damaging | 0.758 | 0.85 | 0.92 |
| AMBP | A286G | Probably damaging | 1.000 | 0.00 | 1.00 |
| AMBP | P197S | Benign | 0.051 | 0.94 | 0.83 |
| AMBP | G338S | Probably damaging | 0.994 | 0.69 | 0.97 |
| AMBP | G341A | Probably damaging | 0.958 | 0.78 | 0.95 |
| AMBP | V313I | Benign | 0.025 | 0.95 | 0.81 |
| AMBP | G186R | Probably damaging | 1.000 | 0.00 | 1.00 |
| AMBP | R185Q | Probably damaging | 0.992 | 0.70 | 0.97 |
| CDH1 | H233R | Possibly damaging | 0.831 | 0.84 | 0.93 |
| CDH1 | A408E | Possibly damaging | 0.798 | 0.84 | 0.93 |
| EFEMP1 | V463M | Probably damaging | 0.999 | 0.14 | 0.99 |
| HSPG2 | V4332I | Benign | 0.001 | 0.99 | 0.15 |
| HSPG2 | A1503V | Probably damaging | 1.00 | 0.00 | 1.00 |
| HSPG2 | S970F | Possibly damaging | 0.498 | 0.88 | 0.90 |
| HSPG2 | M638V | Benign | 0.00 | 1.00 | 0.00 |
| HSPG2 | Q1062H | Benign | 0.00 | 1.00 | 0.00 |
| ITIH4 | R866C | Probably damaging | 1 | 0.00 | 1.00 |
| ITIH4 | G893S | Benign | 0.00 | 1.00 | 0.00 |
| KLK3 | C209Y | Probably damaging | 1.000 | 0.00 | 1.00 |
| KLK3 | G156V | Probably damaging | 1.000 | 0.00 | 1.00 |
| KLK3 | V55M | Probably damaging | 0.972 | 0.77 | 0.96 |
| KLK3 | S117P | Possibly damaging | 0.621 | 0.87 | 0.91 |
| KLK3 | G87R | Benign | 0.128 | 0.93 | 0.86 |
| KLK3 | L124F | Probably damaging | 1.000 | 0.00 | 1.00 |
| KLK3 | A154T | Possibly damaging | 0.657 | 0.86 | 0.91 |
| KLK3 | I 179T | Possibly damaging | 0.800 | 0.84 | 0.93 |
| LMAN2 | G250S | Probably damaging | 1.00 | 0.00 | 1.00 |
| LMAN2 | D229N | Probably damaging | 0.983 | 0.74 | 0.96 |
| PTGDS | L130M | Probably damaging | 1.00 | 0.00 | 1.00 |
| ASAH1 | V246A | Benign | 0.00 | 1.00 | 0.00 |
| SOD3 | A58T | Benign | 0.188 | 0.92 | 0.87 |
| GSTP1 | I105V | Benign | 0.00 | 1.00 | 0.00 |
| SPP1 | A22G | Possibly damaging | 0.611 | 0.87 | 0.91 |
| ACP3 | G68D | Probably damaging | 1.00 | 0.00 | 1.00 |
| AZGP1 | P187L | Probably damaging | 0.94 | 0.69 | 0.97 |
| AZGP1 | A46T | Benign | 0.002 | 0.99 | 0.30 |
| SLC9B1 | N70S | Benign | 0.036 | 0.94 | 0.82 |
| ZNF624 | S207F | Benign | 0.214 | 0.92 | 0.88 |
| VASN | R161Q | Benign | 0.019 | 0.95 | 0.80 |
| CD55 | S162L | Probably damaging | 0.990 | 0.72 | 0.97 |
Publisher’s Note: MDPI stays neutral with regard to jurisdictional claims in published maps and institutional affiliations. |
© 2022 by the authors. Licensee MDPI, Basel, Switzerland. This article is an open access article distributed under the terms and conditions of the Creative Commons Attribution (CC BY) license (https://creativecommons.org/licenses/by/4.0/).
Share and Cite
Lima, T.; Barros, A.S.; Trindade, F.; Ferreira, R.; Leite-Moreira, A.; Barros-Silva, D.; Jerónimo, C.; Araújo, L.; Henrique, R.; Vitorino, R.; et al. Application of Proteogenomics to Urine Analysis towards the Identification of Novel Biomarkers of Prostate Cancer: An Exploratory Study. Cancers 2022, 14, 2001. https://doi.org/10.3390/cancers14082001
Lima T, Barros AS, Trindade F, Ferreira R, Leite-Moreira A, Barros-Silva D, Jerónimo C, Araújo L, Henrique R, Vitorino R, et al. Application of Proteogenomics to Urine Analysis towards the Identification of Novel Biomarkers of Prostate Cancer: An Exploratory Study. Cancers. 2022; 14(8):2001. https://doi.org/10.3390/cancers14082001
Chicago/Turabian StyleLima, Tânia, António S. Barros, Fábio Trindade, Rita Ferreira, Adelino Leite-Moreira, Daniela Barros-Silva, Carmen Jerónimo, Luís Araújo, Rui Henrique, Rui Vitorino, and et al. 2022. "Application of Proteogenomics to Urine Analysis towards the Identification of Novel Biomarkers of Prostate Cancer: An Exploratory Study" Cancers 14, no. 8: 2001. https://doi.org/10.3390/cancers14082001