
Heterogeneity of Synchronous Lung Metastasis Calls for Risk Stratification and Prognostic Classification: Evidence from a Population-Based Database

 ,
,  , ,
, ,
Abstract
:Simple Summary
Abstract
1. Introduction
2. Materials and Methods
2.1. Eligible Patients
2.2. Tumor Classification and Statistical Analyses
3. Results
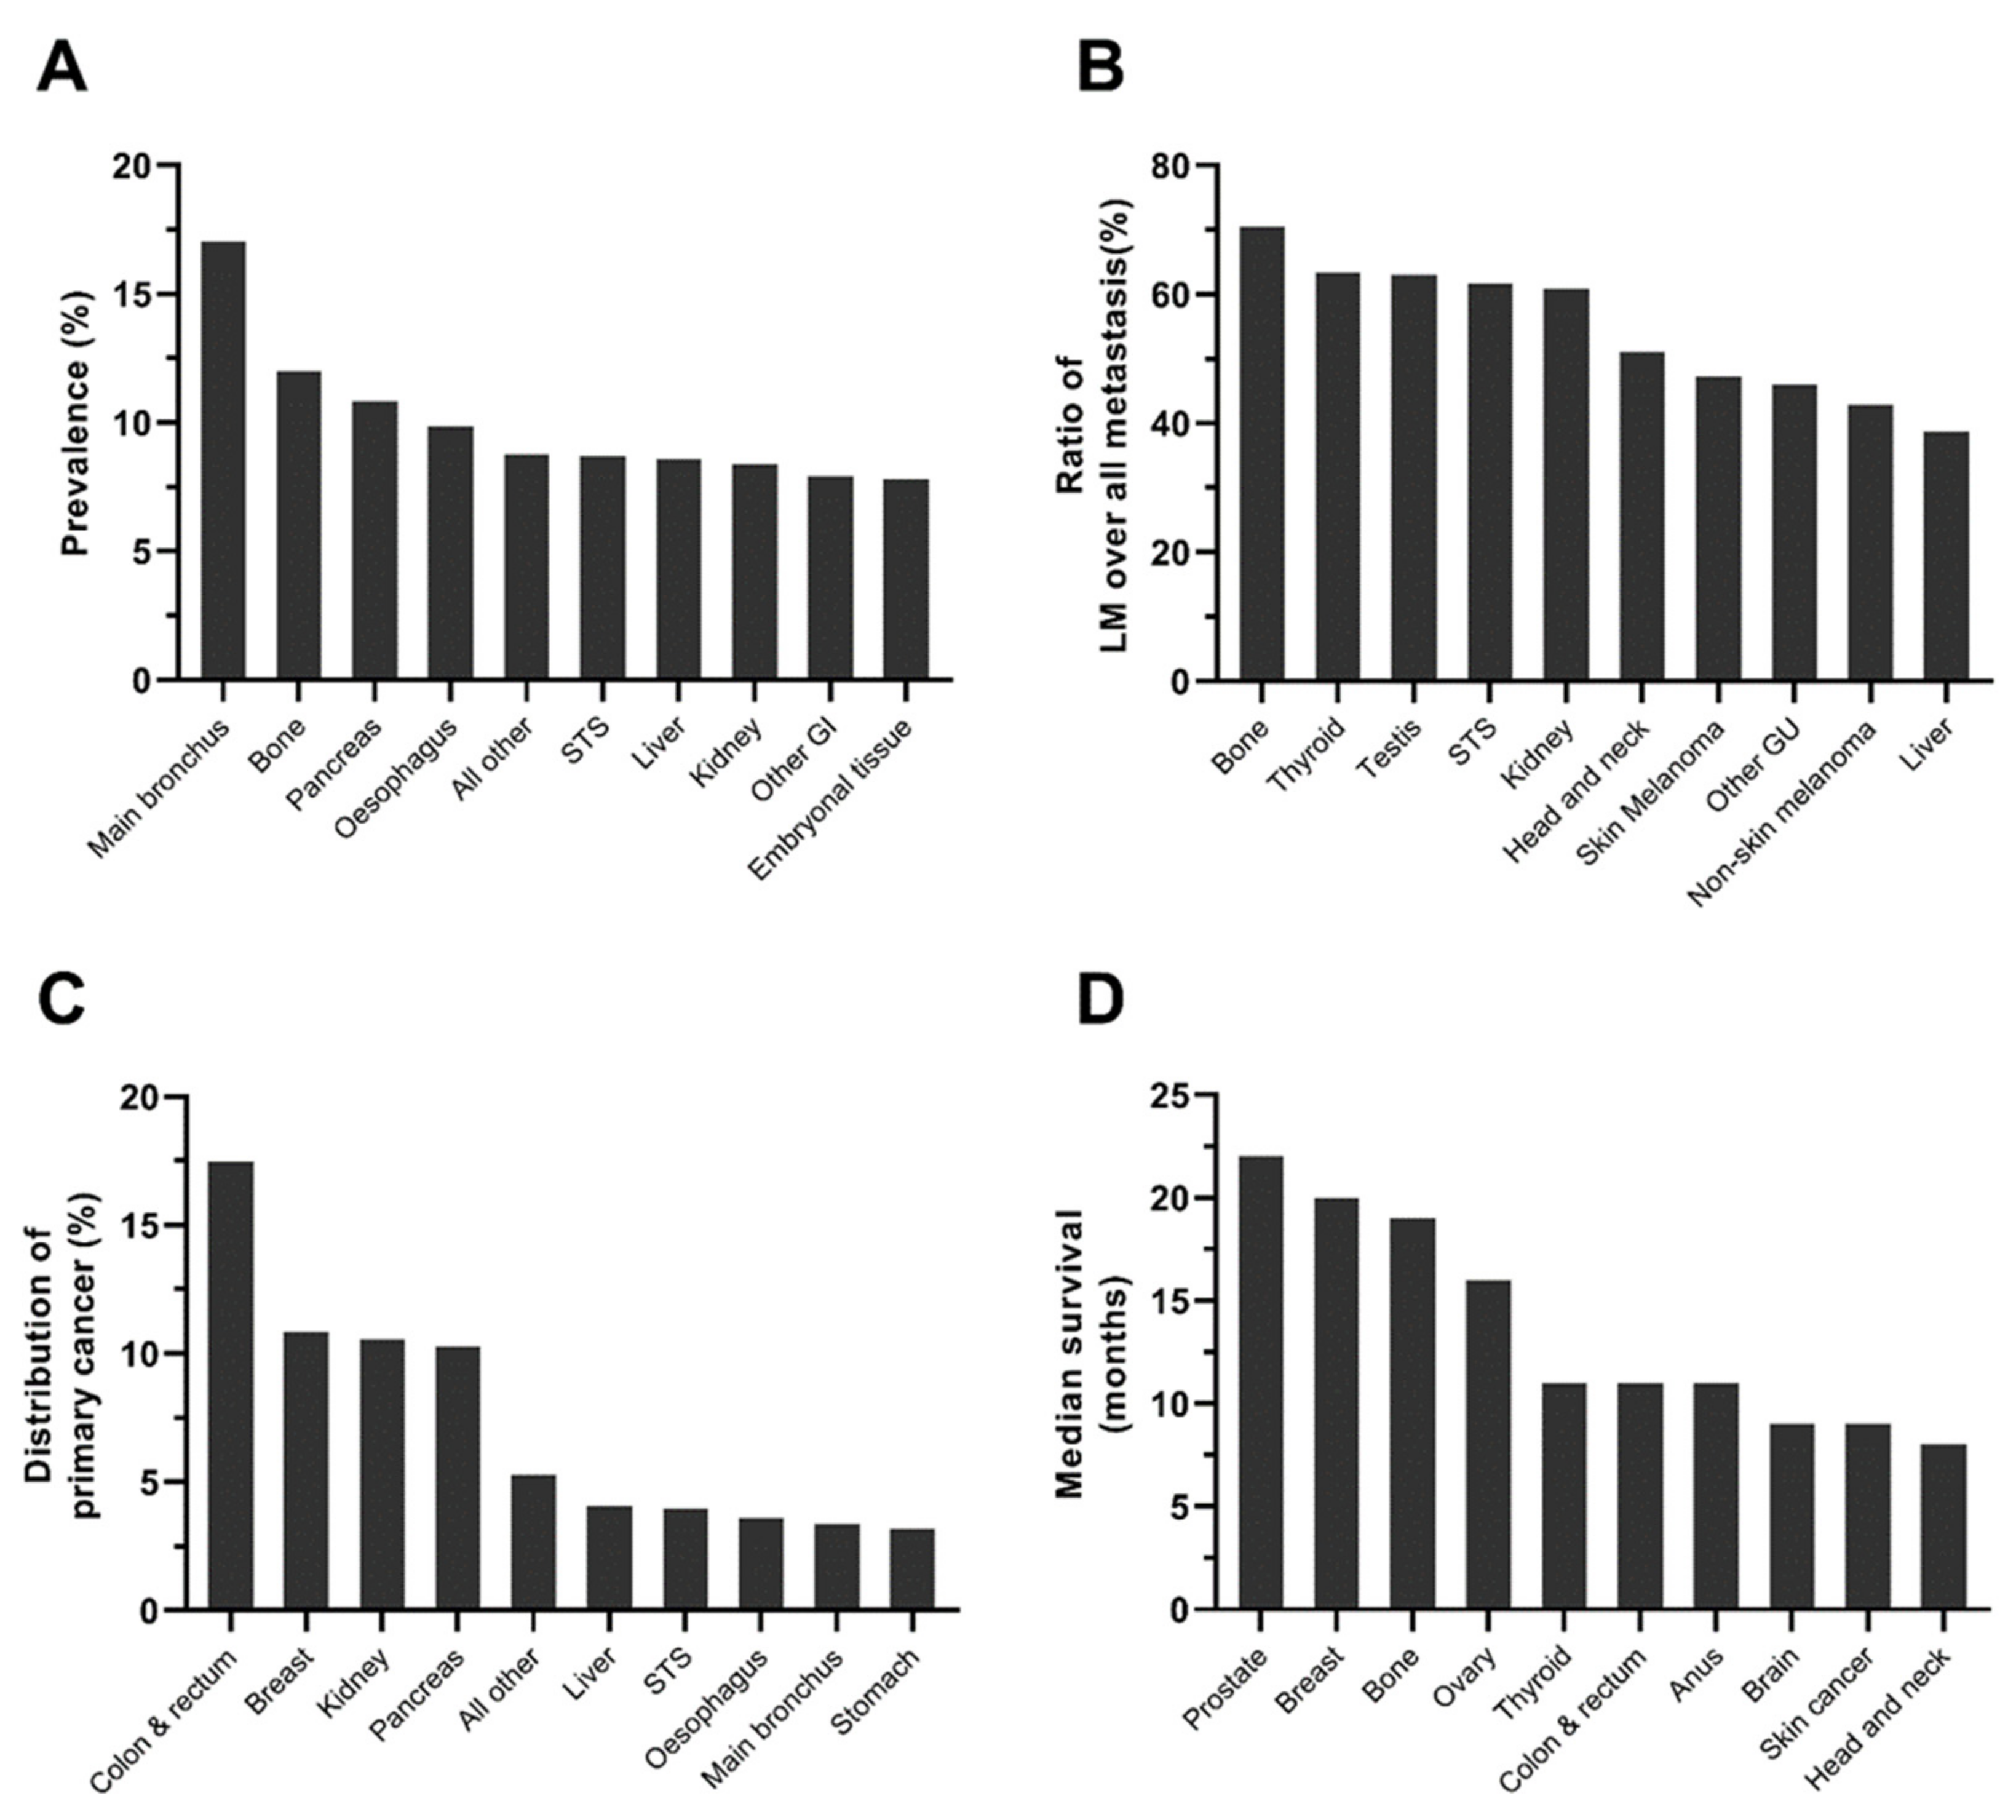
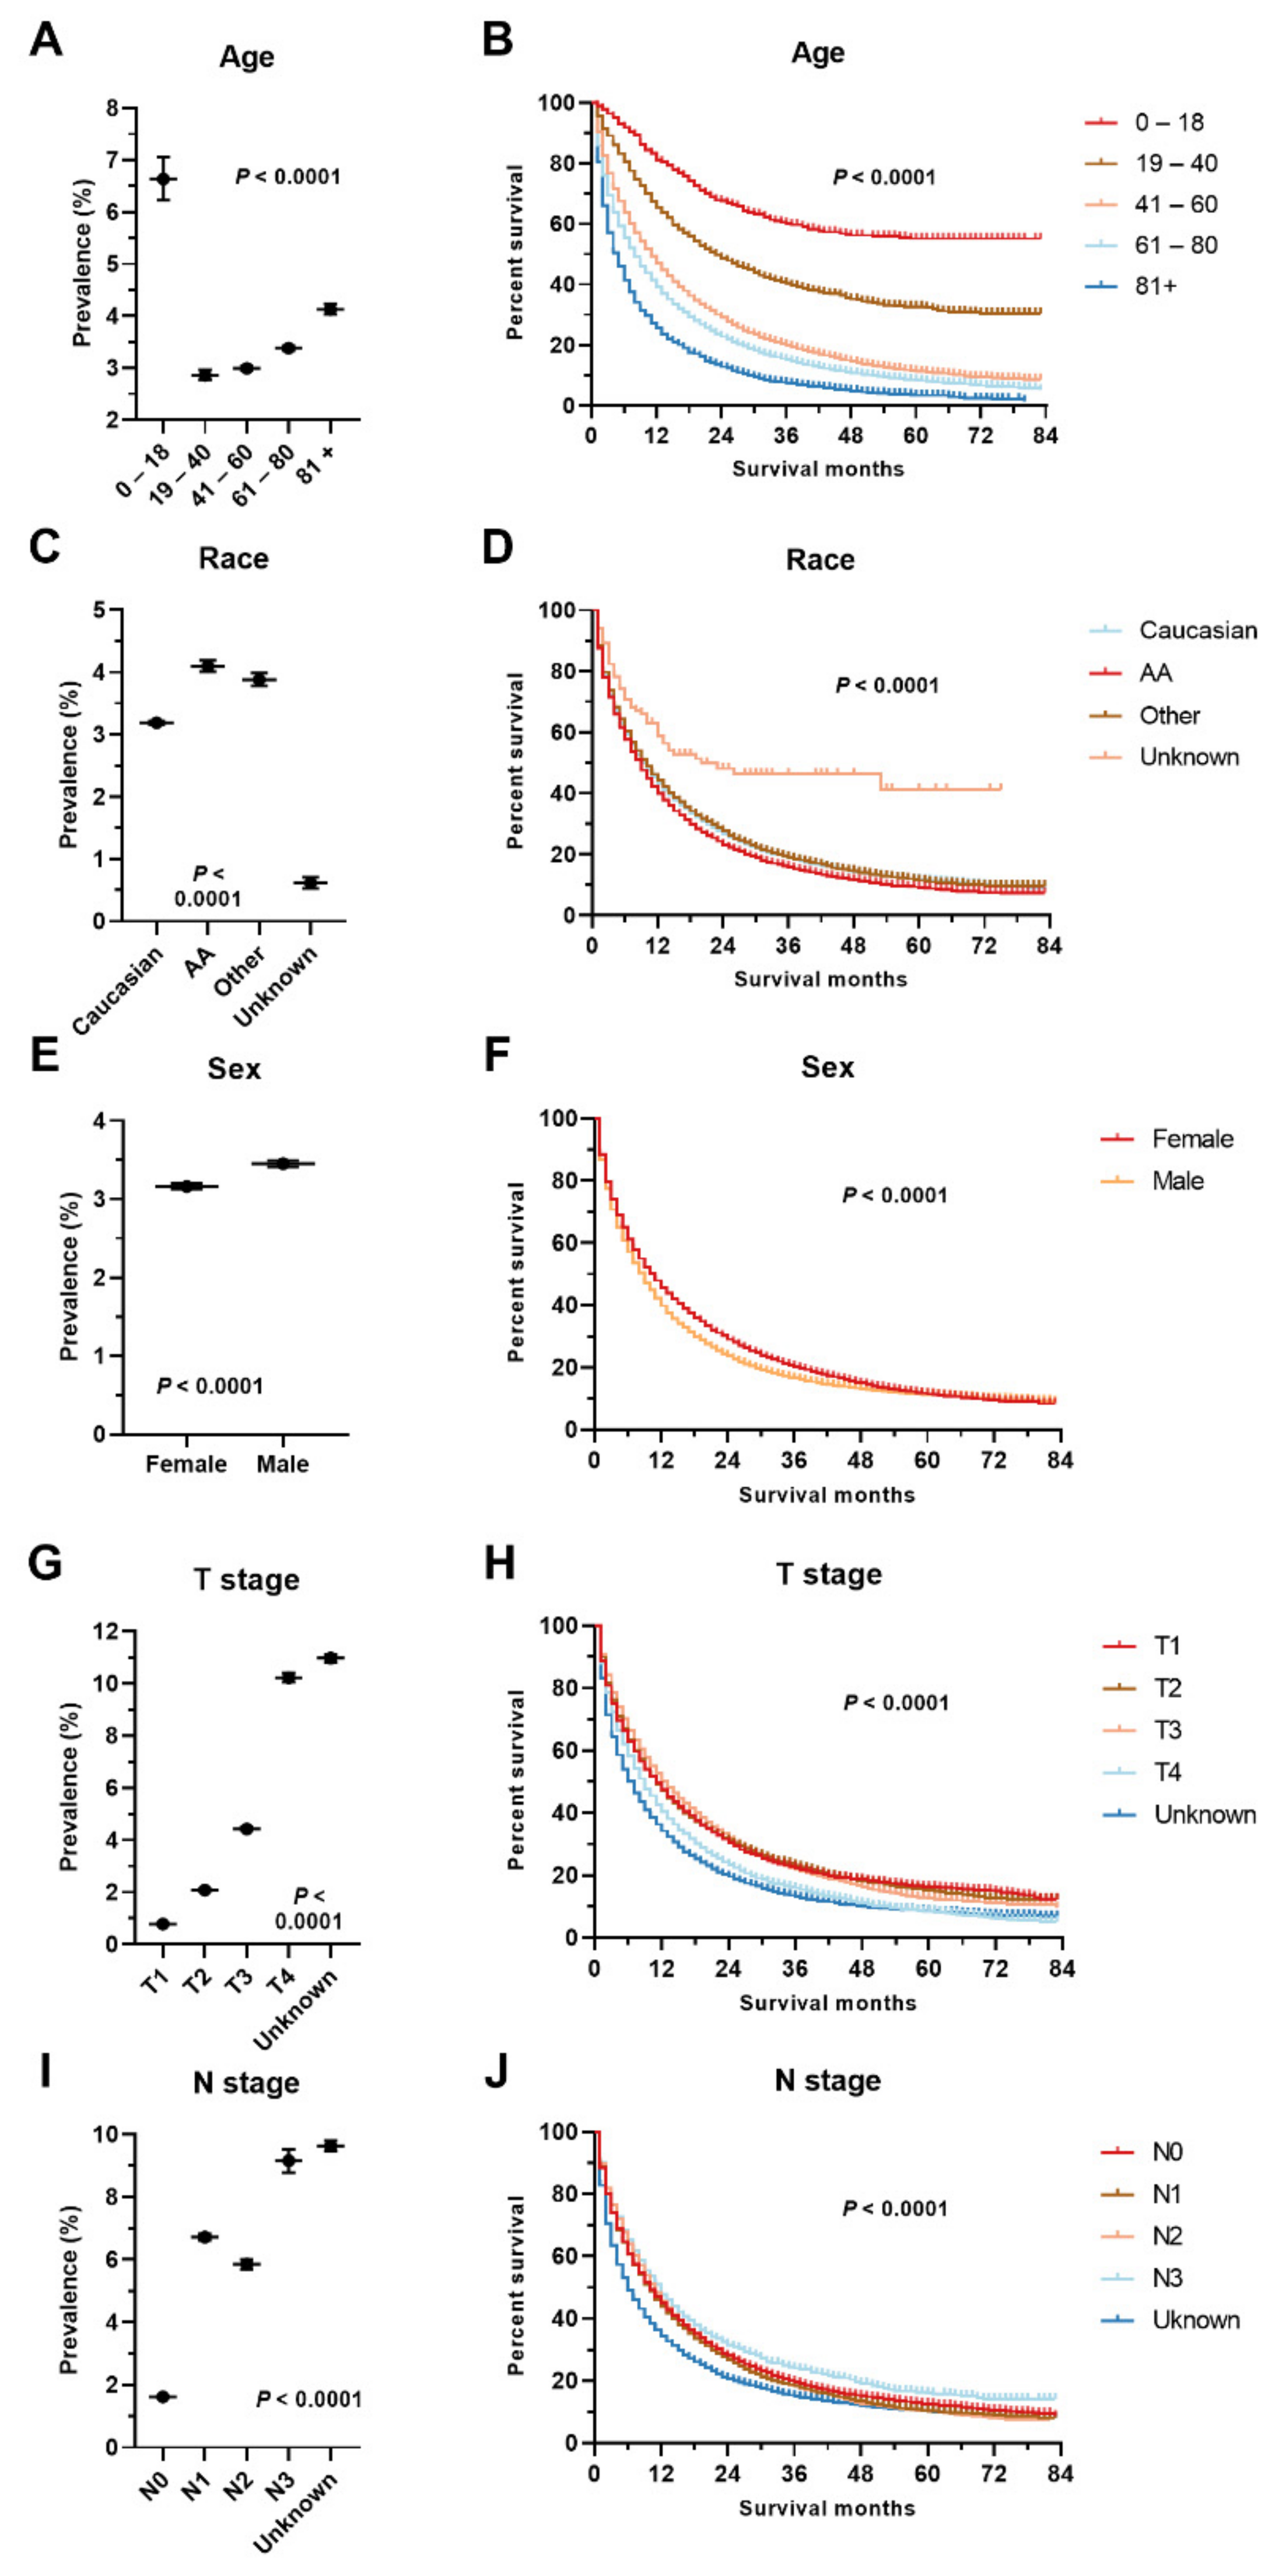
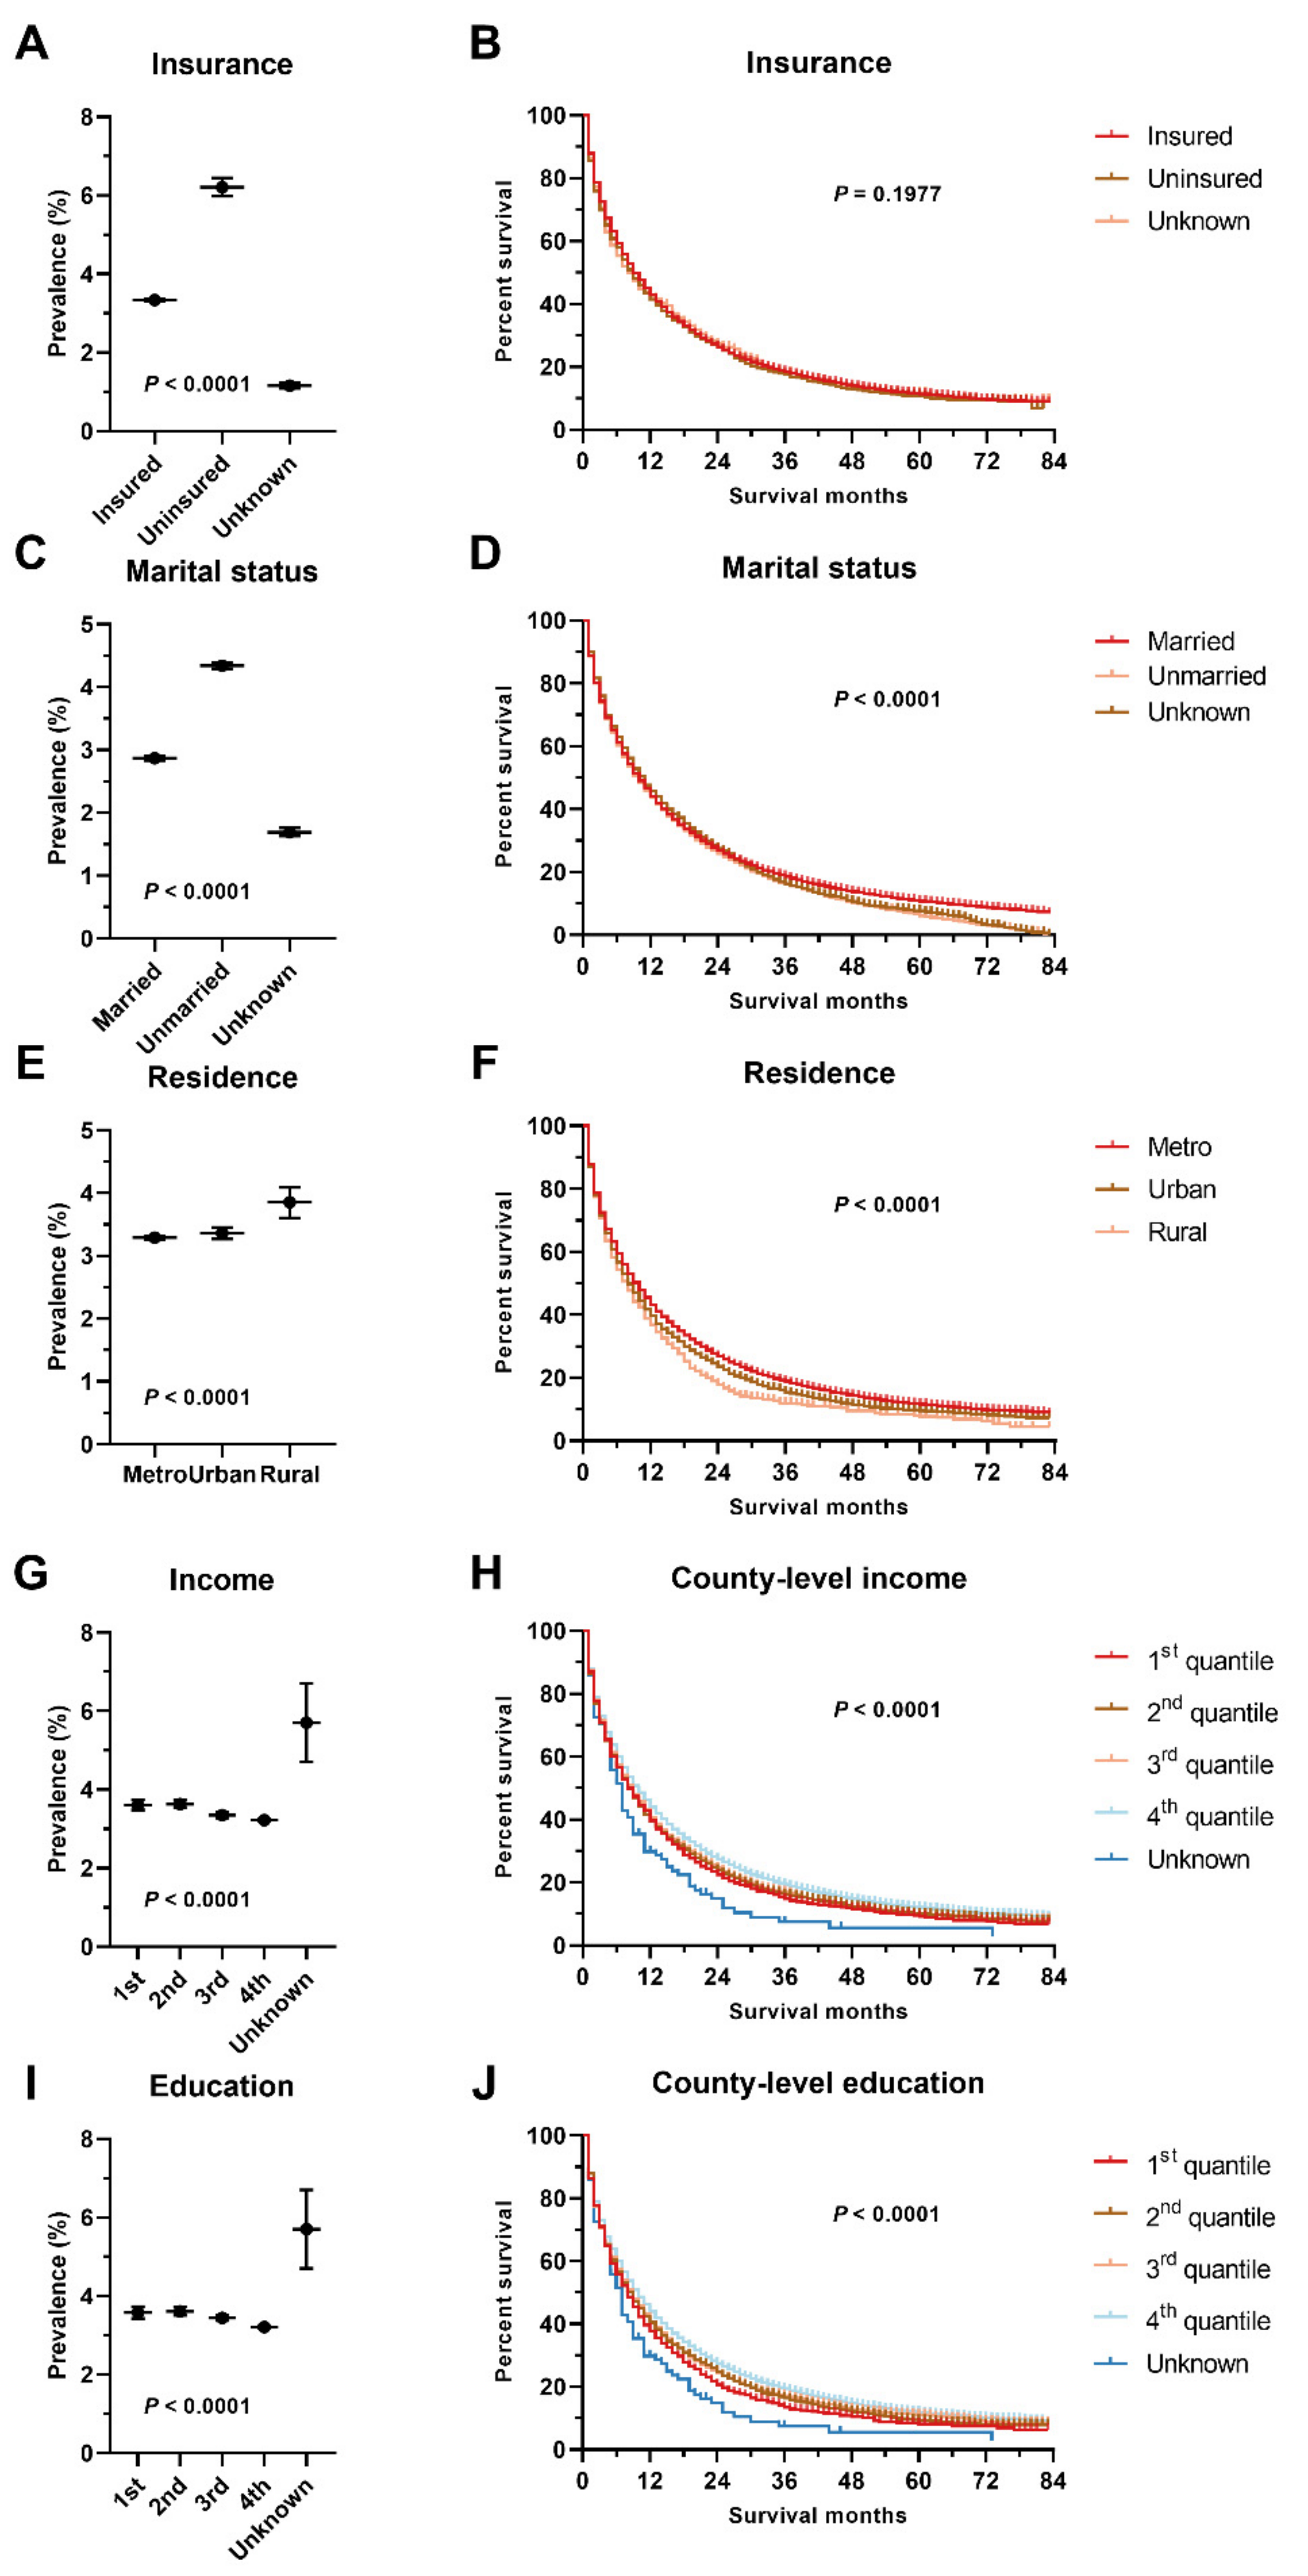
3.1. Prevalence of Lung Metastasis
3.2. Survival Analysis
4. Discussion
5. Conclusions
Supplementary Materials
Author Contributions
Funding
Institutional Review Board Statement
Informed Consent Statement
Data Availability Statement
Acknowledgments
Conflicts of Interest
References
- Bray, F.; Ferlay, J.; Soerjomataram, I.; Siegel, R.L.; Torre, L.A.; Jemal, A. Global cancer statistics 2018: GLOBOCAN estimates of incidence and mortality worldwide for 36 cancers in 185 countries. CA Cancer J. Clin. 2018, 68, 394–424. [Google Scholar] [CrossRef] [PubMed] [Green Version]
- Chaffer, C.L.; Weinberg, R.A. A perspective on cancer cell metastasis. Science 2011, 331, 1559–1564. [Google Scholar] [CrossRef] [PubMed]
- Wang, S.; Liu, Y.; Feng, Y.; Zhang, J.; Swinnen, J.; Li, Y.; Ni, Y. A Review on Curability of Cancers: More Efforts for Novel Therapeutic Options Are Needed. Cancers 2019, 11, 1782. [Google Scholar] [CrossRef] [Green Version]
- Zhang, Y.; Liu, H.; Wu, Q.; Wang, S.; Dai, C. Predictors of Distant Metastasis and Survival in Adenoid Cystic Carcinoma of the External Auditory Canal. Otol. Neurotol. 2019, 40, e1006–e1011. [Google Scholar] [CrossRef] [PubMed]
- Riihimäki, M.; Thomsen, H.; Sundquist, K.; Sundquist, J.; Hemminki, K. Clinical landscape of cancer metastases. Cancer Med. 2018, 7, 5534–5542. [Google Scholar] [CrossRef] [Green Version]
- Rodrigues, G.; Hoshino, A.; Kenific, C.M.; Matei, I.R.; Steiner, L.; Freitas, D.; Kim, H.S.; Oxley, P.R.; Scandariato, I.; Casanova-Salas, I.; et al. Tumour exosomal CEMIP protein promotes cancer cell colonization in brain metastasis. Nat. Cell Biol. 2019, 21, 1403–1412. [Google Scholar] [CrossRef]
- Zhang, X.; Song, J.; Liu, P.; Mazid, M.A.; Lu, L.; Shang, Y.; Wei, Y.; Gong, P.; Ma, L. A modified M-stage classification based on the metastatic patterns of pancreatic neuroendocrine neoplasms: A population-based study. BMC Endocr. Disord. 2018, 18, 73. [Google Scholar] [CrossRef]
- Wang, S.; Feng, Y.; Swinnen, J.; Oyen, R.; Li, Y.; Ni, Y. Incidence and prognosis of liver metastasis at diagnosis: A pan-cancer population-based study. Am. J. Cancer Res. 2020, 10, 1477–1517. [Google Scholar]
- Palma, D.A.; Salama, J.K.; Lo, S.S.; Senan, S.; Treasure, T.; Govindan, R.; Weichselbaum, R. The oligometastatic state—Separating truth from wishful thinking. Nat. Rev. Clin. Oncol. 2014, 11, 549–557. [Google Scholar] [CrossRef]
- Xiao, W.; Zheng, S.; Liu, P.; Zou, Y.; Xie, X.; Yu, P.; Tang, H.; Xie, X. Risk factors and survival outcomes in patients with breast cancer and lung metastasis: A population-based study. Cancer Med. 2018, 7, 922–930. [Google Scholar] [CrossRef]
- Ge, Y.; Lei, S.; Cai, B.; Gao, X.; Wang, G.; Wang, L.; Wang, Z. Incidence and prognosis of pulmonary metastasis in colorectal cancer: A population-based study. Int. J. Colorectal Dis. 2020, 35, 223–232. [Google Scholar] [CrossRef] [PubMed]
- Ward, E.; Jemal, A.; Cokkinides, V.; Singh, G.K.; Cardinez, C.; Ghafoor, A.; Thun, M. Cancer disparities by race/ethnicity and socioeconomic status. CA Cancer J. Clin. 2004, 54, 78–93. [Google Scholar] [CrossRef] [PubMed]
- SEER Database. Available online: https://seer.cancer.gov/ (accessed on 1 February 2022).
- SEER. ICD-O-3 Coding Materials. Available online: https://seer.cancer.gov/icd-o-3/ (accessed on 19 November 2021).
- SEER. Appendix C: Site Specific Coding Modules. Available online: https://seer.cancer.gov/archive/manuals/2021/appendixc.html?&url=/manuals/2021/appendixc.html (accessed on 28 February 2022).
- SEER Database. Race Recode Changes. Available online: https://seer.cancer.gov/seerstat/variables/seer/race_ethnicity/ (accessed on 19 November 2021).
- AJCC Staging System. Available online: https://www.facs.org/quality-programs/cancer/ajcc (accessed on 19 November 2021).
- A Confidence Interval for A Population Proportion. Available online: https://openstax.org/books/introductory-business-statistics/pages/8-3-a-confidence-interval-for-a-population-proportion (accessed on 22 June 2021).
- USDA. Available online: https://www.usda.gov/ (accessed on 19 November 2021).
- Kassambara, A.; Kosinski, M.; Biecek, P.; Fabian, S.; Survminer: Drawing Survival Curves Using ‘ggplot2’. R Package Version 0.4.4. 2019. Available online: https://rpkgs.datanovia.com/survminer/ (accessed on 19 November 2021).
- Therneau, T.; A Package for Survival Analysis in R. R Package Version 3.2-7. 2020. Available online: https://cran.r-project.org/web/packages/survival/vignettes/survival.pdf (accessed on 19 November 2021).
- Abrams, J.A.; Lee, P.C.; Port, J.L.; Altorki, N.K.; Neugut, A.I. Cigarette smoking and risk of lung metastasis from esophageal cancer. Cancer Epidemiol. Biomark. Prev. 2008, 17, 2707–2713. [Google Scholar] [CrossRef] [PubMed] [Green Version]
- Yahagi, M.; Tsuruta, M.; Hasegawa, H.; Okabayashi, K.; Toyoda, N.; Iwama, N.; Morita, S.; Kitagawa, Y. Smoking is a risk factor for pulmonary metastasis in colorectal cancer. Colorectal Dis. 2017, 19, O322–O328. [Google Scholar] [CrossRef]
- Makino, A.; Tsuruta, M.; Okabayashi, K.; Ishida, T.; Shigeta, K.; Seishima, R.; Ikebata, A.; Koishikawa, K.; Hasegawa, H.; Shimoda, M.; et al. The Impact of Smoking on Pulmonary Metastasis in Colorectal Cancer. Onco Targets Ther. 2020, 13, 9623–9629. [Google Scholar] [CrossRef]
- Lu, L.M.; Zavitz, C.C.; Chen, B.; Kianpour, S.; Wan, Y.; Stämpfli, M.R. Cigarette smoke impairs NK cell-dependent tumor immune surveillance. J. Immunol. 2007, 178, 936–943. [Google Scholar] [CrossRef]
- Murin, S.; Inciardi, J. Cigarette smoking and the risk of pulmonary metastasis from breast cancer. Chest 2001, 119, 1635–1640. [Google Scholar] [CrossRef] [Green Version]
- Murin, S.; Pinkerton, K.E.; Hubbard, N.E.; Erickson, K. The effect of cigarette smoke exposure on pulmonary metastatic disease in a murine model of metastatic breast cancer. Chest 2004, 125, 1467–1471. [Google Scholar] [CrossRef]
- Jiang, M.; Xu, X.; Bi, Y.; Xu, J.; Qin, C.; Han, M. Systemic inflammation promotes lung metastasis via E-selectin upregulation in mouse breast cancer model. Cancer Biol. Ther. 2014, 15, 789–796. [Google Scholar] [CrossRef] [Green Version]
- Stathopoulos, G.T.; Sherrill, T.P.; Han, W.; Sadikot, R.T.; Yull, F.E.; Blackwell, T.S.; Fingleton, B. Host nuclear factor-kappaB activation potentiates lung cancer metastasis. Mol. Cancer Res. 2008, 6, 364–371. [Google Scholar] [CrossRef] [Green Version]
- Pham, K.; Huynh, D.; Le, L.; Delitto, D.; Yang, L.; Huang, J.; Kang, Y.; Steinberg, M.B.; Li, J.; Zhang, L.; et al. E-cigarette promotes breast carcinoma progression and lung metastasis: Macrophage-tumor cells crosstalk and the role of CCL5 and VCAM-1. Cancer Lett. 2020, 491, 132–145. [Google Scholar] [CrossRef] [PubMed]
- Cocuzza, S.; Di Luca, M.; Maniaci, A.; Russo, M.; Di Mauro, P.; Migliore, M.; Serra, A.; Spinato, G. Precision treatment of post pneumonectomy unilateral laryngeal paralysis due to cancer. Future Oncol. 2020, 16, 45–53. [Google Scholar] [CrossRef] [PubMed]
- Meccariello, G.; Maniaci, A.; Bianchi, G.; Cammaroto, G.; Iannella, G.; Catalano, A.; Sgarzani, R.; De Vito, A.; Capaccio, P.; Pelucchi, S.; et al. Neck dissection and trans oral robotic surgery for oropharyngeal squamous cell carcinoma. Auris Nasus Larynx 2022, 49, 117–125. [Google Scholar] [CrossRef] [PubMed]
- Huang, F.; Shi, Q.; Li, Y.; Xu, L.; Xu, C.; Chen, F.; Wang, H.; Liao, H.; Chang, Z.; Liu, F.; et al. HER2/EGFR-AKT Signaling Switches TGFβ from Inhibiting Cell Proliferation to Promoting Cell Migration in Breast Cancer. Cancer Res. 2018, 78, 6073–6085. [Google Scholar] [CrossRef] [Green Version]
- Rakha, E.A.; El-Sayed, M.E.; Lee, A.H.; Elston, C.W.; Grainge, M.J.; Hodi, Z.; Blamey, R.W.; Ellis, I.O. Prognostic significance of Nottingham histologic grade in invasive breast carcinoma. J. Clin. Oncol. 2008, 26, 3153–3158. [Google Scholar] [CrossRef]
- Singhal, J.; Chikara, S.; Horne, D.; Salgia, R.; Awasthi, S.; Singhal, S.S. RLIP inhibition suppresses breast-to-lung metastasis. Cancer Lett. 2019, 447, 24–32. [Google Scholar] [CrossRef]
- Lu, Y.; Zhu, M.; Li, W.; Lin, B.; Dong, X.; Chen, Y.; Xie, X.; Guo, J.; Li, M. Alpha fetoprotein plays a critical role in promoting metastasis of hepatocellular carcinoma cells. J. Cell. Mol. Med. 2016, 20, 549–558. [Google Scholar] [CrossRef]
- Yan, B.; Bai, D.S.; Qian, J.J.; Zhang, C.; Jin, S.J.; Wang, X.; Jiang, G.Q. Differences in tumour characteristics of Hepatocellular Carcinoma between patients with and without Cirrhosis: A population-based study. J. Cancer 2020, 11, 5812–5821. [Google Scholar] [CrossRef]
- Engstrand, J.; Nilsson, H.; Strömberg, C.; Jonas, E.; Freedman, J. Colorectal cancer liver metastases—A population-based study on incidence, management and survival. BMC Cancer 2018, 18, 78. [Google Scholar] [CrossRef]
- Pereira, A.A.; Rego, J.F.; Morris, V.; Overman, M.J.; Eng, C.; Garrett, C.R.; Boutin, A.T.; Ferrarotto, R.; Lee, M.; Jiang, Z.Q.; et al. Association between KRAS mutation and lung metastasis in advanced colorectal cancer. Br. J. Cancer 2015, 112, 424–428. [Google Scholar] [CrossRef] [Green Version]
- Kim, M.-J.; Lee, H.S.; Kim, J.H.; Kim, Y.J.; Kwon, J.H.; Lee, J.-O.; Bang, S.-M.; Park, K.U.; Kim, D.-W.; Kang, S.-B.; et al. Different metastatic pattern according to the KRAS mutational status and site-specific discordance of KRAS status in patients with colorectal cancer. BMC Cancer 2012, 12, 347. [Google Scholar] [CrossRef] [PubMed] [Green Version]
- Cagney, D.N.; Martin, A.M.; Catalano, P.J.; Redig, A.J.; Lin, N.U.; Lee, E.Q.; Wen, P.Y.; Dunn, I.F.; Bi, W.L.; Weiss, S.E.; et al. Incidence and prognosis of patients with brain metastases at diagnosis of systemic malignancy: A population-based study. Neuro Oncol. 2017, 19, 1511–1521. [Google Scholar] [CrossRef] [Green Version]
- Hu, Z.; Ding, J.; Ma, Z.; Sun, R.; Seoane, J.A.; Scott Shaffer, J.; Suarez, C.J.; Berghoff, A.S.; Cremolini, C.; Falcone, A.; et al. Quantitative evidence for early metastatic seeding in colorectal cancer. Nat. Genet. 2019, 51, 1113–1122. [Google Scholar] [CrossRef] [PubMed]
- Alcaraz, K.I.; Wiedt, T.L.; Daniels, E.C.; Yabroff, K.R.; Guerra, C.E.; Wender, R.C. Understanding and addressing social determinants to advance cancer health equity in the United States: A blueprint for practice, research, and policy. CA Cancer J. Clin. 2020, 70, 31–46. [Google Scholar] [CrossRef] [Green Version]
- Barton, M.K. Inferior cancer outcomes more common for uninsured and Medicaid patients. CA Cancer J. Clin. 2015, 65, 165–166. [Google Scholar] [CrossRef] [PubMed]
- Aizer, A.A.; Chen, M.-H.; McCarthy, E.P.; Mendu, M.L.; Koo, S.; Wilhite, T.J.; Graham, P.L.; Choueiri, T.K.; Hoffman, K.E.; Martin, N.E.; et al. Marital status and survival in patients with cancer. J. Clin. Oncol. 2013, 31, 3869–3876. [Google Scholar] [CrossRef]
- DelFattore, J. Death by Stereotype? Cancer Treatment in Unmarried Patients. N. Engl. J. Med. 2019, 381, 982–985. [Google Scholar] [CrossRef] [PubMed]
- Vallance, A.E.; van der Meulen, J.; Kuryba, A.; Braun, M.; Jayne, D.G.; Hill, J.; Cameron, I.C.; Walker, K. Socioeconomic differences in selection for liver resection in metastatic colorectal cancer and the impact on survival. Eur. J. Surg. Oncol. 2018, 44, 1588–1594. [Google Scholar] [CrossRef] [Green Version]
- Mahase, S.S.; D’Angelo, D.; Kang, J.; Hu, J.C.; Barbieri, C.E.; Nagar, H. Trends in the Use of Stereotactic Body Radiotherapy for Treatment of Prostate Cancer in the United States. JAMA Netw. Open 2020, 3, e1920471. [Google Scholar] [CrossRef]
- Jain, V.; Venigalla, S.; Reddy, V.K.; Lukens, J.N.; Mitchell, T.C.; Shabason, J.E. Association of Insurance Status With Presentation, Treatment, and Survival in Melanoma in the Era of Immune Checkpoint Inhibitors. J. Immunother. 2020, 43, 8–15. [Google Scholar] [CrossRef]
- Wharam, J.F.; Zhang, F.; Lu, C.Y.; Wagner, A.K.; Nekhlyudov, L.; Earle, C.C.; Soumerai, S.B.; Ross-Degnan, D. Breast Cancer Diagnosis and Treatment After High-Deductible Insurance Enrollment. J. Clin. Oncol. 2018, 36, 1121–1127. [Google Scholar] [CrossRef] [PubMed]
- Loehrer, A.P.; Song, Z.; Haynes, A.B.; Chang, D.C.; Hutter, M.M.; Mullen, J.T. Impact of Health Insurance Expansion on the Treatment of Colorectal Cancer. J. Clin. Oncol. 2016, 34, 4110–4115. [Google Scholar] [CrossRef] [PubMed]
- Lee, D.-C.; Liang, H.; Shi, L. The convergence of racial and income disparities in health insurance coverage in the United States. Int. J. Equity Health 2021, 20, 96. [Google Scholar] [CrossRef] [PubMed]
- Miller, K.D.; Goding Sauer, A.; Ortiz, A.P.; Fedewa, S.A.; Pinheiro, P.S.; Tortolero-Luna, G.; Martinez-Tyson, D.; Jemal, A.; Siegel, R.L. Cancer Statistics for Hispanics/Latinos, 2018. CA Cancer J. Clin. 2018, 68, 425–445. [Google Scholar] [CrossRef] [Green Version]
- Goel, M.S.; Wee, C.C.; McCarthy, E.P.; Davis, R.B.; Ngo-Metzger, Q.; Phillips, R.S. Racial and ethnic disparities in cancer screening: The importance of foreign birth as a barrier to care. J. Gen. Intern. Med. 2003, 18, 1028–1035. [Google Scholar] [CrossRef] [PubMed] [Green Version]


| Categories | No. of Cases | Prevalence a | Ratio | Distribution c | Survival d | ||
|---|---|---|---|---|---|---|---|
| All | Metastasis | sLM | sLM | sLM/Metastasis b | |||
| All | 1,672,265 | 194,012 | 55,193 | 3.30% (3.27–3.33%) | 28.45% | 100.00% | 7 (2–22) |
| Brain | 27,485 | 209 | 17 | 0.06% (0.03–0.09%) | 8.13% | 0.03% | 9 (3–23) |
| Head and neck | 74,897 | 3079 | 1574 | 2.10% (2.00–2.20%) | 51.12% | 2.85% | 8 (3–20) |
| Thyroid | 78,003 | 1574 | 996 | 1.28% (1.20–1.36%) | 63.28% | 1.80% | 11 (2–79) |
| Pathology | |||||||
| Solitary | 45,450 | 782 | 516 | 1.14% (1.04–1.23%) *** | 65.98% | 0.93% | 9 (2–70) *** |
| Multifocal | 30,707 | 514 | 309 | 1.01% (0.89–1.12%) | 60.12% | 0.56% | 45 (6–NA) |
| Unknown | 1846 | 278 | 171 | 9.26% (7.94–10.59%) | 61.51% | 0.31% | 4 (1–13) |
| All breast | 358,649 | 18,819 | 5972 | 1.67% (1.62–1.71%) | 31.73% | 10.82% | 20 (5–47) |
| Molecular subtype | |||||||
| Her2−/HR+ | 15,831 | 1564 | 575 | 3.63% (3.34–3.92%) *** | 36.76% | 1.04% | 20 (4–52) *** |
| Her2+/HR+ | 37,204 | 2905 | 907 | 2.44% (2.28–2.59%) | 31.22% | 1.64% | 32 (10–NA) |
| Her2+/HR− | 245,301 | 9878 | 2794 | 1.14% (1.10–1.18%) | 28.29% | 5.06% | 27 (8–52) |
| Triple negative | 37,359 | 2303 | 944 | 2.53% (2.37–2.69%) | 40.99% | 1.71% | 10 (3–19) |
| Unknown | 22,954 | 2169 | 752 | 3.28% (3.05–3.51%) | 34.67% | 1.36% | 8 (1–30) |
| BR grade | |||||||
| Low | 82,105 | 1245 | 302 | 0.37% (0.33–0.41%) *** | 24.26% | 0.55% | 34 (10–65) *** |
| Medium | 140,840 | 5221 | 1474 | 1.05% (0.99–1.10%) | 28.23% | 2.67% | 28 (10–61) |
| High | 95,779 | 5413 | 1949 | 2.03% (1.95–2.12%) | 36.01% | 3.53% | 18 (5–43) |
| Unknown | 39,925 | 6940 | 2247 | 5.63% (5.40–5.85%) | 32.38% | 4.07% | 15 (2–40) |
| Main bronchus | 10,878 | 6848 | 1853 | 17.03% (16.33–17.74%) | 27.06% | 3.36% | 3 (1–10) |
| Oesophagus | 20,068 | 6576 | 1976 | 9.85% (9.43–10.26%) | 30.05% | 3.58% | 4 (1–10) |
| Stomach | 31,825 | 11,559 | 1756 | 5.52% (5.27–5.77%) | 15.19% | 3.18% | 3 (1–9) |
| Liver e | 26,267 | 5793 | 2245 | 8.55% (8.21–8.88%) | 38.75% | 4.07% | 2 (1–6) |
| AFP level | |||||||
| Elevated | 11,959 | 2598 | 1034 | 8.65% (8.14–9.15%) *** | 39.80% | 1.87% | 2 (1–5) *** |
| Normal | 6713 | 1191 | 445 | 6.63% (6.03–7.22%) | 37.36% | 0.81% | 3 (1–8) |
| Borderline | 59 | 10 | 2 | NA | 20.00% | 0.00% | 8 (8–8) |
| Unknown | 7536 | 1324 | 494 | 6.56% (6.00–7.11%) | 37.31% | 0.90% | 2 (1–8) |
| Fibrosis grade | |||||||
| None to moderate | 1923 | 277 | 101 | 5.25% (4.26–6.25%) *** | 36.46% | 0.18% | 4 (2–9) *** |
| Severe or cirrhotic | 4178 | 524 | 186 | 4.45% (3.83–5.08%) | 35.50% | 0.34% | 2 (0–6) |
| Unknown | 20,166 | 4992 | 1958 | 9.71% (9.30–10.12%) | 39.22% | 3.55% | 2 (1–6) |
| Extrahepatic biliary tract | 14,238 | 4727 | 876 | 6.15% (5.76–6.55%) | 18.53% | 1.59% | 3 (1–8) |
| Pancreas | 52,442 | 26,544 | 5682 | 10.83% (10.57–11.10%) | 21.41% | 10.29% | 3 (1–7) |
| Tumor site | |||||||
| Head of pancreas | 25,958 | 9343 | 1766 | 6.80% (6.50–7.11%) *** | 18.90% | 3.20% | 3 (1–9) *** |
| Body of pancreas | 7272 | 4215 | 919 | 12.64% (11.87–13.40%) | 21.80% | 1.67% | 3 (1–9) |
| Tail of pancreas | 8186 | 5663 | 1240 | 15.15% (14.37–15.92%) | 21.90% | 2.25% | 2 (1–6) |
| Unspecified pancreas | 11,026 | 7323 | 1757 | 15.94% (15.25–16.62%) | 23.99% | 3.18% | 2 (1–6) |
| Small intestine | 9628 | 2584 | 239 | 2.48% (2.17–2.79%) | 9.25% | 0.43% | 8 (2–22) |
| Colon & rectum | 186,539 | 37,739 | 9645 | 5.17% (5.07–5.27%) | 25.56% | 17.48% | 11 (3–25) |
| Tumor site | |||||||
| Right colon | 72,383 | 13,857 | 2777 | 3.84% (3.70–3.98%) *** | 20.04% | 5.03% | 8 (2–21) *** |
| Left colon | 64,014 | 13,773 | 3370 | 5.26% (5.09–5.44%) | 24.47% | 6.11% | 13 (3–28) |
| Unspecified colon | 4727 | 2549 | 746 | 15.78% (14.74–16.82%) | 29.27% | 1.35% | 3 (1–12) |
| Rectum | 45,415 | 7560 | 2752 | 6.06% (5.84–6.28%) | 36.40% | 4.99% | 15 (5–29) |
| CEA level | |||||||
| CEA elevated | 51,520 | 21,670 | 5987 | 11.62% (11.34–11.90%) *** | 27.63% | 10.85% | 11 (3–24) *** |
| CEA normal | 54,991 | 4642 | 840 | 1.53% (1.43–1.63%) | 18.10% | 1.52% | 20 (7–38) |
| CEA borderline | 547 | 69 | 11 | 2.01% (0.83–3.19%) | 15.94% | 0.02% | 11 (3–27) |
| CEA unknown | 38,692 | 1546 | 178 | 0.46% (0.39–0.53%) | 11.51% | 0.32% | 14 (4–50) |
| Perineural Invasion | |||||||
| Yes | 16,415 | 5333 | 944 | 5.75% (5.39–6.11%) *** | 17.70% | 1.71% | 18 (6–34) *** |
| No | 124,544 | 15,576 | 3332 | 2.68% (2.59–2.76%) | 21.39% | 6.04% | 15 (5–31) |
| Unknown | 45,580 | 16,830 | 5369 | 11.78% (11.48–12.08%) | 31.90% | 9.73% | 8 (2–21) |
| Anus | 9405 | 695 | 183 | 1.95% (1.67–2.22%) | 26.33% | 0.33% | 11 (5–23) |
| Other GI | 8611 | 3222 | 680 | 7.90% (7.33–8.47%) | 21.10% | 1.23% | 2 (0–7) |
| Kidney | 69,605 | 9564 | 5823 | 8.37% (8.16–8.57%) | 60.88% | 10.55% | 8 (2–22) |
| Fuhrman grade | |||||||
| I | 6144 | 131 | 81 | 1.32% (1.03–1.60%) *** | 61.83% | 0.15% | 12 (4–61) *** |
| II | 28,826 | 906 | 511 | 1.77% (1.62–1.93%) | 56.40% | 0.93% | 20 (7–44) |
| III | 16,496 | 1624 | 956 | 5.80% (5.44–6.15%) | 58.87% | 1.73% | 17 (6–40) |
| IV | 4832 | 1569 | 1010 | 20.90% (19.76–22.05%) | 64.37% | 1.83% | 11 (5–29) |
| Unknown | 13,307 | 5334 | 3265 | 24.54% (23.80–25.27%) | 61.21% | 5.92% | 4 (2–12) |
| Bladder | 41,668 | 3348 | 1215 | 2.92% (2.75–3.08%) | 36.29% | 2.20% | 4 (1–11) |
| Pathological grade | |||||||
| Low | 3231 | 61 | 27 | 0.84% (0.52–1.15%) *** | 44.26% | 0.05% | 4 (2–15) *** |
| High | 32,596 | 2322 | 813 | 2.49% (2.32–2.66%) | 35.01% | 1.47% | 4 (2–11) |
| Unknown | 5841 | 965 | 375 | 6.42% (5.79–7.05%) | 38.86% | 0.68% | 3 (1–9) |
| Prostate | 309,918 | 15,735 | 1339 | 0.43% (0.41–0.46%) | 8.51% | 2.43% | 22 (8–63) |
| PSA level | |||||||
| 1st quantile | 67,653 | 588 | 81 | 0.12% (0.09–0.15%) *** | 13.78% | 0.15% | 11 (5–32) *** |
| 2nd quantile | 64,654 | 317 | 28 | 0.04% (0.03–0.06%) | 8.83% | 0.05% | 14 (6–42) |
| 3rd quantile | 64,571 | 685 | 46 | 0.07% (0.05–0.09%) | 6.72% | 0.08% | 22 (11–NA) |
| 4th quantile | 64,103 | 5332 | 373 | 0.58% (0.52–0.64%) | 7.00% | 0.68% | 27 (9–72) |
| Unknown | 48,937 | 8813 | 811 | 1.66% (1.54–1.77%) | 9.20% | 1.47% | 20 (9–53) |
| Testis | 15,881 | 1791 | 1129 | 7.11% (6.71–7.51%) | 63.04% | 2.05% | NA (20–NA) |
| Other GU | 8718 | 1152 | 529 | 6.07% (5.57–6.57%) | 45.92% | 0.96% | 5 (2–12) |
| Ovary | 29,789 | 7790 | 1696 | 5.69% (5.43–5.96%) | 21.77% | 3.07% | 16 (2–36) |
| CA125 level | |||||||
| Elevated | 20,383 | 6164 | 1343 | 6.59% (6.25–6.93%) *** | 21.79% | 2.43% | 18 (3–37) *** |
| Normal | 2761 | 176 | 29 | 1.05% (0.67–1.43%) | 16.48% | 0.05% | 12 (4–25) |
| Borderline | 36 | 4 | 0 | NA | 0.00% | 0.00% | NA |
| Unknown | 6609 | 1446 | 324 | 4.90% (4.38–5.42%) | 22.41% | 0.59% | 7 (1–27) |
| Uterus | 73,342 | 4206 | 1232 | 1.68% (1.59–1.77%) | 29.29% | 2.23% | 8 (2–22) |
| Cervix | 20,658 | 2712 | 844 | 4.09% (3.82–4.36%) | 31.12% | 1.53% | 7 (3–17) |
| Other GYN | 10,514 | 1355 | 457 | 4.35% (3.96–4.74%) | 33.73% | 0.83% | 5 (1–23) |
| Bone tumor | 5079 | 863 | 609 | 11.99% (11.10–12.88%) | 70.57% | 1.10% | 19 (8–NA) |
| STS | 25,093 | 3537 | 2181 | 8.69% (8.34–9.04%) | 61.66% | 3.95% | 8 (2–23) |
| Skin Melanoma | 107,287 | 2256 | 1065 | 0.99% (0.93–1.05%) | 47.21% | 1.93% | 6 (2–20) |
| Ulceration | |||||||
| Yes | 13,441 | 619 | 268 | 1.99% (1.76–2.23%) *** | 43.30% | 0.49% | 7 (3–22) *** |
| No | 89,168 | 567 | 235 | 0.26% (0.23–0.30%) | 41.45% | 0.43% | 11 (4–39) |
| Unknown | 4678 | 1070 | 562 | 12.01% (11.08–12.95%) | 52.52% | 1.02% | 4 (1–13) |
| Non-skin melanoma | 3084 | 247 | 106 | 3.44% (2.79–4.08%) | 42.91% | 0.19% | 6 (3–14) |
| Skin cancer | 5345 | 203 | 37 | 0.69% (0.47–0.91%) | 18.23% | 0.07% | 9 (6–18) |
| Embryonal tumors | 4281 | 877 | 334 | 7.80% (7.00–8.61%) | 38.08% | 0.61% | NA (19–NA) |
| All other | 33,068 | 8408 | 2903 | 8.78% (8.47–9.08%) | 34.53% | 5.26% | 5 (1–20) |
| Categories | Number of Cases | Prevalence a | Ratio | Distribution c | Survival d | ||
|---|---|---|---|---|---|---|---|
| All | Metastasis | sLM | sLM | sLM/Metastasis b | |||
| Year of diagnosis | |||||||
| 2010 | 232,553 | 25,223 | 6776 | 2.91% (2.85–2.98%) *** | 26.86% | 12.28% | 7 (2–22) *** |
| 2011 | 236,568 | 25,572 | 7144 | 3.02% (2.95–3.09%) | 27.94% | 12.94% | 7 (2–22) |
| 2012 | 234,008 | 26,323 | 7504 | 3.21% (3.14–3.28%) | 28.51% | 13.60% | 7 (2–21) |
| 2013 | 234,946 | 27,393 | 7878 | 3.35% (3.28–3.43%) | 28.76% | 14.27% | 7 (2–23) |
| 2014 | 238,679 | 28,404 | 8172 | 3.42% (3.35–3.50%) | 28.77% | 14.81% | 7 (2–23) |
| 2015 | 245,850 | 29,658 | 8544 | 3.48% (3.40–3.55%) | 28.81% | 15.48% | 7 (2–22) |
| 2016 | 249,661 | 31,439 | 9175 | 3.67% (3.60–3.75%) | 29.18% | 16.62% | 8 (2–NA) |
| Sex | |||||||
| Female | 873,620 | 94,869 | 27,642 | 3.16% (3.13–3.20%) *** | 29.14% | 50.08% | 8 (2–25) *** |
| Male | 798,645 | 99,143 | 27,551 | 3.45% (3.41–3.49%) | 27.79% | 49.92% | 7 (2–20) |
| Race | |||||||
| Caucasian | 1,323,660 | 149,175 | 42,188 | 3.19% (3.16–3.22%) *** | 28.28% | 76.44% | 7 (2–23) *** |
| African American | 187,441 | 27,368 | 7687 | 4.10% (4.01–4.19%) | 28.09% | 13.93% | 7 (2–20) |
| Other | 132,299 | 16,772 | 5138 | 3.88% (3.78–3.99%) | 30.63% | 9.31% | 8 (2–24) |
| Unknown | 28,865 | 697 | 180 | 0.62% (0.53–0.71%) | 25.82% | 0.33% | 14 (4–NA) |
| Age group | |||||||
| 0–18 | 13,939 | 1873 | 926 | 6.64% (6.23–7.06%) *** | 49.44% | 1.68% | NA (17–NA) *** |
| 19–40 | 115,626 | 9374 | 3311 | 2.86% (2.77–2.96%) | 35.32% | 6.00% | 21 (7–NA) |
| 41–60 | 597,058 | 63,954 | 17,863 | 2.99% (2.95–3.04%) | 27.93% | 32.36% | 9 (3–26) |
| 61–80 | 794,720 | 96,147 | 26,863 | 3.38% (3.34–3.42%) | 27.94% | 48.67% | 6 (1–19) |
| 81+ | 150,922 | 22,664 | 6230 | 4.13% (4.03–4.23%) | 27.49% | 11.29% | 3 (1–10) |
| T stage | |||||||
| T1 | 715,832 | 20,927 | 5618 | 0.78% (0.76–0.81%) *** | 26.85% | 10.18% | 9 (2–27) *** |
| T2 | 403,599 | 30,559 | 8392 | 2.08% (2.04–2.12%) | 27.46% | 15.20% | 9 (2–29) |
| T3 | 285,021 | 48,304 | 12,631 | 4.43% (4.36–4.51%) | 26.15% | 22.89% | 11 (3–29) |
| T4 | 110,768 | 39,789 | 11,325 | 10.22% (10.05–10.40%) | 28.46% | 20.52% | 7 (2–20) |
| Unknown | 157,045 | 54,433 | 17,227 | 10.97% (10.81–11.12%) | 31.65% | 31.21% | 4 (1–15) |
| N stage | |||||||
| N0 | 1,184,206 | 72,679 | 19,196 | 1.62% (1.60–1.64%) *** | 26.41% | 34.78% | 8 (2–25) *** |
| N1 | 255,900 | 59,633 | 17,193 | 6.72% (6.62–6.82%) | 28.83% | 31.15% | 8 (2–23) |
| N2 | 90,865 | 21,136 | 5313 | 5.85% (5.69–6.00%) | 25.14% | 9.63% | 9 (2–24) |
| N3 | 23,729 | 7065 | 2173 | 9.16% (8.79–9.52%) | 30.76% | 3.94% | 10 (3–30) |
| Unknown | 117,565 | 33,499 | 11,318 | 9.63% (9.46–9.80%) | 33.79% | 20.51% | 4 (1–15) |
| Insurance status | |||||||
| Insured | 1,540,367 | 181,774 | 51,501 | 3.34% (3.32–3.37%) *** | 28.33% | 93.31% | 7 (2–23) ns |
| Uninsured | 42,868 | 8546 | 2663 | 6.21% (5.98–6.44%) | 31.16% | 4.82% | 6 (1–21) |
| Unknown | 89,030 | 3692 | 1029 | 1.16% (1.09–1.23%) | 27.87% | 1.86% | 5 (1–22) |
| Marital status | |||||||
| Married | 911,531 | 97,059 | 26,141 | 2.87% (2.83–2.90%) *** | 26.93% | 47.36% | 8 (2–23) *** |
| Unmarried | 610,219 | 87,716 | 26,503 | 4.34% (4.29–4.39%) | 30.21% | 48.02% | 6 (2–21) |
| Unknown | 150,515 | 9237 | 2549 | 1.69% (1.63–1.76%) | 27.60% | 4.62% | 7 (2–23) |
| County-level income | |||||||
| 1st quantile | 80,355 | 10,542 | 2900 | 3.61% (3.48–3.74%) *** | 27.51% | 5.25% | 6 (2–19) *** |
| 2nd quantile | 162,810 | 20,689 | 5917 | 3.63% (3.54–3.73%) | 28.60% | 10.72% | 6 (2–20) |
| 3rd quantile | 223,745 | 26,546 | 7504 | 3.35% (3.28–3.43%) | 28.27% | 13.60% | 7 (2–21) |
| 4th quantile | 1,203,286 | 135,898 | 38,754 | 3.22% (3.19–3.25%) | 28.52% | 70.22% | 8 (2–23) |
| Unknown | 2069 | 337 | 118 | 5.70% (4.70–6.70%) | 35.01% | 0.21% | 5 (1–13) |
| County-level education | |||||||
| 1st quantile | 58,086 | 7592 | 2078 | 3.58% (3.43–3.73%) *** | 27.37% | 3.76% | 6 (2–18) *** |
| 2nd quantile | 125,184 | 15,693 | 4524 | 3.61% (3.51–3.72%) | 28.83% | 8.20% | 6 (2–20) |
| 3rd quantile | 301,780 | 36,451 | 10,382 | 3.44% (3.38–3.51%) | 28.48% | 18.81% | 7 (2–20) |
| 4th quantile | 1,185,146 | 133,939 | 38,091 | 3.21% (3.18–3.25%) | 28.44% | 69.01% | 8 (2–24) |
| Unknown | 2069 | 337 | 118 | 5.70% (4.70–6.70%) | 35.01% | 0.21% | 5 (1–13) |
| Residence | |||||||
| Metro | 1,489,707 | 171,907 | 48,948 | 3.29% (3.26–3.31%) *** | 28.47% | 88.69% | 7 (2–23) *** |
| Urban | 159,003 | 19,010 | 5346 | 3.36% (3.27–3.45%) | 28.12% | 9.69% | 7 (2–20) |
| Rural | 23,351 | 3086 | 898 | 3.85% (3.60–4.09%) | 29.10% | 1.63% | 6 (2–17) |
| Unknown | 204 | 9 | 1 | NA | 11.11% | 0.00% | 73 (73–73) |
| Categories | OR | 95% CI | p-Value | Categories | OR | 95% CI | p-Value |
|---|---|---|---|---|---|---|---|
| Sex | Liver metastasis | ||||||
| Female | Reference | Yes | Reference | ||||
| Male | 1.01 | (0.98–1.03) | ns | No | 0.16 | (0.16–0.17) | *** |
| Race | Unknown | 0.83 | (0.75–0.92) | *** | |||
| Caucasian | Reference | NA | 0.71 | (0.45–1.14) | ns | ||
| African American | 1.17 | (1.14–1.21) | *** | Insurance | |||
| Other | 1.15 | (1.11–1.19) | *** | Insured | Reference | ||
| Unknown | 0.46 | (0.39–0.53) | *** | Uninsured | 1.27 | (1.21–1.33) | *** |
| Age group | Unknown | 0.68 | (0.64–0.74) | *** | |||
| 0–18 | Reference | Marital status | |||||
| 19–40 | 0.70 | (0.63–0.77) | *** | Married | Reference | ||
| 41–60 | 0.82 | (0.74–0.90) | *** | Unmarried | 1.18 | (1.16–1.20) | *** |
| 61–80 | 1.01 | (0.92–1.12) | ns | Unknown | 0.90 | (0.86–0.95) | *** |
| 81+ | 1.10 | (0.99–1.21) | ns | County-level income | |||
| T stage | 1st quantile | Reference | |||||
| T1 | Reference | 2nd quantile | 1.02 | (0.96–1.08) | ns | ||
| T2 | 2.37 | (2.28–2.46) | *** | 3rd quantile | 0.99 | (0.93–1.04) | ns |
| T3 | 3.10 | (2.99–3.21) | *** | 4th quantile | 0.98 | (0.93–1.04) | ns |
| T4 | 5.80 | (5.58–6.03) | *** | Unknown | NA | NA | NA |
| TX | 5.43 | (5.22–5.64) | *** | County-level education | |||
| N stage | 1st quantile | Reference | |||||
| N0 | Reference | 2nd quantile | 1.03 | (0.96–1.10) | ns | ||
| N1 | 2.20 | (2.14–2.25) | *** | 3rd quantile | 1.02 | (0.95–1.08) | ns |
| N2 | 1.84 | (1.77–1.92) | *** | 4th quantile | 0.99 | (0.93–1.06) | ns |
| N3 | 2.74 | (2.59–2.91) | *** | Unknown | 1.32 | (1.05–1.67) | * |
| NX | 1.71 | (1.65–1.77) | *** | Residence | |||
| Bone metastasis | Metro | Reference | |||||
| Yes | Reference | Urban | 0.99 | (0.95–1.03) | ns | ||
| No | 0.17 | (0.17–0.18) | *** | Rural | 1.06 | (0.97–1.16) | ns |
| Unknown | 0.53 | (0.48–0.60) | *** | Unknown | 0.34 | (0.05–2.50) | ns |
| NA | 0.73 | (0.29–1.85) | ns | ||||
| Brain metastasis | |||||||
| Yes | Reference | ||||||
| No | 0.17 | (0.16–0.18) | *** | ||||
| Unknown | 0.44 | (0.39–0.49) | *** | ||||
| NA | 0.65 | (0.26–1.64) | ns | ||||
Publisher’s Note: MDPI stays neutral with regard to jurisdictional claims in published maps and institutional affiliations. |
© 2022 by the authors. Licensee MDPI, Basel, Switzerland. This article is an open access article distributed under the terms and conditions of the Creative Commons Attribution (CC BY) license (https://creativecommons.org/licenses/by/4.0/).
Share and Cite
Wang, S.; Chen, L.; Feng, Y.; Swinnen, J.V.; Jonscher, C.; Van Ongeval, C.; Ni, Y. Heterogeneity of Synchronous Lung Metastasis Calls for Risk Stratification and Prognostic Classification: Evidence from a Population-Based Database. Cancers 2022, 14, 1608. https://doi.org/10.3390/cancers14071608
Wang S, Chen L, Feng Y, Swinnen JV, Jonscher C, Van Ongeval C, Ni Y. Heterogeneity of Synchronous Lung Metastasis Calls for Risk Stratification and Prognostic Classification: Evidence from a Population-Based Database. Cancers. 2022; 14(7):1608. https://doi.org/10.3390/cancers14071608
Chicago/Turabian StyleWang, Shuncong, Lei Chen, Yuanbo Feng, Johan V. Swinnen, Charles Jonscher, Chantal Van Ongeval, and Yicheng Ni. 2022. "Heterogeneity of Synchronous Lung Metastasis Calls for Risk Stratification and Prognostic Classification: Evidence from a Population-Based Database" Cancers 14, no. 7: 1608. https://doi.org/10.3390/cancers14071608