
Prometastatic Effect of ATX Derived from Alveolar Type II Pneumocytes and B16-F10 Melanoma Cells

 , and
, and 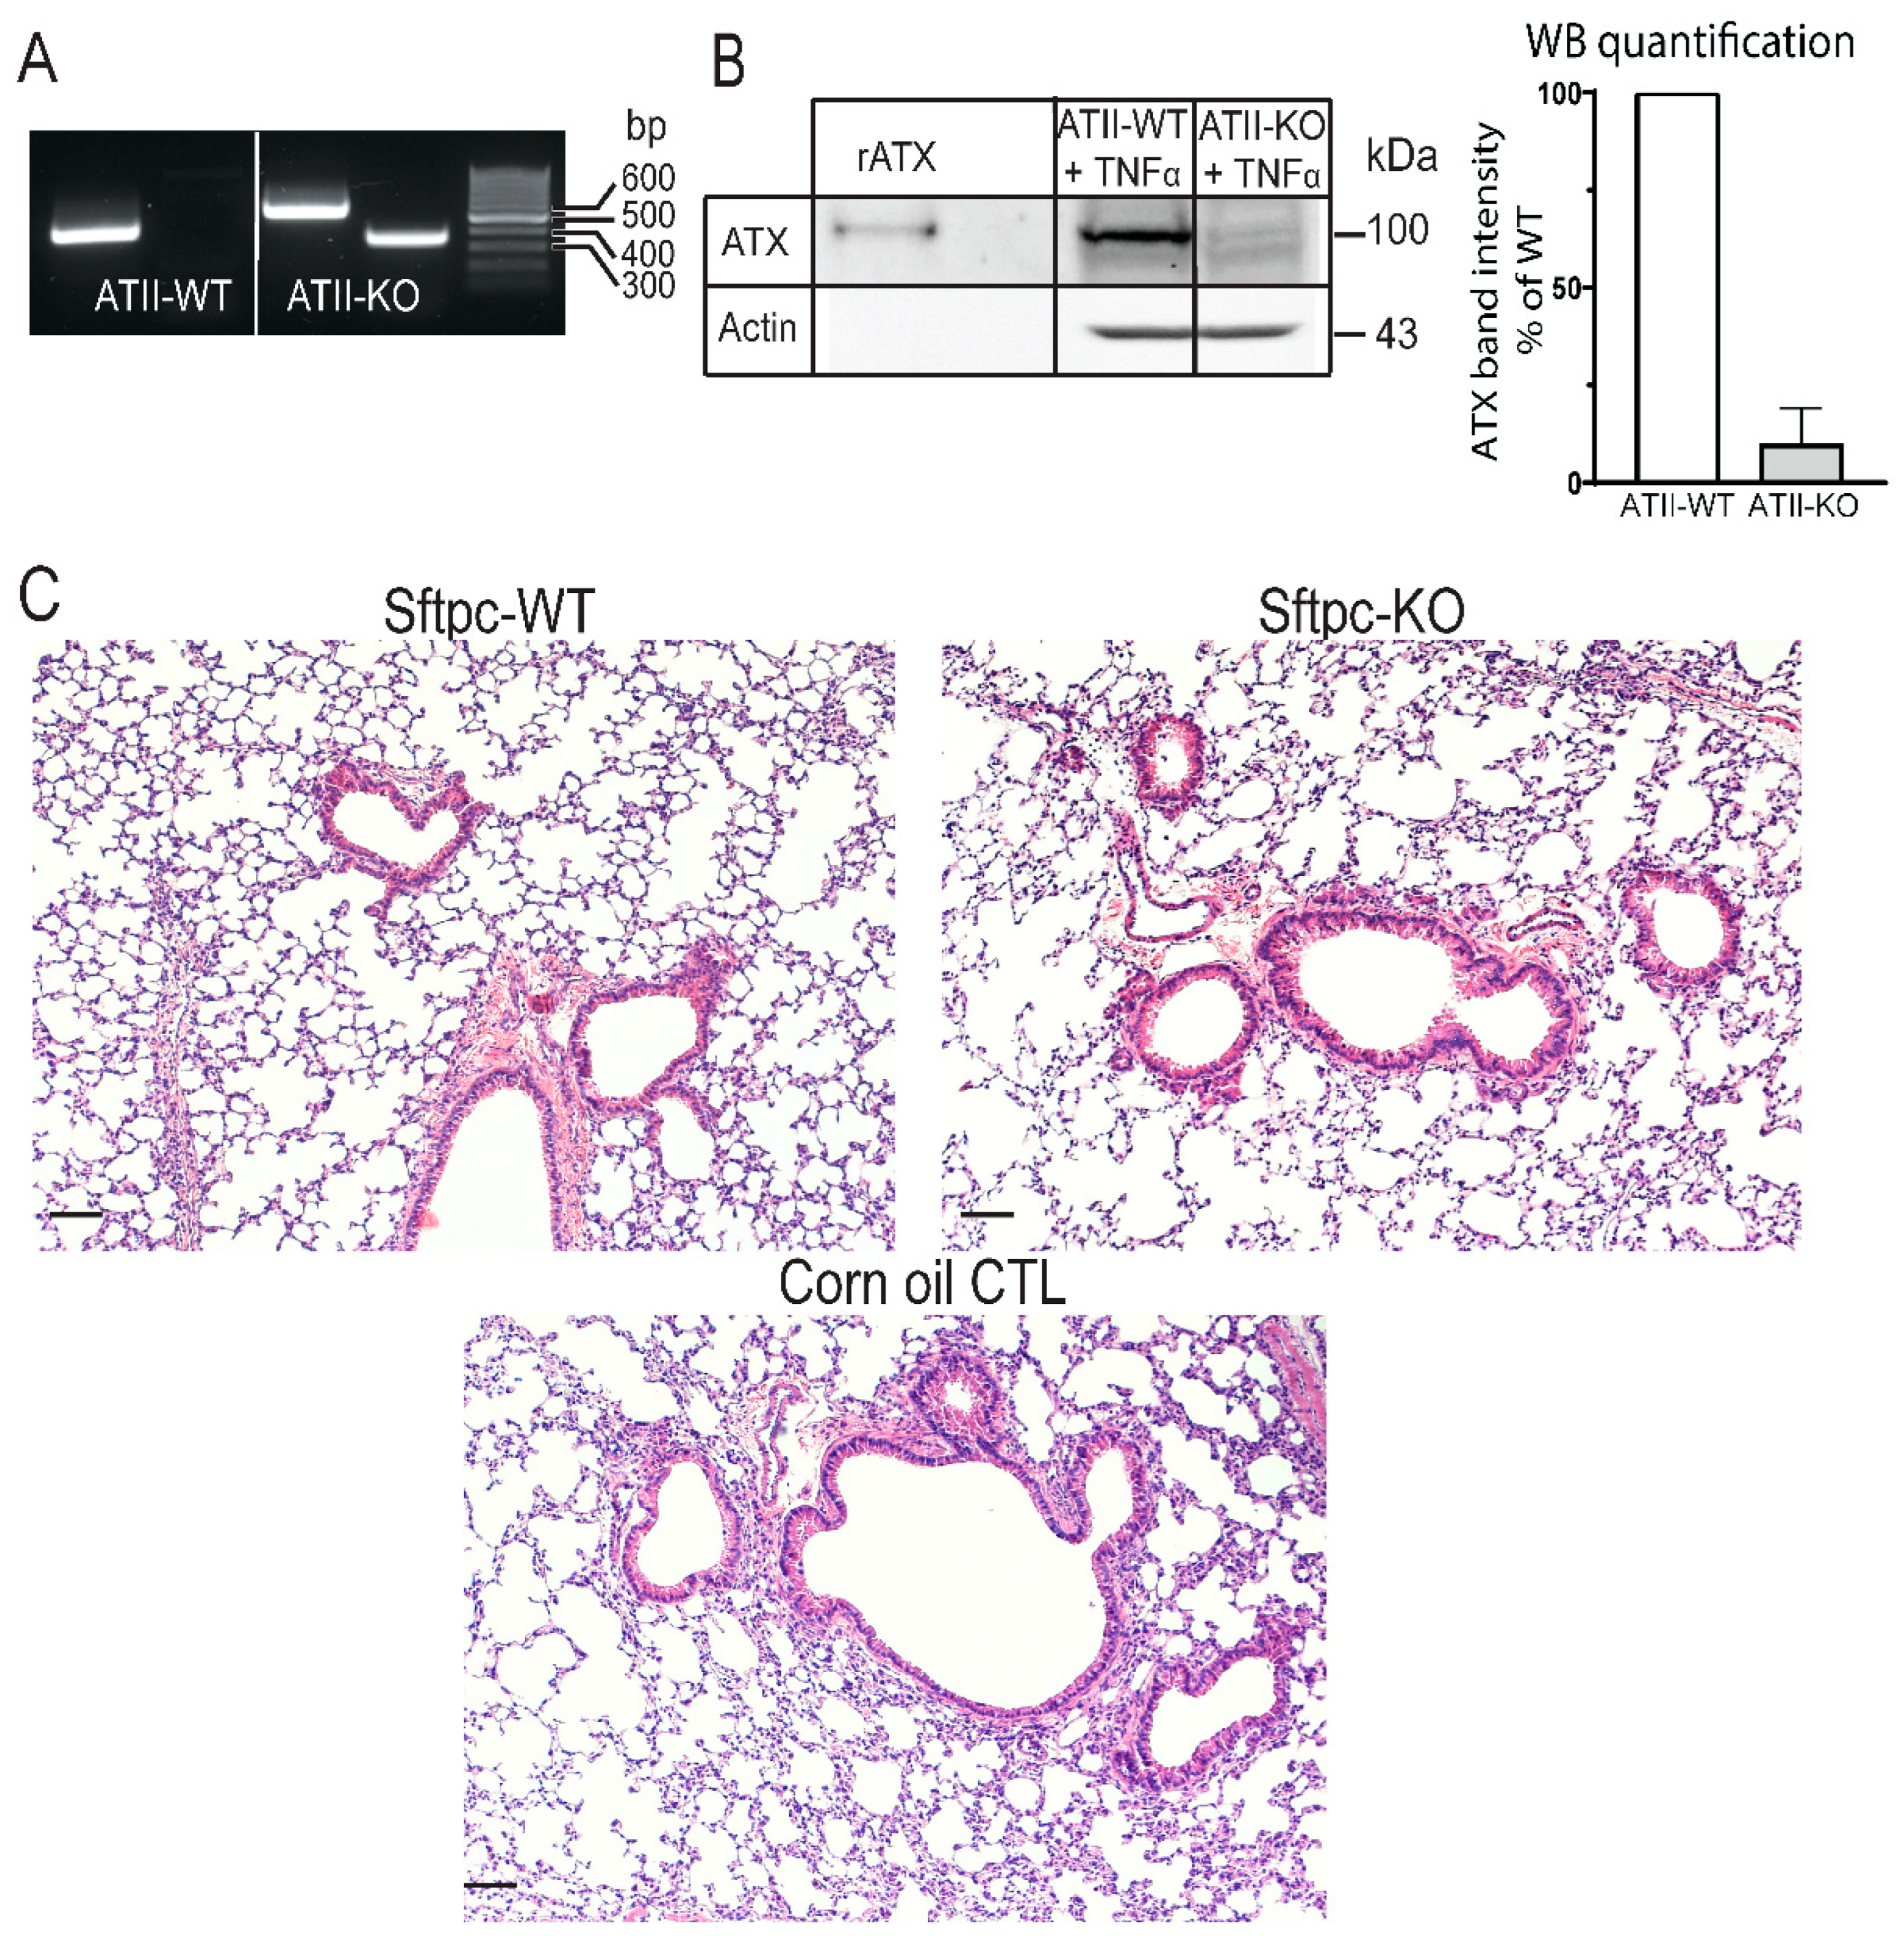
Abstract
:Simple Summary
Abstract
1. Introduction
2. Materials and Methods
2.1. CRISPR-Cas9-Edited B16-F10 Cells and Isolation of Murine ATII Cells
2.2. Animal Models
2.3. Tamoxifen Treatment
2.4. Measurement of ATX Activity
2.5. Western Blotting
2.6. Histology and Immunostaining
2.7. Immunofluorescence
2.8. Mass Spectrometry
2.9. Transwell Cell Migration Assay
2.10. Cell Proliferation Assay
2.11. Cytokine Measurement
2.12. Statistical Analysis
3. Results
3.1. Generation and Validation of an Inducible Conditional KO Mice in Which ATX Is Specifically Deleted in ATII Cells
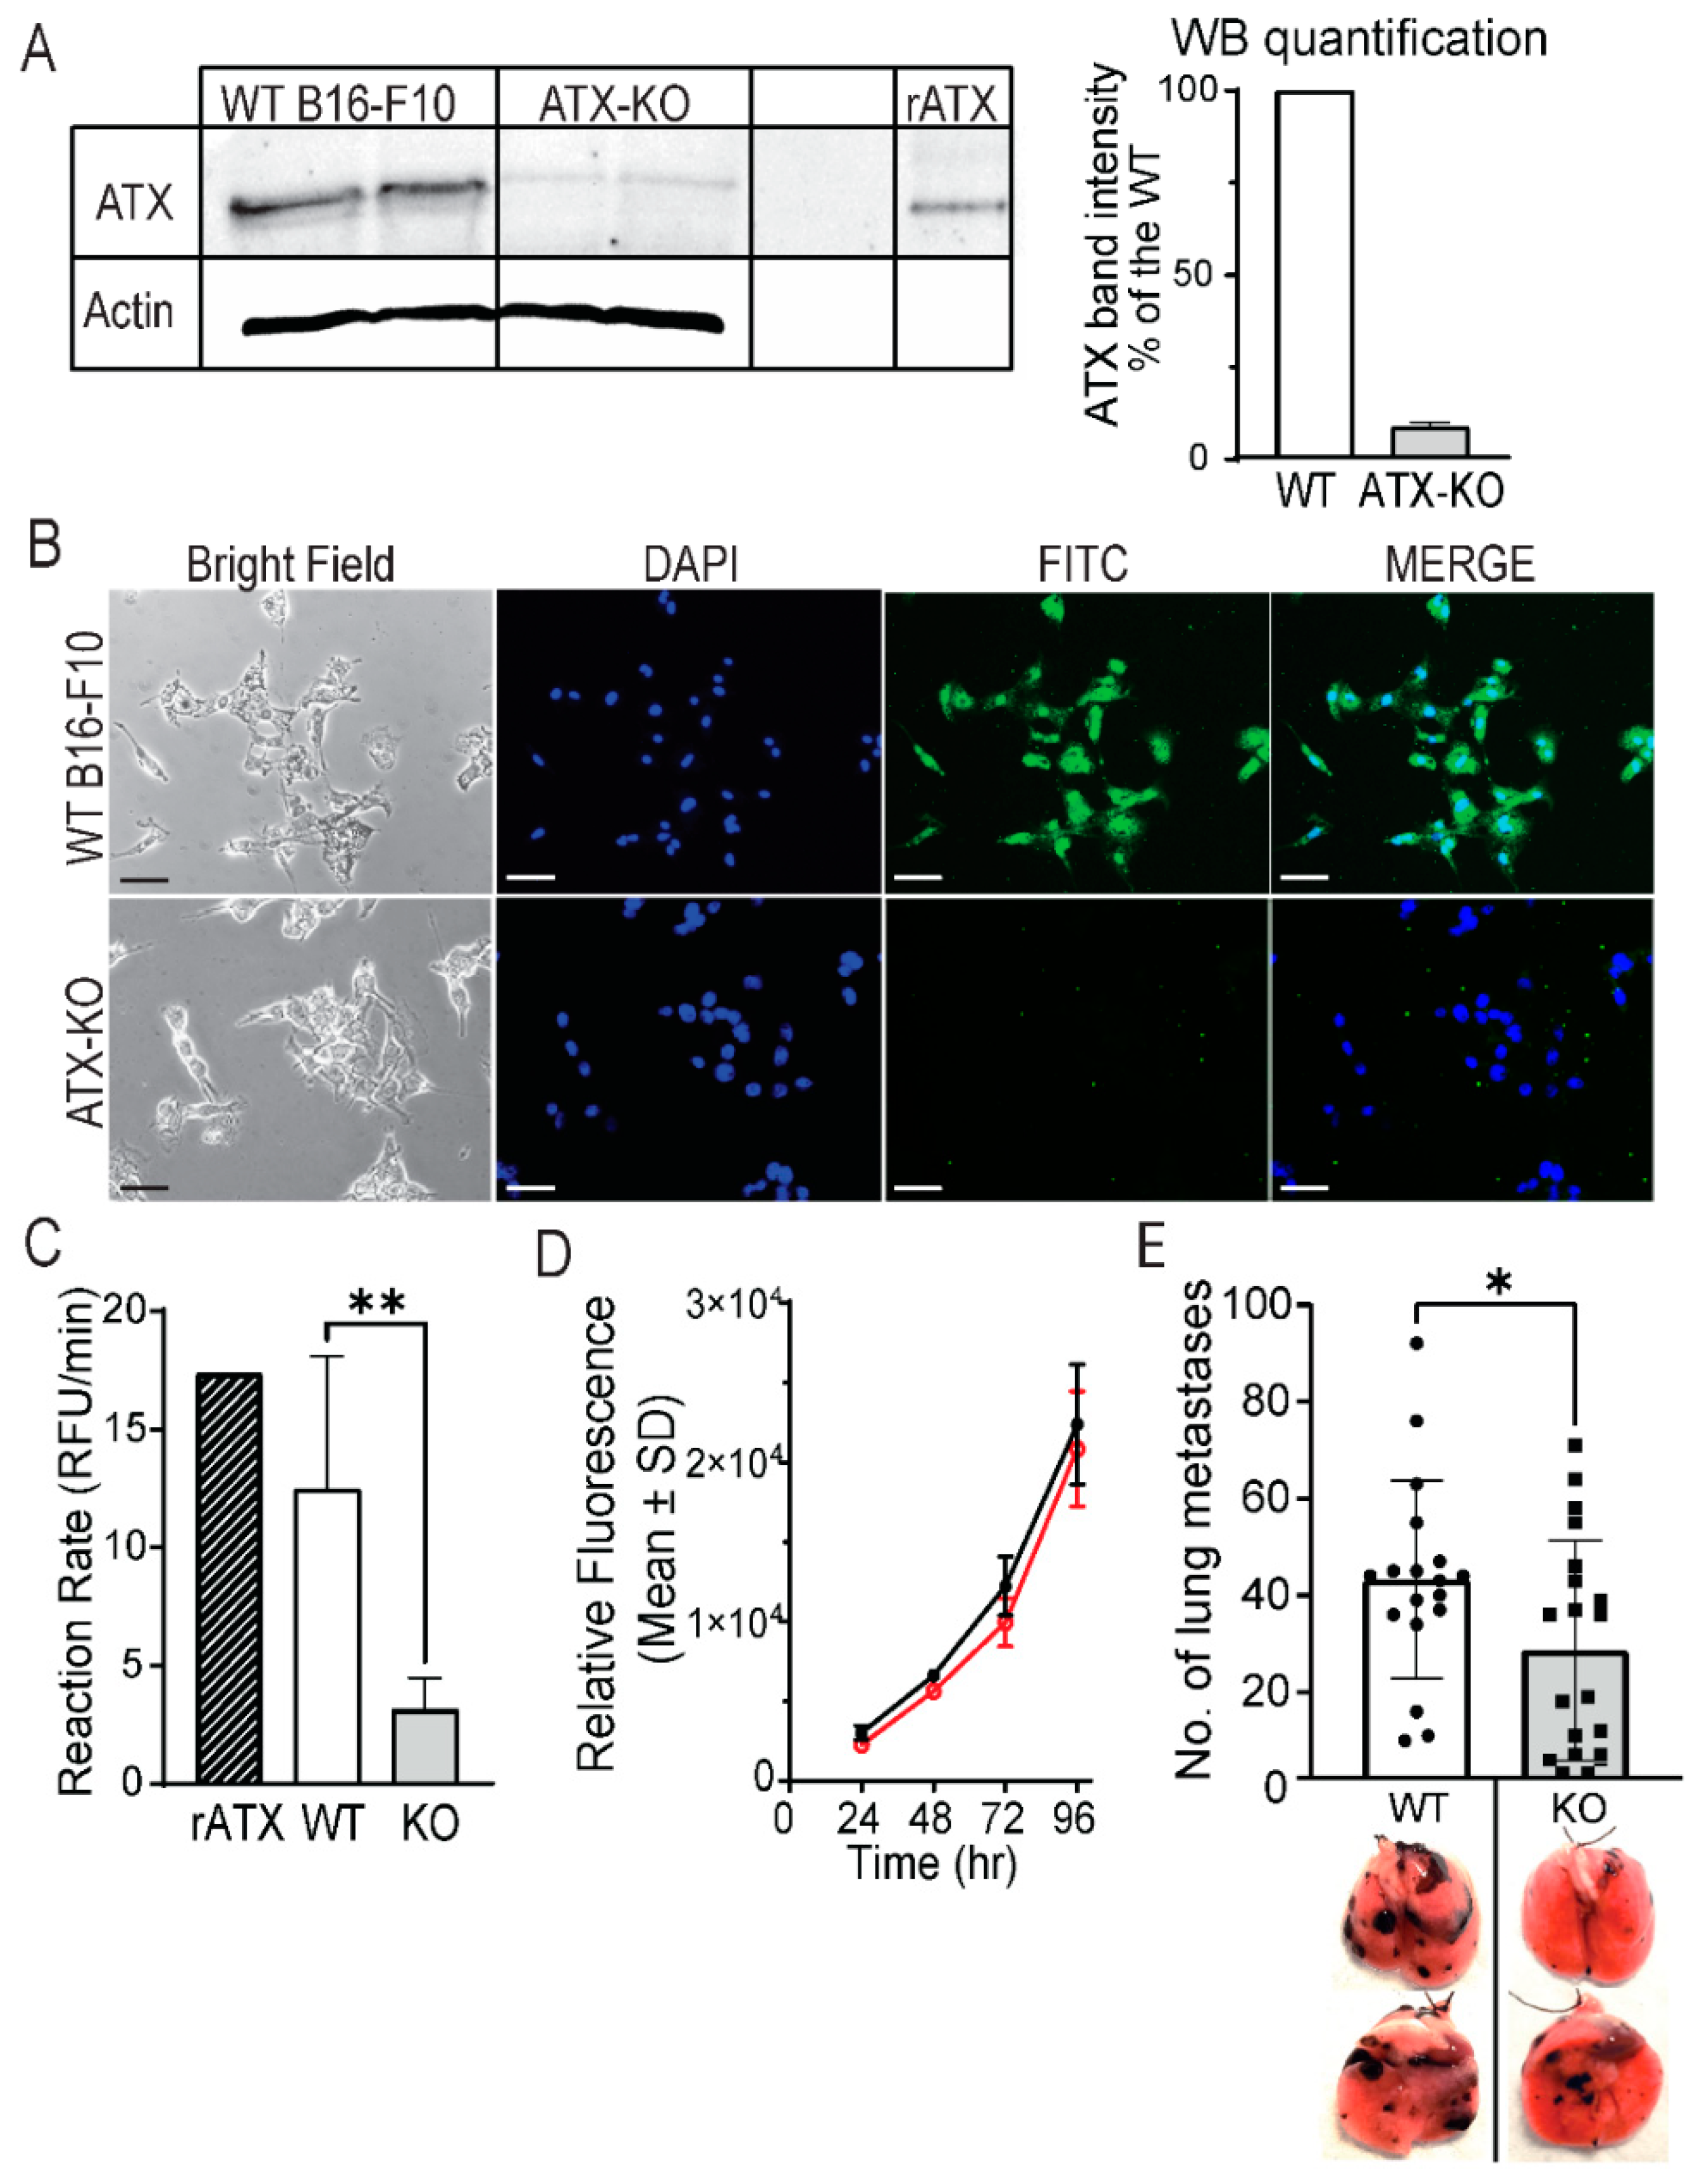
3.2. Generation and Characterization of ATX-KO B16-F10 Cell Line
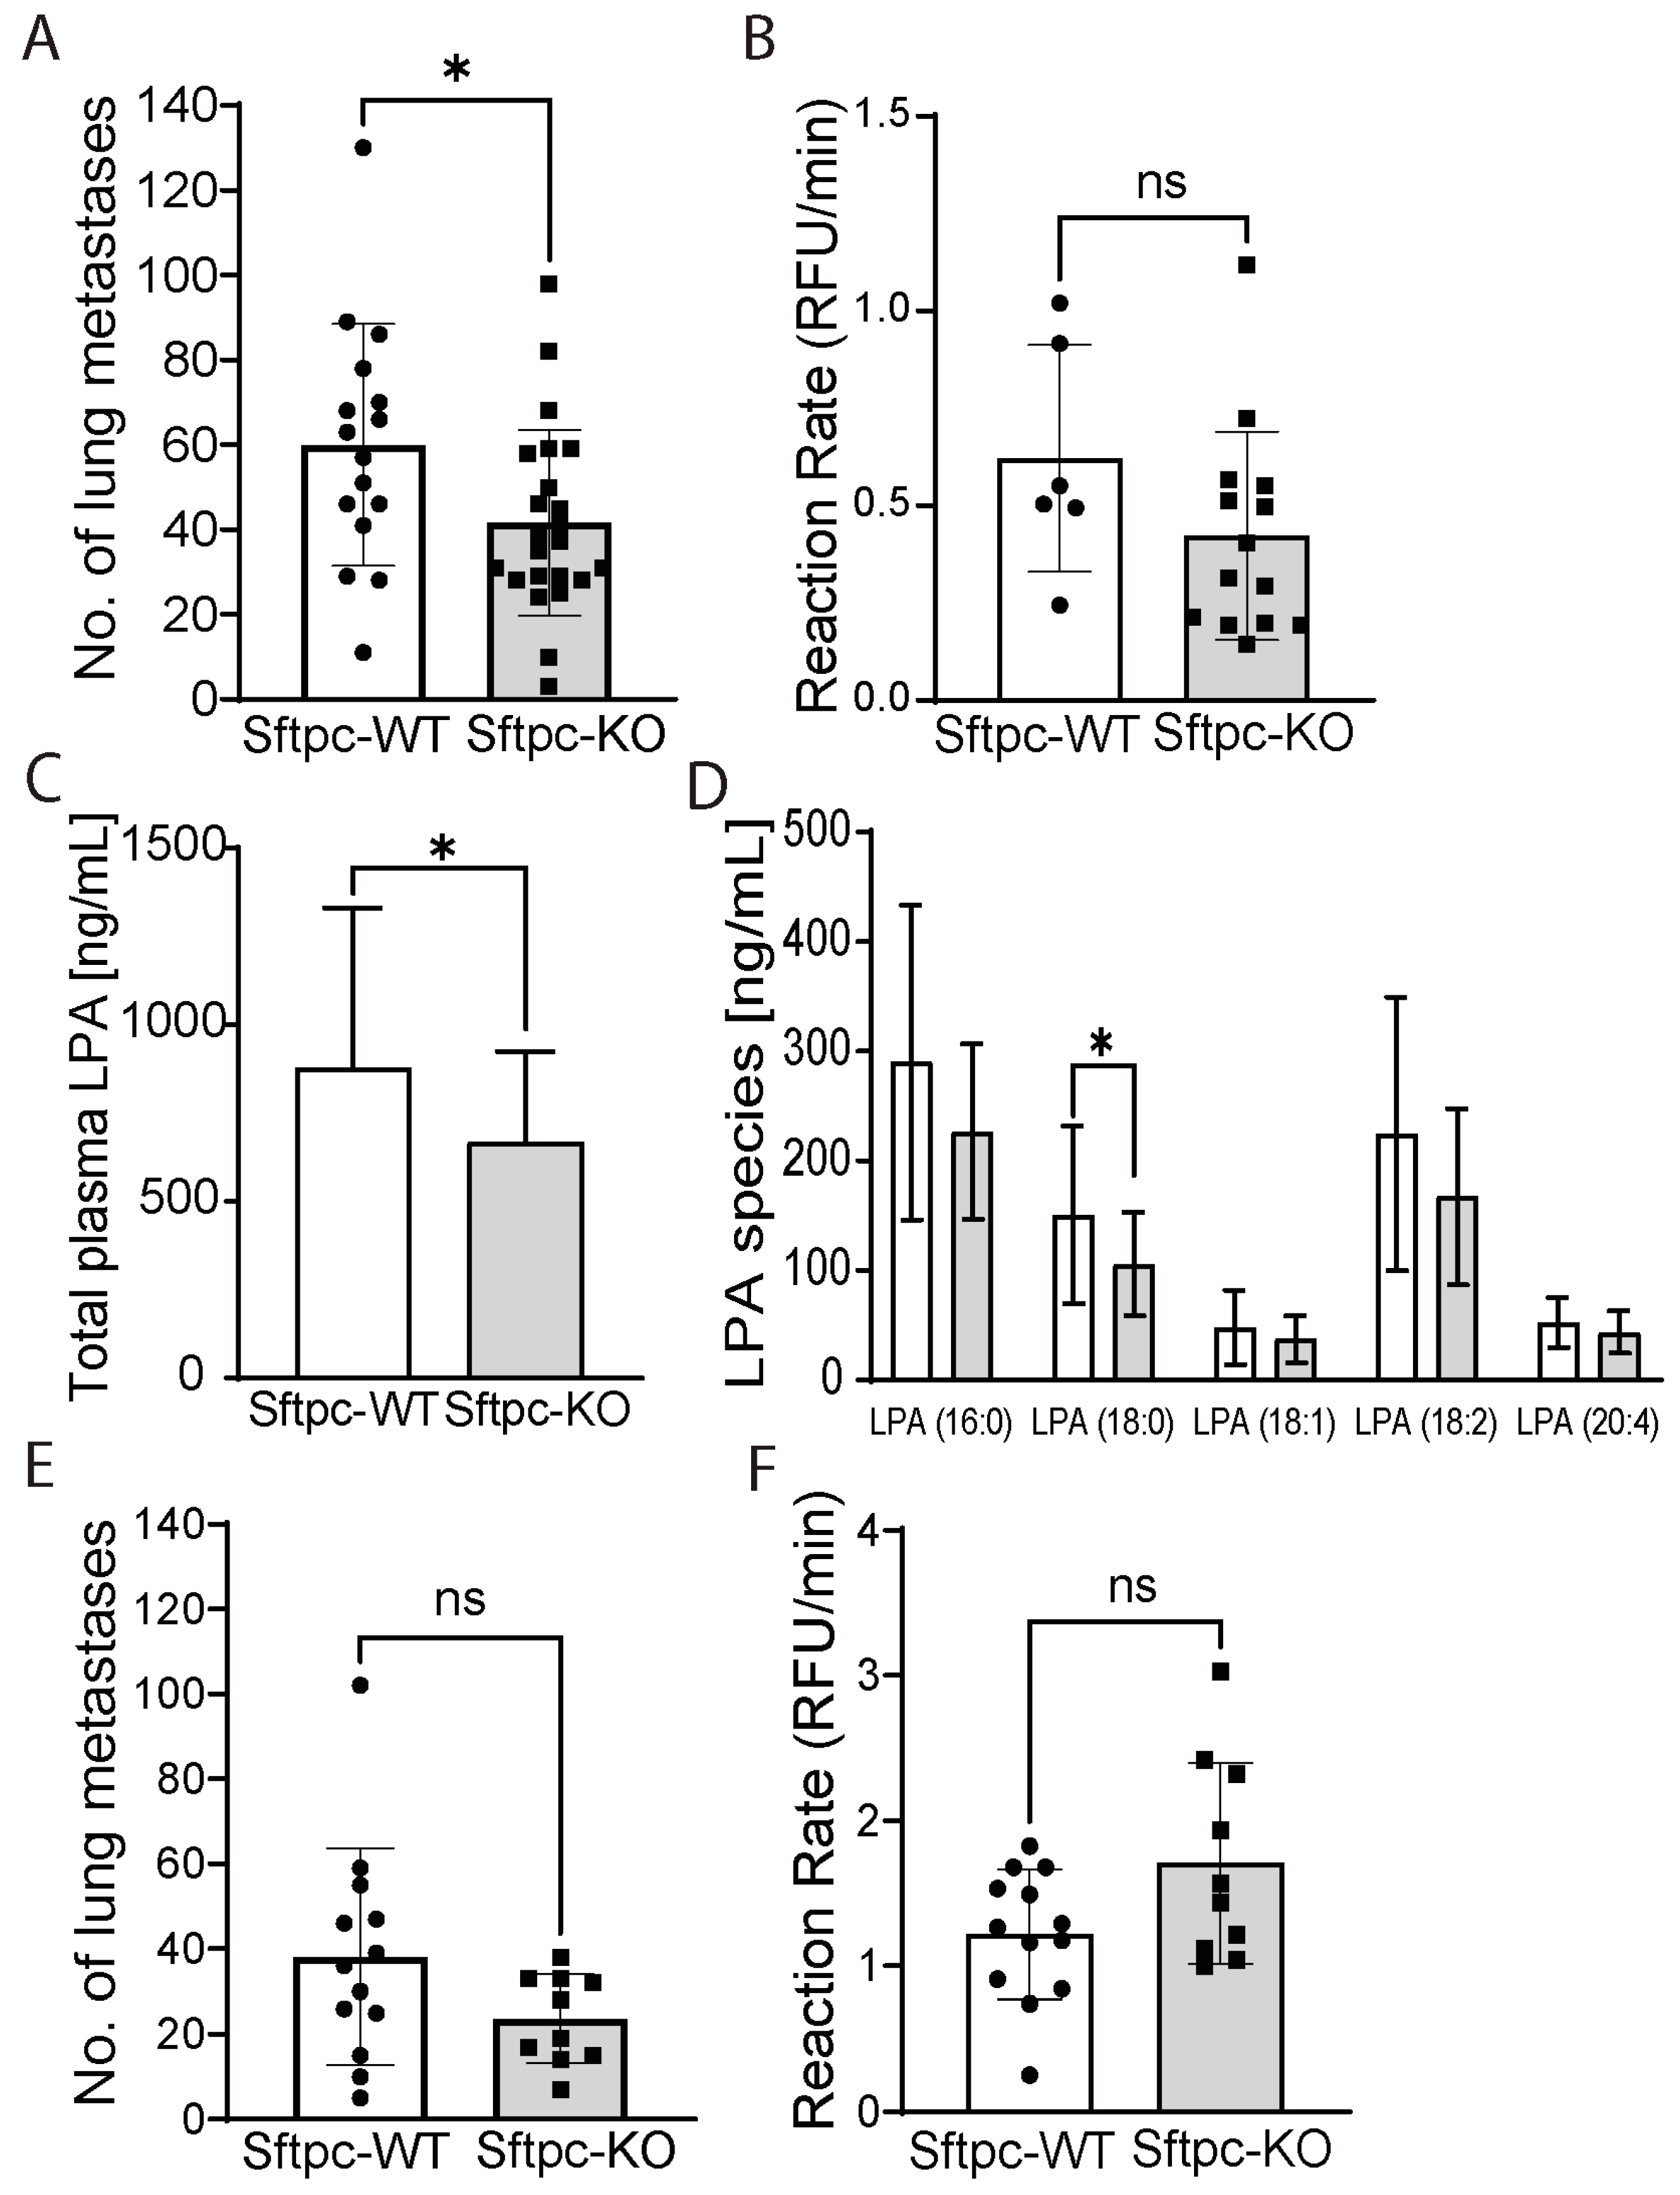
3.3. Deleting ATX from ATII Cells Reduces the Number of ATX-KO B16-F10 Lung Metastases
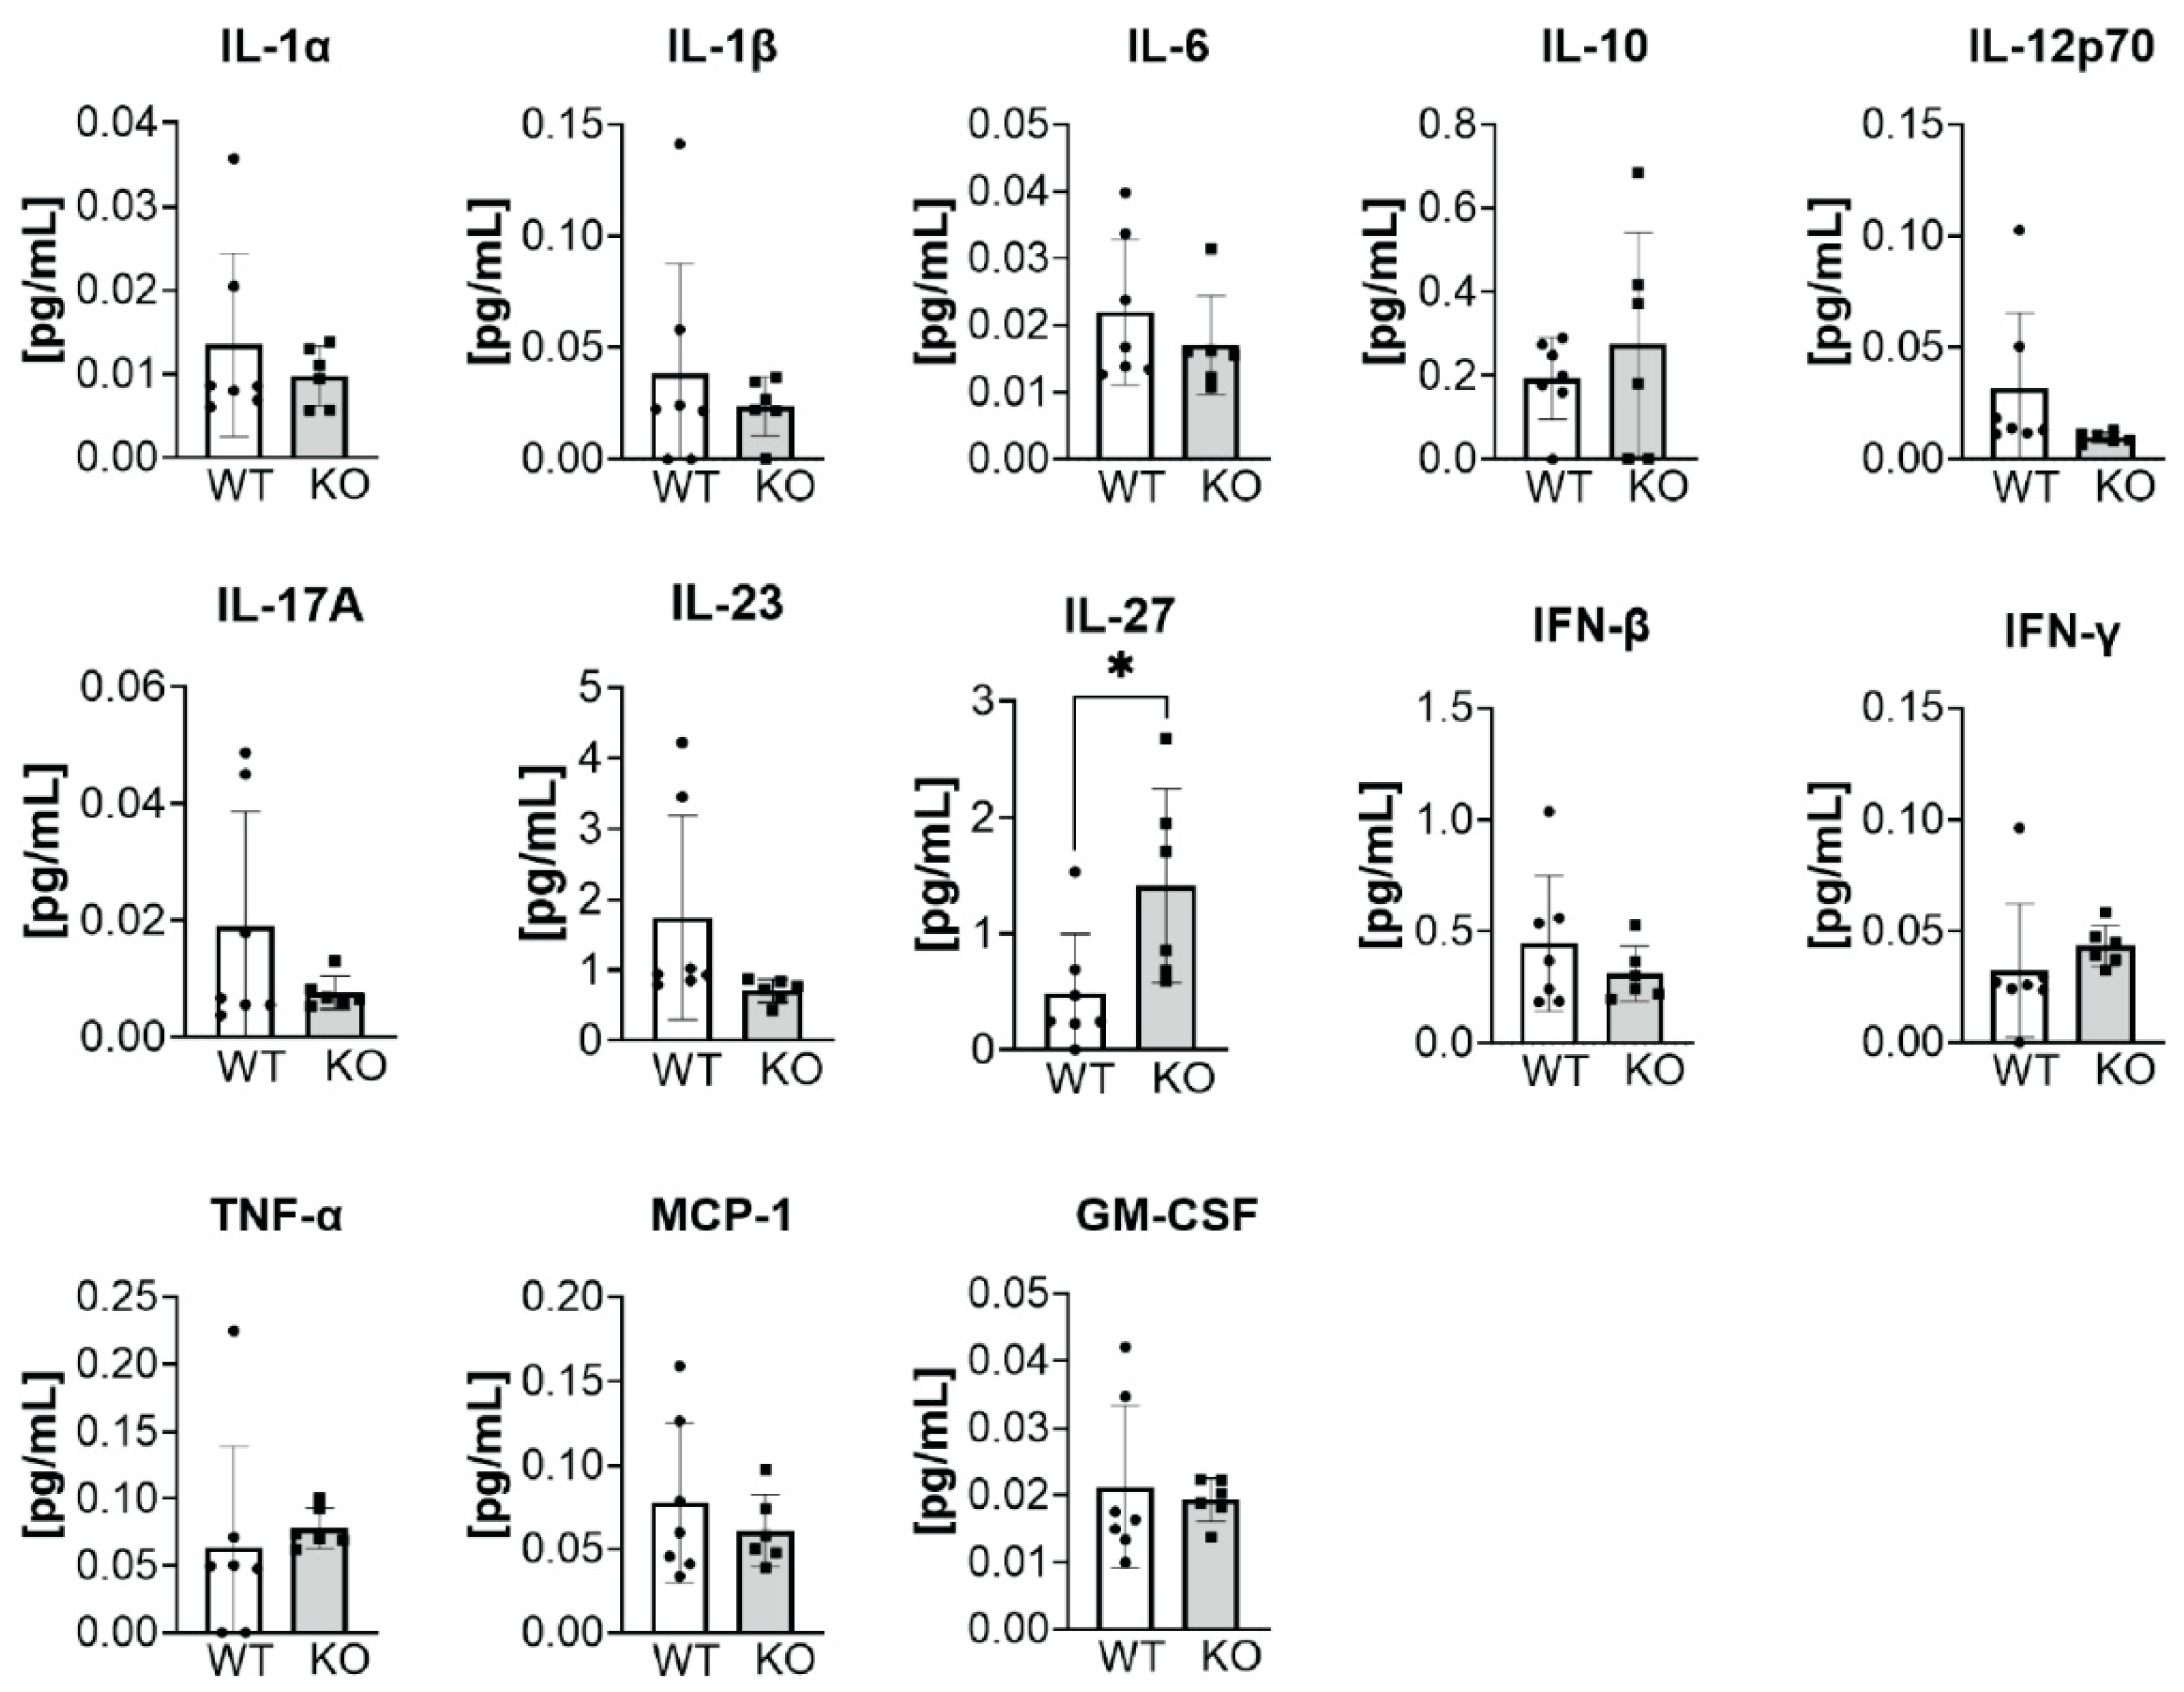
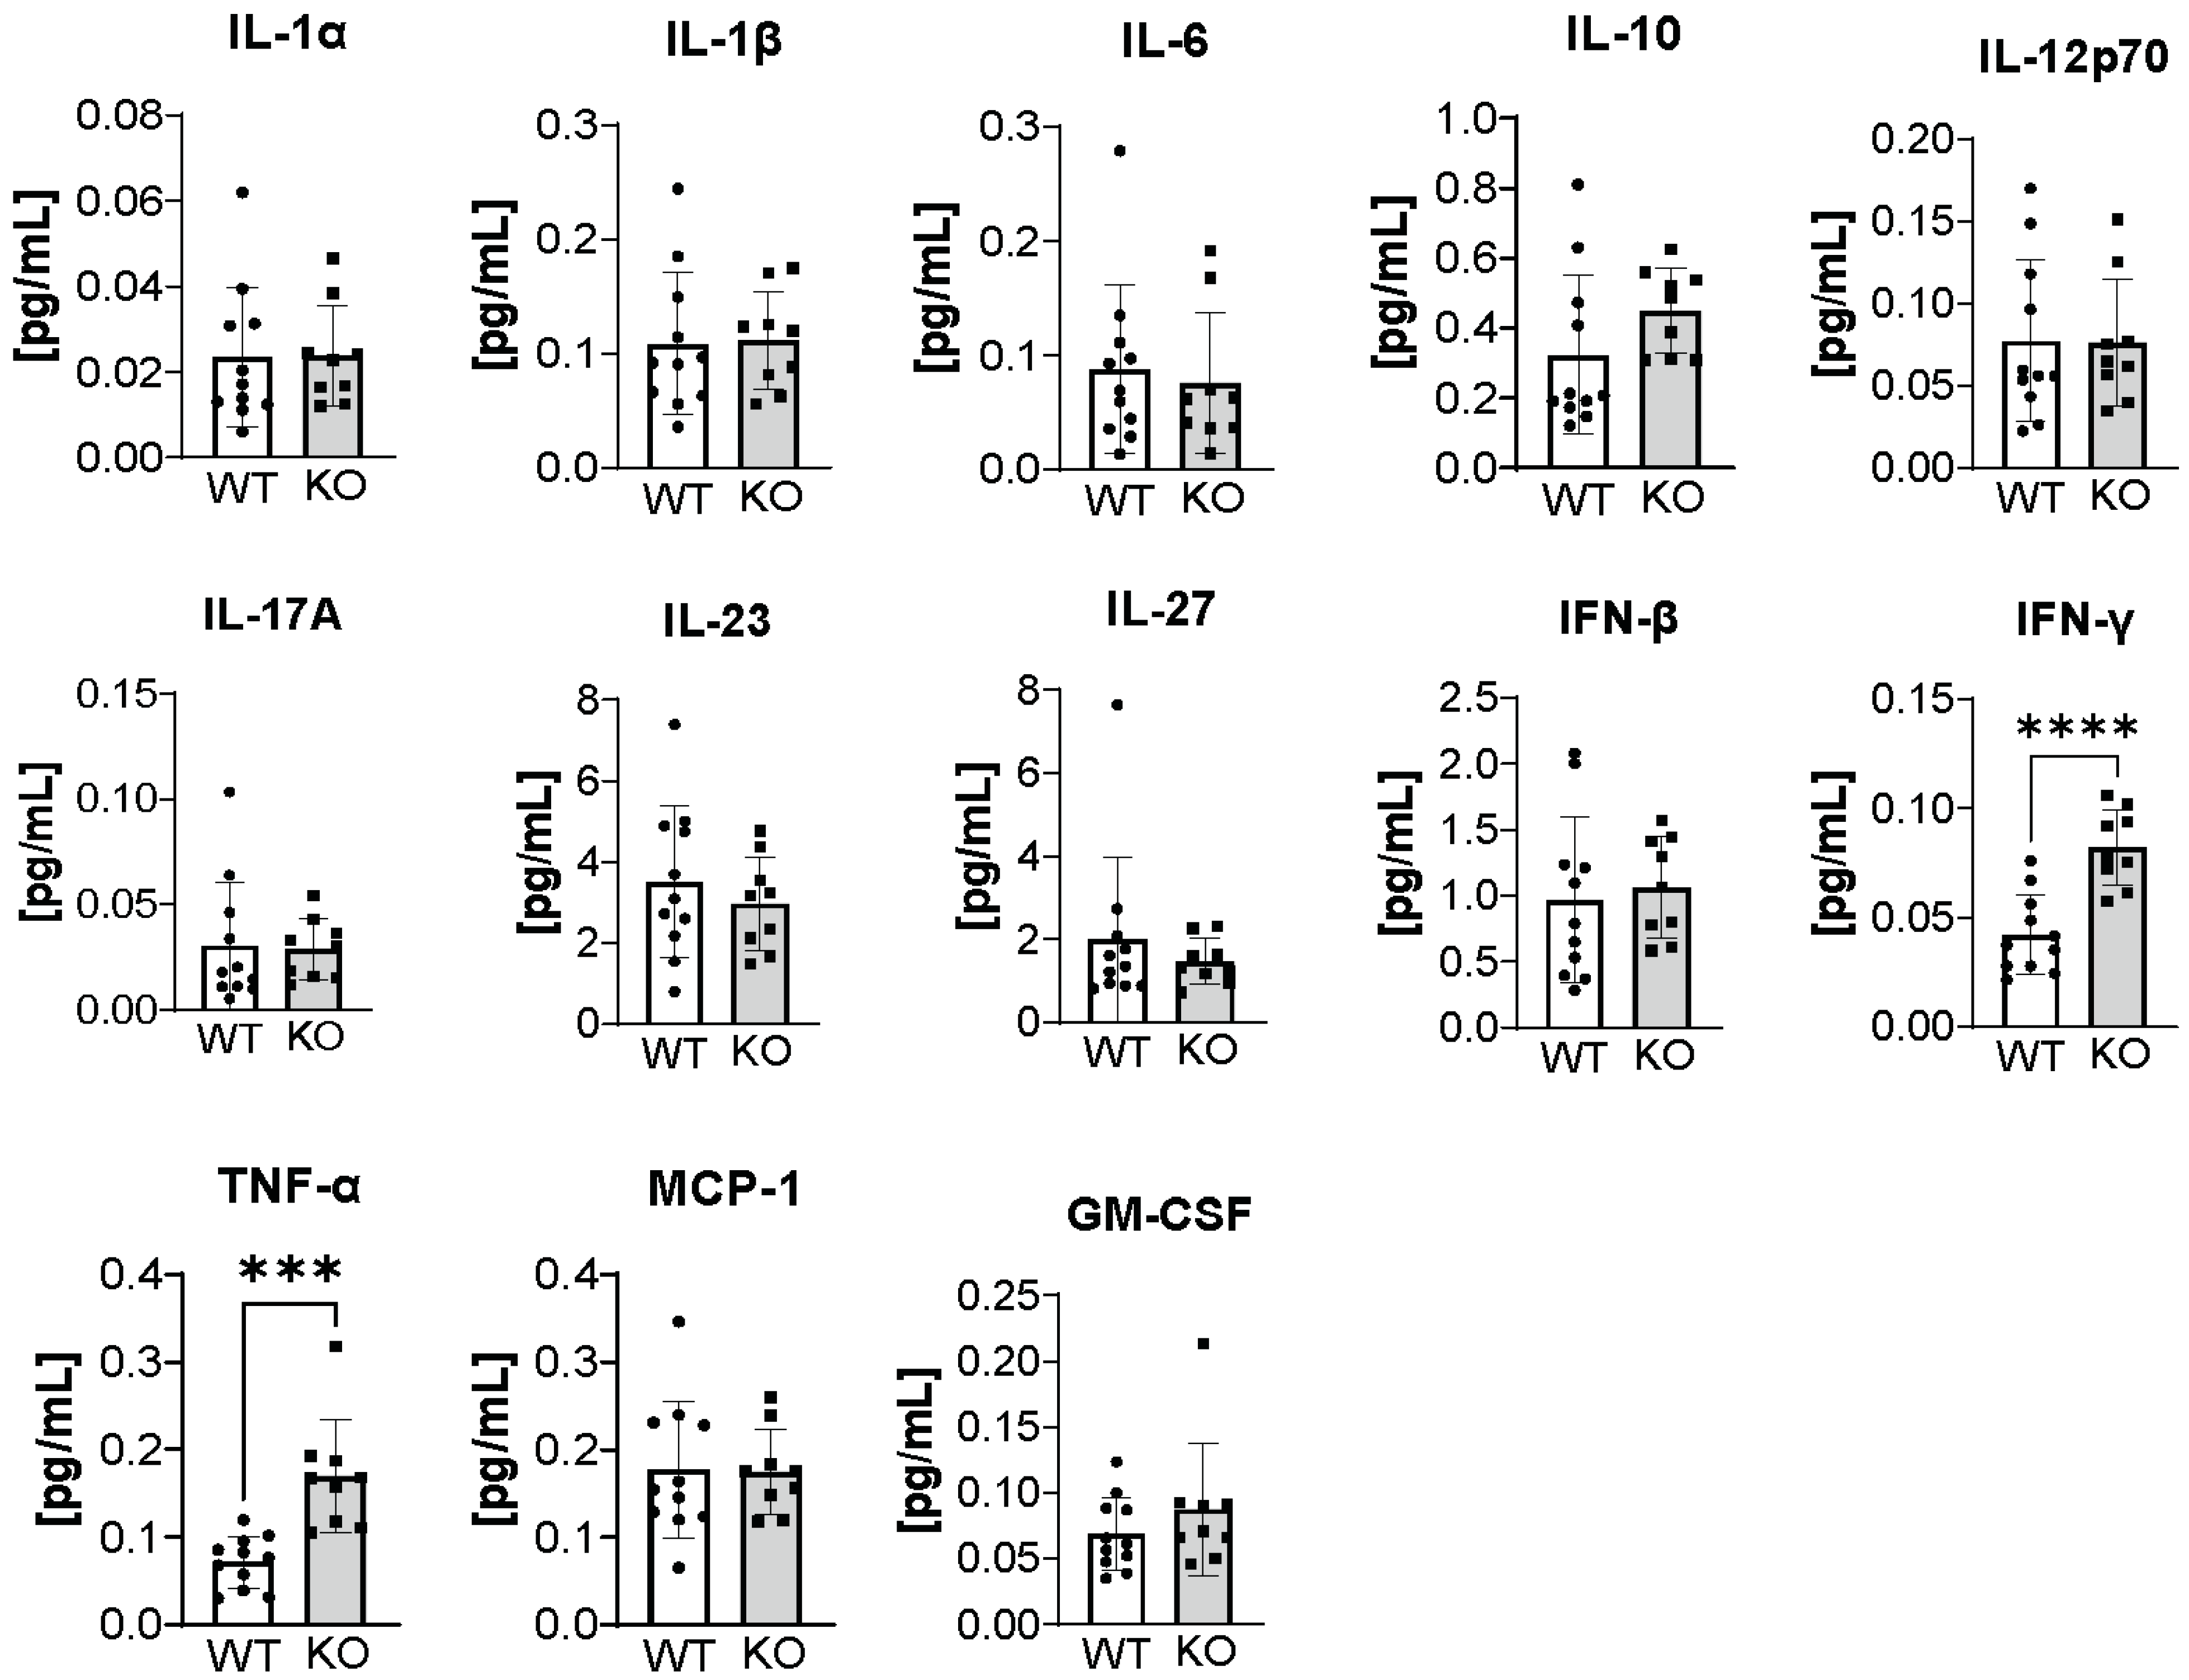
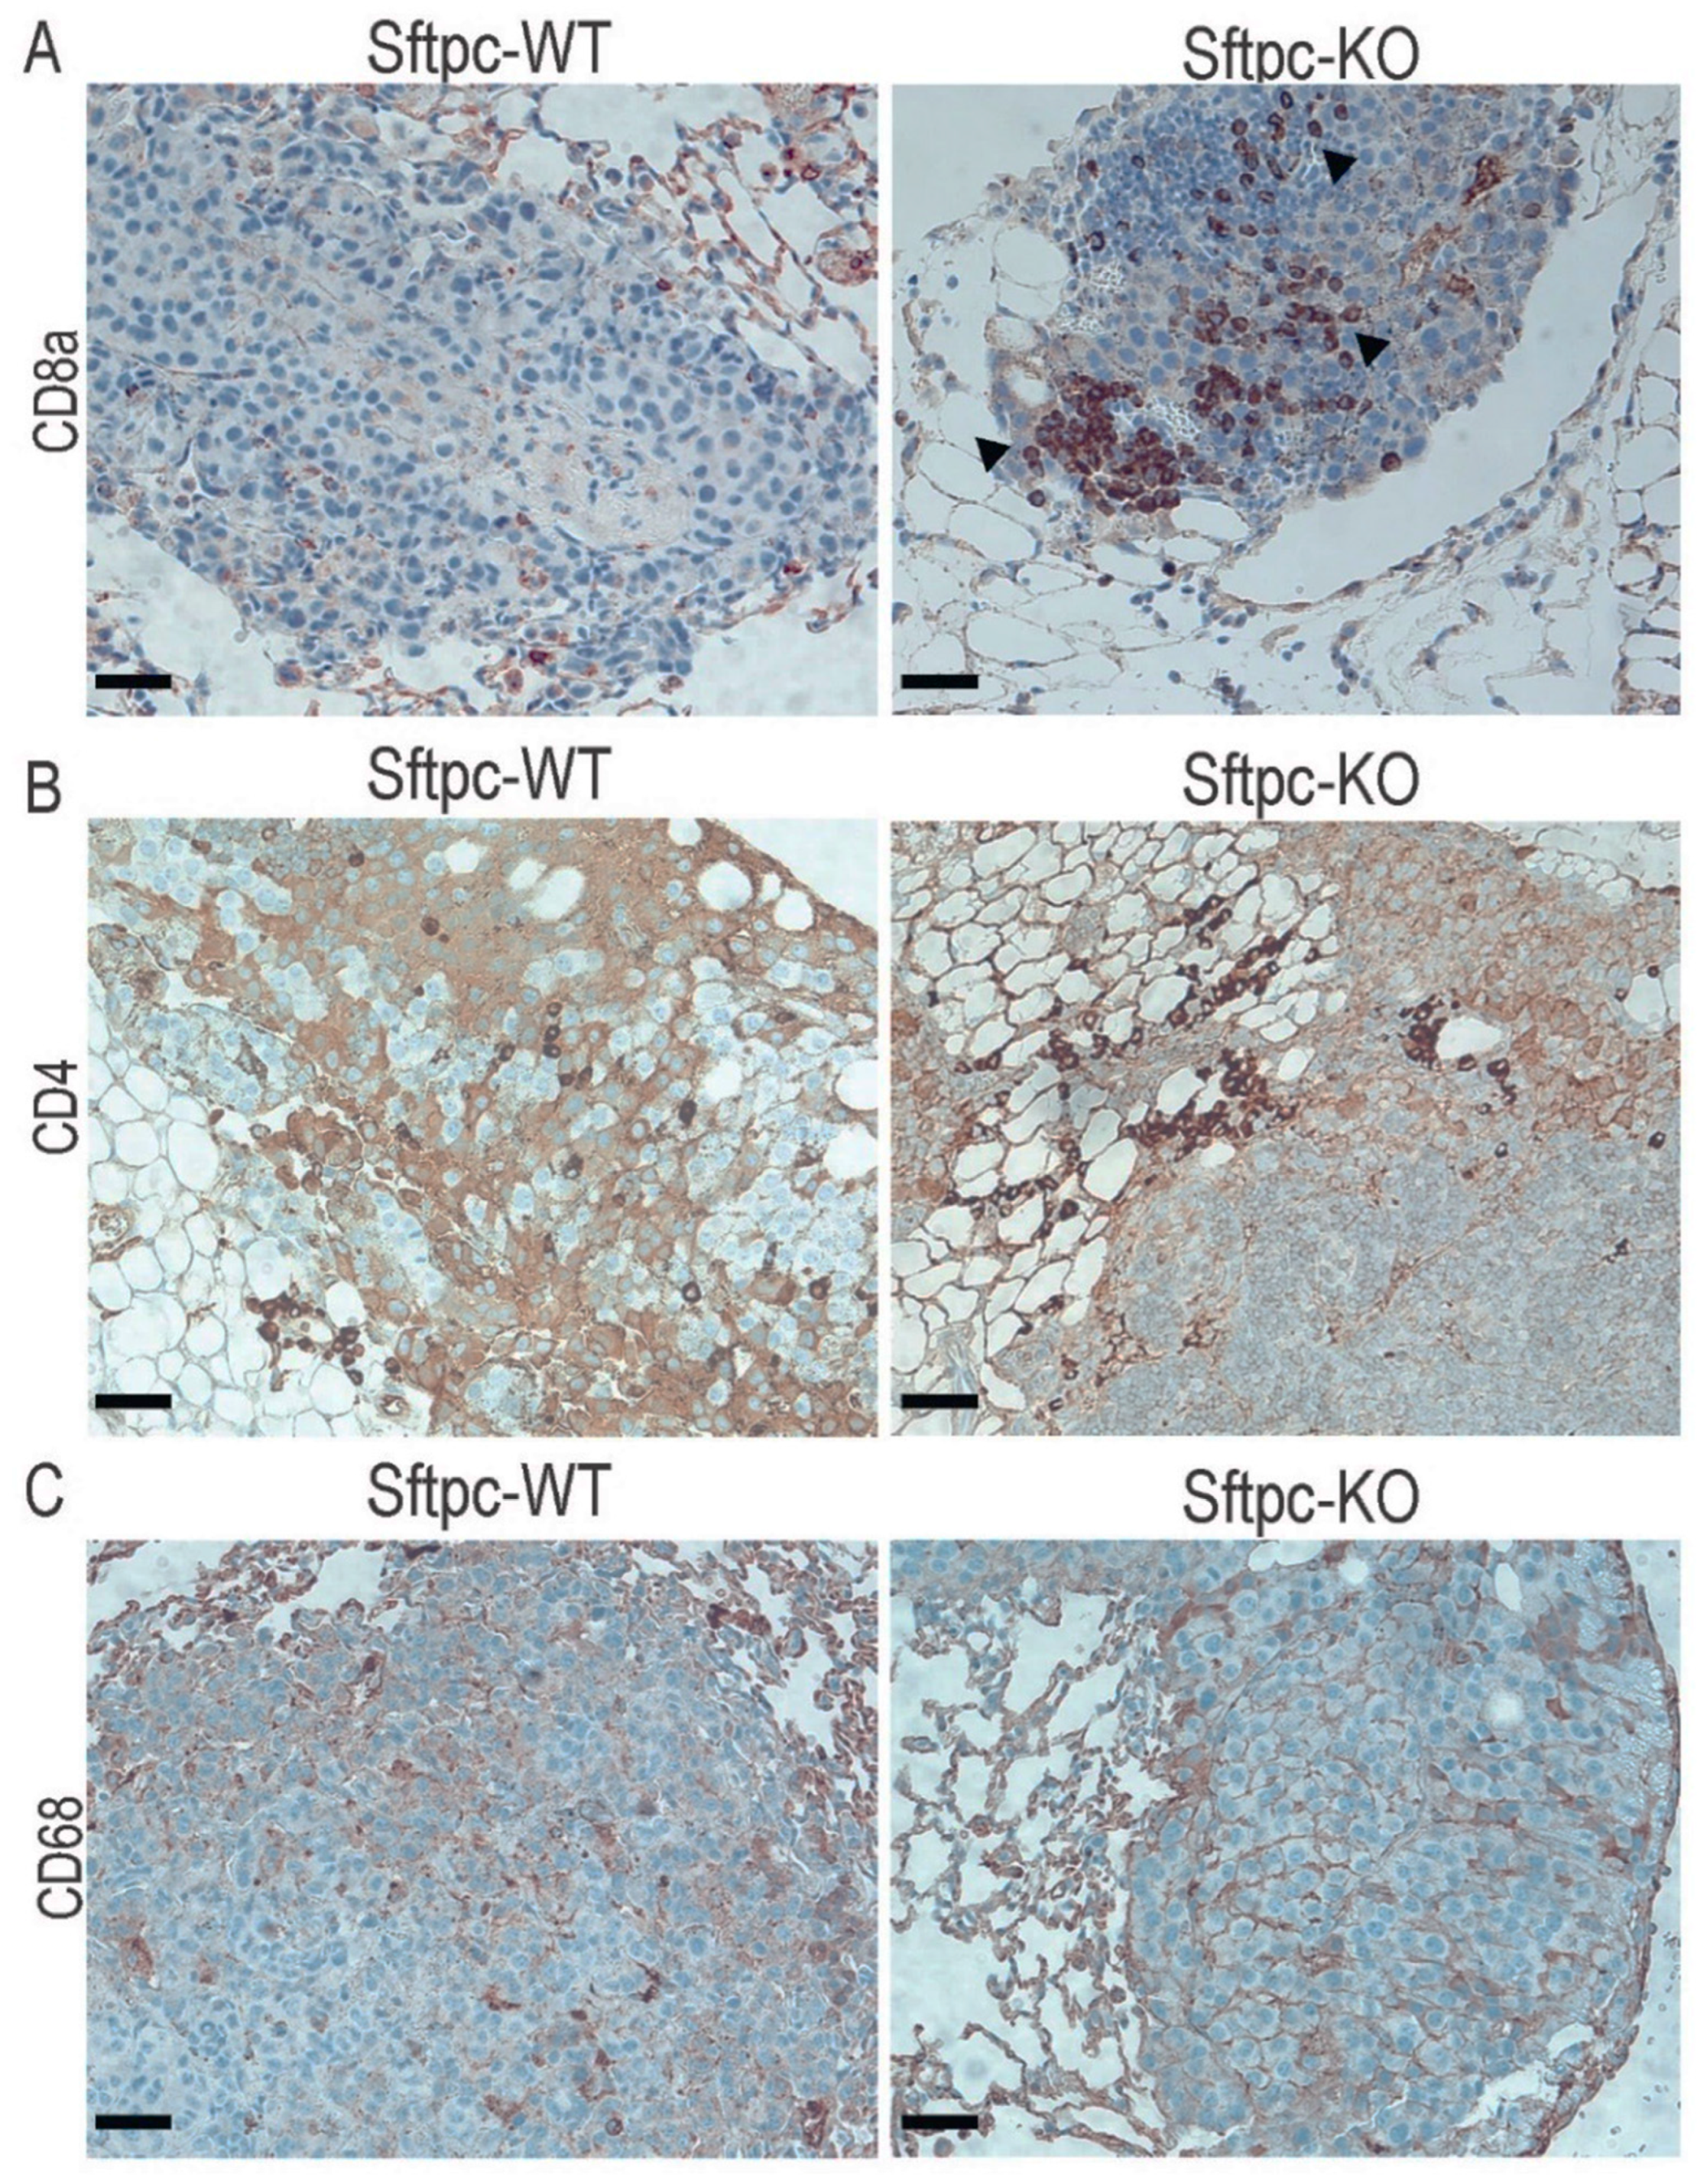
3.4. Changes in Immunological Response Associated with Deleting ATX in ATII Cells
4. Discussion
5. Conclusions
Supplementary Materials
Author Contributions
Funding
Institutional Review Board Statement
Informed Consent Statement
Data Availability Statement
Acknowledgments
Conflicts of Interest
References
- Fares, C.M.; Van Allen, E.M.; Drake, C.G.; Allison, J.P.; Hu-Lieskovan, S. Mechanisms of Resistance to Immune Checkpoint Blockade: Why Does Checkpoint Inhibitor Immunotherapy Not Work for All Patients? Am. Soc. Clin. Oncol. Educ. Book 2019, 39, 147–164. [Google Scholar] [CrossRef] [PubMed]
- Michielin, O.; Atkins, M.B.; Koon, H.B.; Dummer, R.; Ascierto, P.A. Evolving impact of long-term survival results on metastatic melanoma treatment. J. Immunother. Cancer 2020, 8, e000948. [Google Scholar] [CrossRef] [PubMed]
- van Zijl, F.; Krupitza, G.; Mikulits, W. Initial steps of metastasis: Cell invasion and endothelial transmigration. Mutat. Res. Mutat. Res. 2011, 728, 23–34. [Google Scholar] [CrossRef]
- Zhuyan, J.; Chen, M.; Zhu, T.; Bao, X.; Zhen, T.; Xing, K.; Wang, Q.; Zhu, S. Critical steps to tumor metastasis: Alterations of tumor microenvironment and extracellular matrix in the formation of pre-metastatic and metastatic niche. Cell Biosci. 2020, 10, 89. [Google Scholar] [CrossRef] [PubMed]
- Brodt, P. Role of the Microenvironment in Liver Metastasis: From Pre- to Prometastatic Niches. Clin. Cancer Res. 2016, 22, 5971–5982. [Google Scholar] [CrossRef] [PubMed] [Green Version]
- Hirata, E.; Sahai, E. Tumor Microenvironment and Differential Responses to Therapy. Cold Spring Harb. Perspect. Med. 2017, 7, a026781. [Google Scholar] [CrossRef] [Green Version]
- Benavente, S.; Sánchez-García, A.; Naches, S.; Lleonart, M.E.; Lorente, J. Therapy-Induced Modulation of the Tumor Microenvironment: New Opportunities for Cancer Therapies. Front. Oncol. 2020, 10, 582884. [Google Scholar] [CrossRef]
- Tigyi, G.J.; Yue, J.; Norman, D.D.; Szabo, E.; Balogh, A.; Balazs, L.; Zhao, G.; Lee, S.C. Regulation of tumor cell-Microenvironment interaction by the autotaxin-lysophosphatidic acid receptor axis. Adv. Biol. Regul. 2019, 71, 183–193. [Google Scholar] [CrossRef]
- Aiello, S.; Casiraghi, F. Lysophosphatidic Acid: Promoter of Cancer Progression and of Tumor Microenvironment Development. A Promising Target for Anticancer Therapies? Cells 2021, 10, 1390. [Google Scholar] [CrossRef]
- Stracke, M.L.; Krutzsch, H.C.; Unsworth, E.J.; Arestad, A.; Cioce, V.; Schiffmann, E.; Liotta, L.A. Identification, purification, and partial sequence analysis of autotaxin, a novel motility-stimulating protein. J. Biol. Chem. 1992, 267, 2524–2529. [Google Scholar] [CrossRef]
- Benesch, M.G.K.; Tang, X.; Dewald, J.; Dong, W.-F.; Mackey, J.R.; Hemmings, D.G.; McMullen, T.P.W.; Brindley, D.N. Tumor-induced inflammation in mammary adipose tissue stimulates a vicious cycle of autotaxin expression and breast cancer progression. FASEB J. 2015, 29, 3990–4000. [Google Scholar] [CrossRef] [Green Version]
- Brindley, D.N.; Lin, F.-T.; Tigyi, G.J. Role of the autotaxin–lysophosphatidate axis in cancer resistance to chemotherapy and radiotherapy. Biochim. Biophys. Acta (BBA)-Mol. Cell Biol. Lipids 2013, 1831, 74–85. [Google Scholar] [CrossRef] [Green Version]
- Zhang, X.; Li, M.; Yin, N.; Zhang, J. The Expression Regulation and Biological Function of Autotaxin. Cells 2021, 10, 939. [Google Scholar] [CrossRef]
- Leblanc, R.; Lee, S.-C.; David, M.; Bordet, J.-C.; Norman, D.D.; Patil, R.; Miller, D.; Sahay, D.; Ribeiro, J.; Clézardin, P.; et al. Interaction of platelet-derived autotaxin with tumor integrin αVβ3 controls metastasis of breast cancer cells to bone. Blood 2014, 124, 3141–3150. [Google Scholar] [CrossRef] [Green Version]
- Auciello, F.R.; Bulusu, V.; Oon, C.; Tait-Mulder, J.; Berry, M.; Bhattacharyya, S.; Tumanov, S.; Allen-Petersen, B.L.; Link, J.; Kendsersky, N.D.; et al. A Stromal Lysolipid–Autotaxin Signaling Axis Promotes Pancreatic Tumor Progression. Cancer Discov. 2019, 9, 617–627. [Google Scholar] [CrossRef] [Green Version]
- Magkrioti, C.; Oikonomou, N.; Kaffe, E.; Mouratis, M.-A.; Xylourgidis, N.; Barbayianni, I.; Megadoukas, P.; Harokopos, V.; Valavanis, C.; Chun, J.; et al. The autotaxin-lysophosphatidic acid axis promotes lung carcinogenesis. Cancer Res. 2018, 78, 3634–3644. [Google Scholar] [CrossRef] [Green Version]
- Gotoh, M.; Fujiwara, Y.; Yue, J.; Liu, J.; Lee, S.; Fells, J.; Uchiyama, A.; Murakami-Murofushi, K.; Kennel, S.; Wall, J.; et al. Controlling cancer through the autotaxin-lysophosphatidic acid receptor axis. Biochem. Soc. Trans. 2012, 40, 31–36. [Google Scholar] [CrossRef] [Green Version]
- Lee, S.-C.; Fujiwara, Y.; Liu, J.; Yue, J.; Shimizu, Y.; Norman, D.D.; Wang, Y.; Tsukahara, R.; Szabo, E.; Patil, R.; et al. Autotaxin and LPA1 and LPA5 Receptors Exert Disparate Functions in Tumor Cells versus the Host Tissue Microenvironment in Melanoma Invasion and Metastasis. Mol. Cancer Res. 2015, 13, 174–185. [Google Scholar] [CrossRef] [Green Version]
- Minn, A.J.; Gupta, G.P.; Siegel, P.M.; Bos, P.D.; Shu, W.; Giri, D.D.; Viale, A.; Olshen, A.B.; Gerald, W.L.; Massagué, J. Genes that mediate breast cancer metastasis to lung. Nature 2005, 436, 518–524. [Google Scholar] [CrossRef]
- Ruaro, B.; Salton, F.; Braga, L.; Wade, B.; Confalonieri, P.; Volpe, M.C.; Baratella, E.; Maiocchi, S.; Confalonieri, M. The History and Mystery of Alveolar Epithelial Type II Cells: Focus on Their Physiologic and Pathologic Role in Lung. Int. J. Mol. Sci. 2021, 22, 2566. [Google Scholar] [CrossRef]
- Castranova, V.; Rabovsky, J.; Tucker, J.; Miles, P. The alveolar type II epithelial cell: A multifunctional pneumocyte. Toxicol. Appl. Pharmacol. 1988, 93, 472–483. [Google Scholar] [CrossRef]
- Zhao, J.; He, D.; Berdyshev, E.; Zhong, M.; Salgia, R.; Morris, A.J.; Smyth, S.S.; Natarajan, V.; Zhao, Y. Autotaxin induces lung epithelial cell migration through lysoPLD activity-dependent and -independent pathways. Biochem. J. 2011, 439, 45–55. [Google Scholar] [CrossRef] [Green Version]
- Oikonomou, N.; Mouratis, M.-A.; Tzouvelekis, A.; Kaffe, E.; Valavanis, C.; Vilaras, G.; Karameris, A.; Prestwich, G.D.; Bouros, D.; Aidinis, V. Pulmonary Autotaxin Expression Contributes to the Pathogenesis of Pulmonary Fibrosis. Am. J. Respir. Cell Mol. Biol. 2012, 47, 566–574. [Google Scholar] [CrossRef]
- Sinha, M.; Lowell, C. Isolation of Highly Pure Primary Mouse Alveolar Epithelial Type II Cells by Flow Cytometric Cell Sorting. Bio-Protocol 2016, 6, e2013. [Google Scholar] [CrossRef] [Green Version]
- Sun, F.; Xiao, G.; Qu, Z. Isolation of Murine Alveolar Type II Epithelial Cells. Bio-Protocol 2017, 7, 2288. [Google Scholar] [CrossRef] [Green Version]
- Van Meeteren, L.A.; Ruurs, P.; Stortelers, C.; Bouwman, P.; van Rooijen, M.A.; Pradère, J.P.; Pettit, T.R.; Wakelam, M.J.O.; Saulnier-Blache, J.S.; Mummery, C.L.; et al. Autotaxin, a Secreted Lysophospholipase D, Is Essential for Blood Vessel Formation during Development. Mol. Cell. Biol. 2006, 26, 5015–5022. [Google Scholar] [CrossRef] [Green Version]
- Okudaira, M.; Inoue, A.; Shuto, A.; Nakanaga, K.; Kano, K.; Makide, K.; Saigusa, D.; Tomioka, Y.; Aoki, J. Separation and quantification of 2-acyl-1-lysophospholipids and 1-acyl-2-lysophospholipids in biological samples by LC-MS/MS. J. Lipid Res. 2014, 55, 2178–2192. [Google Scholar] [CrossRef] [Green Version]
- Huh, W.J.; Khurana, S.S.; Geahlen, J.H.; Kohli, K.; Waller, R.A.; Mills, J.C. Tamoxifen Induces Rapid, Reversible Atrophy, and Metaplasia in Mouse Stomach. Gastroenterology 2012, 142, 21–24.e7. [Google Scholar] [CrossRef] [Green Version]
- Etori, S.; Nakano, R.; Kamada, H.; Hosokawa, K.; Takeda, S.; Fukuhara, M.; Kenmotsu, Y.; Ishimine, A.; Sato, K. Tamoxifen-induced Lung Injury. Intern. Med. 2017, 56, 2903–2906. [Google Scholar] [CrossRef] [Green Version]
- Donocoff, R.S.; Teteloshvili, N.; Chung, H.; Shoulson, R.; Creusot, R.J. Optimization of tamoxifen-induced Cre activity and its effect on immune cell populations. Sci. Rep. 2020, 10, 15244. [Google Scholar] [CrossRef]
- Gupte, R.; Patil, R.; Liu, J.; Wang, Y.; Lee, S.C.; Fujiwara, Y.; Fells, J.; Bolen, A.L.; Emmons-Thompson, K.; Yates, C.R.; et al. Benzyl and Naphthalene Methylphosphonic Acid Inhibitors of Autotaxin with Anti-invasive and Anti-metastatic Activity. ChemMedChem 2011, 6, 922–935. [Google Scholar] [CrossRef] [Green Version]
- Mathew, D.; Kremer, K.N.; Strauch, P.; Tigyi, G.; Pelanda, R.; Torres, R.M. LPA5 Is an Inhibitory Receptor That Suppresses CD8 T-Cell Cytotoxic Function via Disruption of Early TCR Signaling. Front. Immunol. 2019, 10, 1159. [Google Scholar] [CrossRef] [Green Version]
- Bockerstett, K.A.; Petersen, C.P.; Noto, C.N.; Kuehm, L.M.; Wong, C.F.; Ford, E.L.; Teague, R.M.; Mills, J.C.; Goldenring, J.R.; DiPaolo, R.J. Interleukin 27 Protects From Gastric Atrophy and Metaplasia During Chronic Autoimmune Gastritis. Cell. Mol. Gastroenterol. Hepatol. 2020, 10, 561–579. [Google Scholar] [CrossRef]
- Behjati, S.; Frank, M. The Effects of Tamoxifen on Immunity. Curr. Med. Chem. 2009, 16, 3076–3080. [Google Scholar] [CrossRef] [Green Version]
- Wang, X.; Lin, Y. Tumor necrosis factor and cancer, buddies or foes? Acta Pharmacol. Sin. 2008, 29, 1275–1288. [Google Scholar] [CrossRef] [Green Version]
- Jorgovanovic, D.; Song, M.; Wang, L.; Zhang, Y. Roles of IFN-γ in tumor progression and regression: A review. Biomark. Res. 2020, 8, 49. [Google Scholar] [CrossRef]
- Fenton, S.; Saleiro, D.; Platanias, L. Type I and II Interferons in the Anti-Tumor Immune Response. Cancers 2021, 13, 1037. [Google Scholar] [CrossRef]
- Burke, J.D.; Young, H.A. IFN-γ: A cytokine at the right time, is in the right place. Semin. Immunol. 2019, 43, 101280. [Google Scholar] [CrossRef]
- Montfort, A.; Colacios, C.; Levade, T.; Andrieu-Abadie, N.; Meyer, N.; Ségui, B. The TNF Paradox in Cancer Progression and Immunotherapy. Front. Immunol. 2019, 10, 1818. [Google Scholar] [CrossRef] [Green Version]
- Bhat, P.; Leggatt, G.; Waterhouse, N.; Frazer, I. Interferon-γ derived from cytotoxic lymphocytes directly enhances their motility and cytotoxicity. Cell Death Dis. 2017, 8, e2836. [Google Scholar] [CrossRef] [Green Version]
- Lee, S.C.; Dacheux, M.A.; Norman, D.D.; Balázs, L.; Torres, R.M.; Augelli-Szafran, C.E.; Tigyi, G.J. Regulation of Tumor Immunity by Lysophosphatidic Acid. Cancers 2020, 12, 1202. [Google Scholar] [CrossRef] [PubMed]
- Oda, S.K.; Strauch, P.; Fujiwara, Y.; Al-Shami, A.; Oravecz, T.; Tigyi, G.; Pelanda, R.; Torres, R.M. Lysophosphatidic Acid Inhibits CD8 T-cell Activation and Control of Tumor Progression. Cancer Immunol. Res. 2013, 1, 245–255. [Google Scholar] [CrossRef] [PubMed] [Green Version]
- Hu, J.; Oda, S.K.; Shotts, K.; Donovan, E.E.; Strauch, P.; Pujanauski, L.M.; Victorino, F.; Al-Shami, A.; Fujiwara, Y.; Tigyi, G.; et al. Lysophosphatidic Acid Receptor 5 Inhibits B Cell Antigen Receptor Signaling and Antibody Response. J. Immunol. 2014, 193, 85–95. [Google Scholar] [CrossRef] [PubMed] [Green Version]
- Zhang, Y.; Chen, Y.-C.M.; Krummel, M.F.; Rosen, S.D. Autotaxin through Lysophosphatidic Acid Stimulates Polarization, Motility, and Transendothelial Migration of Naive T Cells. J. Immunol. 2012, 189, 3914–3924. [Google Scholar] [CrossRef] [PubMed] [Green Version]
- Knowlden, S.A.; Capece, T.; Popovic, M.; Chapman, T.; Rezaee, F.; Kim, M.; Georas, S.N. Regulation of T Cell Motility In Vitro and In Vivo by LPA and LPA2. PLoS ONE 2014, 9, e101655. [Google Scholar] [CrossRef] [Green Version]
- Kanda, H.; Newton, R.; Klein, R.; Morita, Y.; Gunn, M.D.; Rosen, S.D. Autotaxin, an ectoenzyme that produces lysophosphatidic acid, promotes the entry of lymphocytes into secondary lymphoid organs. Nat. Immunol. 2008, 9, 415–423. [Google Scholar] [CrossRef] [Green Version]
- Liu, Z.; Yu, J.; Carson, W.E., 3rd; Bai, X.F. The role of IL-27 in the induction of anti-tumor cytotoxic T lymphocyte response. Am. J. Transl. Res. 2013, 5, 470–480. [Google Scholar]


Publisher’s Note: MDPI stays neutral with regard to jurisdictional claims in published maps and institutional affiliations. |
© 2022 by the authors. Licensee MDPI, Basel, Switzerland. This article is an open access article distributed under the terms and conditions of the Creative Commons Attribution (CC BY) license (https://creativecommons.org/licenses/by/4.0/).
Share and Cite
Dacheux, M.A.; Lee, S.C.; Shin, Y.; Norman, D.D.; Lin, K.-H.; E, S.; Yue, J.; Benyó, Z.; Tigyi, G.J. Prometastatic Effect of ATX Derived from Alveolar Type II Pneumocytes and B16-F10 Melanoma Cells. Cancers 2022, 14, 1586. https://doi.org/10.3390/cancers14061586
Dacheux MA, Lee SC, Shin Y, Norman DD, Lin K-H, E S, Yue J, Benyó Z, Tigyi GJ. Prometastatic Effect of ATX Derived from Alveolar Type II Pneumocytes and B16-F10 Melanoma Cells. Cancers. 2022; 14(6):1586. https://doi.org/10.3390/cancers14061586
Chicago/Turabian StyleDacheux, Mélanie A., Sue Chin Lee, Yoojin Shin, Derek D. Norman, Kuan-Hung Lin, Shuyu E, Junming Yue, Zoltán Benyó, and Gábor J. Tigyi. 2022. "Prometastatic Effect of ATX Derived from Alveolar Type II Pneumocytes and B16-F10 Melanoma Cells" Cancers 14, no. 6: 1586. https://doi.org/10.3390/cancers14061586