Article

Vitamin D Metabolites in Nonmetastatic High-Risk Prostate Cancer Patients with and without Zoledronic Acid Treatment after Prostatectomy

1
Department of Urology, Charité-Universitätsmedizin Berlin, 10115 Berlin, Germany
2
Berlin Institute for Urologic Research, 10115 Berlin, Germany
3
Immundiagnostik AG, 64625 Bensheim, Germany
4
Department of Urology, Sana Medical Center Offenbach, 63069 Offenbach am Main, Germany
*
Authors to whom correspondence should be addressed.
These authors contributed equally to this paper.
Cancers 2022, 14(6), 1560; https://doi.org/10.3390/cancers14061560
Submission received: 22 February 2022 / Revised: 12 March 2022 / Accepted: 15 March 2022 / Published: 18 March 2022
(This article belongs to the Topic Prostate Cancer: Symptoms, Diagnosis & Treatment)

Abstract

:

Simple Summary

Recent research on prostate cancer and vitamin D is controversial. We measured three vitamin D3 metabolites in 32 selected prostate cancer patients after surgery at four time points over four years. Within a large European study, half of the patients were prophylactically treated with zoledronic acid (ZA); the others received a placebo. After the study start, all the patients daily took calcium and vitamin D3. The development of metastasis was not affected by ZA treatment. While two vitamin D metabolites had higher values after the study’s start, with constant follow-up values, the 1,25(OH)2-vitamin D3 concentrations remained unchanged. The latter form was the only metabolite that was higher in the patients with metastasis as compared to those without bone metastasis. This result is surprising. However, it is too premature to discuss possible prognostic value yet. Our results should be confirmed in larger cohorts.

Abstract

There are limited and discrepant data on prostate cancer (PCa) and vitamin D. We investigated changes in three vitamin D3 metabolites in PCa patients after prostatectomy with zoledronic acid (ZA) treatment regarding their metastasis statuses over four years. In 32 patients from the ZEUS trial, 25(OH)D3, 24,25(OH)2D3, and 1,25(OH)2D3 were measured with liquid chromatography coupled with tandem mass spectrometry at four time points. All the patients received daily calcium and vitamin D3. Bone metastases were detected in 7 of the 17 ZA-treated patients and in 5 of the 15 controls (without ZA), without differences between the groups (p = 0.725). While 25(OH)D3 and 24,25(OH)2D3 increased significantly after the study’s start, with following constant values, the 1,25(OH)2D3 concentrations remained unchanged. ZA treatment did not change the levels of the three metabolites. 25(OH)D3 and 24,25(OH)2D3 were not associated with the development of bone metastases. In contrast, 1,25(OH)2D3 was also higher in patients with bone metastasis before the study’s start. Thus, in high-risk PCa patients after prostatectomy, 25(OH)D3, 24,25(OH)2D3, and 1,25(OH)2D3 were not affected by supportive ZA treatment or by the development of metastasis over four years, with the exception of 1,25(OH)2D3, which was constantly higher in metastatic patients. There might be potential prognostic value if the results can be confirmed.

Graphical Abstract

1. Introduction

Several international conferences in recent years have discussed, in detail, the current evidence and the ongoing controversies in vitamin D research [1,2,3]. Vitamin D3 is mainly formed in the skin from 7-dehydrocholesterol upon ultraviolet B exposure. It is subsequently hydroxylated by two cytochrome-P450-mediated hydroxylation processes. In the liver, it is converted to 25-hydroxyvitamin D3 (25(OH)D3), released in the bloodstream and subsequently hydroxylated in the kidney, but also in other organs, including the prostate, to 1,25-dihydroxyvitamin D3 (1,25(OH)2D3). The controversies concern both 25(OH)D3 as the primary circulating vitamin D form reflecting the vitamin D status and 1,25(OH)2D3, the actual active metabolite that reacts with the vitamin D receptor. The controversial issues relate particularly to the extraskeletal actions of vitamin D and involve numerous diseases, such as various malignancies and cardiovascular, dermatologic, and immunological disorders [4]. Cell research and animal studies provide strong evidence of the potential molecular and cellular mechanisms underlying the actions of vitamin D and its metabolites [5,6,7]. However, corresponding observational and randomized controlled studies, probably due to their weak study designs, have frequently remained inconclusive and showed conflicting results concerning the hypothesized beneficial effect of vitamin D [3,8]. In this respect, prostate cancer (PCa) is no exception.
The complex biochemical and molecular relationship between PCa and vitamin D has been reviewed in numerous reports [9,10,11]. The limited and also partly discrepant data regarding the action of vitamin D in the treatment of PCa are exemplarily reflected by the results reported in some pertinent following studies. For example, a meta-analysis from 21 studies published until 2013 revealed a significant 17% higher risk of PCa in men with higher serum levels of 25(OH)D3 [12]. In contrast, other studies reported that higher 25(OH)D3 levels were associated with a 57% reduction in the risk of lethal PCa or improved prognosis [13,14,15]. A recently performed dose–response meta-analysis of 25(OH)D3, which was based on seven relevant studies, supported the idea that a higher serum 25(OH)D3 concentration was an important protective factor in PCa progression and was associated with reduced PCa mortality [16]. However, other studies showed that 25(OH)D3 concentrations and vitamin D supplementation were not significantly associated with an increased PCa incidence and mortality rate [17,18,19]. An inverse association between the post-treatment plasma 1,25(OH)2D3 levels and all-cause and PCa-specific mortality in men with aggressive PCa suggested a possible beneficial effect of vitamin D supplementation in these men [20]. A recent study in 2021 found that men with PCa and vitamin D deficiency had higher overall and PCa-specific mortality, but there was no association between the risk of PCa (in biopsied men) and different vitamin D categories [21]. Our own data for 480 biopsied men also showed no correlation between 25(OH)D3 and the pathological Gleason grade or differences between 222 men with and 258 without PCa [22].
It can be assumed that these contradictory results are mainly because basic principles for studies on the effect of vitamin D concerning health status have frequently been disregarded. Amrein et al. [8] defined four preconditions for an optimal study design in their seminal article “Vitamin D deficiency 2.0” as follows: (a) the measurement of the vitamin D status at baseline, (b) the consideration of vitamin D deficiency as a study inclusion criterion, (c) the application of an intervention capable of altering the vitamin D status, and (d) repeat measurements to verify the vitamin D status.
Considering these indispensable aspects for a valid study, it was therefore of interest to find out the possible changes in vitamin D status in patients after prostatectomy under the influence of the bisphosphonate zoledronic acid (ZA). ZA was shown to prevent bone loss due to antiandrogen-deprivation therapy, reduce morbidity and pain, and improve survival in castration-resistant PCa [23,24]. ZA induces the direct inhibition of PCa cells in vitro, inhibits tumor-mediated angiogenesis, enhances bone-mineral density, and suppresses bone markers [25,26,27]. Recent guidelines regarding PCa management recommend ZA and Denosumab as bone-protective agents in the supportive care of patients with castration-resistant PCa and skeletal metastases to prevent or reduce skeletal-related events [28,29,30,31]. However, data on the vitamin D status in follow-up measurements from patients receiving ZA are rare. They mostly refer to patients suffering from osteoporosis, while detailed data from PCa patients are lacking [32,33].
The basis for the study on vitamin D metabolites presented here was the availability of serum samples from a randomized, open-label study to evaluate the efficacy of ZA treatment for bone-metastasis prevention in high-risk PCa patients [34]. Thus, we were able to initiate this study in a small subset of 32 patients to largely meet the above-described requirements for a valid vitamin D study measuring the three metabolites 25(OH)D3, 24,25(OH)2D3, and 1,25(OH)2D3. With this study, we intended to obtain better insights into the following open issues: (a) the changes in vitamin D metabolites in PCa patients after prostatectomy over four years, (b) possible ZA-treatment effects on the profile of vitamin D metabolites, and (c) abnormalities in the metabolite profile with regard to metastasis during the study.

2. Materials and Methods

2.1. Patients and Samples

The study was based on vitamin D measurements performed on blood samples available from PCa patients after radical prostatectomy in the ZEUS trial (https://www.isrctn.com/ISRCTN66626762 accessed on 6 February 2022; https://doi.org/10.1186/ISRCTN66626762). This trial was a randomized, open-label study to evaluate the efficacy of ZA treatment for bone-metastasis prevention in high-risk PCa patients [34]. Ethical approval was obtained from local medical ethics committees for all the participating hospitals of this multicenter study, and the patients signed an informed consent form. The details and results of this trial were previously reported [34]. Briefly, the here-investigated subgroup consisted of nonmetastatic PCa patients with at least one of three high-risk factors: a Gleason score of 8–10, node-positive disease, or prostate-specific antigen (PSA) at diagnosis ≥20 ng/mL. No other prior PCa treatment (antiandrogen monotherapy, chemotherapy, and treatment with bisphosphonates) was allowed. All the patients were included in this study within 6 months after radical prostatectomy. The patients either received an intravenous infusion of 4 mg every three months or were without ZA treatment and served as controls. All the patients were prescribed concomitant therapy with a daily 500 mg dose of calcium and 400–500 IU of vitamin D3. Blood samples were collected under standard conditions in BD Vacutainer tubes before the study began and at every three-month visit. Serum samples were prepared and frozen at −80 °C until analysis. We analyzed samples from 32 patients at four time points, as further explained in the Results.

2.2. Analytics for Vitamin D Metabolites

The 25(OH)D3 and 24,25(OH)2D3 concentrations were determined with the KM1320 assay, and the concentration of 1,25(OH)2D3 was determined with a development version of the KM1400 assay, both from Immundiagnostik AG, Bensheim, Germany. The vitamin D metabolites were purified by immunoaffinity enrichment, with 1,25(OH)2D3 additionally derivatized for improved detection, and subsequently analyzed by liquid chromatography–tandem mass spectrometry on a QTrap 5500 system coupled to an Exion LC (AB Sciex, Darmstadt, Germany). All the samples were analyzed in two replicates using individual 3-point linear calibration curves. All the calibrants and controls were prepared from certified reference material (Cerilliant Corp., Round Rock, TX, USA) and validated with NIST®SRM®972a samples, if available. For 1,25(OH)2D3, reference samples are not available, but the calibrants were tested with samples from the Vitamin D External Quality Assessment Scheme (DEQAS). The reproducibility of the measurements was calculated as the within-run precision from the duplicate measurements using the root-mean-square method [35]. The coefficients of variation (and their 95% confidence intervals) were 3.28% (2.92 to 3.76%) for 25(OH)D3, 4.73% (3.30 to 5.82%) for 24,25(OH)2D3, and 8.96% (6.90 to 10.6%) for 1,25(OH)2D3.

2.3. Statistical Analysis

MedCalc 20.027 (MedCalc Software, Ostend, Belgium) and GraphPad Prism 9.3.1 (GraphPad Software, La Jolla, CA, USA) were used as statistical programs as previously described [36]. One-way and two-way analyses of variance (ANOVAs) were performed. Repeated-measures analyses of variances (ANOVAs) were used for a single-factor study without a grouping variable or for a two-factor study with a specified grouping variable. Holm and Sidak’s multiple-comparison test was applied to account for multiple testing. Pearson correlation analysis was used to determine the strength of the associations between vitamin D3 metabolites. Two-sided p-values < 0.05 were considered statistically significant. The values in the figures are presented as the means ± 95% confidence intervals (95% CIs).

3. Results

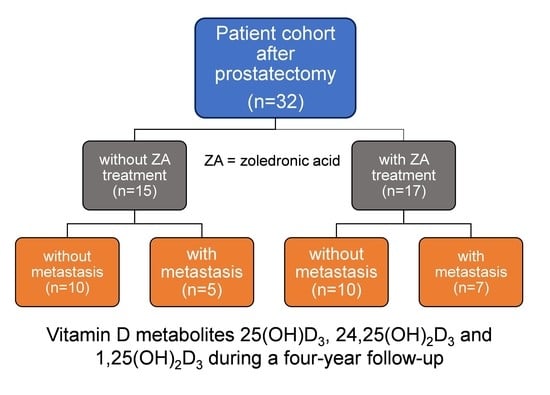
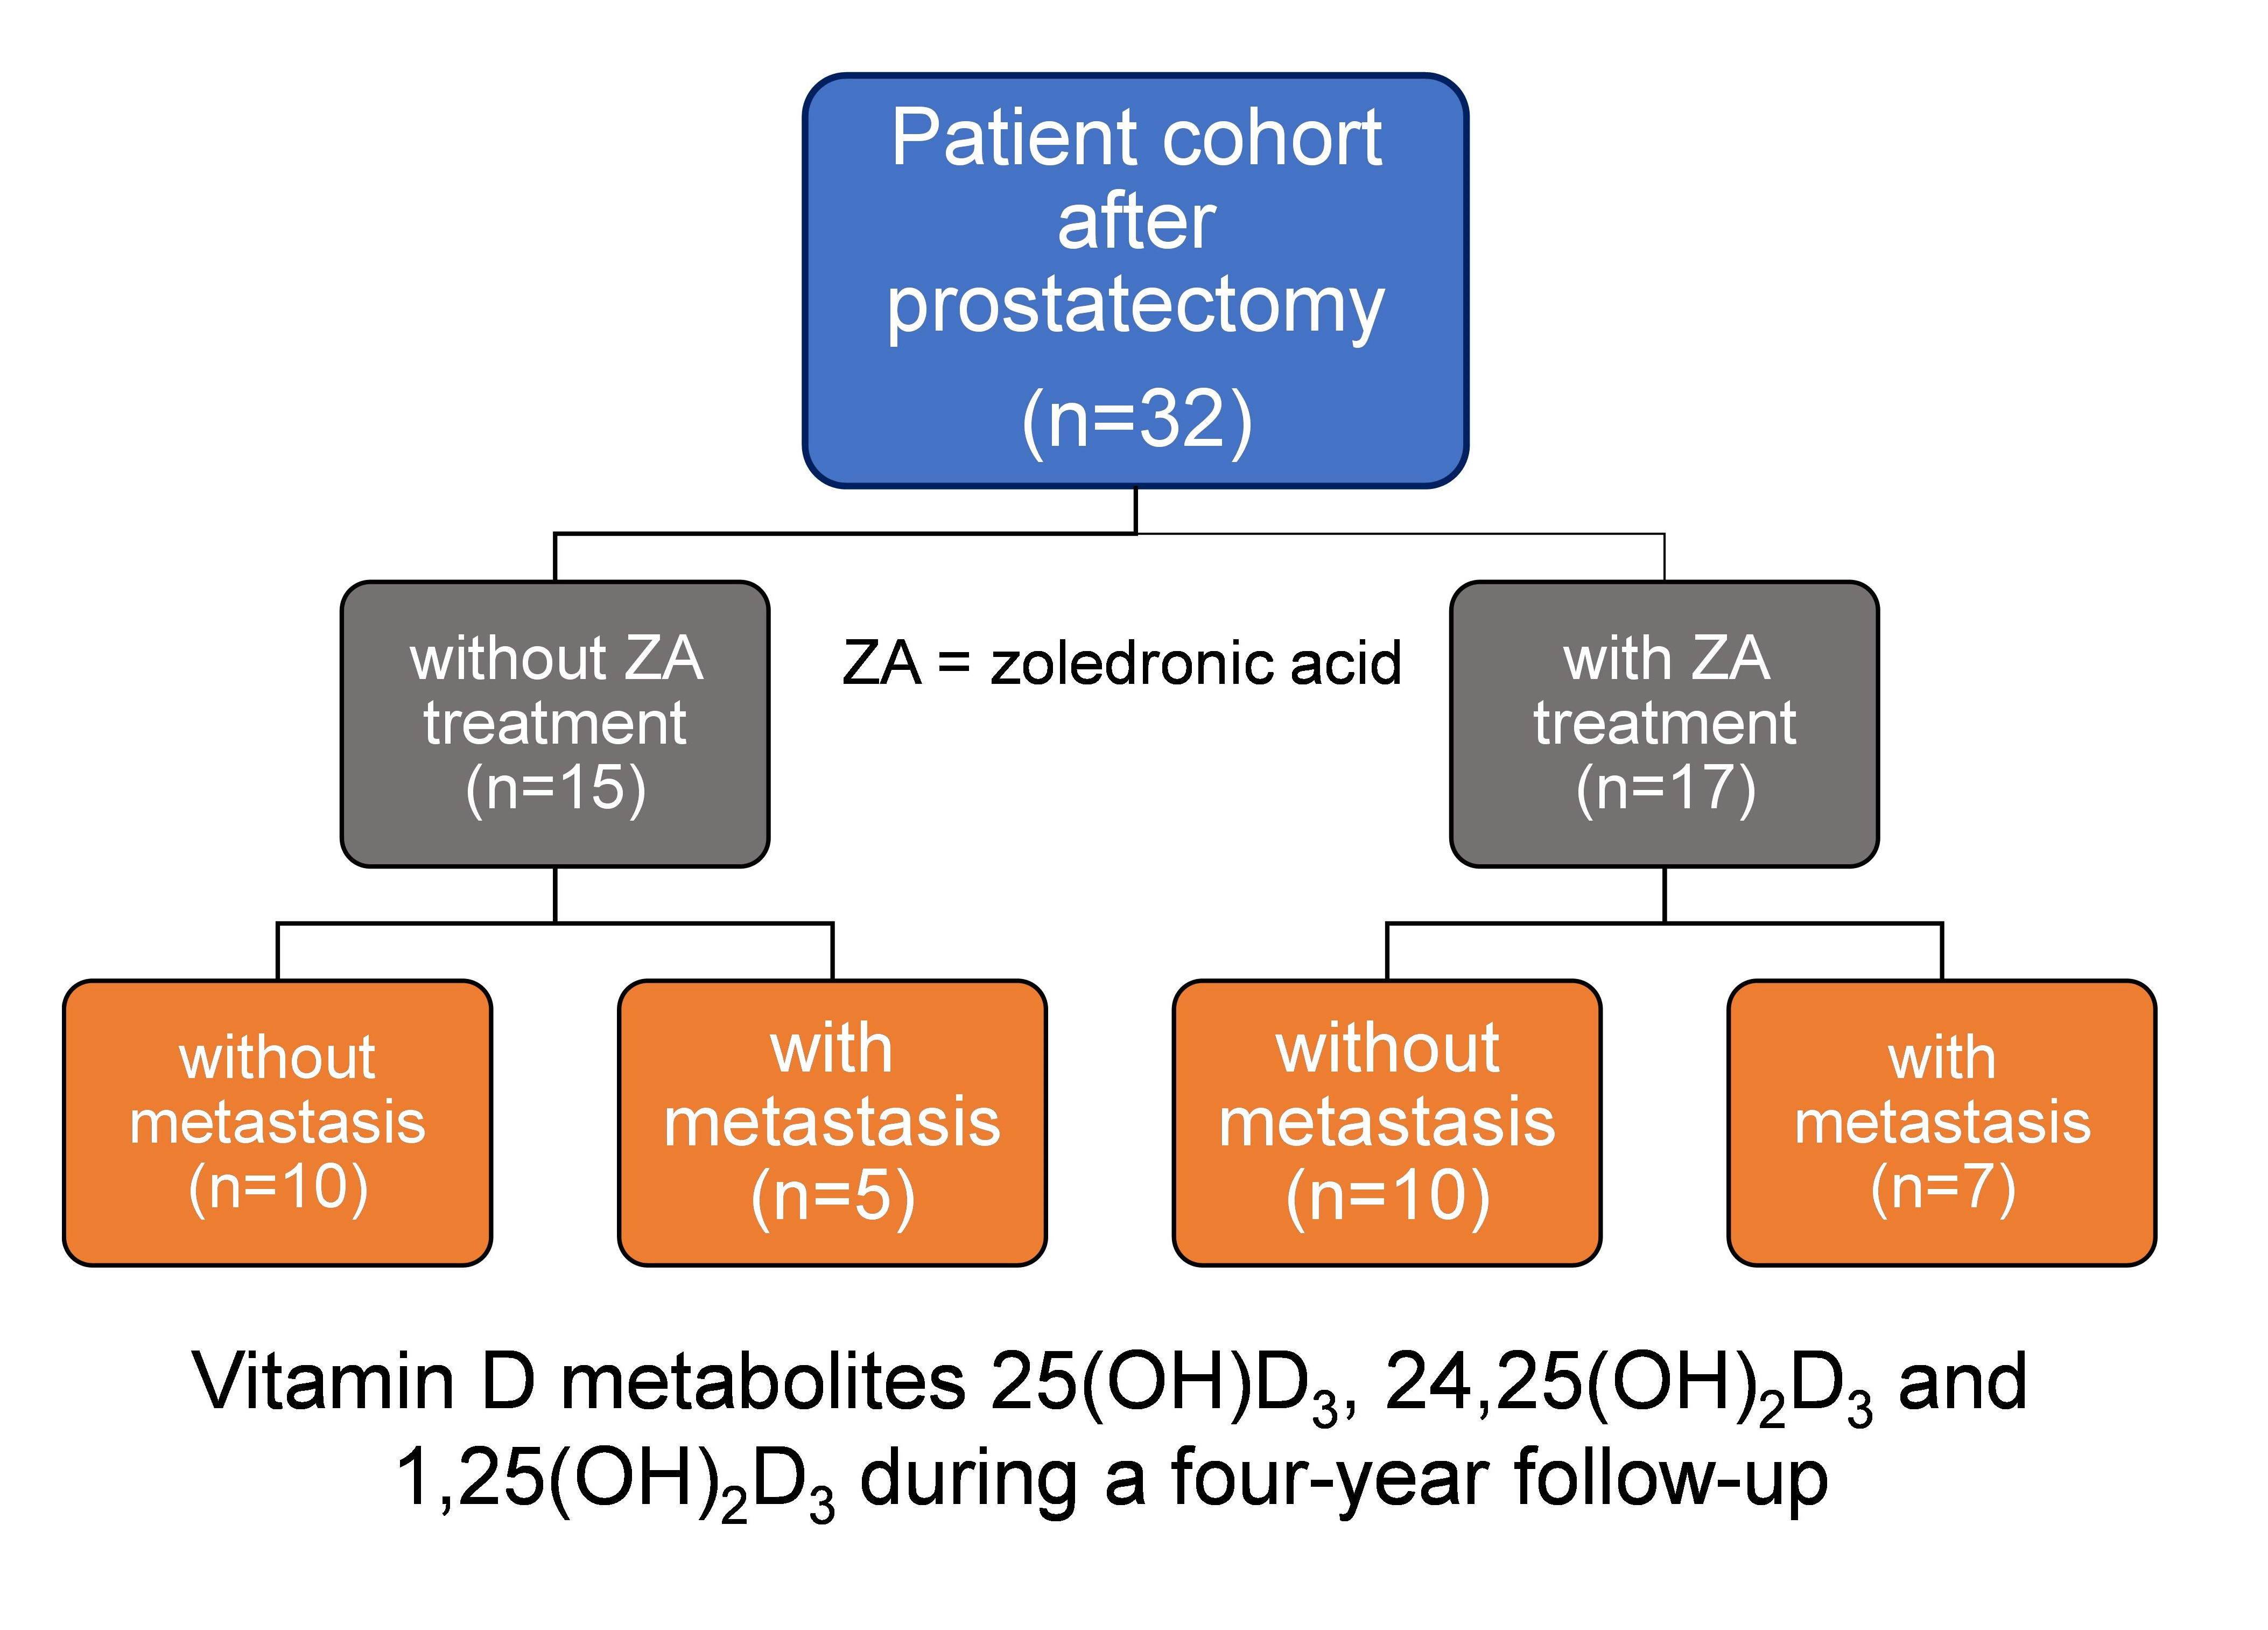
3.1. Patient Characteristics and Study Design

The study included a total of 32 patients after radical prostatectomy characterized by at least one of three high-risk factors: a Gleason score of 8–10, node-positive disease, and PSA of ≥20 ng/mL at diagnosis. The individual data of all the patients are summarized in Table S1. Nineteen patients exhibited one high-risk factor (2 × positive nodes, 5 × PSA, and 12 × Gleason score), twelve patients had two factors (2 × PSA plus Gleason, 3 × PSA plus positive nodes, and 7 × Gleason plus positive nodes), and one patient had all three factors. The study started for 16 patients each in winter/spring and summer/autumn (Figure 1). In every patient, repeated measurements of vitamin D metabolites were performed in serum samples taken at four time points: before the study entry as baseline, after 3 and 9 months, and between 27 and 47 months when the study ended or bone metastasis was diagnosed. ZA was administered to 17 patients; 15 patients were controls and did not receive ZA treatment. Bone metastases were detected in 7 of the 17 ZA-treated patients during the study and in 5 of the 15 controls, indicating no significant differences between the two patient groups (Fisher’s exact test, p = 0.725). This result corresponded with that of the ZEUS trial [34].
The three vitamin metabolites 25(OH)D3, 24,25(OH)2D3, and 1,25(OH)2D3 were analyzed in detail. 25(OH)D2 and 1,25(OH)2D2 were also measured, but in all 128 samples, the 25(OH)D2 concentrations were found to be under the lower limit of quantitation of 3.6 nmol/L, and 1,25(OH)2D2 was not detectable. Thus, only the results for the three vitamin D3 metabolites are reported here. The effects of the two abovementioned potential influencing factors “ZA treatment (yes/no)” and “bone metastasis during the study (yes/no)” as well as the seasonal dependency of the vitamin D3 status were evaluated.

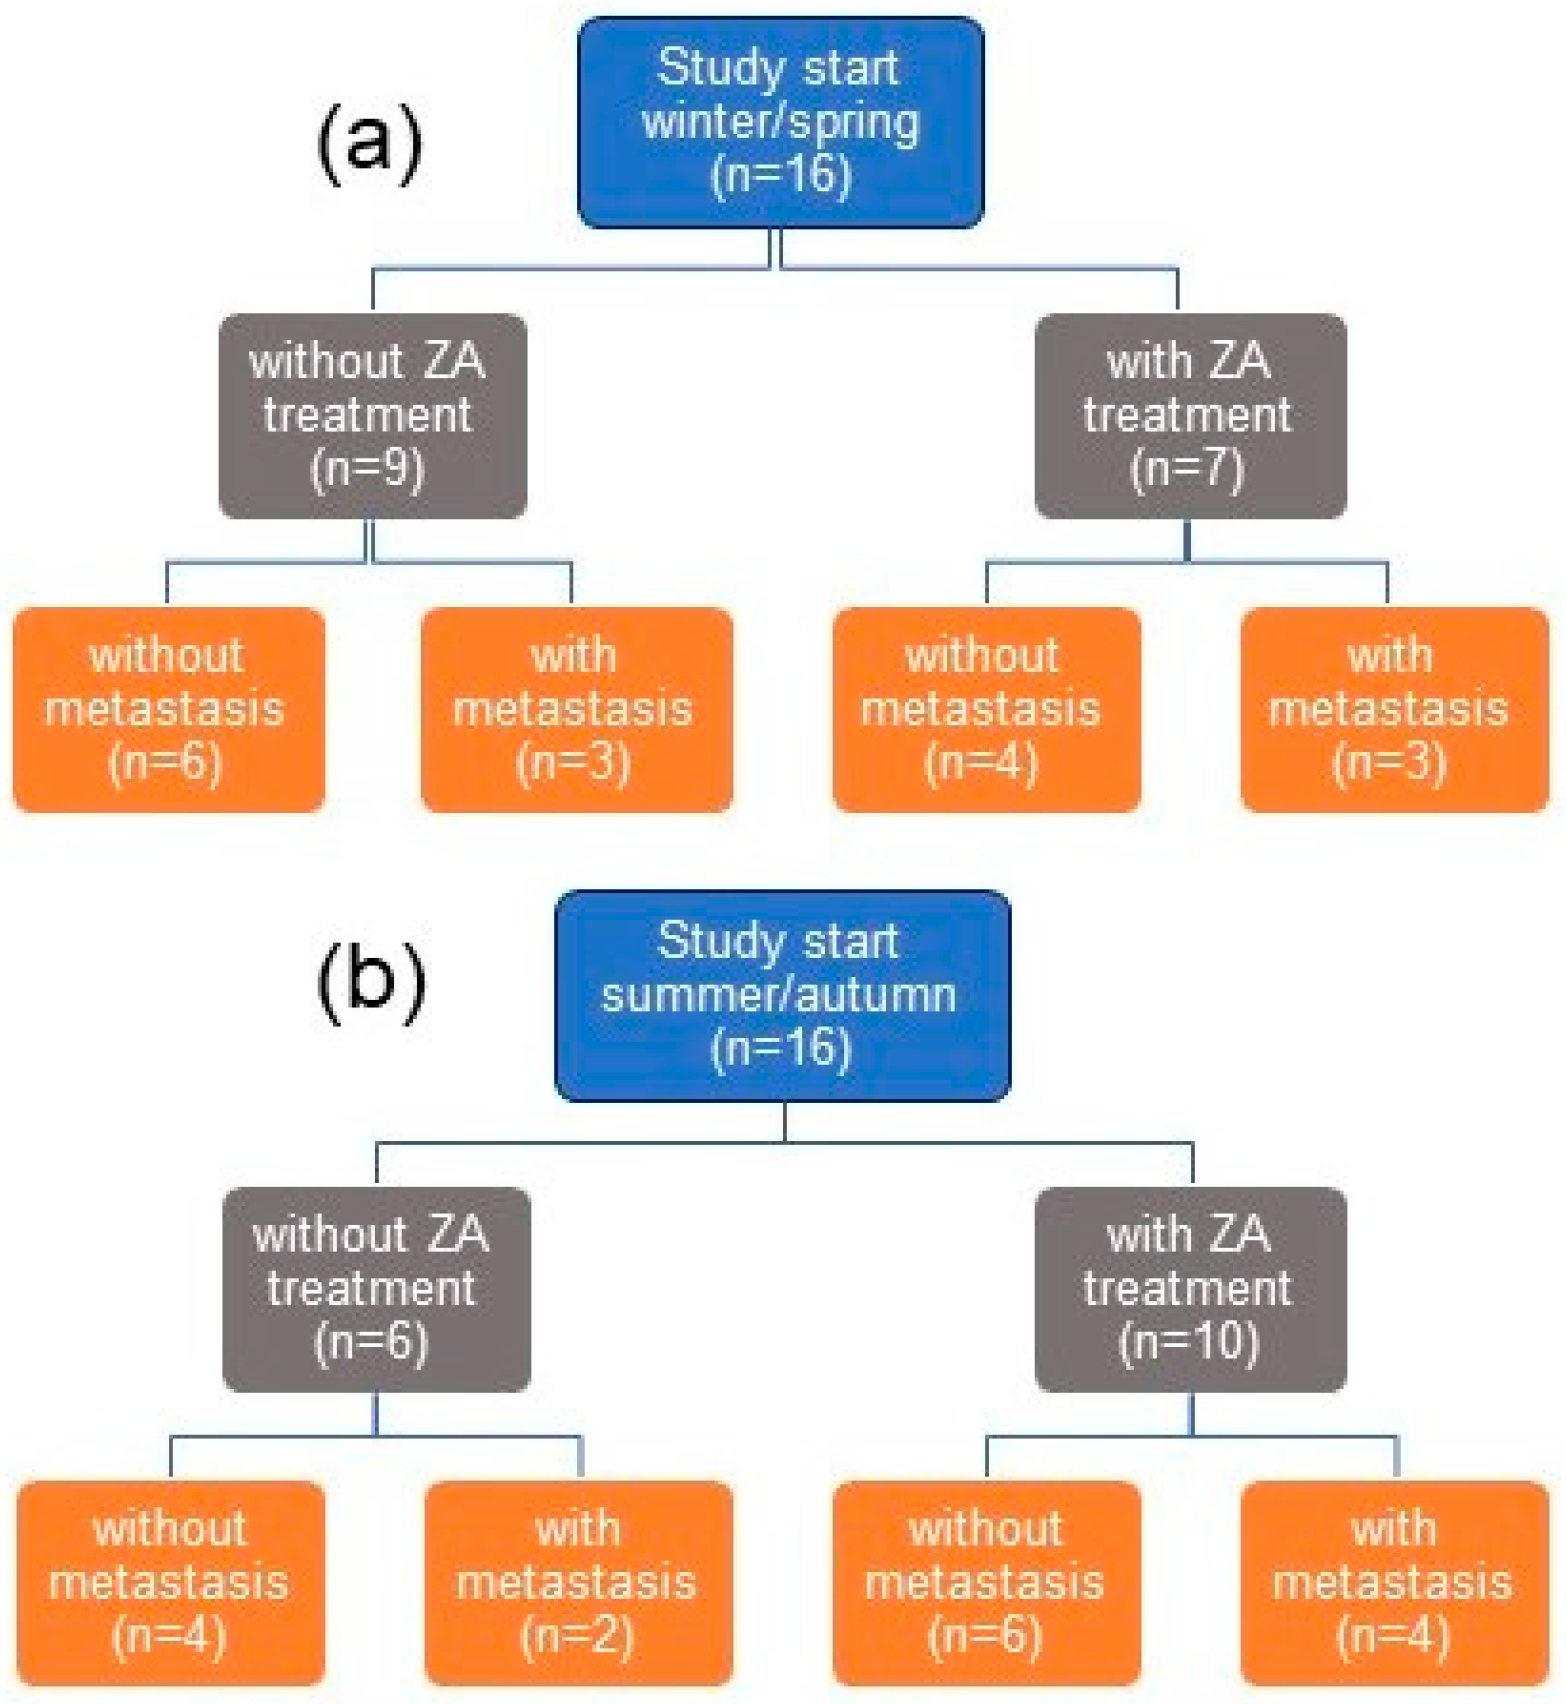
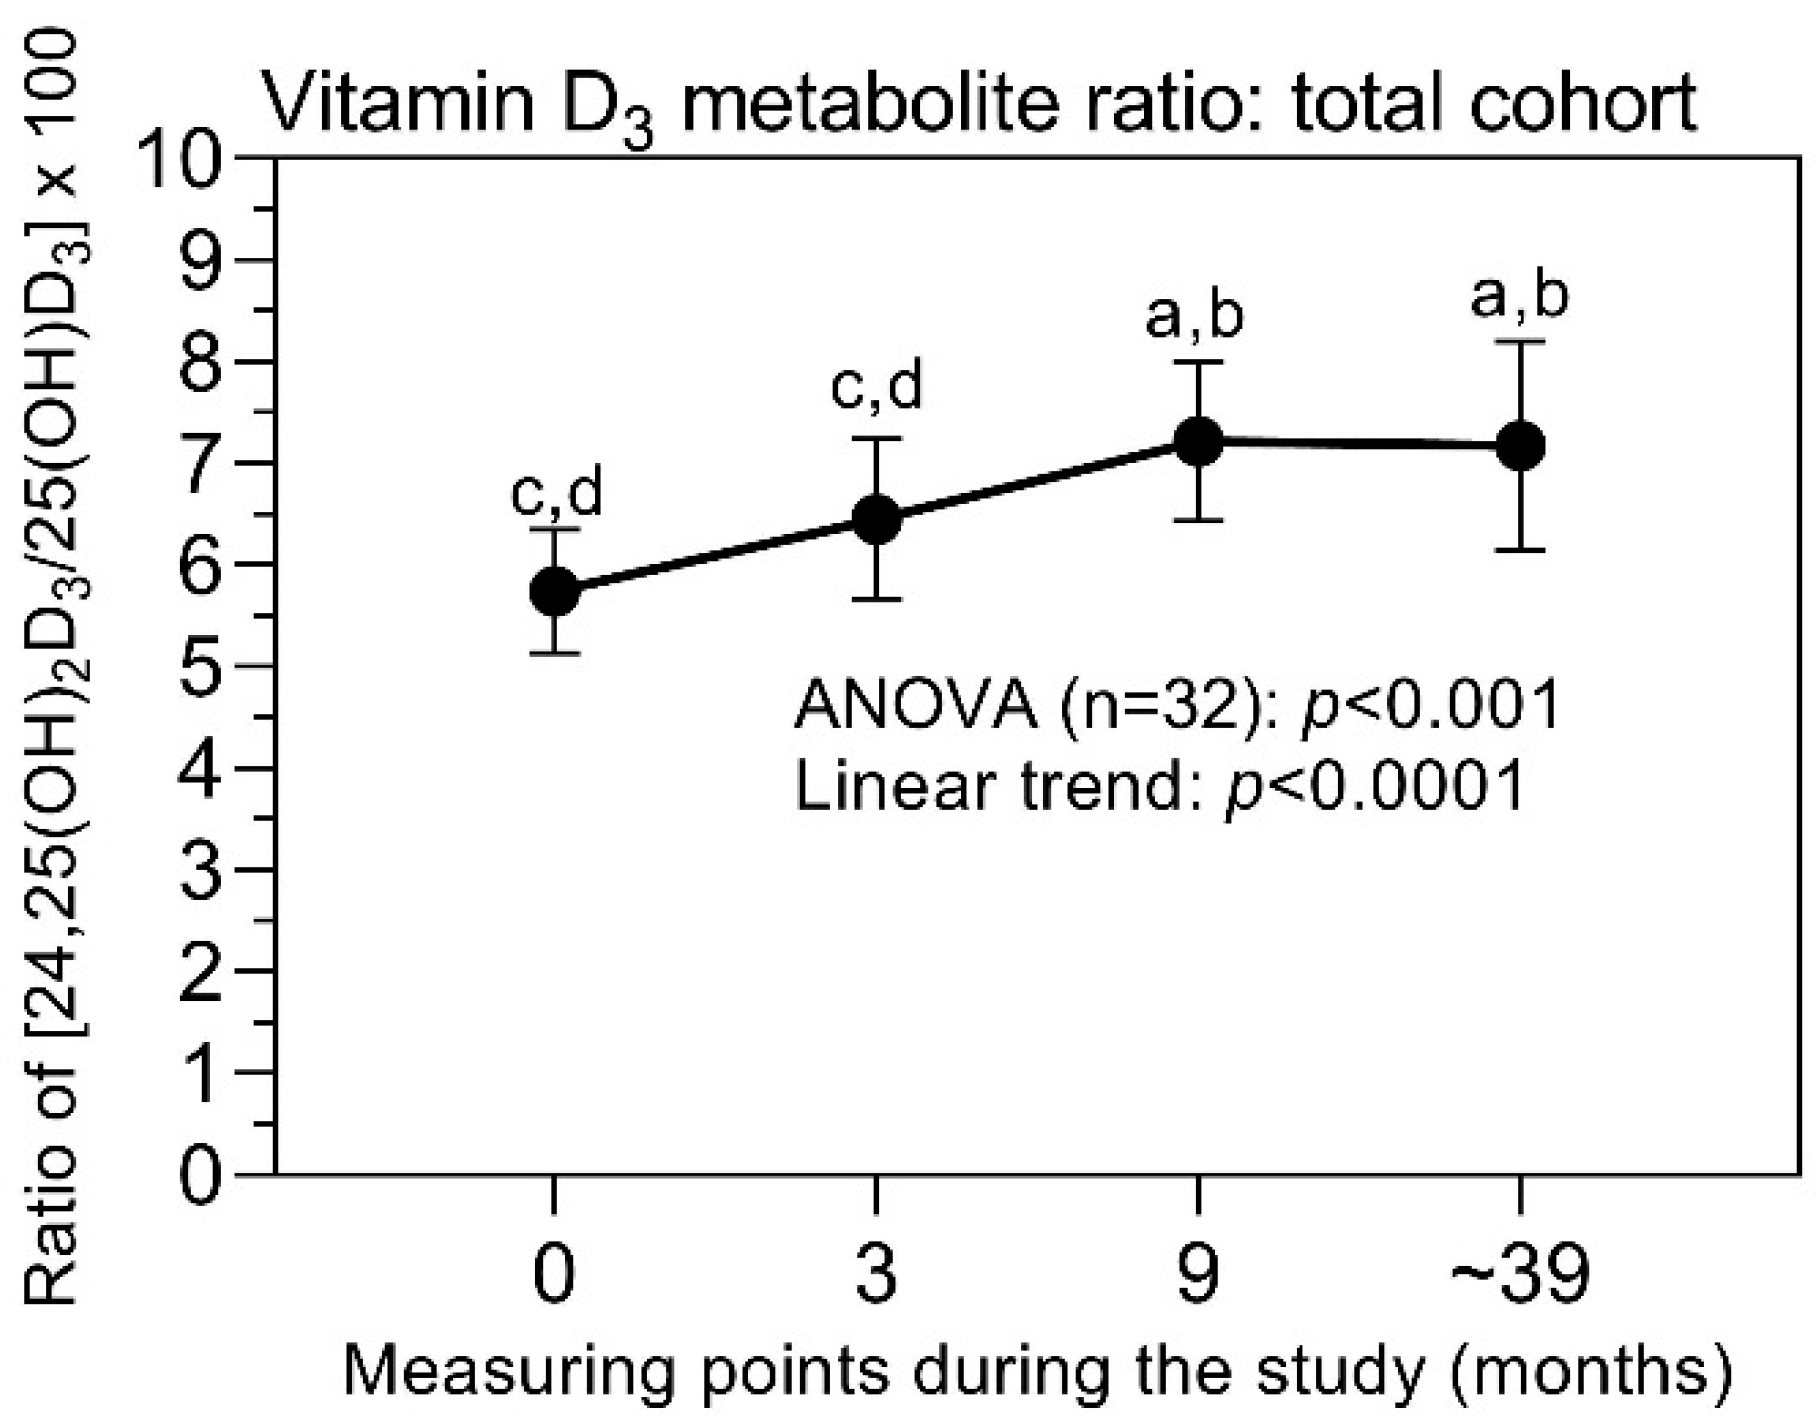
3.2. Vitamin D3 Metabolites in the Total Study Cohort and Dependency on the Season of the Start of the Study

Figure 2a,c,e provide an overview of the concentration changes for the three metabolites in the total study cohort of the 32 patients during the study at four measuring points. Statistically significantly increased levels of 25(OH)D3 and 24,25(OH)2D3 were observed within three months after the study’s start, with approximately constant values at the two subsequent measuring points. In contrast, the 1,25(OH)2D3 concentrations remained statistically unchanged over the entire study period.
As the seasonal dependency of the vitamin D3 status, with lower concentrations in winter and spring in comparison to summer and autumn, is also well known for PCa patients [22,37,38], we subdivided the patients into two groups with respect to the season of their study entry (Figure 2b,d,f). Lower levels of 25(OH)D3 and 24,25(OH)2D3 were detected in the patients who started their study in winter/spring in comparison to the patients with a study start in summer/autumn. While the patients with a study start in winter/spring showed distinctly increased concentrations of the two metabolites after three months of treatment, only moderately increased levels were found in the patients with summer/autumn study entry (Figure 2b,d). For 1,25(OH)2D3, a subdivision of the patients did not have any effect on the influence of its concentration behavior over the entire study period (Figure 2f).
When evaluating the data, it must be taken into account that all the patients received vitamin D3 supplementation. Thus, the data presented here demonstrate that, even after the first treatment interval of 3 months, an equalization of the 25(OH)D3 and 24,25(OH)2D3 levels for the entire patient cohort over the study period was achieved, regardless of the season of the start of the study. Out of the 32 patients before the study entry, 17 (53%) patients had 25(OH)D3 concentrations below 50 nmol/L, which is the recommended threshold indicator of vitamin D deficiency in humans [3,8]. Fourteen of the sixteen patients who began the study in winter/spring had values below this threshold. After the first treatment interval of 3 months, only three (9.4%) patients of the total study group remained with values below that limit (Fisher’s exact test, p = 0.0003).

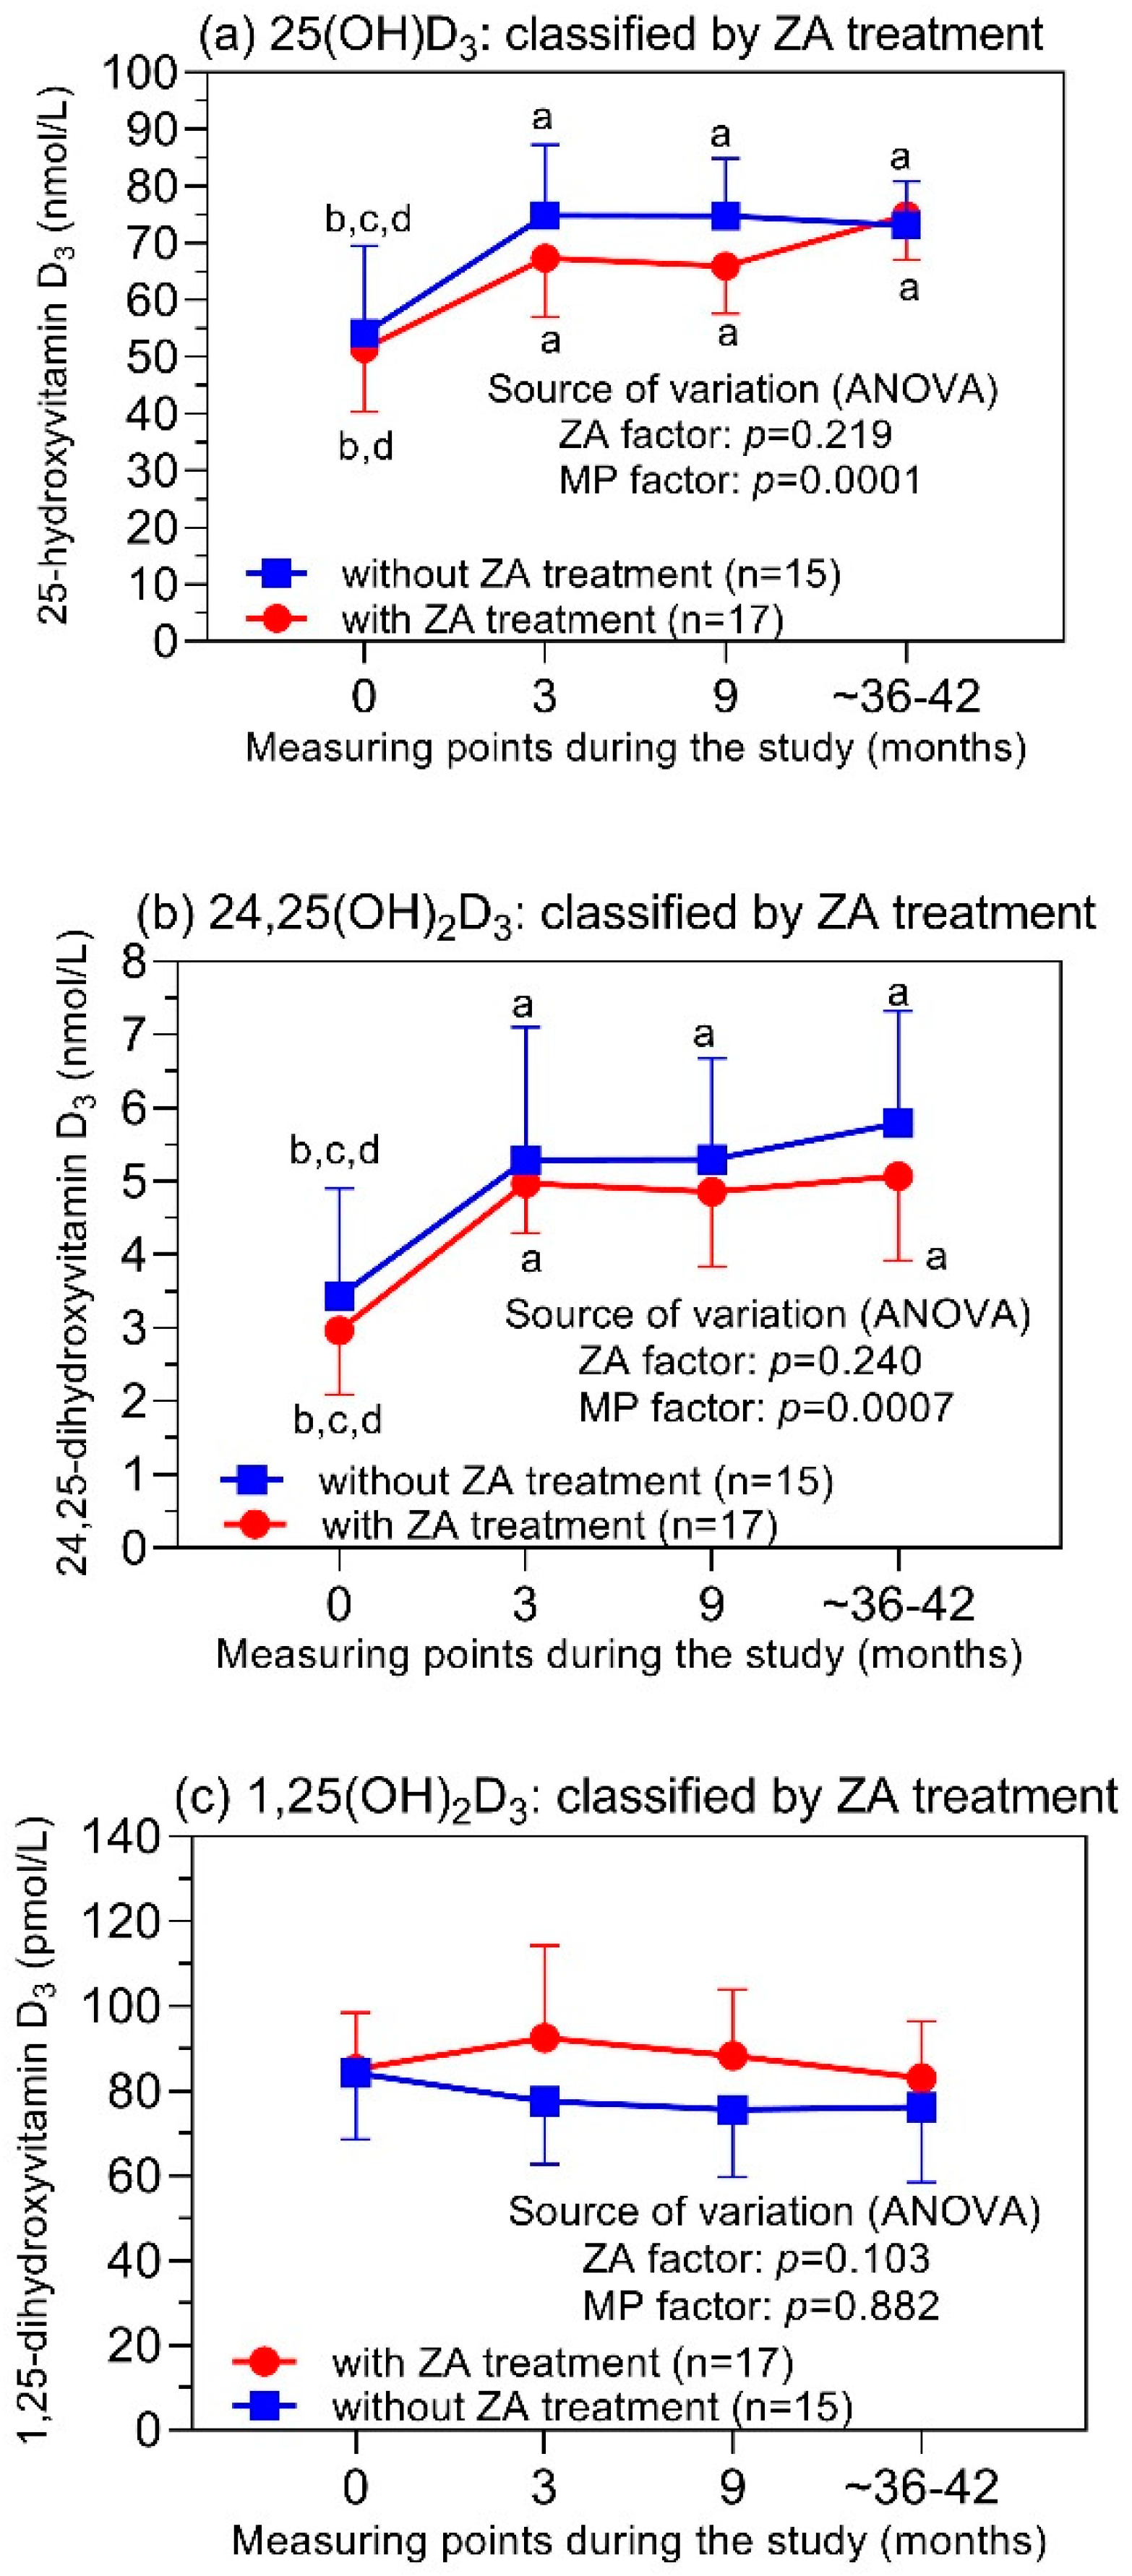
3.3. Vitamin D3 Metabolites in Relation to the ZA Treatment

The repeated measurements in ZA-treated and ZA-untreated patients resulted in different curves for the respective individual vitamin D3 metabolite during the study (Figure 3). The 25(OH)D3 and 24,25(OH)2D3 levels were significantly lower at study entry in comparison with the levels at the three subsequent study time points, but not significantly different between ZA-treated and ZA-untreated patients at all the time points (Figure 3a,b). Thus, repeated-measures ANOVA for these two-factor studies showed ZA treatment to be a non-significant source of variation (p-values of 0.219 and 0.240; Figure 3a,b) and the time interval to be a significant source of variation (p-values of 0.0001 and 0.0007; Figure 3a,b). In contrast, the 1,25(OH)2D3 levels did not statistically differ between the ZA-treated and ZA-untreated patients at any of the measuring points (Figure 3c). These data prove that ZA treatment did not alter the levels of the three metabolites during the study. It can be concluded that the differences in the levels of 25(OH)D3 and 24,25(OH)2D3 observed between the study’s start and the subsequent measuring points were due to the concomitant supplementation of vitamin D3 to all the study patients.

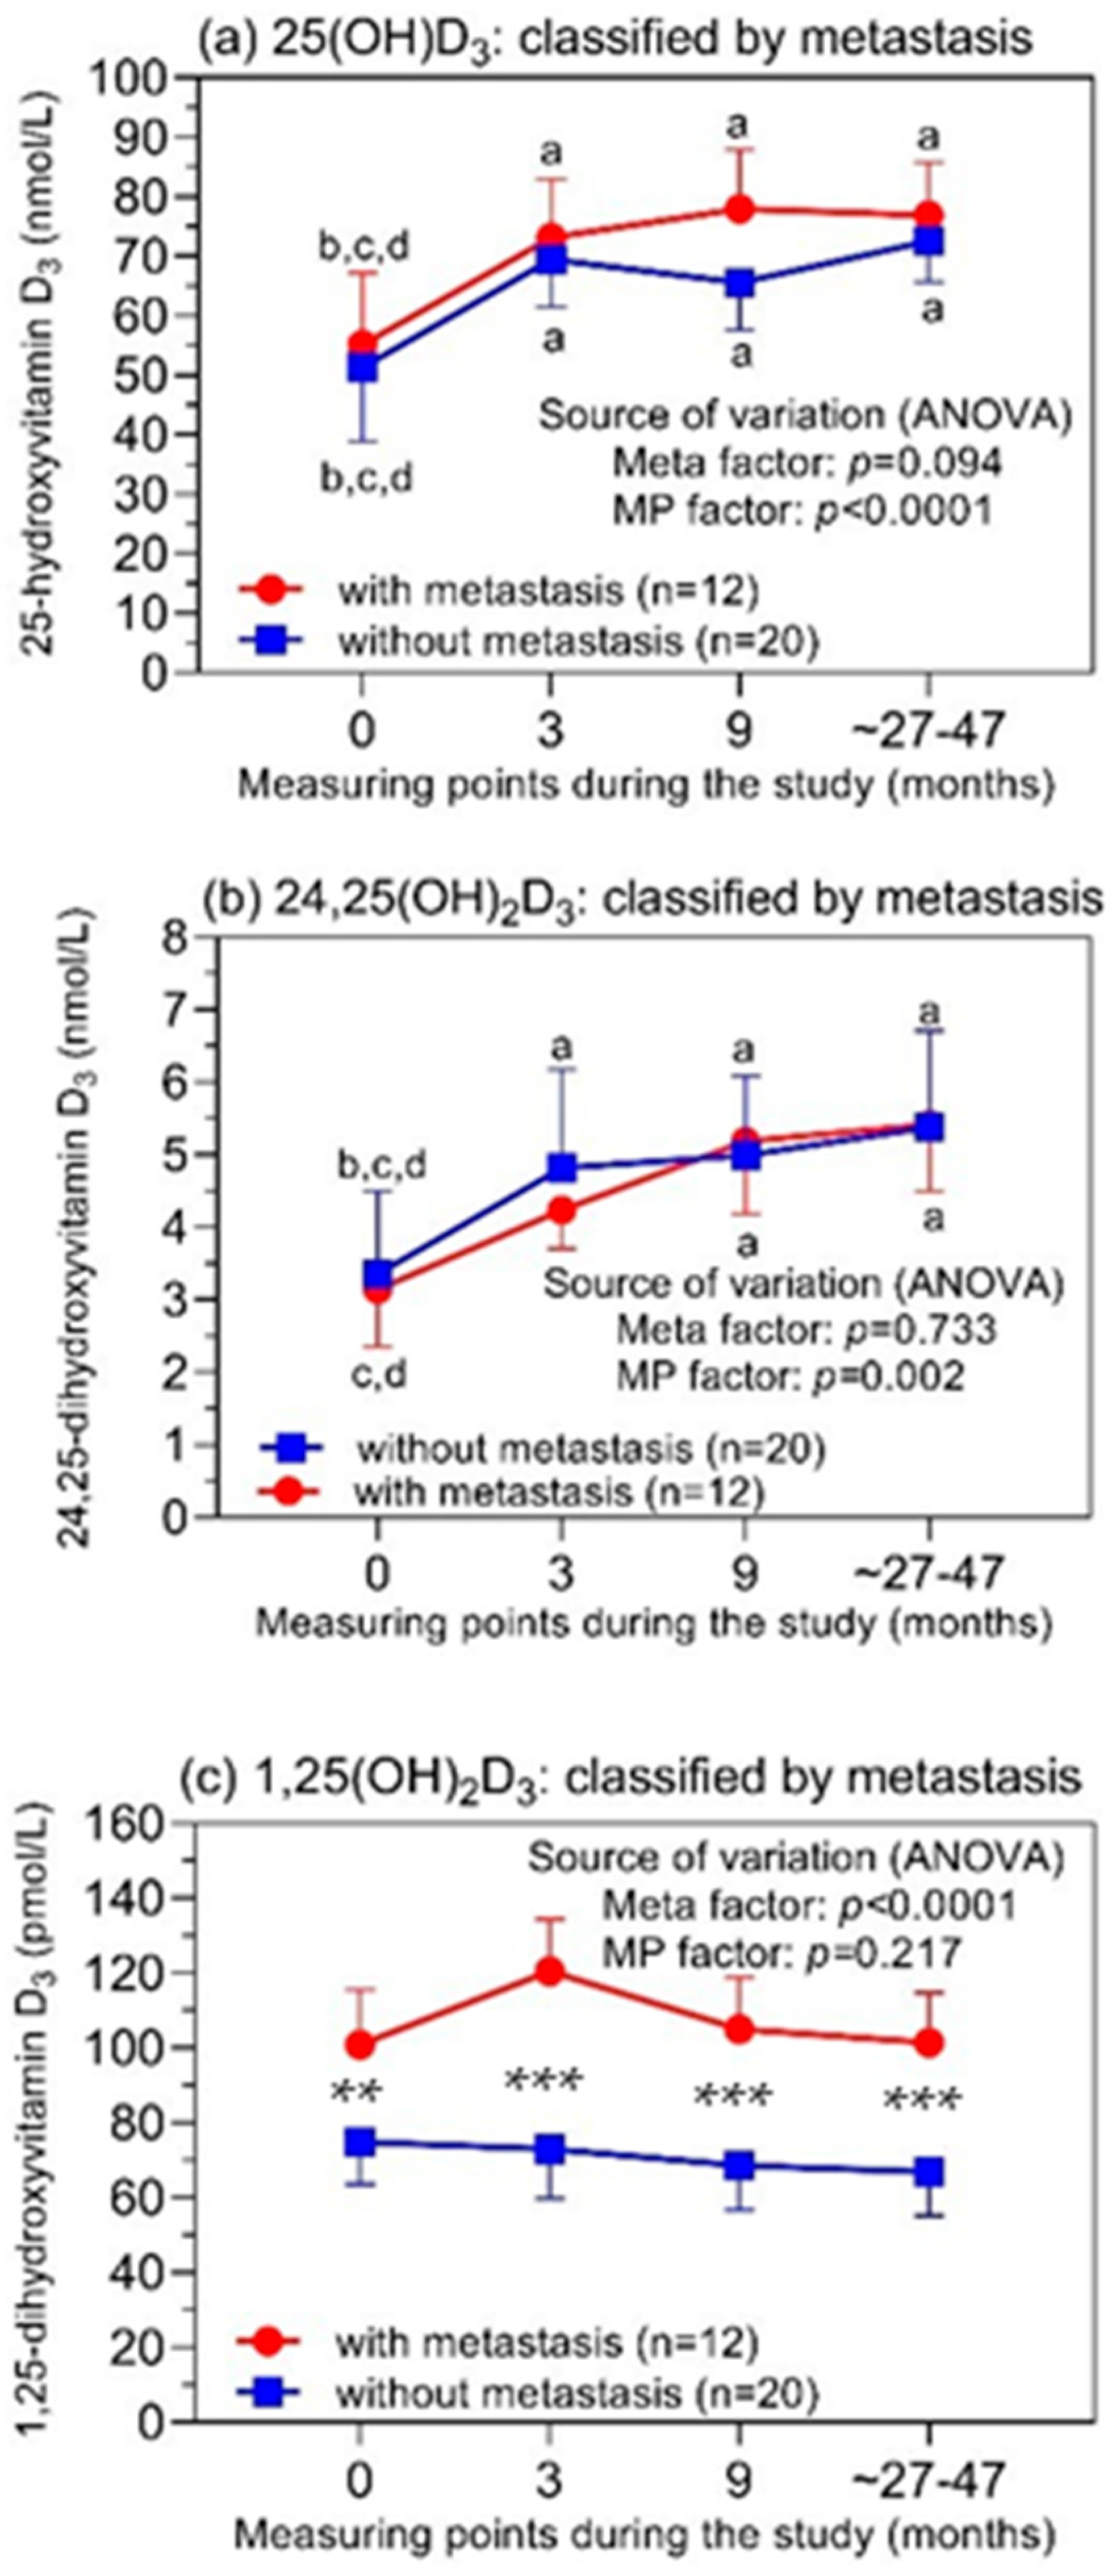
3.4. Vitamin D3 Metabolites in Relation to the Development of Bone Metastasis during the Study

The analysis of the concentrations of 25(OH)D3 and 24,25(OH)2D3 regarding metastasis showed that they corresponded with those observed under the aspect of the ZA treatment (Figure 4). Neither metabolite was associated with the development of bone metastases in patients during the study, as the factor “metastasis” was not a significant variable of the source of variation (Figure 4a,b). The time-dependent changes can also be attributed to the concomitant vitamin D3 supplementation. This is in contrast to the very striking 1,25(OH)2D3 profile of the patients who did or did not suffer from bone metastasis during the study (Figure 4c). The patients who developed bone metastasis already had higher 1,25(OH)2D3 values before the study’s start compared to those without bone metastasis. This pattern remained throughout the study period. This observation suggests that 1,25(OH)2D3 could be a possible factor associated with the metastatic process in PCa. Since our study was by no means designed to make prognostic statements, we have only compiled these indicative data in the supplement for interested readers (Figure S1).

3.5. Correlations between Vitamin D3 Metabolites

Strong correlations between the 25(OH)D3 and 24,25(OH)2D3 levels were observed at the four measuring points, with correlation coefficients between 0.696 and 0.883 (mean ± SD; 0.776 ± 0.087) and p-values of <0.0001 in all cases. In this respect, the so-called vitamin D metabolite ratio (VMR), calculated as the ratio of 24,25(OH)2D3/25(OH)D3 × 100, is of interest, as this ratio was suggested as an improved indicator of the vitamin D3 status [39]. The close correlation between the two metabolites explains that a similar pattern was observed as for the two individual metabolites (Figure 5).
In contrast to the strong association between 25(OH)D3 and 24;25(OH)2D3, the coefficients of the correlation between 25(OH)D3 and 1,25(OH)2D3 as well as between 24,25(OH)2D3 and 1,25(OH)2D3 at the four measuring points were all non-significant, with values between -0.122 and 0.145 (−0.004 ± 0.148; p-values of 0.266 to 0.915) and −0.175 and 0.051 (−0.044 ± 0.174; p-values of 0.337 to 0.916), respectively.

4. Discussion

Our study showed that the main vitamin D metabolites 25(OH)D3, 24,25(OH)2D3, and 1,25(OH)2D3 were not affected in high-risk PCa patients who received ZA as supportive-care treatment over about 4 years. The ZA-treated patients and controls without ZA, who had 25(OH)D3 concentrations below the deficiency threshold of 50 nmol/L [1,40] due to a study start in winter/spring, achieved stable levels above this limit after 3 months with a daily concomitant supplementation of 400–500 IU of vitamin D cholecalciferol. These data additionally indicate good patient compliance with the supplement administration in contrast to other reports [41]. Simultaneously, stable 24,25(OH)2D3 levels were also observed afterwards during the three subsequent time intervals. The occurrence of bone metastases also did not result in altered profiles for these two metabolites. The metabolite 1,25(OH)2D3 also did not show profile changes during the entire observation time, but it was completely unaffected by the cholecalciferol supplementation, in contrast to 25(OH)D3 and 24,25(OH)2D3. In addition, it was remarkable that patients with metastasis already had higher concentrations of 1,25(OH)2D3 in comparison to those patients without metastasis at the study’s beginning and during the entire study.
Thus, the results partly differed for 25(OH)D3 and 24,25(OH)2D3, on the one hand, and for 1,25(OH)2D3, on the other hand. Therefore, it is advisable to discuss the data for the metabolites separately.
It is currently generally accepted that the circulating 25(OH)D3 is the best indicator characterizing the vitamin D status [1]. However, a final consensus about the definition of vitamin D deficiency based on a cutoff level of 25(OH)D3 was not reached in the last International Conferences on Controversies in Vitamin D [1,2,3,8]. The Endocrine Task Force on Vitamin D defined a 25(OH)D3 level of 50 nmol/L as a deficiency cutoff [42]. This cutoff was also recommended by the Institute of Medicine, USA [40]. A higher threshold of 75 nmol/L was suggested by other expert groups [8]. This absence of consensus results mainly from the lack of traceability and harmonization/standardization of the various 25(OH)D3 assays that were applied in the different studies [3,43,44]. Our study revealed that, after treatment with vitamin D cholecalciferol, the high percentage of patients with deficient levels of 25(OH)D3 below 50 nmol/L at the start of the study could be reduced from 53 to 9.4%. In guidelines and comments, a daily supplement dosage of 10 to 50 µg (400–2000 IU) of vitamin D has been recommended to achieve at least this threshold of 50 nmol/L [8,40,45,46,47,48,49]. As the half-life of circulating 25(OH)D3 is estimated to be approximately 15 days [50], this daily supplementation results in a steady state of 25(OH)D3 after three to four months [48,51]. The increase in circulating 25(OH)D3 depends on the baseline level and the dose of the supplemented vitamin D. For an initial level of 25 nmol/L, an increase to more than 60 nmol/L was reported with a daily supplement of 400 IU for three months [52]. This corresponds with the observation in our study (Figure 2b). A similar pattern was visible for the metabolite 24,25(OH)2D3. The first and second hydroxylation steps converting 25(OH)D3 to 24,25(OH)2D3 and 1,25(OH)2D3, respectively, are likely to be inversely regulated by the same effectors (parathormone, 1,25(OH)2D3, and fibroblast growth factor 23/klotho) [53,54,55], but there remains a close relationship between the two metabolites 25(OH)D3 and 24,25(OH)2D3 in the bloodstream. This is reflected in the strong Pearson correlation coefficients of 0.776 during the entire study period. The VMR, calculated as the ratio between 24,25(OH)2D3 and 25(OH)D3, also confirms the increased levels of both metabolites after three months of the study compared with the baseline values at the study’s beginning (Figure 5). VMR has been proposed as a more sensitive indicator for monitoring vitamin D intake [56,57,58], but some recent studies failed to confirm this advantage over the assessment based on 25(OH)D3 only [39,59,60].
Several studies in osteoporosis patients treated with ZA or other bisphosphonates have shown that there is a close relationship between the observed increased bone-mineral density and the circulating 25(OH) vitamin D concentration [33,61,62,63,64]. To achieve this treatment effect, different threshold levels of 25(OH) vitamin D have been reported. This is certainly because the assays used in various studies did not show clear traceability [3,33]. However, despite these conflicting data, studies concerning the usefulness of ZA in PCa patients have generally been performed with a concomitant supply of vitamin D both in the trial and placebo arms [27,34]. Follow-up data for vitamin D metabolites, however, are lacking. The less-satisfactory evidence for vitamin D in combination with bisphosphonates has been summarized in a meta-analysis [65]. Out of 27 randomized studies [65], the authors of one of only three studies with ZA monotherapy without the administration of vitamin D advised the prophylactic administration of vitamin D and the monitoring of the vitamin D levels for these patients [23]. In this respect, our follow-up data for the vitamin D metabolites support this recommendation. The data show that, with daily medication with 100 to 125 µg of cholecalciferol, a long-term level of 25(OH)D3 of >50 nmol/L can be achieved. In recent PCa guidelines, ZA has been recommended as a bone-protective agent and for pain relief in castration-resistant PCa patients and those with bone metastases [29,30]. Thus, ZA continues to be an important component of PCa management, even though the primary expectations of preventing bone metastases were not met [30,34].
For 1,25(OH)2D3, the reference range (95% confidence interval) in the serum/plasma of healthy adults (between 20 and 70 years) has been determined to be 59 to 159 pmol/L [66]. The circulating 1,25(OH)2D3 accounts for only approximately 0.1% of 25(OH)D3. A comparable proportion of the two metabolites was detected in prostate tissue, and their concentrations were correlated with serum levels [67,68]. The baseline concentrations of 1,25(OH)2D3 in our PCa cohort were within this reference range, except for three patients with lower values. Moreover, the repeated measures in our study showed that the concentrations did not significantly change over the entire period. There were no increased 1,25(OH)2D3 values due to the supplementation of cholecalciferol, in contrast to 25(OH)D3 and 24,25(OH)2D3, particularly during the first treatment interval (Figure 2e,f) and for the subclassification with/without metastasis (Figure 4c). The circulating 1,25(OH)2D3 is strictly controlled by a multiregulatory feedback system consisting of parathormone, fibroblast growth factor, calcium, phosphate, and 1,25(OH)2D3 itself [69]. In consequence, normal circulating levels of 1,25(OH)2D3 are largely ensured by the adequate synthesis of 1,25(OH)2D3 from its precursor 25(OH)D3, even at moderately decreased concentrations of 25(OH)D3 [66,70]. This was also evident in our study and, likewise, explains the missing correlations between 1,25(OH)2D3 and 25(OH)D3 or 24,25(OH)2D3. Other studies with and without additional vitamin D intake also reported missing correlations or low coefficients for the correlation between 1,25(OH)2D3 and 25(OH)D3 [38,70,71,72,73,74,75]. The peculiarity of sufficiently functioning 1,25(OH)2D3 synthesis despite a limited 25(OH)D3 substrate supply as long as a severe vitamin deficiency is not present also makes it understandable that 1,25(OH)2D3 is not considered a valid marker for global vitamin D deficiency [70,76].
However, our finding of higher 1,25(OH)2D3 levels in patients with subsequent metastasis during the study compared with distinctly lower levels in patients without progression was apparently surprising. However, it should be pointed out that the higher values in the metastasized PCa group were always in the reference range of circulating 1,25(OH)2D3 [66]. Significantly, the elevated baseline values were confirmed during the study. This is in contrast to other PCa and cancer studies in which increased levels of circulating 1,25(OH)2D3 were associated with improved outcome data [20,67,77,78]. Numerous preclinical studies based on cell-culture experiments and animal studies showed that 1,25(OH)2D3 inhibits the proliferation, migration, and invasion of cancer cells; suppresses angiogenesis; activates the apoptosis and differentiation of cells; or synergistically potentiates the antitumor activity of chemotherapeutic agents [5,79,80,81,82,83,84,85,86]. Since 1,25(OH)2D3 is the actual active vitamin D metabolite, these experimental data are also used as arguments to confirm the hypothesis of an anticancer effect of vitamin D [5,87]. However, it is noticeable that the 1,25(OH)2D3 concentrations used in the experiments are often 100–1000-fold higher than those detected in the bloodstream and target tissues [67,88,89,90]. This obvious contradiction has largely been ignored in the literature to date [91]. Furthermore, other experiments with a transgenic prostate mouse model showed enhanced distant metastasis upon prolonged treatment with 1,25(OH)2D3 [92]. Increased metastasis in treatment experiments with 1,25(OH)2D3 was also observed in a model of mammary-gland cancer in mice depending on the age of the mice [93,94].
We interpret the higher 1,25(OH)2D3 in the subgroup of PCa patients with metastasis after prostatectomy as a possible reflection of the interrelated complex action of this vitamin metabolite. 1,25(OH)2D3 not only directly influences tumor development via the vitamin D receptor as mentioned above but also indirectly modulates this process through crosstalk with the tumor microenvironment, different immunological pathways, and the functional interplay between the vitamin D and androgen receptors [6,7,9,95]. It is also conceivable that the higher serum levels of 1,25(OH)2D3 in the case of the subsequently metastasized PCa subcohort led, through the C23 and C24 metabolic pathways for 1,25(OH)2D3, to higher levels of their intermediates in cells [96]. These intermediates, for which very little is yet known [69], could favor direct or indirect cancerogenesis-promoting effects. Obviously, studies on their possible molecular mechanisms require experiments with biologically relevant concentrations, as already critically discussed above. On the other hand, this association between higher 1,25(OH)2D3 levels and subsequent metastasis does not necessarily imply a causal relationship between the two observations. Due to the lack of corresponding follow-up data for the vitamin D metabolites in other studies, these particular results have likely not been captured to date. However, we think it is important to point out these findings so that they can be verified in other studies and provide potential prognostic decision support.
Some limitations of our study should be mentioned while interpreting the results. First, it was a retrospective study with a limited sample size of patients and without external validation. Second, only the three essential vitamin D metabolites could be measured due to the limited availability of the sample material. Third, all the patients in both the study and control arms received vitamin D and calcium. Despite these limitations, we consider the results of this study to provide interesting information for understanding open questions in the ongoing vitamin D debate in practice. The strength of our study is based on the use of sophisticated analytical methods with traceability and good analytical performance as well as the strict adherence to the requirements for valid vitamin D studies.

5. Conclusions

The two vitamin D metabolites 25(OH)D3 and 24,25(OH)2D3 were not affected by supportive ZA treatment or the development of metastasis over four years in our selected cohort of high-risk PCa patients after prostatectomy. Surprisingly, the low-abundance metabolite 1,25(OH)2D3 was already higher before the study’s start in patients who developed bone metastasis compared to those without bone metastasis. Before potential prognostic decision support can be provided, verification in other studies is necessary.

Supplementary Materials

The following supporting information can be downloaded at: https://www.mdpi.com/article/10.3390/cancers14061560/s1. Figure S1: 1,25(OH)2D3 level as prognostic indicator of subsequent bone metastasis after radical prostatectomy, Table S1: Clinicopathological risk factors of the study patients with and without zoledronic acid treatment and subsequent metastasis.

Author Contributions

Conceptualization, C.S., B.R., K.J. and M.L.; data curation, F.B., K.J. and M.D.; formal analysis, C.S., F.B. and K.J.; investigation, C.S., B.R. and K.J.; methodology, F.B., K.J. and M.D.; project administration, C.S., K.J. and M.L.; resources, F.B., B.R. and M.D.; software, F.B. and M.D.; supervision, C.S., K.J. and M.L.; validation, C.S., F.B., K.J. and M.D.; visualization, C.S. and K.J.; writing—original draft preparation, C.S., B.R., F.B. and K.J.; writing—review and editing, C.S., B.R., F.B., K.J., M.D. and M.L. All authors have read and agreed to the published version of the manuscript.

Funding

This research received no external funding.

Institutional Review Board Statement

The present study was part of the registered and approved trial “Effectiveness of Zometa® treatment for the prevention of bone metastases in high risk prostate cancer patients: a randomized, open-label, multicenter study of the European Association of Urology in Cooperation with the Scandinavian Prostate Cancer Group and the Arbeitsgemeinschaft Urologische Onkologie (ISRCTN66626762 https://doi.org/10.1186/ISRCTN66626762)”. This substudy focused on secondary outcome measures of bone health, as indicated in the trial protocol. The study was conducted in accordance with the Declaration of Helsinki and received ethics approval from the local medical ethics committees of the participating study centers, as indicated in [34].

Informed Consent Statement

Informed consent was obtained from all the subjects involved in the study.

Data Availability Statement

The data presented in this study are available upon reasonable request from the corresponding author.

Acknowledgments

The authors thank Christien Caris and Wim Witjes for their helpful assistance with the patient data management.

Conflicts of Interest

F.B. and M.D. are employees of Immundiagnostik AG, Bensheim, Germany. All the authors declare that they have no conflicts of interest and no direct or indirect commercial incentives associated with publishing the manuscript.

References

  1. Giustina, A.; Bouillon, R.; Binkley, N.; Sempos, C.; Adler, R.A.; Bollerslev, J.; Dawson-Hughes, B.; Ebeling, P.R.; Feldman, D.; Heijboer, A.; et al. Controversies in vitamin D: A statement from the Third International Conference. JBMR Plus 2020, 4, e10417. [Google Scholar] [CrossRef] [PubMed]
  2. Giustina, A.; Adler, R.A.; Binkley, N.; Bouillon, R.; Ebeling, P.R.; Lazaretti-Castro, M.; Marcocci, C.; Rizzoli, R.; Sempos, C.T.; Bilezikian, J.P. Controversies in vitamin D: Summary Statement from an International Conference. J. Clin. Endocrinol. Metab. 2019, 104, 234–240. [Google Scholar] [CrossRef] [PubMed] [Green Version]
  3. Giustina, A.; Adler, R.A.; Binkley, N.; Bollerslev, J.; Bouillon, R.; Dawson-Hughes, B.; Ebeling, P.R.; Feldman, D.; Formenti, A.M.; Lazaretti-Castro, M.; et al. Consensus statement from 2(nd) International Conference on Controversies in Vitamin D. Rev. Endocr. Metab. Disord. 2020, 21, 89–116. [Google Scholar] [CrossRef] [Green Version]
  4. Bouillon, R.; Marcocci, C.; Carmeliet, G.; Bikle, D.; White, J.H.; Dawson-Hughes, B.; Lips, P.; Munns, C.F.; Lazaretti-Castro, M.; Giustina, A.; et al. Skeletal and extraskeletal actions of vitamin D: Current evidence and outstanding questions. Endocr. Rev. 2019, 40, 1109–1151. [Google Scholar] [CrossRef] [Green Version]
  5. Ma, Y.; Johnson, C.S.; Trump, D.L. Mechanistic insights of vitamin D anticancer effects. Vitam. Horm. 2016, 100, 395–431. [Google Scholar] [CrossRef]
  6. Bilani, N.; Elson, L.; Szuchan, C.; Elimimian, E.; Saleh, M.; Nahleh, Z. Newly-identified pathways relating vitamin D to carcinogenesis: A Review. In Vivo 2021, 35, 1345–1354. [Google Scholar] [CrossRef]
  7. Jeon, S.M.; Shin, E.A. Exploring vitamin D metabolism and function in cancer. Exp. Mol. Med. 2018, 50, 1–14. [Google Scholar] [CrossRef] [Green Version]
  8. Amrein, K.; Scherkl, M.; Hoffmann, M.; Neuwersch-Sommeregger, S.; Kostenberger, M.; Tmava Berisha, A.; Martucci, G.; Pilz, S.; Malle, O. Vitamin D deficiency 2.0: An update on the current status worldwide. Eur. J. Clin. Nutr. 2020, 74, 1498–1513. [Google Scholar] [CrossRef]
  9. Ahn, J.; Park, S.; Zuniga, B.; Bera, A.; Song, C.S.; Chatterjee, B. Vitamin D in prostate cancer. Vitam. Horm. 2016, 100, 321–355. [Google Scholar] [CrossRef] [PubMed]
  10. Trump, D.L.; Aragon-Ching, J.B. Vitamin D in prostate cancer. Asian J. Androl. 2018, 20, 244–252. [Google Scholar] [CrossRef] [PubMed]
  11. Capiod, T.; Barry Delongchamps, N.; Pigat, N.; Souberbielle, J.C.; Goffin, V. Do dietary calcium and vitamin D matter in men with prostate cancer? Nat. Rev. Urol. 2018, 15, 453–461. [Google Scholar] [CrossRef]
  12. Xu, Y.; Shao, X.; Yao, Y.; Xu, L.; Chang, L.; Jiang, Z.; Lin, Z. Positive association between circulating 25-hydroxyvitamin D levels and prostate cancer risk: New findings from an updated meta-analysis. J. Cancer Res. Clin. Oncol. 2014, 140, 1465–1477. [Google Scholar] [CrossRef] [PubMed]
  13. Shui, I.M.; Mucci, L.A.; Kraft, P.; Tamimi, R.M.; Lindstrom, S.; Penney, K.L.; Nimptsch, K.; Hollis, B.W.; Dupre, N.; Platz, E.A.; et al. Vitamin D-related genetic variation, plasma vitamin D, and risk of lethal prostate cancer: A prospective nested case-control study. J. Natl. Cancer Inst. 2012, 104, 690–699. [Google Scholar] [CrossRef] [Green Version]
  14. Fang, F.; Kasperzyk, J.L.; Shui, I.; Hendrickson, W.; Hollis, B.W.; Fall, K.; Ma, J.; Gaziano, J.M.; Stampfer, M.J.; Mucci, L.A.; et al. Prediagnostic plasma vitamin D metabolites and mortality among patients with prostate cancer. PLoS ONE 2011, 6, e18625. [Google Scholar] [CrossRef] [Green Version]
  15. Brandstedt, J.; Almquist, M.; Manjer, J.; Malm, J. Vitamin D, PTH, and calcium in relation to survival following prostate cancer. Cancer Causes Control 2016, 27, 669–677. [Google Scholar] [CrossRef] [PubMed]
  16. Song, Z.Y.; Yao, Q.; Zhuo, Z.; Ma, Z.; Chen, G. Circulating vitamin D level and mortality in prostate cancer patients: A dose-response meta-analysis. Endocr. Connect. 2018, 7, R294–R303. [Google Scholar] [CrossRef] [PubMed] [Green Version]
  17. Shahvazi, S.; Soltani, S.; Ahmadi, S.M.; de Souza, R.J.; Salehi-Abargouei, A. The effect of vitamin D supplementation on prostate cancer: A systematic review and meta-Analysis of clinical trials. Horm. Metab. Res. 2019, 51, 11–21. [Google Scholar] [CrossRef] [PubMed] [Green Version]
  18. Ordonez-Mena, J.M.; Schottker, B.; Fedirko, V.; Jenab, M.; Olsen, A.; Halkjaer, J.; Kampman, E.; de Groot, L.; Jansen, E.; Bueno-de-Mesquita, H.B.; et al. Pre-diagnostic vitamin D concentrations and cancer risks in older individuals: An analysis of cohorts participating in the CHANCES consortium. Eur. J. Epidemiol. 2016, 31, 311–323. [Google Scholar] [CrossRef]
  19. Gilbert, R.; Metcalfe, C.; Fraser, W.D.; Donovan, J.; Hamdy, F.; Neal, D.E.; Lane, J.A.; Martin, R.M. Associations of circulating 25-hydroxyvitamin D with prostate cancer diagnosis, stage and grade. Int. J. Cancer 2012, 131, 1187–1196. [Google Scholar] [CrossRef] [Green Version]
  20. Nair-Shalliker, V.; Bang, A.; Egger, S.; Clements, M.; Gardiner, R.A.; Kricker, A.; Seibel, M.J.; Chambers, S.K.; Kimlin, M.G.; Armstrong, B.K.; et al. Post-treatment levels of plasma 25- and 1,25-dihydroxy vitamin D and mortality in men with aggressive prostate cancer. Sci. Rep. 2020, 10, 7736. [Google Scholar] [CrossRef]
  21. Stroomberg, H.V.; Vojdeman, F.J.; Madsen, C.M.; Helgstrand, J.T.; Schwarz, P.; Heegaard, A.M.; Olsen, A.; Tjonneland, A.; Struer Lind, B.; Brasso, K.; et al. Vitamin D levels and the risk of prostate cancer and prostate cancer mortality. Acta Oncol. 2021, 60, 316–322. [Google Scholar] [CrossRef] [PubMed]
  22. Stephan, C.; Lein, M.; Matalon, J.; Kilic, E.; Zhao, Z.; Busch, J.; Jung, K. Serum vitamin D is not helpful for predicting prostate cancer aggressiveness compared with the Prostate Health Index. J. Urol. 2016, 196, 709–714. [Google Scholar] [CrossRef] [PubMed]
  23. Denham, J.W.; Nowitz, M.; Joseph, D.; Duchesne, G.; Spry, N.A.; Lamb, D.S.; Matthews, J.; Turner, S.; Atkinson, C.; Tai, K.H.; et al. Impact of androgen suppression and zoledronic acid on bone mineral density and fractures in the Trans-Tasman Radiation Oncology Group (TROG) 03.04 Randomised Androgen Deprivation and Radiotherapy (RADAR) randomized controlled trial for locally advanced prostate cancer. BJU Int. 2014, 114, 344–353. [Google Scholar] [CrossRef] [PubMed] [Green Version]
  24. Saad, F.; Gleason, D.M.; Murray, R.; Tchekmedyian, S.; Venner, P.; Lacombe, L.; Chin, J.L.; Vinholes, J.J.; Goas, J.A.; Chen, B.; et al. A randomized, placebo-controlled trial of zoledronic acid in patients with hormone-refractory metastatic prostate carcinoma. J. Natl. Cancer Inst. 2002, 94, 1458–1468. [Google Scholar] [CrossRef] [PubMed]
  25. Lee, M.V.; Fong, E.M.; Singer, F.R.; Guenette, R.S. Bisphosphonate treatment inhibits the growth of prostate cancer cells. Cancer Res. 2001, 61, 2602–2608. [Google Scholar] [PubMed]
  26. Wood, J.; Bonjean, K.; Ruetz, S.; Bellahcene, A.; Devy, L.; Foidart, J.M.; Castronovo, V.; Green, J.R. Novel antiangiogenic effects of the bisphosphonate compound zoledronic acid. J. Pharmacol. Exp. Ther. 2002, 302, 1055–1061. [Google Scholar] [CrossRef] [PubMed]
  27. Ryan, C.W.; Huo, D.; Demers, L.M.; Beer, T.M.; Lacerna, L.V. Zoledronic acid initiated during the first year of androgen deprivation therapy increases bone mineral density in patients with prostate cancer. J. Urol. 2006, 176, 972–978. [Google Scholar] [CrossRef]
  28. Lowrance, W.T.; Breau, R.H.; Chou, R.; Chapin, B.F.; Crispino, T.; Dreicer, R.; Jarrard, D.F.; Kibel, A.S.; Morgan, T.M.; Morgans, A.K.; et al. Advanced Prostate Cancer: AUA/ASTRO/SUO Guideline PART II. J. Urol. 2021, 205, 22–29. [Google Scholar] [CrossRef]
  29. Mottet, N.; Cornford, P.; van den Bergh, R.C.N.; Briers, E.; De Santis, M.; Gillessen, S.; Grummet, J.; Henry, A.M.; van der Kwast, T.H.; Lam, T.B.; et al. EAU Guidelines. Edn. Presented at the EAU Annual Congress Milan. 2021. Available online: http://uroweb.org/guidelines/compilations-of-all-guidelines/ (accessed on 6 February 2022).
  30. Prostate Cancer: Diagnosis and Management [A] Evidence Review for Bisphosphonates. NICE Guideline NG131, Published by National Institute for Health and Care Excellence, May 2019, Last Updated December 2021. Available online: http://www.nice.org.uk/guidance/ng131 (accessed on 6 February 2022).
  31. Saylor, P.J.; Rumble, R.B.; Tagawa, S.; Eastham, J.A.; Finelli, A.; Reddy, P.S.; Kungel, T.M.; Nissenberg, M.G.; Michalski, J.M. Bone health and bone-targeted therapies for prostate cancer: ASCO Endorsement of a Cancer Care Ontario Guideline. J. Clin. Oncol. 2020, 38, 1736–1743. [Google Scholar] [CrossRef]
  32. Bourke, S.; Bolland, M.J.; Grey, A.; Horne, A.M.; Wattie, D.J.; Wong, S.; Gamble, G.D.; Reid, I.R. The impact of dietary calcium intake and vitamin D status on the effects of zoledronate. Osteoporos. Int. 2013, 24, 349–354. [Google Scholar] [CrossRef]
  33. Mosali, P.; Bernard, L.; Wajed, J.; Mohamed, Z.; Ewang, M.; Moore, A.; Fogelman, I.; Hampson, G. Vitamin D status and parathyroid hormone concentrations influence the skeletal response to zoledronate and denosumab. Calcif. Tissue Int. 2014, 94, 553–559. [Google Scholar] [CrossRef] [PubMed]
  34. Wirth, M.; Tammela, T.; Cicalese, V.; Gomez Veiga, F.; Delaere, K.; Miller, K.; Tubaro, A.; Schulze, M.; Debruyne, F.; Huland, H.; et al. Prevention of bone metastases in patients with high-risk nonmetastatic prostate cancer treated with zoledronic acid: Efficacy and safety results of the Zometa European Study (ZEUS). Eur. Urol. 2015, 67, 482–491. [Google Scholar] [CrossRef] [PubMed]
  35. Hyslop, N.P.; White, W.H. Estimating precision using duplicate measurements. J. Air Waste Manag. Assoc. 2009, 59, 1032–1039. [Google Scholar] [CrossRef] [Green Version]
  36. Peters, R.; Stephan, C.; Jung, K.; Lein, M.; Friedersdorff, F.; Maxeiner, A. Comparison of PHI and PHI density for prostate cancer detection in a large retrospective Caucasian cohort. Urol. Int. 2021, in press. [Google Scholar] [CrossRef]
  37. Chesney, R.W.; Rosen, J.F.; Hamstra, A.J.; Smith, C.; Mahaffey, K.; DeLuca, H.F. Absence of seasonal variation in serum concentrations of 1,25-dihydroxyvitamin D despite a rise in 25-hydroxyvitamin D in summer. J. Clin. Endocrinol. Metab. 1981, 53, 139–142. [Google Scholar] [CrossRef]
  38. Li, H.; Stampfer, M.J.; Hollis, J.B.; Mucci, L.A.; Gaziano, J.M.; Hunter, D.; Giovannucci, E.L.; Ma, J. A prospective study of plasma vitamin D metabolites, vitamin D receptor polymorphisms, and prostate cancer. PLoS Med. 2007, 4, e103. [Google Scholar] [CrossRef] [PubMed]
  39. Aloia, J.; Fazzari, M.; Shieh, A.; Dhaliwal, R.; Mikhail, M.; Hoofnagle, A.N.; Ragolia, L. The vitamin D metabolite ratio (VMR) as a predictor of functional biomarkers of bone health. Clin. Endocrinol. 2017, 86, 674–679. [Google Scholar] [CrossRef] [PubMed]
  40. Ross, A.C.; Manson, J.E.; Abrams, S.A.; Aloia, J.F.; Brannon, P.M.; Clinton, S.K.; Durazo-Arvizu, R.A.; Gallagher, J.C.; Gallo, R.L.; Jones, G.; et al. The 2011 report on dietary reference intakes for calcium and vitamin D from the Institute of Medicine: What clinicians need to know. J. Clin. Endocrinol. Metab. 2011, 96, 53–58. [Google Scholar] [CrossRef]
  41. Link, H.; Diel, I.; Ohlmann, C.H.; Holtmann, L.; Kerkmann, M.; for the Associations Supportive Care in Oncology (AGSMO), Medical Oncology (AIO), Urological Oncology (AUO), within the German Cancer Society (DKG) and the German Osteooncological Society (DOG). Guideline adherence in bone-targeted treatment of cancer patients with bone metastases in Germany. Support. Care Cancer 2020, 28, 2175–2184. [Google Scholar] [CrossRef] [Green Version]
  42. Holick, M.F.; Binkley, N.C.; Bischoff-Ferrari, H.A.; Gordon, C.M.; Hanley, D.A.; Heaney, R.P.; Murad, M.H.; Weaver, C.M.; Endocrine, S. Evaluation, treatment, and prevention of vitamin D deficiency: An Endocrine Society clinical practice guideline. J. Clin. Endocrinol. Metab. 2011, 96, 1911–1930. [Google Scholar] [CrossRef] [Green Version]
  43. Sempos, C.T.; Heijboer, A.C.; Bikle, D.D.; Bollerslev, J.; Bouillon, R.; Brannon, P.M.; DeLuca, H.F.; Jones, G.; Munns, C.F.; Bilezikian, J.P.; et al. Vitamin D assays and the definition of hypovitaminosis D: Results from the First International Conference on Controversies in Vitamin D. Br. J. Clin. Pharmacol. 2018, 84, 2194–2207. [Google Scholar] [CrossRef] [PubMed]
  44. Altieri, B.; Cavalier, E.; Bhattoa, H.P.; Perez-Lopez, F.R.; Lopez-Baena, M.T.; Perez-Roncero, G.R.; Chedraui, P.; Annweiler, C.; Della Casa, S.; Zelzer, S.; et al. Vitamin D testing: Advantages and limits of the current assays. Eur. J. Clin. Nutr. 2020, 74, 231–247. [Google Scholar] [CrossRef] [PubMed]
  45. Bollerslev, J.; Rejnmark, L.; Marcocci, C.; Shoback, D.M.; Sitges-Serra, A.; van Biesen, W.; Dekkers, O.M.; European Society of, E. European Society of Endocrinology Clinical Guideline: Treatment of chronic hypoparathyroidism in adults. Eur. J. Endocrinol. 2015, 173, G1–G20. [Google Scholar] [CrossRef] [PubMed]
  46. Hanley, D.A.; Cranney, A.; Jones, G.; Whiting, S.J.; Leslie, W.D.; Guidelines Committee of the Scientific Advisory Council of Osteoporosis Canada. Vitamin D in adult health and disease: A review and guideline statement from Osteoporosis Canada (summary). CMAJ 2010, 182, 1315–1319. [Google Scholar] [CrossRef] [Green Version]
  47. Francis, R.M.; Aspray, T.J.; Bowring, C.E.; Fraser, W.D.; Gittoes, N.J.; Javaid, M.K.; Macdonald, H.M.; Patel, S.; Selby, P.L.; Tanna, N. National Osteoporosis Society practical clinical guideline on vitamin D and bone health. Maturitas 2015, 80, 119–121. [Google Scholar] [CrossRef]
  48. EFSA Panel on Dietetic Products, Nutrition and Allergies (NDA). Dietary reference values for vitamin D. EFSA J. 2016, 14, 4547. [Google Scholar] [CrossRef]
  49. Pilz, S.; Zittermann, A.; Trummer, C.; Theiler-Schwetz, V.; Lerchbaum, E.; Keppel, M.H.; Grubler, M.R.; Marz, W.; Pandis, M. Vitamin D testing and treatment: A narrative review of current evidence. Endocr. Connect. 2019, 8, R27–R43. [Google Scholar] [CrossRef] [Green Version]
  50. Jones, G. Pharmacokinetics of vitamin D toxicity. Am. J. Clin. Nutr. 2008, 88, 582S–586S. [Google Scholar] [CrossRef] [Green Version]
  51. Heaney, R.P.; Davies, K.M.; Chen, T.C.; Holick, M.F.; Barger-Lux, M.J. Human serum 25-hydroxycholecalciferol response to extended oral dosing with cholecalciferol. Am. J. Clin. Nutr. 2003, 77, 204–210. [Google Scholar] [CrossRef] [Green Version]
  52. Lips, P.; Wiersinga, A.; van Ginkel, F.C.; Jongen, M.J.; Netelenbos, J.C.; Hackeng, W.H.; Delmas, P.D.; van der Vijgh, W.J. The effect of vitamin D supplementation on vitamin D status and parathyroid function in elderly subjects. J. Clin. Endocrinol. Metab. 1988, 67, 644–650. [Google Scholar] [CrossRef]
  53. Petkovich, M.; Helvig, C.; Epps, T. CYP24A1 regulation in health and disease. In Vitamin D, 3rd ed.; Feldman, D., Pike, J.W., Adams, J.S., Eds.; Academic Press: New York, NY, USA, 2011; Volume 2, pp. 1525–1554. [Google Scholar]
  54. Rubsamen, D.; Kunze, M.M.; Buderus, V.; Brauss, T.F.; Bajer, M.M.; Brune, B.; Schmid, T. Inflammatory conditions induce IRES-dependent translation of cyp24a1. PLoS ONE 2014, 9, e85314. [Google Scholar] [CrossRef] [Green Version]
  55. De Paolis, E.; Scaglione, G.L.; De Bonis, M.; Minucci, A.; Capoluongo, E. CYP24A1 and SLC34A1 genetic defects associated with idiopathic infantile hypercalcemia: From genotype to phenotype. Clin. Chem. Lab. Med. 2019, 57, 1650–1667. [Google Scholar] [CrossRef] [PubMed]
  56. Berg, A.H.; Powe, C.E.; Evans, M.K.; Wenger, J.; Ortiz, G.; Zonderman, A.B.; Suntharalingam, P.; Lucchesi, K.; Powe, N.R.; Karumanchi, S.A.; et al. 24,25-Dihydroxyvitamin d3 and vitamin D status of community-dwelling black and white Americans. Clin. Chem. 2015, 61, 877–884. [Google Scholar] [CrossRef] [PubMed] [Green Version]
  57. Wagner, D.; Hanwell, H.E.; Schnabl, K.; Yazdanpanah, M.; Kimball, S.; Fu, L.; Sidhom, G.; Rousseau, D.; Cole, D.E.; Vieth, R. The ratio of serum 24,25-dihydroxyvitamin D3 to 25-hydroxyvitamin D3 is predictive of 25-hydroxyvitamin D3 response to vitamin D3 supplementation. J. Steroid Biochem. Mol. Biol. 2011, 126, 72–77. [Google Scholar] [CrossRef]
  58. Cashman, K.D.; Hayes, A.; Galvin, K.; Merkel, J.; Jones, G.; Kaufmann, M.; Hoofnagle, A.N.; Carter, G.D.; Durazo-Arvizu, R.A.; Sempos, C.T. Significance of serum 24,25-dihydroxyvitamin D in the assessment of vitamin D status: A double-edged sword? Clin. Chem. 2015, 61, 636–645. [Google Scholar] [CrossRef] [Green Version]
  59. Francic, V.; Ursem, S.R.; Dirks, N.F.; Keppel, M.H.; Theiler-Schwetz, V.; Trummer, C.; Pandis, M.; Borzan, V.; Grubler, M.R.; Verheyen, N.D.; et al. The effect of vitamin D supplementation on its metabolism and the vitamin D metabolite ratio. Nutrients 2019, 11, 2539. [Google Scholar] [CrossRef] [PubMed] [Green Version]
  60. Kim, H.K.; Chung, H.J.; Le, H.G.; Na, B.K.; Cho, M.C. Serum 24,25-dihydroxyvitamin D level in general Korean population and its relationship with other vitamin D biomarkers. PLoS ONE 2021, 16, e0246541. [Google Scholar] [CrossRef]
  61. Geller, J.L.; Hu, B.; Reed, S.; Mirocha, J.; Adams, J.S. Increase in bone mass after correction of vitamin D insufficiency in bisphosphonate-treated patients. Endocr. Pract. 2008, 14, 293–297. [Google Scholar] [CrossRef]
  62. Carmel, A.S.; Shieh, A.; Bang, H.; Bockman, R.S. The 25(OH)D level needed to maintain a favorable bisphosphonate response is ≥3 ng/mL. Osteoporos. Int. 2012, 23, 2479–2487. [Google Scholar] [CrossRef] [Green Version]
  63. Ishijima, M.; Sakamoto, Y.; Yamanaka, M.; Tokita, A.; Kitahara, K.; Kaneko, H.; Kurosawa, H. Minimum required vitamin D level for optimal increase in bone mineral density with alendronate treatment in osteoporotic women. Calcif. Tissue Int. 2009, 85, 398–404. [Google Scholar] [CrossRef]
  64. Nakamura, Y.; Suzuki, T.; Kamimura, M.; Murakami, K.; Ikegami, S.; Uchiyama, S.; Kato, H. Vitamin D and calcium are required at the time of denosumab administration during osteoporosis treatment. Bone Res. 2017, 5, 17021. [Google Scholar] [CrossRef] [Green Version]
  65. Alibhai, S.M.H.; Zukotynski, K.; Walker-Dilks, C.; Emmenegger, U.; Finelli, A.; Morgan, S.C.; Hotte, S.J.; Tomlinson, G.A.; Winquist, E. Bone health and bone-targeted therapies for nonmetastatic prostate cancer: A systematic review and meta-analysis. Ann. Intern. Med. 2017, 167, 341–350. [Google Scholar] [CrossRef] [PubMed]
  66. Dirks, N.F.; Martens, F.; Vanderschueren, D.; Billen, J.; Pauwels, S.; Ackermans, M.T.; Endert, E.; Heijer, M.D.; Blankenstein, M.A.; Heijboer, A.C. Determination of human reference values for serum total 1,25-dihydroxyvitamin D using an extensively validated 2D ID-UPLC-MS/MS method. J. Steroid Biochem. Mol. Biol. 2016, 164, 127–133. [Google Scholar] [CrossRef]
  67. Wagner, D.; Trudel, D.; Van der Kwast, T.; Nonn, L.; Giangreco, A.A.; Li, D.; Dias, A.; Cardoza, M.; Laszlo, S.; Hersey, K.; et al. Randomized clinical trial of vitamin D3 doses on prostatic vitamin D metabolite levels and Ki67 labeling in prostate cancer patients. J. Clin. Endocrinol. Metab. 2013, 98, 1498–1507. [Google Scholar] [CrossRef] [PubMed] [Green Version]
  68. Richards, Z.; Batai, K.; Farhat, R.; Shah, E.; Makowski, A.; Gann, P.H.; Kittles, R.; Nonn, L. Prostatic compensation of the vitamin D axis in African American men. JCI Insight 2017, 2, e91054. [Google Scholar] [CrossRef] [PubMed] [Green Version]
  69. Tuckey, R.C.; Cheng, C.Y.S.; Slominski, A.T. The serum vitamin D metabolome: What we know and what is still to discover. J. Steroid Biochem. Mol. Biol. 2019, 186, 4–21. [Google Scholar] [CrossRef]
  70. Lips, P. Relative value of 25(OH)D and 1,25(OH)2D measurements. J. Bone Miner. Res. 2007, 22, 1668–1671. [Google Scholar] [CrossRef] [PubMed]
  71. Porojnicu, A.; Robsahm, T.E.; Berg, J.P.; Moan, J. Season of diagnosis is a predictor of cancer survival. Sun-induced vitamin D may be involved: A possible role of sun-induced Vitamin D. J. Steroid Biochem. Mol. Biol. 2007, 103, 675–678. [Google Scholar] [CrossRef]
  72. Bouillon, R.A.; Auwerx, J.H.; Lissens, W.D.; Pelemans, W.K. Vitamin D status in the elderly: Seasonal substrate deficiency causes 1,25-dihydroxycholecalciferol deficiency. Am. J. Clin. Nutr. 1987, 45, 755–763. [Google Scholar] [CrossRef]
  73. Hsu, S.; Prince, D.K.; Williams, K.; Allen, N.B.; Burke, G.L.; Hoofnagle, A.N.; Li, X.; Liu, K.J.; McClelland, R.L.; Michos, E.D.; et al. Clinical and biomarker modifiers of vitamin D treatment response: The multi-ethnic study of atherosclerosis. Am. J. Clin. Nutr. 2021, 115, 914–924. [Google Scholar] [CrossRef]
  74. Shah, I.; Petroczi, A.; Naughton, D.P. Exploring the role of vitamin D in type 1 diabetes, rheumatoid arthritis, and Alzheimer disease: New insights from accurate analysis of 10 forms. J. Clin. Endocrinol. Metab. 2014, 99, 808–816. [Google Scholar] [CrossRef] [PubMed] [Green Version]
  75. Tang, J.C.Y.; Jackson, S.; Walsh, N.P.; Greeves, J.; Fraser, W.D.; Bioanalytical Facility Team. The dynamic relationships between the active and catabolic vitamin D metabolites, their ratios, and associations with PTH. Sci. Rep. 2019, 9, 6974. [Google Scholar] [CrossRef] [PubMed]
  76. Dirks, N.F.; Ackermans, M.T.; Lips, P.; de Jongh, R.T.; Vervloet, M.G.; de Jonge, R.; Heijboer, A.C. The when, what & how of measuring vitamin D metabolism in clinical medicine. Nutrients 2018, 10, 482. [Google Scholar] [CrossRef] [Green Version]
  77. Corder, E.H.; Guess, H.A.; Hulka, B.S.; Friedman, G.D.; Sadler, M.; Vollmer, R.T.; Lobaugh, B.; Drezner, M.K.; Vogelman, J.H.; Orentreich, N. Vitamin D and prostate cancer: A prediagnostic study with stored sera. Cancer Epidemiol. Biomark. Prev. 1993, 2, 467–472. [Google Scholar] [PubMed]
  78. Rosenberg, A.; Nettey, O.S.; Gogana, P.; Sheikh, U.; Macias, V.; Kajdacsy-Balla, A.; Sharifi, R.; Kittles, R.A.; Murphy, A.B. Physiologic serum 1,25 dihydroxyvitamin D is inversely associated with prostatic Ki67 staining in a diverse sample of radical prostatectomy patients. Cancer Causes Control 2019, 30, 207–214. [Google Scholar] [CrossRef] [PubMed]
  79. Moreno, J.; Krishnan, A.V.; Feldman, D. Molecular mechanisms mediating the anti-proliferative effects of vitamin D in prostate cancer. J. Steroid Biochem. Mol. Biol. 2005, 97, 31–36. [Google Scholar] [CrossRef]
  80. Sung, V.; Feldman, D. 1,25-Dihydroxyvitamin D3 decreases human prostate cancer cell adhesion and migration. Mol. Cell. Endocrinol. 2000, 164, 133–143. [Google Scholar] [CrossRef]
  81. Luo, W.; Yu, W.D.; Ma, Y.; Chernov, M.; Trump, D.L.; Johnson, C.S. Inhibition of protein kinase CK2 reduces Cyp24a1 expression and enhances 1,25-dihydroxyvitamin D3 antitumor activity in human prostate cancer cells. Cancer Res. 2013, 73, 2289–2297. [Google Scholar] [CrossRef] [Green Version]
  82. Swami, S.; Krishnan, A.V.; Wang, J.Y.; Jensen, K.; Horst, R.; Albertelli, M.A.; Feldman, D. Dietary vitamin D3 and 1,25-dihydroxyvitamin D3 (calcitriol) exhibit equivalent anticancer activity in mouse xenograft models of breast and prostate cancer. Endocrinology 2012, 153, 2576–2587. [Google Scholar] [CrossRef] [Green Version]
  83. Bao, B.Y.; Yeh, S.D.; Lee, Y.F. 1alpha,25-dihydroxyvitamin D3 inhibits prostate cancer cell invasion via modulation of selective proteases. Carcinogenesis 2006, 27, 32–42. [Google Scholar] [CrossRef]
  84. Bao, B.Y.; Yao, J.; Lee, Y.F. 1alpha,25-dihydroxyvitamin D3 suppresses interleukin-8-mediated prostate cancer cell angiogenesis. Carcinogenesis 2006, 27, 1883–1893. [Google Scholar] [CrossRef] [PubMed]
  85. Ben-Eltriki, M.; Deb, S.; Guns, E.S.T. 1alpha,25-Dihydroxyvitamin D3 synergistically enhances anticancer effects of ginsenoside Rh2 in human prostate cancer cells. J. Steroid Biochem. Mol. Biol. 2021, 209, 105828. [Google Scholar] [CrossRef]
  86. Hershberger, P.A.; Yu, W.D.; Modzelewski, R.A.; Rueger, R.M.; Johnson, C.S.; Trump, D.L. Calcitriol (1,25-dihydroxycholecalciferol) enhances paclitaxel antitumor activity in vitro and in vivo and accelerates paclitaxel-induced apoptosis. Clin. Cancer Res. 2001, 7, 1043–1051. [Google Scholar] [PubMed]
  87. Feldman, D.; Krishnan, A.V.; Swami, S.; Giovannucci, E.; Feldman, B.J. The role of vitamin D in reducing cancer risk and progression. Nat. Rev. Cancer 2014, 14, 342–357. [Google Scholar] [CrossRef] [PubMed]
  88. Kovalenko, P.L.; Zhang, Z.; Cui, M.; Clinton, S.K.; Fleet, J.C. 1,25 dihydroxyvitamin D-mediated orchestration of anticancer, transcript-level effects in the immortalized, non-transformed prostate epithelial cell line, RWPE1. BMC Genom. 2010, 11, 26. [Google Scholar] [CrossRef] [PubMed] [Green Version]
  89. McCray, T.; Pacheco, J.V.; Loitz, C.C.; Garcia, J.; Baumann, B.; Schlicht, M.J.; Valyi-Nagy, K.; Abern, M.R.; Nonn, L. Vitamin D sufficiency enhances differentiation of patient-derived prostate epithelial organoids. iScience 2021, 24, 101974. [Google Scholar] [CrossRef] [PubMed]
  90. Giangreco, A.A.; Vaishnav, A.; Wagner, D.; Finelli, A.; Fleshner, N.; Van der Kwast, T.; Vieth, R.; Nonn, L. Tumor suppressor microRNAs, miR-100 and -125b, are regulated by 1,25-dihydroxyvitamin D in primary prostate cells and in patient tissue. Cancer Prev. Res. 2013, 6, 483–494. [Google Scholar] [CrossRef] [Green Version]
  91. Milani, C.; Katayama, M.L.; de Lyra, E.C.; Welsh, J.; Campos, L.T.; Brentani, M.M.; Maciel Mdo, S.; Roela, R.A.; del Valle, P.R.; Goes, J.C.; et al. Transcriptional effects of 1,25 dihydroxyvitamin D3 physiological and supra-physiological concentrations in breast cancer organotypic culture. BMC Cancer 2013, 13, 119. [Google Scholar] [CrossRef]
  92. Ajibade, A.A.; Kirk, J.S.; Karasik, E.; Gillard, B.; Moser, M.T.; Johnson, C.S.; Trump, D.L.; Foster, B.A. Early growth inhibition is followed by increased metastatic disease with vitamin D (calcitriol) treatment in the TRAMP model of prostate cancer. PLoS ONE 2014, 9, e89555. [Google Scholar] [CrossRef]
  93. Anisiewicz, A.; Pawlik, A.; Filip-Psurska, B.; Wietrzyk, J. Differential impact of calcitriol and its analogs on tumor stroma in young and aged ovariectomized mice bearing 4T1 mammary gland cancer. Int. J. Mol. Sci. 2020, 21, 6359. [Google Scholar] [CrossRef]
  94. Pawlik, A.; Anisiewicz, A.; Filip-Psurska, B.; Nowak, M.; Turlej, E.; Trynda, J.; Banach, J.; Gretkierewicz, P.; Wietrzyk, J. Calcitriol and its analogs establish the immunosuppressive microenvironment that drives metastasis in 4T1 mouse mammary gland cancer. Int. J. Mol. Sci. 2018, 19, 2116. [Google Scholar] [CrossRef] [PubMed] [Green Version]
  95. Szymczak, I.; Pawliczak, R. The active metabolite of vitamin D3 as a potential immunomodulator. Scand. J. Immunol. 2016, 83, 83–91. [Google Scholar] [CrossRef] [PubMed] [Green Version]
  96. Christakos, S.; Dhawan, P.; Verstuyf, A.; Verlinden, L.; Carmeliet, G. Vitamin D: Metabolism, molecular mechanism of action, and pleiotropic effects. Physiol. Rev. 2016, 96, 365–408. [Google Scholar] [CrossRef] [PubMed]
Figure 1. Overview of the study design and patient characteristics depending on the season of the study’s start in winter/spring (a) and summer/autumn (b). Abbreviation: ZA = zoledronic acid.
Cancers 14 01560 g001
Figure 2. Levels of (a,b) 25(OH)D3, (c,d) 24,25(OH)2D3, and (e,f) 1,25(OH)2D3 at different time intervals of the study in the total cohort, and dependence on the season of the start of the study. Subfigures (a,c,e) present the results of the repeated-measures ANOVA for a single-factor study after treatment in the total cohort (n = 32). The corresponding subfigures (b,d,f) show the results of the two-factor study with repeated-measures ANOVA on the factor “study start” (winter/spring, n = 16, and summer/autumn, n = 16). Repeated measures were performed before the treatment (time point = 0) and 3 and 9 months after the treatment start. The last time point was 39 months (mean value) after the treatment start. Data at the time points are mean values with their 95% confidence intervals. At the error bars, the letters a, b, c, and d indicate statistically significant differences in the vitamin D3 levels between the different measuring points (at least p < 0.05; corrected values according to Holm–Sidak test): a, compared to “before study”; b, compared to 3 months; c, compared to 9 months; d, compared to ~39 months. Statistically significant differences between the metabolite levels of the two study subgroups at the respective time points are characterized by asterisks: **, p < 0.01; ***, p < 0.001. Abbreviations: ANOVA = analysis of variance; MP factor = related to the time intervals of the measuring points.
Cancers 14 01560 g002
Figure 3. Levels of (a) 25(OH)D3, (b) 24,25(OH)2D3, and (c) 1,25(OH)2D3 before and during the ZA treatment at different time intervals of the study. Repeated measures were performed before the treatment (time point = 0) and 3 and 9 months after the treatment start. The last measuring points were 36 and 42 months (mean values) for patients without and with ZA treatment, respectively. Results of the repeated-measures two-factor ANOVA classified according to the factor ZA treatment (without ZA, n = 15; with ZA, n = 17) are shown as mean values with their 95% confidence intervals. At the error bars, the letters a, b, c, and d indicate statistically significant differences in the vitamin D3 levels between the different measuring points (at least p < 0.05; corrected values according to Holm–Sidak test): a, compared to “before study”; b, compared to 3 months; c, compared to 9 months; d, compared to ~36–42 months. No statistically significant differences for all three metabolite levels were found between the two ZA groups at the respective measuring points. Abbreviations: ANOVA = analysis of variance; ZA = zoledronic acid; MP factor = related to the time intervals of the measuring points.
Cancers 14 01560 g003
Figure 4. Levels of (a) 25(OH)D3, (b) 24,25(OH)2D3, and (c) 1,25(OH)2D3 in patients with and without developed bone metastases during the study. Repeated measures were performed before the treatment (time point = 0) and 3 and 9 months after the treatment start. The last measuring points were 27 and 42 months (mean values) for the patients with (n = 12) and without (n = 20) bone metastasis, respectively. Results of the repeated-measures two-factor ANOVA classified according to the factor metastasis are shown as mean values with their 95% confidence intervals. At the error bars, the letters a, b, c, and d indicate statistically significant differences in the vitamin D3 levels between the different measuring points (at least p < 0.05; corrected values according to Holm–Sidak test): a, compared to “before study”; b, compared to 3 months; c, compared to 9 months; d, compared to ~27–42 months. Statistically significant differences between the metabolite levels for the two study subgroups at the respective time points are characterized by asterisks: **, p < 0.01; *** p < 0.001. Abbreviations: ANOVA = analysis of variance; Meta factor = related to the developed bone metastasis; MP factor = related to the time intervals of the measuring points.
Cancers 14 01560 g004
Figure 5. Change in the vitamin D3 metabolite ratio (VMR) in the total cohort during the study. The ratio [24,25(OH)2D3 to 25(OH)D3 × 100] defined as vitamin D3 metabolite ratio increased during the study. Data at the time points are mean values with their 95% confidence intervals. At the error bars, the letters a, b, c, and d indicate statistically significant differences between the levels at the different measuring points (at least p < 0.05; corrected values according to Holm–Sidak test): a, compared to “before study”; b, compared to 3 months; c, compared to 9 months; d, compared to ~39 months. Further explanations are provided in the legend of Figure 2.
Cancers 14 01560 g005
Publisher’s Note: MDPI stays neutral with regard to jurisdictional claims in published maps and institutional affiliations.

