
Multitask Learning Radiomics on Longitudinal Imaging to Predict Survival Outcomes following Risk-Adaptive Chemoradiation for Non-Small Cell Lung Cancer

 ,
,
Abstract
:Simple Summary
Abstract
1. Introduction
- ingest feature spaces spanning multiple modalities;
- learn tasks jointly defined by the prediction of survival outcome continuously over time instead of prediction at a single time horizon;
- overcome missing and unbalanced data encountered in longitudinal datasets;
- incorporate a kernel-based model of nonlinear relationships between radiomics and survival outcomes beyond linear relationships;
- train efficiently on modest sample sizes from early phase clinical trial datasets that can robustly scale to larger datasets;
- guard against error propagation across feature space modalities.
2. Materials and Methods
2.1. Participants and Clinical Trial Protocol
2.2. Image Acquisition and Processing
2.3. Radiomic Feature Extraction
2.4. Fused Laplacian Sparse Group LASSO (FLSGL)
2.5. Component-Wise Gradient Boosting Survival Analysis (CWGBS)
3. Results
4. Discussion
5. Conclusions
Supplementary Materials
Author Contributions
Funding
Institutional Review Board Statement
Informed Consent Statement
Data Availability Statement
Acknowledgments
Conflicts of Interest
References
- Sung, H.; Ferlay, J.; Siegel, R.L.; Laversanne, M.; Soerjomataram, I.; Jemal, A.; Bray, F. Global cancer statistics 2020: GLOBOCAN estimates of incidence and mortality worldwide for 36 cancers in 185 countries. CA Cancer J. Clin. 2021, 71, 209–249. [Google Scholar] [CrossRef] [PubMed]
- Goldstraw, P.; Crowley, J.; Chansky, K.; Giroux, D.J.; Groome, P.A.; Rami-Porta, R.; Postmus, P.E.; Rusch, V.; Sobin, L.; International Association for the Study of Lung Cancer International Staging Committee; et al. The IASLC Lung Cancer Staging Project: Proposals for the revision of the TNM stage groupings in the forthcoming (seventh) edition of the TNM Classification of malignant tumours. J. Thorac. Oncol. 2007, 2, 706–714. [Google Scholar] [CrossRef] [PubMed] [Green Version]
- Hawkins, S.; Wang, H.; Liu, Y.; Garcia, A.; Stringfield, O.; Krewer, H.; Li, Q.; Cherezov, D.; Gatenby, R.A.; Balagurunathan, Y.; et al. Predicting malignant nodules from screening CT scans. J. Thorac. Oncol. 2016, 11, 2120–2128. [Google Scholar] [CrossRef] [PubMed] [Green Version]
- Ardila, D.; Kiraly, A.P.; Bharadwaj, S.; Choi, B.; Reicher, J.J.; Peng, L.; Tse, D.; Etemadi, M.; Ye, W.; Corrado, G.; et al. End-to-end lung cancer screening with three-dimensional deep learning on low-dose chest computed tomography. Nat. Med. 2019, 25, 954–961. [Google Scholar] [CrossRef] [PubMed]
- Baldwin, D.R.; Gustafson, J.; Pickup, L.; Arteta, C.; Novotny, P.; Declerck, J.; Kadir, T.; Figueiras, C.; Sterba, A.; Exell, A.; et al. External validation of a convolutional neural network artificial intelligence tool to predict malignancy in pulmonary nodules. Thorax 2020, 75, 306–312. [Google Scholar] [CrossRef] [PubMed] [Green Version]
- Linning, E.; Lu, L.; Li, L.; Yang, H.; Schwartz, L.H.; Zhao, B. Radiomics for classification of lung cancer histological subtypes based on nonenhanced computed tomography. Acad. Radiol. 2019, 26, 1245–1252. [Google Scholar]
- Wu, J.; Aguilera, T.; Shultz, D.; Gudur, M.; Rubin, D.L.; Loo, B.W., Jr.; Diehn, M.; Li, R. Early-stage non–small cell lung cancer: Quantitative imaging characteristics of 18F fluorodeoxyglucose PET/CT allow prediction of distant metastasis. Radiology 2016, 281, 270–278. [Google Scholar] [CrossRef] [Green Version]
- Baker, R.; Han, G.; Sarangkasiri, S.; DeMarco, M.; Turke, C.; Stevens, C.W.; Dilling, T.J. Clinical and dosimetric predictors of radiation pneumonitis in a large series of patients treated with stereotactic body radiation therapy to the lung. Int. J. Radiat. Oncol. Biol. Phys. 2013, 85, 190–195. [Google Scholar] [CrossRef]
- Jadvar, H. The Use of Imaging in the Prediction and Assessment of Cancer Treatment Toxicity. Diagnostics 2017, 7, 43. [Google Scholar] [CrossRef] [Green Version]
- Wei, H.; Yang, F.; Liu, Z.; Sun, S.; Xu, F.; Liu, P.; Li, H.; Liu, Q.; Qiao, X.; Wang, X. Application of computed tomography-based radiomics signature analysis in the prediction of the response of small cell lung cancer patients to first-line chemotherapy. Exp. Ther. Med. 2019, 17, 3621–3629. [Google Scholar] [CrossRef] [Green Version]
- He, B.; Di Dong, Y.S.; Zhou, C.; Fang, M.; Zhu, Y.; Zhang, H.; Huang, Z.; Jiang, T.; Tian, J.; Chen, C. Predicting response to immunotherapy in advanced non-small-cell lung cancer using tumor mutational burden radiomic biomarker. J. Immunother. Cancer 2020, 8, e000550. [Google Scholar] [CrossRef]
- Hosny, A.; Parmar, C.; Coroller, T.P.; Grossmann, P.; Zeleznik, R.; Kumar, A.; Bussink, J.; Gillies, R.J.; Mak, R.H.; Aerts, H.J. Deep learning for lung cancer prognostication: A retrospective multi-cohort radiomics study. PLoS Med. 2018, 15, e1002711. [Google Scholar] [CrossRef] [PubMed] [Green Version]
- Oberije, C.; De Ruysscher, D.; Houben, R.; van de Heuvel, M.; Uyterlinde, W.; Deasy, J.O.; Belderbos, J.; Dingemans, A.M.C.; Rimner, A.; Din, S.; et al. A validated prediction model for overall survival from stage III non-small cell lung cancer: Toward survival prediction for individual patients. Int. J. Radiat. Oncol. Biol. Phys. 2015, 92, 935–944. [Google Scholar] [CrossRef] [PubMed] [Green Version]
- Huang, Y.; Liu, Z.; He, L.; Chen, X.; Pan, D.; Ma, Z.; Liang, C.; Tian, J.; Liang, C. Radiomics signature: A potential biomarker for the prediction of disease-free survival in early-stage (I or II) non—Small cell lung cancer. Radiology 2016, 281, 947–957. [Google Scholar] [CrossRef] [PubMed]
- Song, J.; Shi, J.; Dong, D.; Fang, M.; Zhong, W.; Wang, K.; Wu, N.; Huang, Y.; Liu, Z.; Cheng, Y.; et al. A new approach to predict progression-free survival in stage IV EGFR-mutant NSCLC patients with EGFR-TKI therapy. Clin. Cancer Res. 2018, 24, 3583–3592. [Google Scholar] [CrossRef] [PubMed] [Green Version]
- Carvalho, S.; Leijenaar, R.T.; Velazquez, E.R.; Oberije, C.; Parmar, C.; Van Elmpt, W.; Reymen, B.; Troost, E.G.; Oellers, M.; Dekker, A.; et al. Prognostic value of metabolic metrics extracted from baseline positron emission tomography images in non-small cell lung cancer. Acta Oncol. 2013, 52, 1398–1404. [Google Scholar] [CrossRef] [Green Version]
- Fried, D.V.; Tucker, S.L.; Zhou, S.; Liao, Z.; Mawlawi, O.; Ibbott, G.; Court, L.E. Prognostic value and reproducibility of pretreatment CT texture features in stage III non-small cell lung cancer. Int. J. Radiat. Oncol. Biol. Phys. 2014, 90, 834–842. [Google Scholar] [CrossRef] [Green Version]
- Coroller, T.P.; Grossmann, P.; Hou, Y.; Velazquez, E.R.; Leijenaar, R.T.; Hermann, G.; Lambin, P.; Haibe-Kains, B.; Mak, R.H.; Aerts, H.J. CT-based radiomic signature predicts distant metastasis in lung adenocarcinoma. Radiother. Oncol. 2015, 114, 345–350. [Google Scholar] [CrossRef]
- van Timmeren, J.E.; Leijenaar, R.T.; van Elmpt, W.; Reymen, B.; Oberije, C.; Monshouwer, R.; Bussink, J.; Brink, C.; Hansen, O.; Lambin, P. Survival prediction of non-small cell lung cancer patients using radiomics analyses of cone-beam CT images. Radiother. Oncol. 2017, 123, 363–369. [Google Scholar] [CrossRef] [Green Version]
- Xiong, Q.; Zhou, X.; Liu, Z.; Lei, C.; Yang, C.; Yang, M.; Zhang, L.; Zhu, T.; Zhuang, X.; Liang, C.; et al. Multiparametric MRI-based radiomics analysis for prediction of breast cancers insensitive to neoadjuvant chemotherapy. Clin. Transl. Oncol. 2020, 22, 50–59. [Google Scholar] [CrossRef]
- Bowen, S.R.; Hippe, D.S.; Thomas, H.M.; Sasidharan, B.; Lampe, P.; Baik, C.S.; Eaton, K.D.; Lee, S.M.; Martins, R.G.; Santana-Davila, R.; et al. Prognostic value and peripheral immunologic correlates of early FDG PET response imaging in a phase II trial of risk-adaptive chemoradiation for unresectable non-small cell lung cancer. medRxiv 2021, 111, S90–S91. [Google Scholar] [CrossRef]
- Lambin, P.; Van Stiphout, R.G.; Starmans, M.H.; Rios-Velazquez, E.; Nalbantov, G.; Aerts, H.J.; Roelofs, E.; Van Elmpt, W.; Boutros, P.C.; Granone, P.; et al. Predicting outcomes in radiation oncology—Multifactorial decision support systems. Nat. Rev. Clin. Oncol. 2013, 10, 27–40. [Google Scholar] [CrossRef] [PubMed] [Green Version]
- Gillies, R.J.; Kinahan, P.E.; Hricak, H. Radiomics: Images are more than pictures, they are data. Radiology 2016, 278, 563–577. [Google Scholar] [CrossRef] [Green Version]
- Bowen, S.R.; Hippe, D.S.; Chaovalitwongse, W.A.; Duan, C.; Thammasorn, P.; Liu, X.; Miyaoka, R.S.; Vesselle, H.J.; Kinahan, P.E.; Rengan, R.; et al. Voxel Forecast for Precision Oncology: Predicting spatially variant and multiscale cancer therapy response on longitudinal quantitative molecular imaging. Clin. Cancer Res. 2019, 25, 5027–5037. [Google Scholar] [CrossRef] [PubMed]
- Yip, S.S.; Aerts, H.J. Applications and limitations of radiomics. Phys. Med. Biol. 2016, 61, R150. [Google Scholar] [CrossRef] [Green Version]
- Rahmim, A.; Schmidtlein, C.R.; Jackson, A.; Sheikhbahaei, S.; Marcus, C.; Ashrafinia, S.; Soltani, M.; Subramaniam, R.M. A novel metric for quantification of homogeneous and heterogeneous tumors in PET for enhanced clinical outcome prediction. Phys. Med. Biol. 2015, 61, 227. [Google Scholar] [CrossRef] [PubMed] [Green Version]
- Aerts, H.J.; Bussink, J.; Oyen, W.J.; van Elmpt, W.; Folgering, A.M.; Emans, D.; Velders, M.; Lambin, P.; De Ruysscher, D. Identification of residual metabolic-active areas within NSCLC tumours using a pre-radiotherapy FDG-PET-CT scan: A prospective validation. Lung Cancer 2012, 75, 73–76. [Google Scholar] [CrossRef]
- Konert, T.; Everitt, S.; La Fontaine, M.D.; van de Kamer, J.B.; MacManus, M.P.; Vogel, W.V.; Callahan, J.; Sonke, J.J. Robust, independent and relevant prognostic 18F-fluorodeoxyglucose positron emission tomography radiomics features in non-small cell lung cancer: Are there any? PLoS ONE 2020, 15, e0228793. [Google Scholar]
- Park, S.; Lee, S.M.; Kim, S.; Choi, S.; Kim, W.; Do, K.H.; Seo, J.B. Performance of radiomics models for survival prediction in non-small-cell lung cancer: Influence of CT slice thickness. Eur. Radiol. 2021, 31, 2856–2865. [Google Scholar] [CrossRef]
- Sugai, Y.; Kadoya, N.; Tanaka, S.; Tanabe, S.; Umeda, M.; Yamamoto, T.; Takeda, K.; Dobashi, S.; Ohashi, H.; Takeda, K.; et al. Impact of feature selection methods and subgroup factors on prognostic analysis with CT-based radiomics in non-small cell lung cancer patients. Radiat. Oncol. 2021, 16, 1–12. [Google Scholar] [CrossRef]
- D’Antonoli, T.A.; Farchione, A.; Lenkowicz, J.; Chiappetta, M.; Cicchetti, G.; Martino, A.; Ottavianelli, A.; Manfredi, R.; Margaritora, S.; Bonomo, L.; et al. CT radiomics signature of tumor and peritumoral lung parenchyma to predict nonsmall cell lung cancer postsurgical recurrence risk. Acad. Radiol. 2020, 27, 497–507. [Google Scholar]
- Wang, X.; Li, Q.; Cai, J.; Wang, W.; Xu, P.; Zhang, Y.; Fang, Q.; Fu, C.; Fan, L.; Xiao, Y.; et al. Predicting the invasiveness of lung adenocarcinomas appearing as ground-glass nodule on CT scan using multi-task learning and deep radiomics. Transl. Lung Cancer Res. 2020, 9, 1397. [Google Scholar] [CrossRef] [PubMed]
- Lai, Y.H.; Chen, W.N.; Hsu, T.C.; Lin, C.; Tsao, Y.; Wu, S. Overall survival prediction of non-small cell lung cancer by integrating microarray and clinical data with deep learning. Sci. Rep. 2020, 10, 4679. [Google Scholar] [CrossRef] [PubMed]
- Vaidya, M.; Creach, K.M.; Frye, J.; Dehdashti, F.; Bradley, J.D.; El Naqa, I. Combined PET/CT image characteristics for radiotherapy tumor response in lung cancer. Radiother. Oncol. 2012, 102, 239–245. [Google Scholar] [CrossRef]
- Subramanian, V.; Do, M.N.; Syeda-Mahmood, T. Multimodal fusion of imaging and genomics for lung cancer recurrence prediction. In Proceedings of the 2020 IEEE 17th International Symposium on Biomedical Imaging (ISBI), Iowa City, IA, USA, 3–7 April 2020; pp. 804–808. [Google Scholar]
- Tang, X.; Xu, X.; Han, Z.; Bai, G.; Wang, H.; Liu, Y.; Du, P.; Liang, Z.; Zhang, J.; Lu, H.; et al. Elaboration of a multimodal MRI-based radiomics signature for the preoperative prediction of the histological subtype in patients with non-small-cell lung cancer. Biomed. Eng. Online 2020, 19, 1–17. [Google Scholar] [CrossRef] [PubMed] [Green Version]
- Gao, J.; Lyu, T.; Xiong, F.; Wang, J.; Ke, W.; Li, Z. MGNN: A multimodal graph neural network for predicting the survival of cancer patients. In Proceedings of the 43rd International ACM SIGIR Conference on Research and Development in Information Retrieval; 2020; pp. 1697–1700. Available online: https://dl.acm.org/doi/abs/10.1145/3397271.3401214 (accessed on 9 December 2021).
- Zhang, Y.; Yang, Q. A survey on multi-task learning. IEEE Trans. Knowl. Data Eng. 2021, 2, 1–10. [Google Scholar] [CrossRef]
- Caruana, R. Multitask learning. Mach. Learn. 1997, 28, 41–75. [Google Scholar] [CrossRef]
- Greenlaw, K.; Szefer, E.; Graham, J.; Lesperance, M.; Nathoo, F.S.; Alzheimer’s Disease Neuroimaging Initiative. A Bayesian group sparse multi-task regression model for imaging genetics. Bioinformatics 2017, 33, 2513–2522. [Google Scholar] [CrossRef] [Green Version]
- Zhang, D.; Shen, D.; The Alzheimer’s Disease Neuroimaging Initiative. Multi-modal multi-task learning for joint prediction of multiple regression and classification variables in Alzheimer’s disease. NeuroImage 2012, 59, 895–907. [Google Scholar] [CrossRef] [Green Version]
- Emrani, S.; McGuirk, A.; Xiao, W. Prognosis and diagnosis of Parkinson’s disease using multi-task learning. In Proceedings of the 23rd ACM SIGKDD International Conference on Knowledge Discovery and Data Mining; 2017; pp. 1457–1466. Available online: https://dl.acm.org/doi/10.1145/3097983.3098065 (accessed on 9 December 2021).
- Zhang, L.; Dong, D.; Liu, Z.; Zhou, J.; Tian, J. Joint Multi-Task Learning for Survival Prediction of Gastric Cancer Patients using CT Images. In Proceedings of the 2021 IEEE 18th International Symposium on Biomedical Imaging (ISBI), Nice, France, 13–16 April 2021; pp. 895–898. [Google Scholar]
- Chi, S.; Tian, Y.; Wang, F.; Wang, Y.; Chen, M.; Li, J. Deep Semisupervised Multitask Learning Model and its Interpretability for Survival Analysis. IEEE J. Biomed. Health Inform. 2021, 25, 3185–3196. [Google Scholar] [CrossRef]
- Liu, Q.P.; Xu, X.; Zhu, F.P.; Zhang, Y.D.; Liu, X.S. Prediction of prognostic risk factors in hepatocellular carcinoma with transarterial chemoembolization using multi-modal multi-task deep learning. EClinicalMedicine 2020, 23, 100379. [Google Scholar] [CrossRef]
- Suk, H.I.; Lee, S.W.; Shen, D.; Alzheimer’s Disease Neuroimaging Initiative. Deep ensemble learning of sparse regression models for brain disease diagnosis. Med. Image Anal. 2017, 37, 101–113. [Google Scholar] [CrossRef] [Green Version]
- Li, Y.; Tian, X.; Liu, T.; Tao, D. On better exploring and exploiting task relationships in multitask learning: Joint model and feature learning. IEEE Trans. Neural Netw. Learn. Syst. 2017, 29, 1975–1985. [Google Scholar] [CrossRef] [Green Version]
- Zhu, X.; Suk, H.I.; Wang, L.; Lee, S.W.; Shen, D.; Alzheimer’s Disease Neuroimaging Initiative. A novel relational regularization feature selection method for joint regression and classification in AD diagnosis. Med. Image Anal. 2017, 38, 205–214. [Google Scholar] [CrossRef] [Green Version]
- Kumar, A.; Daume, H., III. Learning task grouping and overlap in multi-task learning. arXiv 2012, arXiv:1206.6417. [Google Scholar]
- Widmer, C.; Rätsch, G. Multitask learning in computational biology. In Proceedings of the ICML Workshop on Unsupervised and Transfer Learning, JMLR Workshop and Conference Proceedings; 2012; pp. 207–216. Available online: https://proceedings.mlr.press/v27/widmer12a.html (accessed on 9 December 2021).
- Antonia, S.J.; Villegas, A.; Daniel, D.; Vicente, D.; Murakami, S.; Hui, R.; Kurata, T.; Chiappori, A.; Lee, K.H.; De Wit, M.; et al. Overall survival with durvalumab after chemoradiotherapy in stage III NSCLC. N. Engl. J. Med. 2018, 379, 2342–2350. [Google Scholar] [CrossRef]
- Antonia, S.J.; Villegas, A.; Daniel, D.; Vicente, D.; Murakami, S.; Hui, R.; Yokoi, T.; Chiappori, A.; Lee, K.H.; de Wit, M.; et al. Durvalumab after chemoradiotherapy in stage III non–small-cell lung cancer. N. Engl. J. Med. 2017, 377, 1919–1929. [Google Scholar] [CrossRef] [Green Version]
- Horn, K.P.; Thomas, H.M.; Vesselle, H.J.; Kinahan, P.E.; Miyaoka, R.S.; Rengan, R.; Zeng, J.; Bowen, S.R. Reliability of Quantitative 18F-FDG PET/CT Imaging Biomarkers for Classifying Early Response to Chemoradiotherapy in Patients With Locally Advanced Non–Small Cell Lung Cancer. Clin. Nucl. Med. 2021, 46, 861–871. [Google Scholar] [CrossRef]
- Boellaard, R. Standards for PET image acquisition and quantitative data analysis. J. Nucl. Med. 2009, 50, 11S–20S. [Google Scholar] [CrossRef] [Green Version]
- Zwanenburg, A.; Vallières, M.; Abdalah, M.A.; Aerts, H.J.; Andrearczyk, V.; Apte, A.; Ashrafinia, S.; Bakas, S.; Beukinga, R.J.; Boellaard, R.; et al. The image biomarker standardization initiative: Standardized quantitative radiomics for high-throughput image-based phenotyping. Radiology 2020, 295, 328–338. [Google Scholar] [CrossRef] [Green Version]
- Fedorov, A.; Beichel, R.; Kalpathy-Cramer, J.; Finet, J.; Fillion-Robin, J.C.; Pujol, S.; Bauer, C.; Jennings, D.; Fennessy, F.; Sonka, M.; et al. 3D Slicer as an image computing platform for the Quantitative Imaging Network. Magn. Reson. Imaging 2012, 30, 1323–1341. [Google Scholar] [CrossRef] [Green Version]
- Zwanenburg, A.; Leger, S.; Vallières, M.; Löck, S. Image biomarker standardisation initiative. arXiv 2016, arXiv:1612.07003. [Google Scholar]
- Altazi, B.A.; Zhang, G.G.; Fernandez, D.C.; Montejo, M.E.; Hunt, D.; Werner, J.; Biagioli, M.C.; Moros, E.G. Reproducibility of F18-FDG PET radiomic features for different cervical tumor segmentation methods, gray-level discretization, and reconstruction algorithms. J. Appl. Clin. Med. Phys. 2017, 18, 32–48. [Google Scholar] [CrossRef]
- Bailly, C.; Bodet-Milin, C.; Couespel, S.; Necib, H.; Kraeber-Bodéré, F.; Ansquer, C.; Carlier, T. Revisiting the robustness of PET-based textural features in the context of multi-centric trials. PLoS ONE 2016, 11, e0159984. [Google Scholar] [CrossRef]
- Shafiq-ul Hassan, M. Intrinsic dependencies of CT radiomic features on voxel size and number of gray levels. Med. Phys. 2017, 44, 1050–1062. [Google Scholar] [CrossRef]
- Shiri, I.; Rahmim, A.; Ghaffarian, P.; Geramifar, P.; Abdollahi, H.; Bitarafan-Rajabi, A. The impact of image reconstruction settings on 18F-FDG PET radiomic features: Multi-scanner phantom and patient studies. Eur. Radiol. 2017, 27, 4498–4509. [Google Scholar] [CrossRef]
- Yan, J.; Chu-Shern, J.L.; Loi, H.Y.; Khor, L.K.; Sinha, A.K.; Quek, S.T.; Tham, I.W.; Townsend, D. Impact of image reconstruction settings on texture features in 18F-FDG PET. J. Nucl. Med. 2015, 56, 1667–1673. [Google Scholar] [CrossRef] [Green Version]
- Kuruwita, C. A Bayesian Approach for Bandwidth Selection in Kernel Density Estimation with Censored Data. 2006. Available online: https://tigerprints.clemson.edu/cgi/viewcontent.cgi?article=1025&context=all_theses (accessed on 9 December 2021).
- Liu, X.; Cao, P.; Gonçalves, A.R.; Zhao, D.; Banerjee, A. Modeling alzheimer’s disease progression with fused laplacian sparse group LASSO. ACM Trans. Knowl. Discov. Data 2018, 12, 1–35. [Google Scholar] [CrossRef]
- Kleinbaum, D.G.; Klein, M. Survival Analysis; Springer: Berlin/Heidelberg, Germany, 2010; Volume 3. [Google Scholar]
- Hothorn, T.; Bühlmann, P.; Dudoit, S.; Molinaro, A.; Van Der Laan, M.J. Survival ensembles. Biostatistics 2006, 7, 355–373. [Google Scholar] [CrossRef]
- Kattan, M.W.; Gerds, T.A. The index of prediction accuracy: An intuitive measure useful for evaluating risk prediction models. Diagn. Progn. Res. 2018, 2, 1–7. [Google Scholar] [CrossRef]
- Khorrami, M.; Prasanna, P.; Gupta, A.; Patil, P.; Velu, P.D.; Thawani, R.; Corredor, G.; Alilou, M.; Bera, K.; Fu, P.; et al. Changes in CT radiomic features associated with lymphocyte distribution predict overall survival and response to immunotherapy in Non–Small cell lung cancer. Cancer Immunol. Res. 2020, 8, 108–119. [Google Scholar] [CrossRef]
- Fave, X.; Zhang, L.; Yang, J.; Mackin, D.; Balter, P.; Gomez, D.; Followill, D.; Jones, A.K.; Stingo, F.; Liao, Z.; et al. Delta-radiomics features for the prediction of patient outcomes in non–small cell lung cancer. Sci. Rep. 2017, 7, 588. [Google Scholar] [CrossRef] [PubMed]
- Fan, M.; Yuan, W.; Zhao, W.; Xu, M.; Wang, S.; Gao, X.; Li, L. Joint prediction of breast cancer histological grade and Ki-67 expression level based on DCE-MRI and DWI radiomics. IEEE J. Biomed. Health Inform. 2019, 24, 1632–1642. [Google Scholar] [CrossRef] [PubMed] [Green Version]
- Luo, Y.; McShan, D.L.; Matuszak, M.M.; Ray, D.; Lawrence, T.S.; Jolly, S.; Kong, F.M.; Ten Haken, R.K.; El Naqa, I. A multiobjective Bayesian networks approach for joint prediction of tumor local control and radiation pneumonitis in nonsmall-cell lung cancer (NSCLC) for response-adapted radiotherapy. Med. Phys. 2018, 45, 3980–3995. [Google Scholar] [CrossRef] [PubMed] [Green Version]
- Lin, P.; Yang, P.F.; Chen, S.; Shao, Y.Y.; Xu, L.; Wu, Y.; Teng, W.; Zhou, X.Z.; Li, B.H.; Luo, C.; et al. A Delta-radiomics model for preoperative evaluation of Neoadjuvant chemotherapy response in high-grade osteosarcoma. Cancer Imaging 2020, 20, 1–12. [Google Scholar] [CrossRef] [PubMed] [Green Version]
- Nasief, H.; Zheng, C.; Schott, D.; Hall, W.; Tsai, S.; Erickson, B.; Li, X.A. A machine learning based delta-radiomics process for early prediction of treatment response of pancreatic cancer. NPJ Precis. Oncol. 2019, 3, 25. [Google Scholar] [CrossRef]
- Alahmari, S.S.; Cherezov, D.; Goldgof, D.B.; Hall, L.O.; Gillies, R.J.; Schabath, M.B. Delta radiomics improves pulmonary nodule malignancy prediction in lung cancer screening. IEEE Access 2018, 6, 77796–77806. [Google Scholar] [CrossRef]
- Hui, D. Prognostication of survival in patients with advanced cancer: Predicting the unpredictable? Cancer Control 2015, 22, 489–497. [Google Scholar] [CrossRef] [Green Version]
- Solimando, A.G.; Summa, S.D.; Vacca, A.; Ribatti, D. Cancer-associated angiogenesis: The endothelial cell as a checkpoint for immunological patrolling. Cancers 2020, 12, 3380. [Google Scholar] [CrossRef]
- Tomaszewski, M.R.; Gillies, R.J. The biological meaning of radiomic features. Radiology 2021, 298, 505–516. [Google Scholar] [CrossRef]


| Characteristics | Value * | |
|---|---|---|
| Age | 63 (34–78) | |
| Gender | ||
| Female | 25 (56%) | |
| Male | 20 (44%) | |
| Clinical Stage (AJCCv7) | ||
| IIB | 2 (4%) | |
| IIIA | 23 (51%) | |
| IIIB | 15 (33%) | |
| N2 Recurrence | 5 (11%) | |
| Histology | ||
| Squamous cell carcinoma | 14 (31%) | |
| Adenocarcinoma | 29 (64%) | |
| other | 2 (4%) | |
| Radiation therapy | ||
| Proton scanning beam therapy | 23 (51%) | |
| X-ray radiotherapy (IMRT/VMAT) | 22 (49%) | |
| Chemotherapy | ||
| Carboplatin + paclitaxel | 25 (56%) | |
| Cisplatin + etoposide | 11 (24%) | |
| Other platinum doublet | 9 (20%) | |
| PD-L1 tumor proportion score | ||
| >50% | 6 (13%) | |
| 1–49% | 7 (16%) | |
| <1% | 7 (16%) | |
| Unknown | 25 (56%) | |
| Mid-PET Response | ||
| Responder | 29 (64%) | |
| Non-responder | 16 (36%) | |
| Mid-PET PERCIST 1.0 | ||
| Partial metabolic responder | 27 (60%) | |
| Stable metabolic disease | 17 (38%) | |
| Progressive metabolic disease | 1 (2%) |
| Modality | Single Task (Pre-RT) | Single Task (Mid-RT) | Multitask (Pre-RT/Mid-RT) | Friedman p-Value | Wilcoxon Signed Rank p |
|---|---|---|---|---|---|
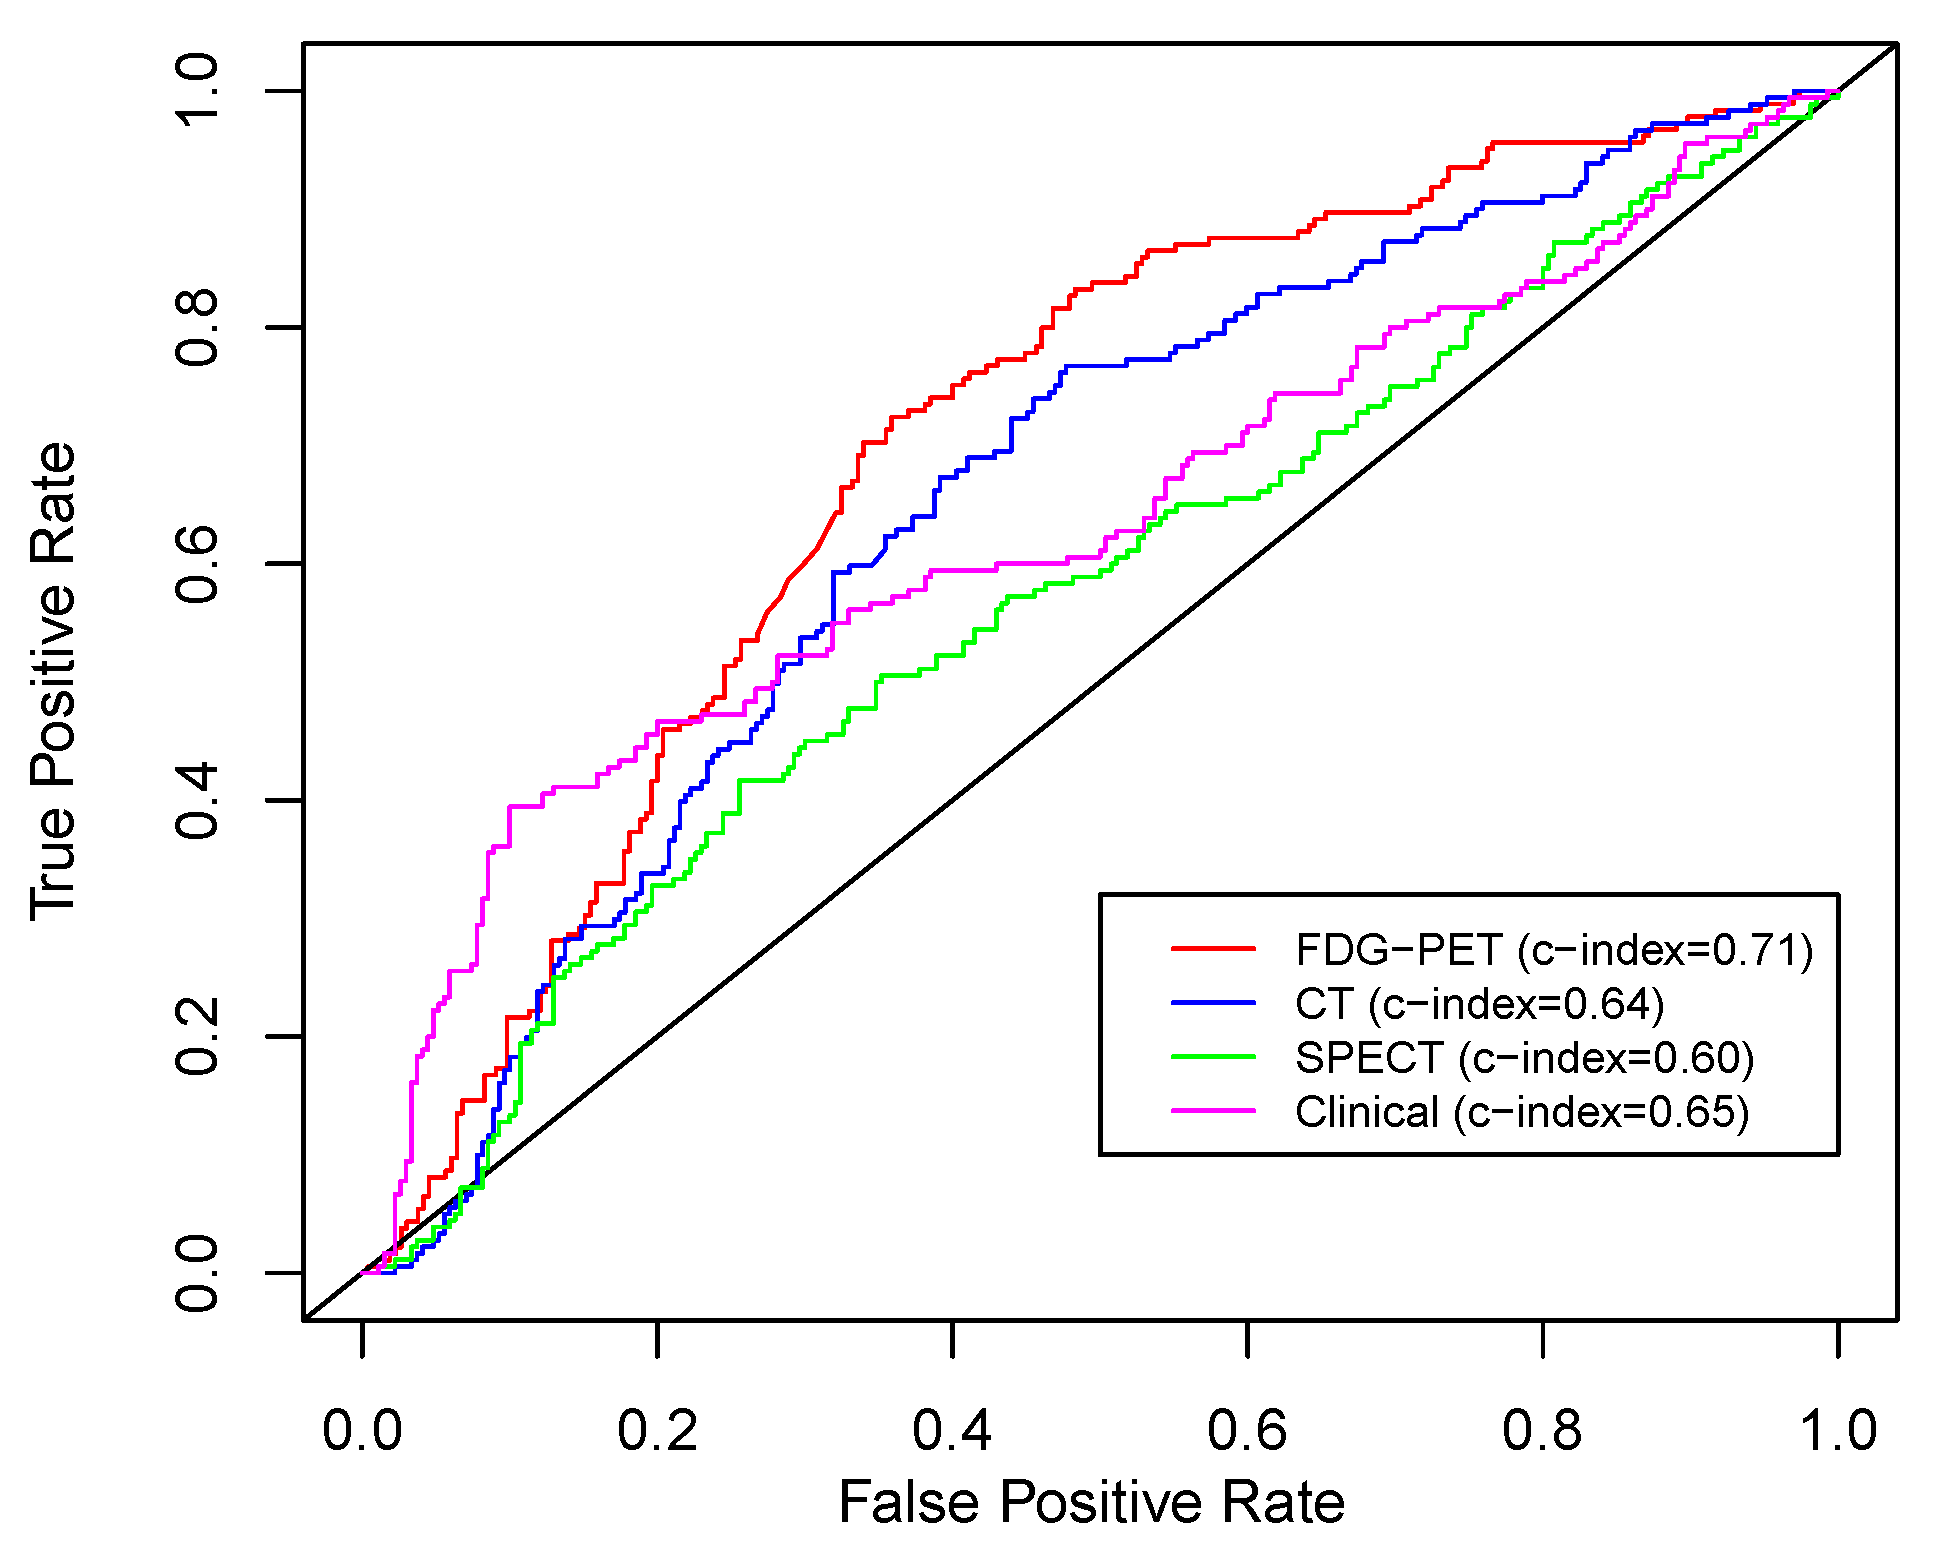
| FDG-PET | 0.66 (0.61–0.70) | 0.63 (0.56–0.67) | 0.71 (0.67–0.75) | <0.01 | 0.02 |
| CT | 0.56 (0.52–0.61) | 0.64 (0.60–0.71) | 0.64 (0.59–0.72) | 0.01 | 0.23 |
| SPECT * | 0.60 (0.57–0.63) | - | - | - | 0.20 |
| Clinical Variables | 0.63 (0.58–0.70) | 0.62 (0.56–0.67) | 0.65 (0.61–0.71) | 0.06 | reference |
| Modalities | Single Task (Pre-RT) | Single Task (Mid-RT) | Multitask (Pre-RT/Mid-RT) | Friedman p-Value |
|---|---|---|---|---|
| FDG-PET + CT | 0.62 (0.58–0.66) | 0.63 (0.59–0.68) | 0.66 (0.63–0.70) | 0.03 |
| FDG-PET + SPECT | 0.59 (0.56–0.63) | 0.63 (0.56–0.67) | 0.65 (0.61–0.69) | 0.01 |
| FDG-PET + Clinical Variables | 0.63 (0.58–0.68) | 0.60 (0.55–0.66) | 0.67 (0.64–0.72) | <0.01 |
| FDG-PET + CT + SPECT | 0.57 (0.54–0.61) | 0.60 (0.56–0.65) | 0.63 (0.59–0.67) | <0.01 |
| FDG-PET + CT + SPECT + Clinical Variables | 0.57 (0.53–0.61) | 0.61 (0.55–0.66) | 0.62 (0.57–0.67) | 0.01 |
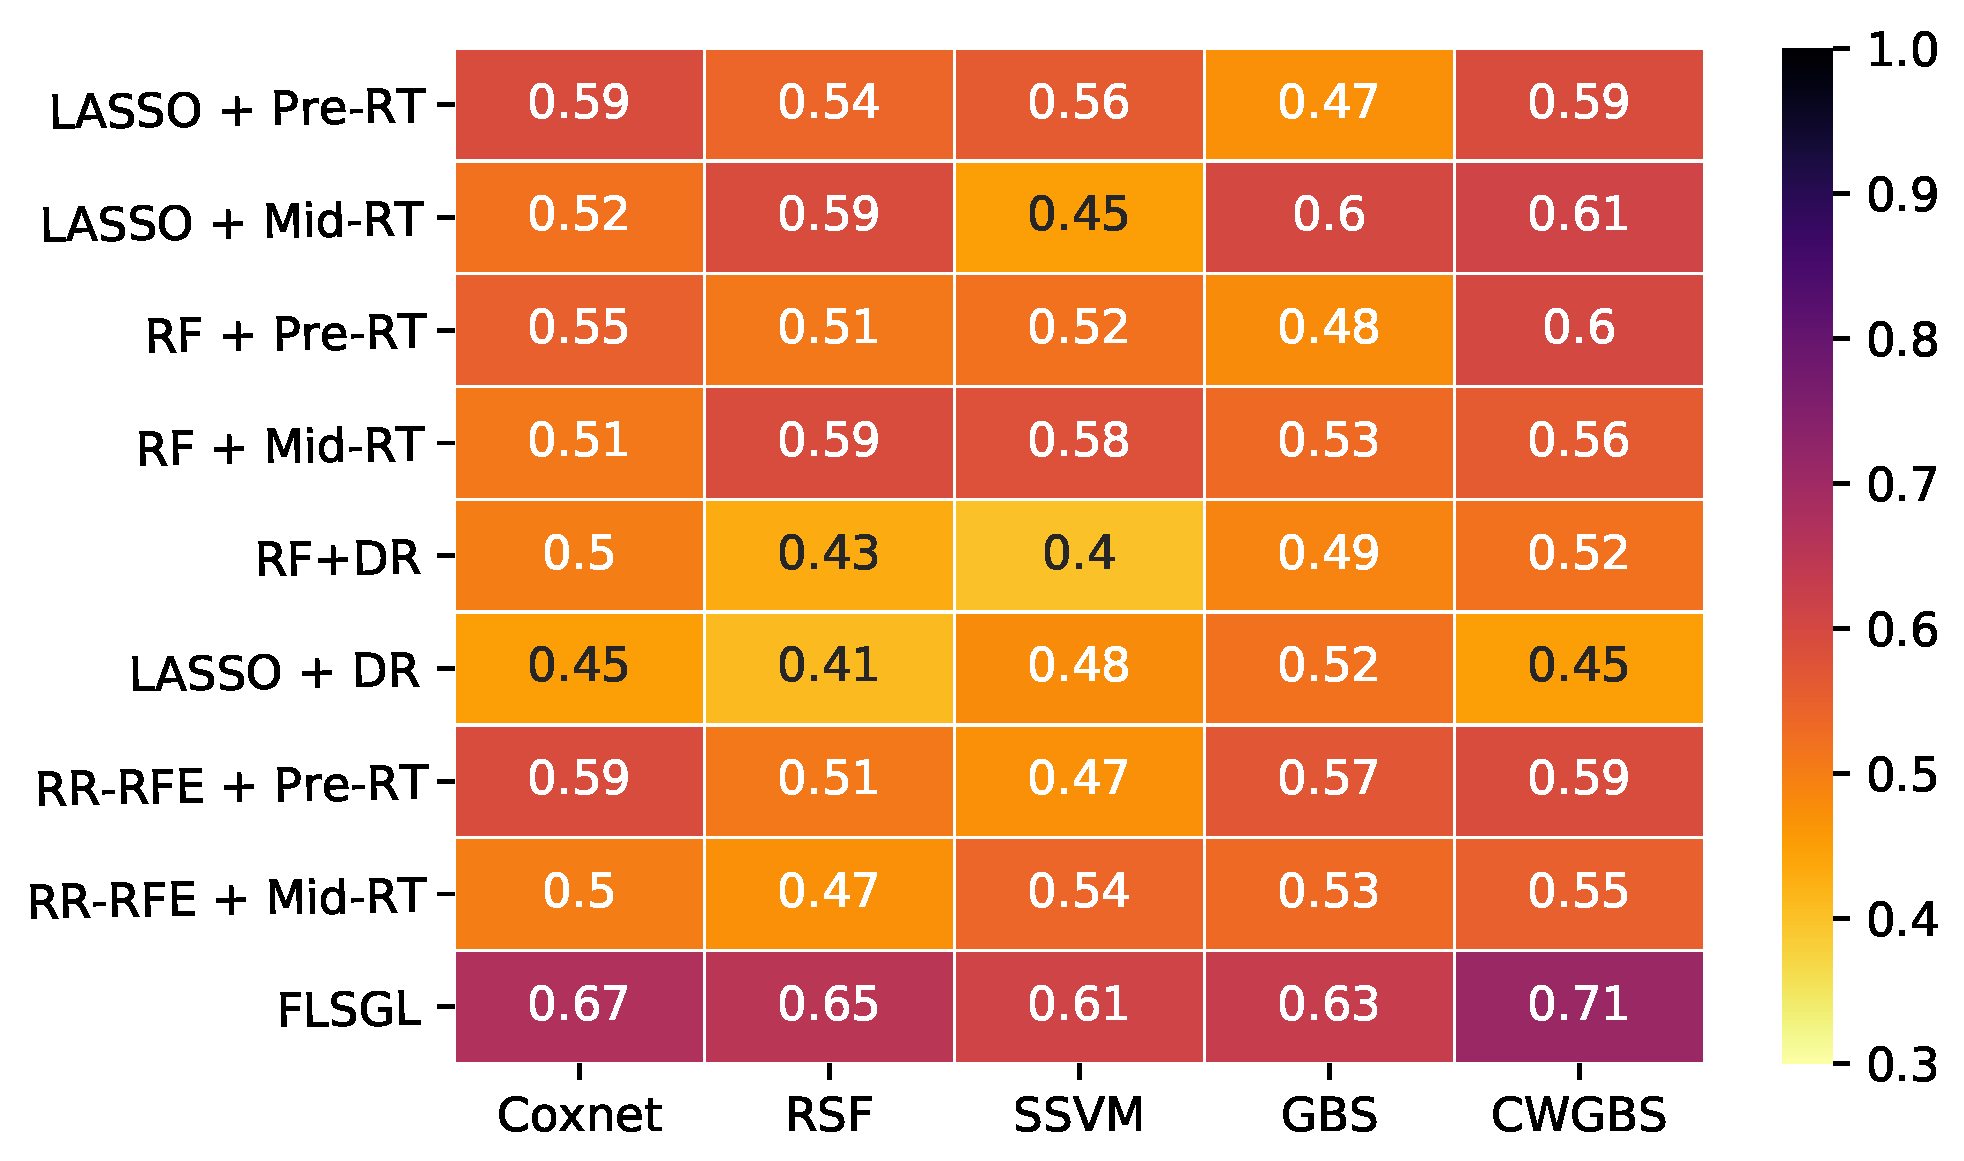
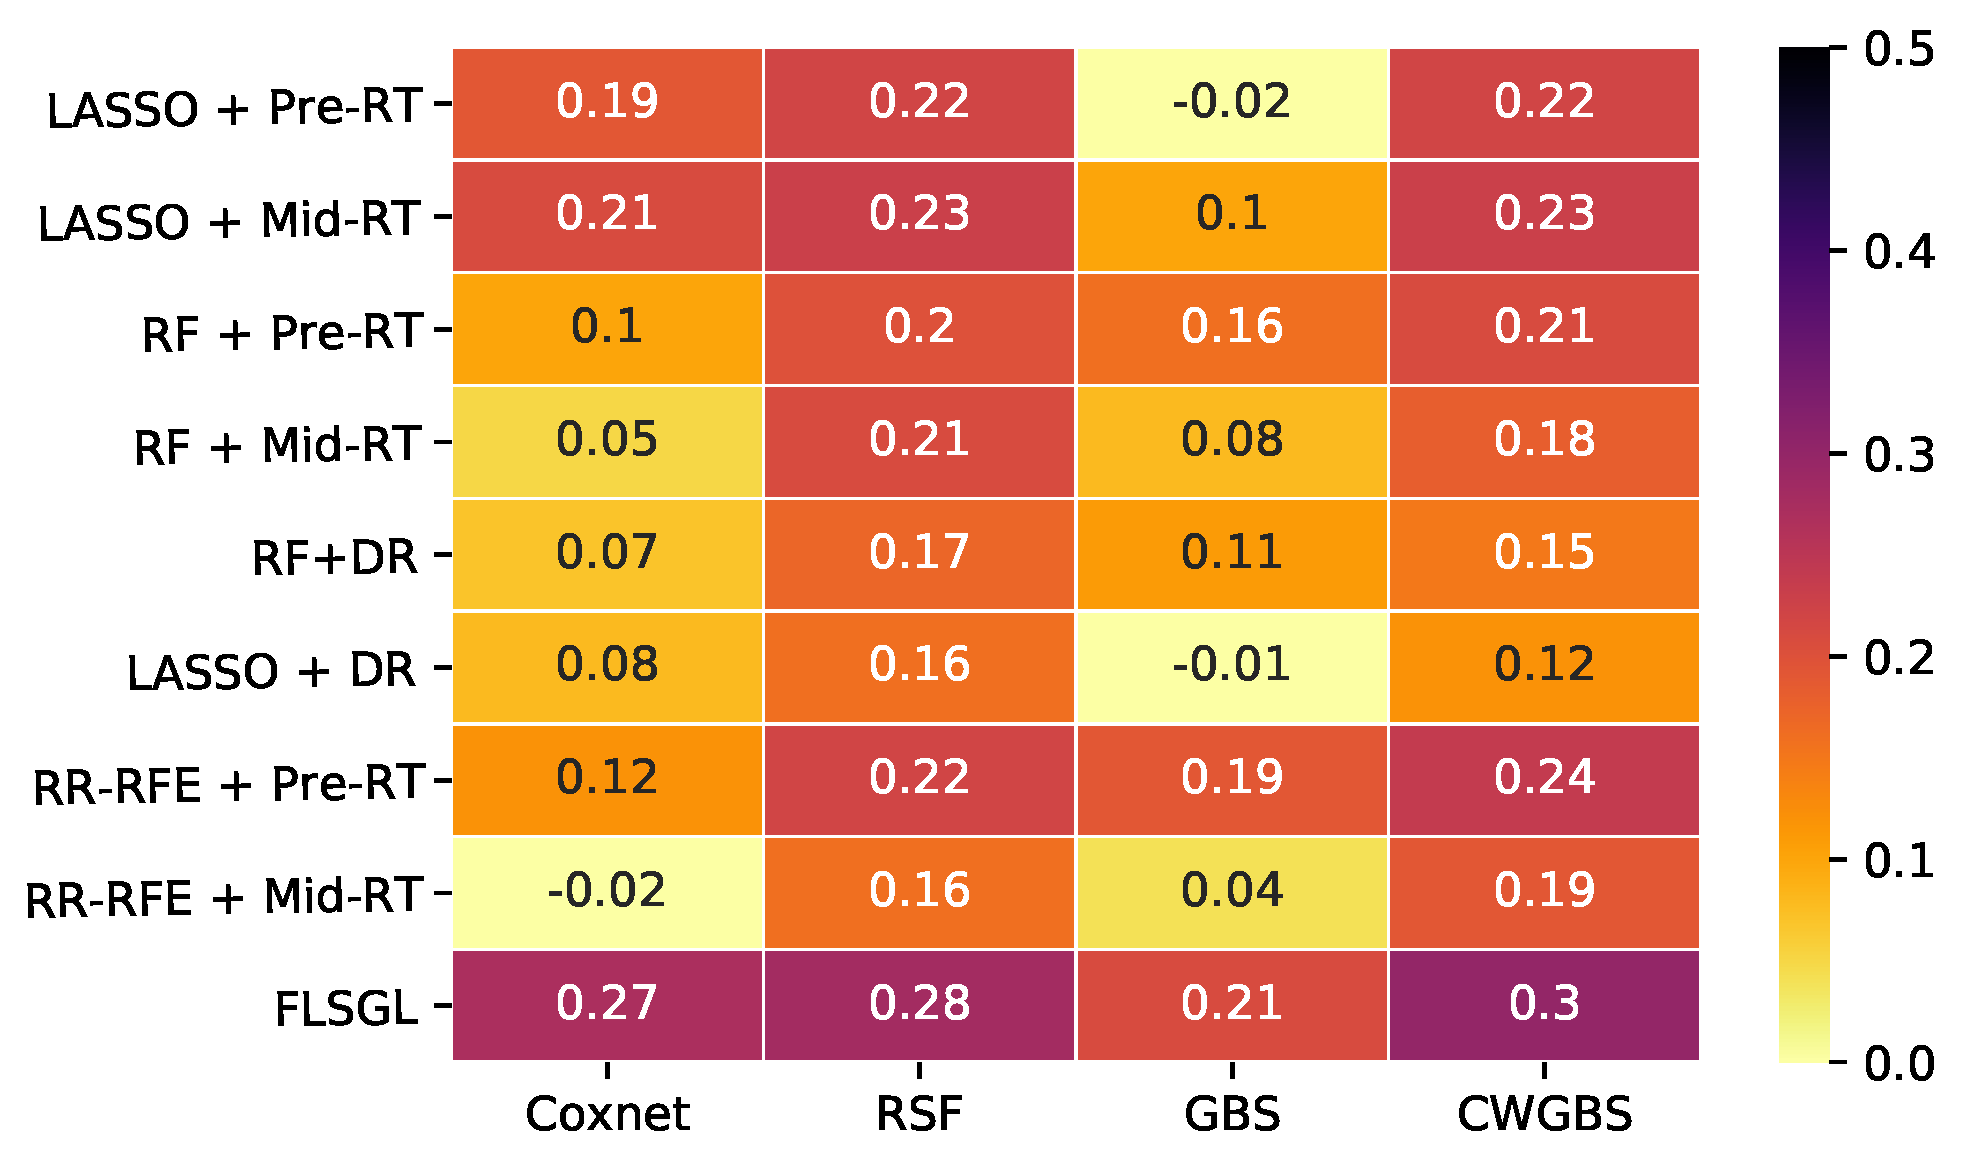
| Feature Selection | Survival Analysis | Time Points | No. of Features | C-Index (95% Confidence Interval) | IPA (%) |
|---|---|---|---|---|---|
| LASSO | CWGBS | Pre-RT | 3–7 | 0.59 (0.55–0.66) | 22 |
| LASSO+DR | CWGBS | pre-/mid-RT | 1–6 | 0.45 (0.40–0.51) | 12 |
| RF+DR | CWGBS | pre-/mid-RT | 2–10 | 0.52 (0.48–0.58) | 15 |
| RR-RFE | CWGBS | Pre-RT | 2–7 | 0.54 (0.51–0.60) | 24 |
| RF | CWGBS | Pre-RT | 3–12 | 0.61 (0.55–0.66) | 21 |
| FLSGL | RSF | pre-/mid-RT | 1–5 | 0.65 (0.60–0.70) | 28 |
| FLSGL | Coxnet | pre-/mid-RT | 1–5 | 0.67 (0.63–0.72) | 27 |
| FLSGL | SSVM | pre-/mid-RT | 1–5 | 0.62 (0.59–0.69) | - * |
| FLSGL | GBS | pre-/mid-RT | 1–5 | 0.63 (0.58–0.68) | 21 |
| FLSGL | CWGBS | pre-/mid-RT | 1–5 | 0.71 (0.67–0.75) | 30 |
Publisher’s Note: MDPI stays neutral with regard to jurisdictional claims in published maps and institutional affiliations. |
© 2022 by the authors. Licensee MDPI, Basel, Switzerland. This article is an open access article distributed under the terms and conditions of the Creative Commons Attribution (CC BY) license (https://creativecommons.org/licenses/by/4.0/).
Share and Cite
Forouzannezhad, P.; Maes, D.; Hippe, D.S.; Thammasorn, P.; Iranzad, R.; Han, J.; Duan, C.; Liu, X.; Wang, S.; Chaovalitwongse, W.A.; et al. Multitask Learning Radiomics on Longitudinal Imaging to Predict Survival Outcomes following Risk-Adaptive Chemoradiation for Non-Small Cell Lung Cancer. Cancers 2022, 14, 1228. https://doi.org/10.3390/cancers14051228
Forouzannezhad P, Maes D, Hippe DS, Thammasorn P, Iranzad R, Han J, Duan C, Liu X, Wang S, Chaovalitwongse WA, et al. Multitask Learning Radiomics on Longitudinal Imaging to Predict Survival Outcomes following Risk-Adaptive Chemoradiation for Non-Small Cell Lung Cancer. Cancers. 2022; 14(5):1228. https://doi.org/10.3390/cancers14051228
Chicago/Turabian StyleForouzannezhad, Parisa, Dominic Maes, Daniel S. Hippe, Phawis Thammasorn, Reza Iranzad, Jie Han, Chunyan Duan, Xiao Liu, Shouyi Wang, W. Art Chaovalitwongse, and et al. 2022. "Multitask Learning Radiomics on Longitudinal Imaging to Predict Survival Outcomes following Risk-Adaptive Chemoradiation for Non-Small Cell Lung Cancer" Cancers 14, no. 5: 1228. https://doi.org/10.3390/cancers14051228